Here - Stuff
Here - Stuff Here - Stuff
Stress Control of an Evolving Strike-Slip FaultSystem during the 2010–2011 Canterbury, NewZealand, Earthquake SequenceRichard Sibson, Francesca Ghisetti, and John RistauRichard Sibson, 1 Francesca Ghisetti, 2 and John Ristau 3INTRODUCTIONLarge earthquakes within seismogenic crust are generallythought to require the pre-existence of large fault structures.Such fault structures appear to evolve by the progressivegrowth and amalgamation of smaller faults and fractures(Cowie and Scholz 1992). In the course of their evolution somecomponents of an evolving fault system may be inherited fromprevious tectonic episodes while others may be newly formedin the prevailing tectonic stress field. With increasing displacementand amalgamation of sub-structures, fault structurestend to become “smoother,” less complex, and perhaps weaker(Wesnousky 1988).The 2010–2011 Canterbury earthquake sequenceoccurred within the upper crust of the South Island of NewZealand around 100 km southeast from the fast-moving (20–30 mm/yr) Alpine and Hope fault strike-slip components ofthe Pacific-Australia transform fault system linking into thesouthern Hikurangi Margin subduction zone (Figure 1). Asof 15 July 2011, the sequence has included three major shocks:the M w 7.1 Darfield earthquake (3 September 2010 UTC) followedby an M w 6.2 event on 21 February 2011 UTC and an M w6.0 event on 13 June 2011 UTC, along with a rich aftershocksequence that includes 27 shocks with M w > 5.0. Rupturingoccurred on previously unrecognized faults that appear to becomponents of a highly segmented E-W structure concealedbeneath alluvial cover and/or Neogene volcanics. Some subsurfaceinformation is, however, available from seismic reflectionlines and gravity surveys (e.g., Field et al. 1989).Here we seek to demonstrate how this complex sequencehas likely arisen through reactivation under the contemporarytectonic stress field of a mixture of comparatively newly formedand older inherited fault structures.1. Department of Geology, University of Otago, P.O. Box 56, Dunedin9054, New Zealand2. Terrageologica, 129 Takamatua Bay Rd., RD1, Akaroa 7581, NewZealand3. GNS Science, Te Pu Ao, P.O. Box 30-368, Lower Hutt, New ZealandTECTONIC/GEOLOGIC SETTINGThe 2010–2011 Canterbury earthquakes occurred within30 ± 5 km thick continental crust belonging to the buoyantChatham Rise plateau contained within the Pacific plate(Eberhart-Phillips and Bannister 2002). Local geology (Figure2) comprises a basement of highly deformed Mesozoic Torlessemetagraywackes and their metamorphosed equivalents atgreater depth, unconformably overlain by a Late Cretaceous–Neogene cover sequence up to 2.5 km thick (Forsyth et al.2008). Polyphase deformation within this basement assemblageincludes accretion, folding and thrusting along the Gondwanamargin, extensional fault structures from Late Cretaceous riftingof the Zealandia microcontinent, and Neogene transpressionacross the Alpine fault system.The cover sequence consists of Late Cretaceous–Paleogeneterrestrial-marine sedimentary units (including varyingthicknesses of Late Cretaceous Mt. Somers calc-alkaline volcanicsand Eocene basalts) overlain by a regressive Miocene-Pliocene clastic sequence that contains the predominantlybasaltic Late Miocene (11–6 Ma) Banks Peninsula volcanics.Thickness variations are partly attributable to deposition asa Late Cretaceous–Paleocene syn-rift sequence accompanyingextensional rifting along the Gondwana margin, whichimposed an extensive fault fabric within the basement (Lairdand Bradshaw 2004). Neogene shortening has led to varyingreactivation of these inherited fault systems. Over the area ofthe Canterbury Plains the older units are largely obscured byPliocene and Quaternary alluvial gravels up to a few hundredmeters thick (Forsyth et al. 2008).CONTEMPORARY STRESS FIELDAvailable evidence on the contemporary regional stress fieldin the central South island (Sibson et al., forthcoming) comesfrom two principal sources summarized in Table 1: 1) stressinversions from earthquake focal mechanisms together withone breakout determination from the Galleon-1 borehole;and 2) axes of maximum contractional strain-rate derived824 Seismological Research Letters Volume 82, Number 6 November/December 2011 doi: 10.1785/gssrl.82.6.824
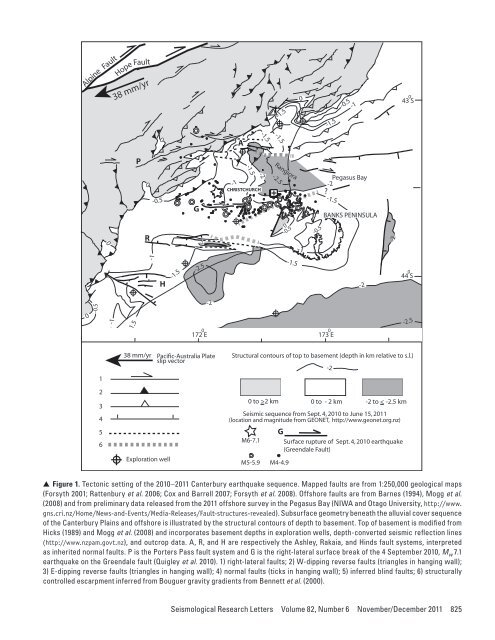
AlpineFaultHope Fault38 mm/yr0+ +-1.5-1.5-1-0.543 0SP0A+-1.5-1.50-1-0.50-1-1.5+0R-1-0.5H-1.5+G-2-2.5-2-1-2CHRISTCHURCH+-1.5Rangiora-2.5+0-0.5-1.5-1-0.5?-2-1.5172 0 E173 0EPegasus BayBANKS PENINSULA-2-244 0S-2.512345638 mm/yr Pacific-Australia Plateslip vectorStructural contours of top to basement (depth in km relative to s.l.)Seismic sequence from Sept. 4, 2010 to June 15, 2011(location and magnitude from GEONET, http://www.geonet.org.nz)GM6-7.1 Surface rupture of Sept. 4, 2010 earthquake+(Greendale Fault)Exploration wellM5-5.9 M4-4.9-20 to >2 km 0 to - 2 km -2 to < -2.5 km▲ ▲ Figure 1. Tectonic setting of the 2010–2011 Canterbury earthquake sequence. Mapped faults are from 1:250,000 geological maps(Forsyth 2001; Rattenbury et al. 2006; Cox and Barrell 2007; Forsyth et al. 2008). Offshore faults are from Barnes (1994), Mogg et al.(2008) and from preliminary data released from the 2011 offshore survey in the Pegasus Bay (NIWA and Otago University, http://www.gns.cri.nz/Home/News-and-Events/Media-Releases/Fault-structures-revealed). Subsurface geometry beneath the alluvial cover sequenceof the Canterbury Plains and offshore is illustrated by the structural contours of depth to basement. Top of basement is modified fromHicks (1989) and Mogg et al. (2008) and incorporates basement depths in exploration wells, depth-converted seismic reflection lines(http://www.nzpam.govt.nz), and outcrop data. A, R, and H are respectively the Ashley, Rakaia, and Hinds fault systems, interpretedas inherited normal faults. P is the Porters Pass fault system and G is the right-lateral surface break of the 4 September 2010, M w 7.1earthquake on the Greendale fault (Quigley et al. 2010). 1) right-lateral faults; 2) W-dipping reverse faults (triangles in hanging wall);3) E-dipping reverse faults (triangles in hanging wall); 4) normal faults (ticks in hanging wall); 5) inferred blind faults; 6) structurallycontrolled escarpment inferred from Bouguer gravity gradients from Bennett et al. (2000).Seismological Research Letters Volume 82, Number 6 November/December 2011 825
- Page 20 and 21: ▲▲Figure 7. As in Figure 6 but
- Page 22 and 23: ▲ ▲ Figure 8. Misfit parameters
- Page 24 and 25: ▲ ▲ Figure 10. Spatial variabil
- Page 26 and 27: ▲ ▲ Figure 12. Standard spectra
- Page 28 and 29: Quigley, M., R. Van Dissen, P. Vill
- Page 30 and 31: slip on a 59-degree striking fault
- Page 32 and 33: ▲▲Figure 4. Convergence of inve
- Page 34 and 35: observations and other source studi
- Page 36 and 37: -42. 5-43. 0-43. 5-44. 0-44. 5-43.2
- Page 38 and 39: “Product CSK © ASI, (ItalianSpac
- Page 40 and 41: TABLE 2Solutions for fault location
- Page 42 and 43: -43.45(A)degrees N-43.50-43.552.52.
- Page 44 and 45: is still a good fit to the horizont
- Page 46 and 47: Coulomb Stress Change Sensitivity d
- Page 48 and 49: mation takes on a larger strike-sli
- Page 50 and 51: P 9.4267BLDU45P 20.1213CASY39P 2.62
- Page 52 and 53: ERMJNUMAJOINUJHJ2CBIJMIDWJOWYHNBTPU
- Page 54 and 55: (A)6.146.13(B)6.246.36Misfit6.156.1
- Page 56 and 57: (A)(B)(C)(D)▲▲Figure 10. The co
- Page 58 and 59: (A)(B)(C)(D)▲▲Figure 12. The co
- Page 60 and 61: Luo, Y., Y. Tan, S. Wei, D. Helmber
- Page 62 and 63: −44˚00' −43˚00'4-Sep-2010Mw 7
- Page 64 and 65: TABLE 1Pairs of SAR imagery used in
- Page 67 and 68: Depth (km)Coulomb Stress Change(bar
- Page 69: Crippen, R. E. (1992). Measurement
- Page 73 and 74: σ 1dσ 3Nuσ 3CM w 7.1dw 6.2u70°M
- Page 75 and 76: Right-lateral Faults(A) Range Front
- Page 77 and 78: DISCUSSIONThe 2010-2011 Canterbury
- Page 79 and 80: Large Apparent Stresses from the Ca
- Page 81 and 82: ▲ ▲ Figure 2. Observed vs. pred
- Page 83 and 84: 10Obs SA(1s)AS1AS+SDAB 2006AB+SDSA(
- Page 85 and 86: Fine-scale Relocation of Aftershock
- Page 87 and 88: −43.25°OXZ0 10 20km−43.5°−4
- Page 89 and 90: A’0 km 4 8−43.5°B’B−43.6°
- Page 91 and 92: REFERENCESAvery, H. R., J. B. Berri
- Page 93 and 94: ▲ ▲ Figure 2. A) shows three-co
- Page 95 and 96: ▲ ▲ Figure 4. Vertical accelera
- Page 97 and 98: 0.8PRPC Z0.40Normalized (Max PGA +
- Page 99 and 100: Near-source Strong Ground MotionsOb
- Page 101 and 102: (A)Magnitude, M w876542009 NZdataba
- Page 103 and 104: Scale0.5 g5 seconds▲▲Figure 4.
- Page 105 and 106: (A)(B)Spectral Acc, Sa (g)North/Wes
- Page 107 and 108: Vertical-to-horizontal PGA ratio543
- Page 109 and 110: (A)(B)Station:CCCCSolid:AvgHorizDas
- Page 111 and 112: REFERENCESAagaard, B. T., J. F. Hal
- Page 113 and 114: ▲ ▲ Figure 1. Shear-wave veloci
- Page 115 and 116: Spectral Acceleration (0.3 s), (g)I
- Page 117 and 118: Spectral Acceleration (3 s), (g)In[
- Page 119 and 120: TABLE 1Mean (μ LLH ) and standard
AlpineFaultHope Fault38 mm/yr0+ +-1.5-1.5-1-0.543 0SP0A+-1.5-1.50-1-0.50-1-1.5+0R-1-0.5H-1.5+G-2-2.5-2-1-2CHRISTCHURCH+-1.5Rangiora-2.5+0-0.5-1.5-1-0.5?-2-1.5172 0 E173 0EPegasus BayBANKS PENINSULA-2-244 0S-2.512345638 mm/yr Pacific-Australia Plateslip vectorStructural contours of top to basement (depth in km relative to s.l.)Seismic sequence from Sept. 4, 2010 to June 15, 2011(location and magnitude from GEONET, http://www.geonet.org.nz)GM6-7.1 Surface rupture of Sept. 4, 2010 earthquake+(Greendale Fault)Exploration wellM5-5.9 M4-4.9-20 to >2 km 0 to - 2 km -2 to < -2.5 km▲ ▲ Figure 1. Tectonic setting of the 2010–2011 Canterbury earthquake sequence. Mapped faults are from 1:250,000 geological maps(Forsyth 2001; Rattenbury et al. 2006; Cox and Barrell 2007; Forsyth et al. 2008). Offshore faults are from Barnes (1994), Mogg et al.(2008) and from preliminary data released from the 2011 offshore survey in the Pegasus Bay (NIWA and Otago University, http://www.gns.cri.nz/Home/News-and-Events/Media-Releases/Fault-structures-revealed). Subsurface geometry beneath the alluvial cover sequenceof the Canterbury Plains and offshore is illustrated by the structural contours of depth to basement. Top of basement is modified fromHicks (1989) and Mogg et al. (2008) and incorporates basement depths in exploration wells, depth-converted seismic reflection lines(http://www.nzpam.govt.nz), and outcrop data. A, R, and H are respectively the Ashley, Rakaia, and Hinds fault systems, interpretedas inherited normal faults. P is the Porters Pass fault system and G is the right-lateral surface break of the 4 September 2010, M w 7.1earthquake on the Greendale fault (Quigley et al. 2010). 1) right-lateral faults; 2) W-dipping reverse faults (triangles in hanging wall);3) E-dipping reverse faults (triangles in hanging wall); 4) normal faults (ticks in hanging wall); 5) inferred blind faults; 6) structurallycontrolled escarpment inferred from Bouguer gravity gradients from Bennett et al. (2000).Seismological Research Letters Volume 82, Number 6 November/December 2011 825


