Here - Stuff
Here - Stuff Here - Stuff
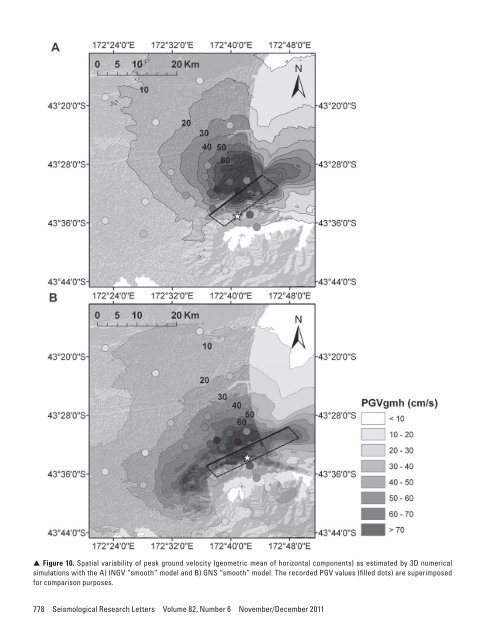
▲ ▲ Figure 10. Spatial variability of peak ground velocity (geometric mean of horizontal components) as estimated by 3D numericalsimulations with the A) INGV “smooth” model and B) GNS “smooth” model. The recorded PGV values (filled dots) are superimposedfor comparison purposes.778 Seismological Research Letters Volume 82, Number 6 November/December 2011
▲ ▲ Figure 11. Snapshots (t = 7, 9, 11, and 13 s, from top to bottom) of the simulated fault normal velocity wavefield with the A) INGV“smooth” model and B) GNS “smooth” model.Seismological Research Letters Volume 82, Number 6 November/December 2011 779
- Page 1: Volume 82, Number 6 November/Decemb
- Page 7: News and Notes (continued)Nominatio
- Page 11: Preface to the Focused Issue on the
- Page 14 and 15: TABLE 1Peak ground acceleration (PG
- Page 16 and 17: ▲▲Figure 2. A) Sketch of the
- Page 18 and 19: ▲▲Figure 4. A) Adopted moment r
- Page 20 and 21: ▲▲Figure 7. As in Figure 6 but
- Page 22 and 23: ▲ ▲ Figure 8. Misfit parameters
- Page 26 and 27: ▲ ▲ Figure 12. Standard spectra
- Page 28 and 29: Quigley, M., R. Van Dissen, P. Vill
- Page 30 and 31: slip on a 59-degree striking fault
- Page 32 and 33: ▲▲Figure 4. Convergence of inve
- Page 34 and 35: observations and other source studi
- Page 36 and 37: -42. 5-43. 0-43. 5-44. 0-44. 5-43.2
- Page 38 and 39: “Product CSK © ASI, (ItalianSpac
- Page 40 and 41: TABLE 2Solutions for fault location
- Page 42 and 43: -43.45(A)degrees N-43.50-43.552.52.
- Page 44 and 45: is still a good fit to the horizont
- Page 46 and 47: Coulomb Stress Change Sensitivity d
- Page 48 and 49: mation takes on a larger strike-sli
- Page 50 and 51: P 9.4267BLDU45P 20.1213CASY39P 2.62
- Page 52 and 53: ERMJNUMAJOINUJHJ2CBIJMIDWJOWYHNBTPU
- Page 54 and 55: (A)6.146.13(B)6.246.36Misfit6.156.1
- Page 56 and 57: (A)(B)(C)(D)▲▲Figure 10. The co
- Page 58 and 59: (A)(B)(C)(D)▲▲Figure 12. The co
- Page 60 and 61: Luo, Y., Y. Tan, S. Wei, D. Helmber
- Page 62 and 63: −44˚00' −43˚00'4-Sep-2010Mw 7
- Page 64 and 65: TABLE 1Pairs of SAR imagery used in
- Page 67 and 68: Depth (km)Coulomb Stress Change(bar
- Page 69 and 70: Crippen, R. E. (1992). Measurement
- Page 71 and 72: AlpineFaultHope Fault38 mm/yr0+ +-1
- Page 73 and 74: σ 1dσ 3Nuσ 3CM w 7.1dw 6.2u70°M
▲ ▲ Figure 10. Spatial variability of peak ground velocity (geometric mean of horizontal components) as estimated by 3D numericalsimulations with the A) INGV “smooth” model and B) GNS “smooth” model. The recorded PGV values (filled dots) are superimposedfor comparison purposes.778 Seismological Research Letters Volume 82, Number 6 November/December 2011


