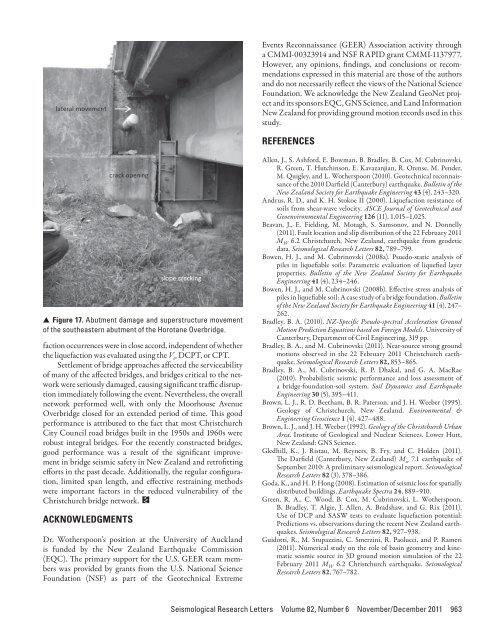
(A)(B)(C)▲▲Figure 15. Bridges with damage not associated with liquefaction: A) Moorhouse Avenue, B) Port Hills, C) Horotane.east direction (Figure 2). Shown in Figure 15C, the bridge is adual three-span reinforced concrete bridge supported by singlepier bents. The end spans are supported by seat-type abutments,with the structure spanning between two large builtupembankments approximately 9 m high. The embankmentslopes beneath the abutments and parallel to the roadway havean angle of about 33° relative to the horizontal (i.e., 1.5H:1Vslope). This bridge is ~200 m from the Port Hills Overbridge,and had also been recently retrofitted using a similar approach,with abutment seat extensions and linkages between the bridgeelements.This bridge did not suffer any damage during the Darfieldearthquake. During the Christchurch earthquake, the retrofitmethod appeared to have worked well in terms of protectingthe structure. The ties between spans and at the abutmentselongated and pulled out, as they had in the Port HillsOverbridge. Additionally, 60% of the bolts that attached thesoffit of the precast concrete beams to the abutment seat extensionhad sheared off.The northwest abutment back-rotated 1° and a transversecrack developed at the top of the northwest slope near theconcrete abutment; however, this was not continuous acrossthe slope. The southeast abutment back-rotated by 3.4°and atransverse crack developed at the bottom of the slope on thenortheast side. A significant transverse crack 10 cm wide and60 cm deep opened up at the top of the southeast slope and wascontinuous across the width of the bridge. A transverse scarpalso developed near the toe of the 13-m-long slope, extendingbetween the southern piers of the two bridges, suggesting thata slope failure had been initiated in the embankment fill butdid not become unstable. Movement was also evident perpendicularto the bridge axis, with cracking in the slope extendingthrough the abutment, resulting in wide cracking and lateralmovement of the abutment and superstructure (Figure 17).CONCLUSIONS▲▲Figure 16. Moorhouse Avenue Overbridge pier flexural bucklingfailure.Overall, the bridges in Christchurch and the Canterburyregion performed well during the Darfield and Christchurchearthquakes, given the magnitude of the observed groundmotions. Of those bridges that were damaged, the majoritywere as a result of liquefaction-induced lateral spreading, withonly four bridges suffering damage not related to liquefactioneffects. Even though the larger-magnitude Darfield eventaffected a much wider region, the location of the Christchurchevent resulted in more significant damage due to the intensityof shaking in a region of the city with many bridges and highliquefaction susceptibility.As a result of the significant lateral spreading, the mostaffected components of the bridges were the approaches, abutments,piers, and foundation system. Bridges were able to resistthe inertial forces due to shaking, while the compressive lateralspreading forces resulted in abutment rotation and foundationdamage. For almost all cases the predicted and observed lique-962 Seismological Research Letters Volume 82, Number 6 November/December 2011
Events Reconnaissance (GEER) Association activity througha CMMI-00323914 and NSF RAPID grant CMMI-1137977.However, any opinions, findings, and conclusions or recommendationsexpressed in this material are those of the authorsand do not necessarily reflect the views of the National ScienceFoundation. We acknowledge the New Zealand GeoNet projectand its sponsors EQC, GNS Science, and Land InformationNew Zealand for providing ground motion records used in thisstudy.REFERENCES▲ ▲ Figure 17. Abutment damage and superstructure movementof the southeastern abutment of the Horotane Overbridge.faction occurrences were in close accord, independent of whetherthe liquefaction was evaluated using the V s , DCPT, or CPT.Settlement of bridge approaches affected the serviceabilityof many of the affected bridges, and bridges critical to the networkwere seriously damaged, causing significant traffic disruptionimmediately following the event. Nevertheless, the overallnetwork performed well, with only the Moorhouse AvenueOverbridge closed for an extended period of time. This goodperformance is attributed to the fact that most ChristchurchCity Council road bridges built in the 1950s and 1960s wererobust integral bridges. For the recently constructed bridges,good performance was a result of the significant improvementin bridge seismic safety in New Zealand and retrofittingefforts in the past decade. Additionally, the regular configuration,limited span length, and effective restraining methodswere important factors in the reduced vulnerability of theChristchurch bridge network.ACKNOWLEDGMENTSDr. Wotherspoon’s position at the University of Aucklandis funded by the New Zealand Earthquake Commission(EQC). The primary support for the U.S. GEER team memberswas provided by grants from the U.S. National ScienceFoundation (NSF) as part of the Geotechnical ExtremeAllen, J., S. Ashford, E. Bowman, B. Bradley, B. Cox, M. Cubrinovski,R. Green, T. Hutchinson, E. Kavazanjian, R. Orense, M. Pender,M. Quigley, and L. Wotherspoon (2010). Geotechnical reconnaissanceof the 2010 Darfield (Canterbury) earthquake. Bulletin of theNew Zealand Society for Earthquake Engineering 43 (4), 243–320.Andrus, R. D., and K. H. Stokoe II (2000). Liquefaction resistance ofsoils from shear-wave velocity. ASCE Journal of Geotechnical andGeoenvironmental Engineering 126 (11), 1,015–1,025.Beavan, J., E. Fielding, M. Motagh, S. Samsonov, and N. Donnelly(2011). Fault location and slip distribution of the 22 February 2011M W 6.2 Christchurch, New Zealand, earthquake from geodeticdata. Seismological Research Letters 82, 789–799.Bowen, H. J., and M. Cubrinovski (2008a). Psuedo-static analysis ofpiles in liquefiable soils: Parametric evaluation of liquefied layerproperties. Bulletin of the New Zealand Society for EarthquakeEngineering 41 (4), 234–246.Bowen, H. J., and M. Cubrinovski (2008b). Effective stress analysis ofpiles in liquefiable soil: A case study of a bridge foundation. Bulletinof the New Zealand Society for Earthquake Engineering 41 (4), 247–262.Bradley, B. A. (2010). NZ-Specific Pseudo-spectral Acceleration GroundMotion Prediction Equations based on Foreign Models. University ofCanterbury, Department of Civil Engineering, 319 pp.Bradley, B. A., and M. Cubrinovski (2011). Near-source strong groundmotions observed in the 22 February 2011 Christchurch earthquake.Seismological Research Letters 82, 853–865.Bradley, B. A., M. Cubrinovski, R. P. Dhakal, and G. A. MacRae(2010). Probabilistic seismic performance and loss assessment ofa bridge-foundation-soil system. Soil Dynamics and EarthquakeEngineering 30 (5), 395–411.Brown, L. J., R. D. Beetham, B. R. Paterson, and J. H. Weeber (1995).Geology of Christchurch, New Zealand. Environmental &Engineering Geoscience 1 (4), 427–488.Brown, L. J., and J. H. Weeber (1992). Geology of the Christchurch UrbanArea. Institute of Geological and Nuclear Sciences. Lower Hutt,New Zealand: GNS Science.Gledhill, K., J. Ristau, M. Reyners, B. Fry, and C. Holden (2011).The Darfield (Canterbury, New Zealand) M w 7.1 earthquake ofSeptember 2010: A preliminary seismological report. SeismologicalResearch Letters 82 (3), 378–386.Goda, K., and H. P. Hong (2008). Estimation of seismic loss for spatiallydistributed buildings. Earthquake Spectra 24, 889–910.Green, R. A., C. Wood, B. Cox, M. Cubrinovski, L. Wotherspoon,B. Bradley, T. Algie, J. Allen, A. Bradshaw, and G. Rix (2011).Use of DCP and SASW tests to evaluate liquefaction potential:Predictions vs. observations during the recent New Zealand earthquakes.Seismological Research Letters 82, 927–938.Guidotti, R., M. Stupazzini, C. Smerzini, R. Paolucci, and P. Rameri(2011). Numerical study on the role of basin geometry and kinematicseismic source in 3D ground motion simulation of the 22February 2011 M W 6.2 Christchurch earthquake. SeismologicalResearch Letters 82, 767–782.Seismological Research Letters Volume 82, Number 6 November/December 2011 963
- Page 1:
Volume 82, Number 6 November/Decemb
- Page 7:
News and Notes (continued)Nominatio
- Page 11:
Preface to the Focused Issue on the
- Page 14 and 15:
TABLE 1Peak ground acceleration (PG
- Page 16 and 17:
▲▲Figure 2. A) Sketch of the
- Page 18 and 19:
▲▲Figure 4. A) Adopted moment r
- Page 20 and 21:
▲▲Figure 7. As in Figure 6 but
- Page 22 and 23:
▲ ▲ Figure 8. Misfit parameters
- Page 24 and 25:
▲ ▲ Figure 10. Spatial variabil
- Page 26 and 27:
▲ ▲ Figure 12. Standard spectra
- Page 28 and 29:
Quigley, M., R. Van Dissen, P. Vill
- Page 30 and 31:
slip on a 59-degree striking fault
- Page 32 and 33:
▲▲Figure 4. Convergence of inve
- Page 34 and 35:
observations and other source studi
- Page 36 and 37:
-42. 5-43. 0-43. 5-44. 0-44. 5-43.2
- Page 38 and 39:
“Product CSK © ASI, (ItalianSpac
- Page 40 and 41:
TABLE 2Solutions for fault location
- Page 42 and 43:
-43.45(A)degrees N-43.50-43.552.52.
- Page 44 and 45:
is still a good fit to the horizont
- Page 46 and 47:
Coulomb Stress Change Sensitivity d
- Page 48 and 49:
mation takes on a larger strike-sli
- Page 50 and 51:
P 9.4267BLDU45P 20.1213CASY39P 2.62
- Page 52 and 53:
ERMJNUMAJOINUJHJ2CBIJMIDWJOWYHNBTPU
- Page 54 and 55:
(A)6.146.13(B)6.246.36Misfit6.156.1
- Page 56 and 57:
(A)(B)(C)(D)▲▲Figure 10. The co
- Page 58 and 59:
(A)(B)(C)(D)▲▲Figure 12. The co
- Page 60 and 61:
Luo, Y., Y. Tan, S. Wei, D. Helmber
- Page 62 and 63:
−44˚00' −43˚00'4-Sep-2010Mw 7
- Page 64 and 65:
TABLE 1Pairs of SAR imagery used in
- Page 67 and 68:
Depth (km)Coulomb Stress Change(bar
- Page 69 and 70:
Crippen, R. E. (1992). Measurement
- Page 71 and 72:
AlpineFaultHope Fault38 mm/yr0+ +-1
- Page 73 and 74:
σ 1dσ 3Nuσ 3CM w 7.1dw 6.2u70°M
- Page 75 and 76:
Right-lateral Faults(A) Range Front
- Page 77 and 78:
DISCUSSIONThe 2010-2011 Canterbury
- Page 79 and 80:
Large Apparent Stresses from the Ca
- Page 81 and 82:
▲ ▲ Figure 2. Observed vs. pred
- Page 83 and 84:
10Obs SA(1s)AS1AS+SDAB 2006AB+SDSA(
- Page 85 and 86:
Fine-scale Relocation of Aftershock
- Page 87 and 88:
−43.25°OXZ0 10 20km−43.5°−4
- Page 89 and 90:
A’0 km 4 8−43.5°B’B−43.6°
- Page 91 and 92:
REFERENCESAvery, H. R., J. B. Berri
- Page 93 and 94:
▲ ▲ Figure 2. A) shows three-co
- Page 95 and 96:
▲ ▲ Figure 4. Vertical accelera
- Page 97 and 98:
0.8PRPC Z0.40Normalized (Max PGA +
- Page 99 and 100:
Near-source Strong Ground MotionsOb
- Page 101 and 102:
(A)Magnitude, M w876542009 NZdataba
- Page 103 and 104:
Scale0.5 g5 seconds▲▲Figure 4.
- Page 105 and 106:
(A)(B)Spectral Acc, Sa (g)North/Wes
- Page 107 and 108:
Vertical-to-horizontal PGA ratio543
- Page 109 and 110:
(A)(B)Station:CCCCSolid:AvgHorizDas
- Page 111 and 112:
REFERENCESAagaard, B. T., J. F. Hal
- Page 113 and 114:
▲ ▲ Figure 1. Shear-wave veloci
- Page 115 and 116:
Spectral Acceleration (0.3 s), (g)I
- Page 117 and 118:
Spectral Acceleration (3 s), (g)In[
- Page 119 and 120:
TABLE 1Mean (μ LLH ) and standard
- Page 121 and 122:
Strong Ground Motions and Damage Co
- Page 123 and 124:
ings and the Modified Takeda-Slip M
- Page 125 and 126:
high, but there were no buildings d
- Page 127 and 128:
REFERENCES▲▲Figure 8. Heavily d
- Page 129 and 130:
(A)(B)(C)(D)(E)▲▲Figure 1. A) M
- Page 131 and 132:
(A) (B) (C)▲ ▲ Figure 3. A) Typ
- Page 133 and 134:
(A) (B) (C)▲ ▲ Figure 4. A) Typ
- Page 135 and 136:
Case StudyKey ParametersTABLE 1Key
- Page 137 and 138:
▲ ▲ Figure 9. Representative bu
- Page 139 and 140:
Soil Liquefaction Effects in the Ce
- Page 141 and 142:
▲ ▲ Figure 2. Representative su
- Page 143 and 144:
Location of structures illustrated
- Page 145 and 146:
Shading indicates areaover which pr
- Page 147 and 148:
1.8 deg15 cmGround cracking due to
- Page 149 and 150:
30 cm17 cm30 cmFoundation beam▲
- Page 151 and 152:
Comparison of Liquefaction Features
- Page 153 and 154:
(A)(B)▲▲Figure 2. A) Simplified
- Page 155 and 156:
(A)Acceleration (Gal)6004002000-200
- Page 157 and 158: (A)(B)▲▲Figure 7. Distribution
- Page 159 and 160: (A)(B)▲▲Figure 10. Damage to a
- Page 161 and 162: (A)(B)▲ ▲ Figure 14. A) Subside
- Page 163 and 164: ▲▲Figure 17. A trench in a resi
- Page 165 and 166: Ambient Noise Measurements followin
- Page 167 and 168: ▲▲Figure 1. Location of the noi
- Page 169 and 170: ▲▲Figure 5. Site N20 showing HV
- Page 171 and 172: ▲▲Figure 8. Comparison between
- Page 173 and 174: Use of DCP and SASW Tests to Evalua
- Page 175 and 176: ▲ ▲ Figure 2. Aerial image of C
- Page 177 and 178: (A)(B)▲▲Figure 4. DCP test bein
- Page 179 and 180: ▲▲Figure 7. SASW setup at a sit
- Page 181 and 182: where X ~ N(μ X , σ X 2 ) is shor
- Page 183 and 184: Using the same critical layers as s
- Page 185 and 186: Performance of Levees (Stopbanks) d
- Page 187 and 188: ▲▲Figure 3. Typical geometry an
- Page 189 and 190: TABLE 1Damage severity categories (
- Page 191 and 192: (A)(B)▲▲Figure 6. A) Large sand
- Page 193 and 194: (A)(B)▲▲Figure 8. A) Representa
- Page 195 and 196: each of the Waimakariri River and a
- Page 197 and 198: ▲ ▲ Figure 2. Horizontal peak g
- Page 199 and 200: only minor damage, mostly to their
- Page 201 and 202: (A)(C)(B)▲▲Figure 5. Ferrymead
- Page 203 and 204: (A)(B)▲▲Figure 7. Damage to sou
- Page 205 and 206: (A)(B)▲▲Figure 11. Settlement o
- Page 207: (A)(C)(B)▲▲Figure 14. Railway B
- Page 211 and 212: New PublicationsCanGeoRefThe Americ
- Page 213 and 214: Wednesday, 18 AprilTechnical Sessio
- Page 215 and 216: Verification of a Spectral-Element
- Page 217 and 218: EASTERN SECTIONRESEARCH LETTERSReas
- Page 219 and 220: (A)70°N100°W 60°W70°N(B)100°E1
- Page 221 and 222: Mongolia SCRThe presence or absence
- Page 223 and 224: the small horizontal relative motio
- Page 225 and 226: 80°100°120°140°EXPLANATIONBorde
- Page 227 and 228: Chang, K. H. (1997). Korean peninsu
- Page 229 and 230: Wheeler, R. L. (2008). Paleoseismic
- Page 231 and 232: A significant outcome of this study
- Page 233 and 234: TABLE 1 (continued)Earthquakes for
- Page 235 and 236: ▲▲Figure 2. Earthquakes used in
- Page 237 and 238: Meeting CalendarM E E T I N GC A L
- Page 239 and 240: 201 Plaza Professional Bldg. • El
- Page 241 and 242: Seismological Research Letters (SRL
- Page 243 and 244: Christa von Hillebrandt-Andrade, Pr