

Here - Stuff
Here - Stuff
Here - Stuff

Create successful ePaper yourself
Turn your PDF publications into a flip-book with our unique Google optimized e-Paper software.
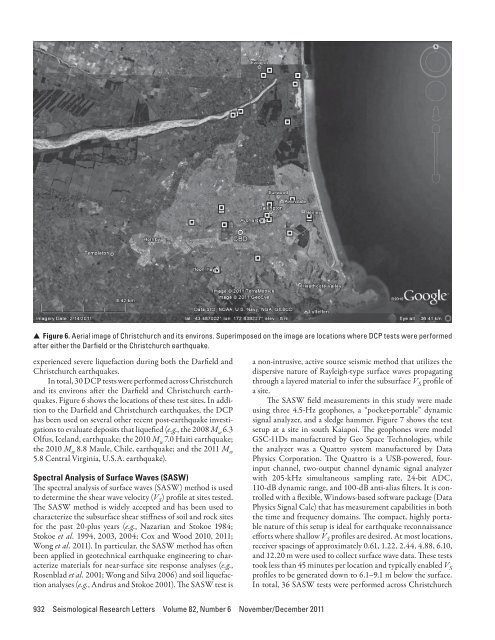
▲ ▲ Figure 6. Aerial image of Christchurch and its environs. Superimposed on the image are locations where DCP tests were performedafter either the Darfield or the Christchurch earthquake.experienced severe liquefaction during both the Darfield andChristchurch earthquakes.In total, 30 DCP tests were performed across Christchurchand its environs after the Darfield and Christchurch earthquakes.Figure 6 shows the locations of these test sites. In additionto the Darfield and Christchurch earthquakes, the DCPhas been used on several other recent post-earthquake investigationsto evaluate deposits that liquefied (e.g., the 2008 M w 6.3Olfus, Iceland, earthquake; the 2010 M w 7.0 Haiti earthquake;the 2010 M w 8.8 Maule, Chile, earthquake; and the 2011 M w5.8 Central Virginia, U.S.A. earthquake).Spectral Analysis of Surface Waves (SASW)The spectral analysis of surface waves (SASW) method is usedto determine the shear wave velocity (V S ) profile at sites tested.The SASW method is widely accepted and has been used tocharacterize the subsurface shear stiffness of soil and rock sitesfor the past 20-plus years (e.g., Nazarian and Stokoe 1984;Stokoe et al. 1994, 2003, 2004; Cox and Wood 2010, 2011;Wong et al. 2011). In particular, the SASW method has oftenbeen applied in geotechnical earthquake engineering to characterizematerials for near-surface site response analyses (e.g.,Rosenblad et al. 2001; Wong and Silva 2006) and soil liquefactionanalyses (e.g., Andrus and Stokoe 2001). The SASW test isa non-intrusive, active source seismic method that utilizes thedispersive nature of Rayleigh-type surface waves propagatingthrough a layered material to infer the subsurface V S profile ofa site.The SASW field measurements in this study were madeusing three 4.5-Hz geophones, a “pocket-portable” dynamicsignal analyzer, and a sledge hammer. Figure 7 shows the testsetup at a site in south Kaiapoi. The geophones were modelGSC-11Ds manufactured by Geo Space Technologies, whilethe analyzer was a Quattro system manufactured by DataPhysics Corporation. The Quattro is a USB-powered, fourinputchannel, two-output channel dynamic signal analyzerwith 205-kHz simultaneous sampling rate, 24-bit ADC,110-dB dynamic range, and 100-dB anti-alias filters. It is controlledwith a flexible, Windows-based software package (DataPhysics Signal Calc) that has measurement capabilities in boththe time and frequency domains. The compact, highly portablenature of this setup is ideal for earthquake reconnaissanceefforts where shallow V S profiles are desired. At most locations,receiver spacings of approximately 0.61, 1.22, 2.44, 4.88, 6.10,and 12.20 m were used to collect surface wave data. These teststook less than 45 minutes per location and typically enabled V Sprofiles to be generated down to 6.1–9.1 m below the surface.In total, 36 SASW tests were performed across Christchurch932 Seismological Research Letters Volume 82, Number 6 November/December 2011


