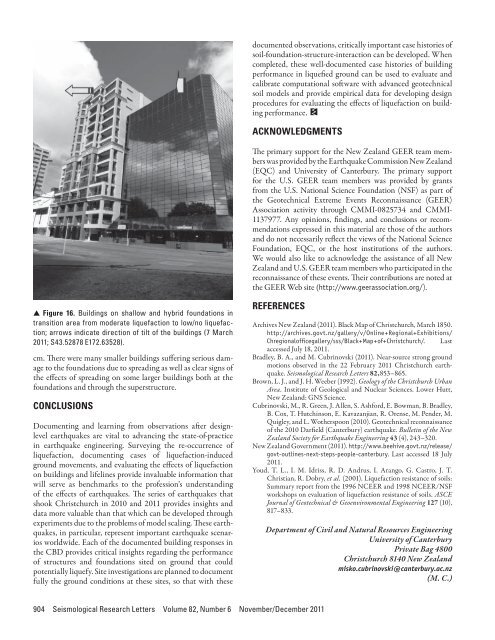
documented observations, critically important case histories ofsoil-foundation-structure-interaction can be developed. Whencompleted, these well-documented case histories of buildingperformance in liquefied ground can be used to evaluate andcalibrate computational software with advanced geotechnicalsoil models and provide empirical data for developing designprocedures for evaluating the effects of liquefaction on buildingperformance.ACKNOWLEDGMENTSThe primary support for the New Zealand GEER team memberswas provided by the Earthquake Commission New Zealand(EQC) and University of Canterbury. The primary supportfor the U.S. GEER team members was provided by grantsfrom the U.S. National Science Foundation (NSF) as part ofthe Geotechnical Extreme Events Reconnaissance (GEER)Association activity through CMMI-0825734 and CMMI-1137977. Any opinions, findings, and conclusions or recommendationsexpressed in this material are those of the authorsand do not necessarily reflect the views of the National ScienceFoundation, EQC, or the host institutions of the authors.We would also like to acknowledge the assistance of all NewZealand and U.S. GEER team members who participated in thereconnaissance of these events. Their contributions are noted atthe GEER Web site (http://www.geerassociation.org/).▲ ▲ Figure 16. Buildings on shallow and hybrid foundations intransition area from moderate liquefaction to low/no liquefaction;arrows indicate direction of tilt of the buildings (7 March2011; S43.52878 E172.63528).cm. There were many smaller buildings suffering serious damageto the foundations due to spreading as well as clear signs ofthe effects of spreading on some larger buildings both at thefoundations and through the superstructure.CONCLUSIONSDocumenting and learning from observations after designlevelearthquakes are vital to advancing the state-of-practicein earthquake engineering. Surveying the re-occurrence ofliquefaction, documenting cases of liquefaction-inducedground movements, and evaluating the effects of liquefactionon buildings and lifelines provide invaluable information thatwill serve as benchmarks to the profession’s understandingof the effects of earthquakes. The series of earthquakes thatshook Christchurch in 2010 and 2011 provides insights anddata more valuable than that which can be developed throughexperiments due to the problems of model scaling. These earthquakes,in particular, represent important earthquake scenariosworldwide. Each of the documented building responses inthe CBD provides critical insights regarding the performanceof structures and foundations sited on ground that couldpotentially liquefy. Site investigations are planned to documentfully the ground conditions at these sites, so that with theseREFERENCESArchives New Zealand (2011). Black Map of Christchurch, March 1850.http://archives.govt.nz/gallery/v/Online+Regional+Exhibitions/Chregionalofficegallery/sss/Black+Map+of+Christchurch/. Lastaccessed July 18, 2011.Bradley, B. A., and M. Cubrinovski (2011). Near-source strong groundmotions observed in the 22 February 2011 Christchurch earthquake.Seismological Research Letters 82,853–865.Brown, L. J., and J. H. Weeber (1992). Geology of the Christchurch UrbanArea. Institute of Geological and Nuclear Sciences. Lower Hutt,New Zealand: GNS Science.Cubrinovski, M., R. Green, J. Allen, S. Ashford, E. Bowman, B. Bradley,B. Cox, T. Hutchinson, E. Kavazanjian, R. Orense, M. Pender, M.Quigley, and L. Wotherspoon (2010). Geotechnical reconnaissanceof the 2010 Darfield (Canterbury) earthquake. Bulletin of the NewZealand Society for Earthquake Engineering 43 (4), 243–320.New Zealand Government (2011). http://www.beehive.govt.nz/release/govt-outlines-next-steps-people-canterbury. Last accessed 18 July2011.Youd, T. L., I. M. Idriss, R. D. Andrus, I. Arango, G. Castro, J. T.Christian, R. Dobry, et al. (2001). Liquefaction resistance of soils:Summary report from the 1996 NCEER and 1998 NCEER/NSFworkshops on evaluation of liquefaction resistance of soils. ASCEJournal of Geotechnical & Geoenvironmental Engineering 127 (10),817–833.Department of Civil and Natural Resources EngineeringUniversity of CanterburyPrivate Bag 4800Christchurch 8140 New Zealandmisko.cubrinovski@canterbury.ac.nz(M. C.)904 Seismological Research Letters Volume 82, Number 6 November/December 2011
Comparison of Liquefaction FeaturesObserved during the 2010 and 2011 CanterburyEarthquakesR. P. Orense, T. Kiyota, S. Yamada, M. Cubrinovski, Y. Hosono, M. Okamura, and S. YasudaR. P. Orense, 1 T. Kiyota, 2 S. Yamada, 3 M. Cubrinovski, 4 Y. Hosono, 5M. Okamura, 6 and S. Yasuda 7INTRODUCTION1. Department of Civil and Environmental Engineering, University ofAuckland, New Zealand2. Institute of Industrial Science, University of Tokyo, Japan3. Department of Civil Engineering, University of Tokyo, Japan4. Department of Civil and Natural Resources Engineering, Universityof Canterbury, New Zealand5. Department of Architecture and Civil Engineering, ToyohashiUniversity of Technology, Japan6. Department of Civil and Environmental Engineering, EhimeUniversity, Japan7. Department of Civil and Environmental Engineering, Tokyo DenkiUniversity, Tokyo, JapanOn 4 September 2010, a magnitude M = 7.1 earthquake struckthe Canterbury region on the South Island of New Zealand.The epicenter of the earthquake was located near Darfield,about 40 km west of the central business district (CBD) of thecity of Christchurch and at a depth of about 10 km. Extensivedamage was inflicted on lifelines and residential houses dueto widespread liquefaction and lateral spreading in areas closeto major streams, rivers, and wetlands throughout the city ofChristchurch and the town of Kaiapoi. In the months followingthe Darfield M 7.1 earthquake, numerous aftershocks werefelt across the city.Almost six months after the Darfield mainshock, on 22February 2011, the Canterbury region was hit by a magnitudeM = 6.3 earthquake. The epicenter was located near Lyttelton,only 6 km to the southeast of the Christchurch CBD and at adepth of 5 km. In spite of its smaller magnitude, this earthquakeresulted in more damage to pipeline networks, transport facilities,residential houses/properties, and multistory buildings inthe CBD than the September 2010 event, mainly because ofthe short distance to the city and the shallower depth.Although there were no casualties after the 2010 Darfieldearthquake, which is sort of a miracle considering the magnitudeof the earthquake, the 2011 Christchurch earthquakeresulted in a significant number of casualties due to the collapseof multistory buildings and unreinforced masonry structuresin the Christchurch city center. As of 1 June 2011, 181 casualtieswere reported (New Zealand Police; http://www.police.govt.nz/list-deceased).While it is extremely regrettable that the 2011Christchurch earthquake resulted in significant casualties,engineers and seismologists now have a hard-to-find opportunityto learn the response of ground and structures to twolarge-scale earthquakes that occurred less than six monthsapart. From a geotechnical engineering point of view, it is interestingto look at the widespread liquefaction in natural sediments,re-liquefaction of ground occurring over a short periodof time, and further damage to earth structures that had beendamaged as a result of the first earthquake.Following the two earthquake events, detailed geotechnicalinvestigations were conducted by the authors as part of theJapanese Geotechnical Society (JGS) earthquake reconnaissanceteams. The reconnaissance was a collaboration betweenthe society’s New Zealand-based members and researchers dispatchedfrom Japan for this purpose. The first visit was made12–15 September 2010, while the second one was 27 February–3March 2011. This paper attempts to present a comparison ofthe two events based on the observations made by the authorsfollowing these reconnaissance trips, with emphasis on the geotechnicalimplications of liquefaction-observed damage in theaffected areas.It is worth mentioning that a series of aftershocks, the largestof which were M 5.6 and M 6.3, rattled the city on 13 June2011. These aftershocks again caused extensive liquefactionin many parts of Christchurch. As we write this paper, reconnaissancework is underway to shed more light on the damagecaused by re-liquefaction.GEOLOGIC SETTINGThe Canterbury Plains, about 180 km long and of varyingwidth, are New Zealand’s largest areas of flat land. They havebeen formed by the overlapping fans of glacier-fed rivers issuingfrom the Southern Alps, the mountain range of the SouthIsland. The plains are often described as fertile, but the soils arevariable. Most are derived from the greywacke of the mountainsor from loess (fine sediment blown from riverbeds). Indoi: 10.1785/gssrl.82.6.905Seismological Research Letters Volume 82, Number 6 November/December 2011 905
- Page 1:
Volume 82, Number 6 November/Decemb
- Page 7:
News and Notes (continued)Nominatio
- Page 11:
Preface to the Focused Issue on the
- Page 14 and 15:
TABLE 1Peak ground acceleration (PG
- Page 16 and 17:
▲▲Figure 2. A) Sketch of the
- Page 18 and 19:
▲▲Figure 4. A) Adopted moment r
- Page 20 and 21:
▲▲Figure 7. As in Figure 6 but
- Page 22 and 23:
▲ ▲ Figure 8. Misfit parameters
- Page 24 and 25:
▲ ▲ Figure 10. Spatial variabil
- Page 26 and 27:
▲ ▲ Figure 12. Standard spectra
- Page 28 and 29:
Quigley, M., R. Van Dissen, P. Vill
- Page 30 and 31:
slip on a 59-degree striking fault
- Page 32 and 33:
▲▲Figure 4. Convergence of inve
- Page 34 and 35:
observations and other source studi
- Page 36 and 37:
-42. 5-43. 0-43. 5-44. 0-44. 5-43.2
- Page 38 and 39:
“Product CSK © ASI, (ItalianSpac
- Page 40 and 41:
TABLE 2Solutions for fault location
- Page 42 and 43:
-43.45(A)degrees N-43.50-43.552.52.
- Page 44 and 45:
is still a good fit to the horizont
- Page 46 and 47:
Coulomb Stress Change Sensitivity d
- Page 48 and 49:
mation takes on a larger strike-sli
- Page 50 and 51:
P 9.4267BLDU45P 20.1213CASY39P 2.62
- Page 52 and 53:
ERMJNUMAJOINUJHJ2CBIJMIDWJOWYHNBTPU
- Page 54 and 55:
(A)6.146.13(B)6.246.36Misfit6.156.1
- Page 56 and 57:
(A)(B)(C)(D)▲▲Figure 10. The co
- Page 58 and 59:
(A)(B)(C)(D)▲▲Figure 12. The co
- Page 60 and 61:
Luo, Y., Y. Tan, S. Wei, D. Helmber
- Page 62 and 63:
−44˚00' −43˚00'4-Sep-2010Mw 7
- Page 64 and 65:
TABLE 1Pairs of SAR imagery used in
- Page 67 and 68:
Depth (km)Coulomb Stress Change(bar
- Page 69 and 70:
Crippen, R. E. (1992). Measurement
- Page 71 and 72:
AlpineFaultHope Fault38 mm/yr0+ +-1
- Page 73 and 74:
σ 1dσ 3Nuσ 3CM w 7.1dw 6.2u70°M
- Page 75 and 76:
Right-lateral Faults(A) Range Front
- Page 77 and 78:
DISCUSSIONThe 2010-2011 Canterbury
- Page 79 and 80:
Large Apparent Stresses from the Ca
- Page 81 and 82:
▲ ▲ Figure 2. Observed vs. pred
- Page 83 and 84:
10Obs SA(1s)AS1AS+SDAB 2006AB+SDSA(
- Page 85 and 86:
Fine-scale Relocation of Aftershock
- Page 87 and 88:
−43.25°OXZ0 10 20km−43.5°−4
- Page 89 and 90:
A’0 km 4 8−43.5°B’B−43.6°
- Page 91 and 92:
REFERENCESAvery, H. R., J. B. Berri
- Page 93 and 94:
▲ ▲ Figure 2. A) shows three-co
- Page 95 and 96:
▲ ▲ Figure 4. Vertical accelera
- Page 97 and 98:
0.8PRPC Z0.40Normalized (Max PGA +
- Page 99 and 100: Near-source Strong Ground MotionsOb
- Page 101 and 102: (A)Magnitude, M w876542009 NZdataba
- Page 103 and 104: Scale0.5 g5 seconds▲▲Figure 4.
- Page 105 and 106: (A)(B)Spectral Acc, Sa (g)North/Wes
- Page 107 and 108: Vertical-to-horizontal PGA ratio543
- Page 109 and 110: (A)(B)Station:CCCCSolid:AvgHorizDas
- Page 111 and 112: REFERENCESAagaard, B. T., J. F. Hal
- Page 113 and 114: ▲ ▲ Figure 1. Shear-wave veloci
- Page 115 and 116: Spectral Acceleration (0.3 s), (g)I
- Page 117 and 118: Spectral Acceleration (3 s), (g)In[
- Page 119 and 120: TABLE 1Mean (μ LLH ) and standard
- Page 121 and 122: Strong Ground Motions and Damage Co
- Page 123 and 124: ings and the Modified Takeda-Slip M
- Page 125 and 126: high, but there were no buildings d
- Page 127 and 128: REFERENCES▲▲Figure 8. Heavily d
- Page 129 and 130: (A)(B)(C)(D)(E)▲▲Figure 1. A) M
- Page 131 and 132: (A) (B) (C)▲ ▲ Figure 3. A) Typ
- Page 133 and 134: (A) (B) (C)▲ ▲ Figure 4. A) Typ
- Page 135 and 136: Case StudyKey ParametersTABLE 1Key
- Page 137 and 138: ▲ ▲ Figure 9. Representative bu
- Page 139 and 140: Soil Liquefaction Effects in the Ce
- Page 141 and 142: ▲ ▲ Figure 2. Representative su
- Page 143 and 144: Location of structures illustrated
- Page 145 and 146: Shading indicates areaover which pr
- Page 147 and 148: 1.8 deg15 cmGround cracking due to
- Page 149: 30 cm17 cm30 cmFoundation beam▲
- Page 153 and 154: (A)(B)▲▲Figure 2. A) Simplified
- Page 155 and 156: (A)Acceleration (Gal)6004002000-200
- Page 157 and 158: (A)(B)▲▲Figure 7. Distribution
- Page 159 and 160: (A)(B)▲▲Figure 10. Damage to a
- Page 161 and 162: (A)(B)▲ ▲ Figure 14. A) Subside
- Page 163 and 164: ▲▲Figure 17. A trench in a resi
- Page 165 and 166: Ambient Noise Measurements followin
- Page 167 and 168: ▲▲Figure 1. Location of the noi
- Page 169 and 170: ▲▲Figure 5. Site N20 showing HV
- Page 171 and 172: ▲▲Figure 8. Comparison between
- Page 173 and 174: Use of DCP and SASW Tests to Evalua
- Page 175 and 176: ▲ ▲ Figure 2. Aerial image of C
- Page 177 and 178: (A)(B)▲▲Figure 4. DCP test bein
- Page 179 and 180: ▲▲Figure 7. SASW setup at a sit
- Page 181 and 182: where X ~ N(μ X , σ X 2 ) is shor
- Page 183 and 184: Using the same critical layers as s
- Page 185 and 186: Performance of Levees (Stopbanks) d
- Page 187 and 188: ▲▲Figure 3. Typical geometry an
- Page 189 and 190: TABLE 1Damage severity categories (
- Page 191 and 192: (A)(B)▲▲Figure 6. A) Large sand
- Page 193 and 194: (A)(B)▲▲Figure 8. A) Representa
- Page 195 and 196: each of the Waimakariri River and a
- Page 197 and 198: ▲ ▲ Figure 2. Horizontal peak g
- Page 199 and 200: only minor damage, mostly to their
- Page 201 and 202:
(A)(C)(B)▲▲Figure 5. Ferrymead
- Page 203 and 204:
(A)(B)▲▲Figure 7. Damage to sou
- Page 205 and 206:
(A)(B)▲▲Figure 11. Settlement o
- Page 207 and 208:
(A)(C)(B)▲▲Figure 14. Railway B
- Page 209 and 210:
Events Reconnaissance (GEER) Associ
- Page 211 and 212:
New PublicationsCanGeoRefThe Americ
- Page 213 and 214:
Wednesday, 18 AprilTechnical Sessio
- Page 215 and 216:
Verification of a Spectral-Element
- Page 217 and 218:
EASTERN SECTIONRESEARCH LETTERSReas
- Page 219 and 220:
(A)70°N100°W 60°W70°N(B)100°E1
- Page 221 and 222:
Mongolia SCRThe presence or absence
- Page 223 and 224:
the small horizontal relative motio
- Page 225 and 226:
80°100°120°140°EXPLANATIONBorde
- Page 227 and 228:
Chang, K. H. (1997). Korean peninsu
- Page 229 and 230:
Wheeler, R. L. (2008). Paleoseismic
- Page 231 and 232:
A significant outcome of this study
- Page 233 and 234:
TABLE 1 (continued)Earthquakes for
- Page 235 and 236:
▲▲Figure 2. Earthquakes used in
- Page 237 and 238:
Meeting CalendarM E E T I N GC A L
- Page 239 and 240:
201 Plaza Professional Bldg. • El
- Page 241 and 242:
Seismological Research Letters (SRL
- Page 243 and 244:
Christa von Hillebrandt-Andrade, Pr