Here - Stuff
Here - Stuff Here - Stuff
Ground motion recording station with geo-meanpeak horizontal ground accelerations from 4 Sept.2010 event (left) and 22 Feb. 2011 event (right).Christchurch CathedralFigure 2 Section LineChristchurch CBDFinite fault model for 22 Feb2011 M w = 6.2 event. Referto Beavan et al. (this issue)and Bradley and Cubrinovski(this issue) for more detail.▲▲Figure 1. Christchurch CBD relative to subsurface fault rupture of 22 February 2011 event.single-story timber-framed houses with a smaller number oftwo-story houses) spread across a large area with many parks,natural reserves, and recreation grounds. The CBD is the areaencompassed by the four avenues, Rolleston to the west, Bealeyto the north, Fitzgerald to the east, and Moorhouse to thesouth. The CBD is more densely developed, including multistorybuildings in its central area, a relatively large number ofhistoric masonry buildings dating from the late 19th and early20th century, residential buildings (typically two- to five-storystructures located north of Kilmore Street), and some industrialbuildings in the south and southeastern parts of the CBD.In total, about 3,000 buildings of various heights, constructionage, and structural systems were within the CBD boundariesbefore the 2010–2011 earthquake series. Latest estimatesindicate that about 1,000 of these buildings will have to bedemolished because of excessive earthquake damage. Figure 1outlines the boundaries of the CBD and the approximate locationof the causative fault of the 22 February 2011 earthquake.LOCAL GEOLOGYThe city of Christchurch is located on Holocene deposits ofthe Canterbury Plains, except for its southern edge, which islocated on the slopes of the Port Hills of Banks Peninsula,the eroded remnant of the extinct Lyttelton Volcano, composedof weathered volcanic rock (basalt) and thick depositsof Pleistocene loess. The river floodplain, Pacific coastline,and the Port Hills are the dominant geomorphic featuresof the Christchurch urban area. The Canterbury Plains arecomplex fans deposited by eastward-flowing rivers from theSouthern Alps, a NS-trending mountain range, into PegasusBay on the Pacific coast. The fan surfaces cover an area 50 kmwide × 160 km long. At Christchurch, surface postglacialsediments have a thickness between 15 and 40 m and overlie300–400-m-thick interlayered formations of gravels and fineto very fine grained sediments, representing deposition duringepisodic glacial and interglacial periods, and together comprisea series of ground water aquifers (Brown and Weeber 1992).As shown in Figure 2, the surface sediments are made up offluvial gravels, sands, and silts (Springston Formation, with amaximum thickness of 20 m to the west of Christchurch) orestuarine, lagoon, beach, dune, and coastal swamp deposits ofsand, silt, clay, and peat (Christchurch Formation, with a maximumthickness of 40 m on the coast at New Brighton, east ofthe CBD). The shallow soil deposits (i.e., depths of up to 15–20m) vary significantly within short distances, both horizontallyand vertically.Brown and Weeber (1992) describe the original site conditionsand development of Christchurch as follows:Originally the site of Christchurch was mainly swamplying behind beach dune sand; estuaries and lagoons,and gravel, sand and silt of river channel and flooddeposits of the coastal Waimakariri River flood plain.The Waimakariri River regularly flooded Christchurchprior to stopbank construction and river realignment.Since European settlement in the 1850s, extensivedrainage and infilling of swamps has been undertaken.894 Seismological Research Letters Volume 82, Number 6 November/December 2011
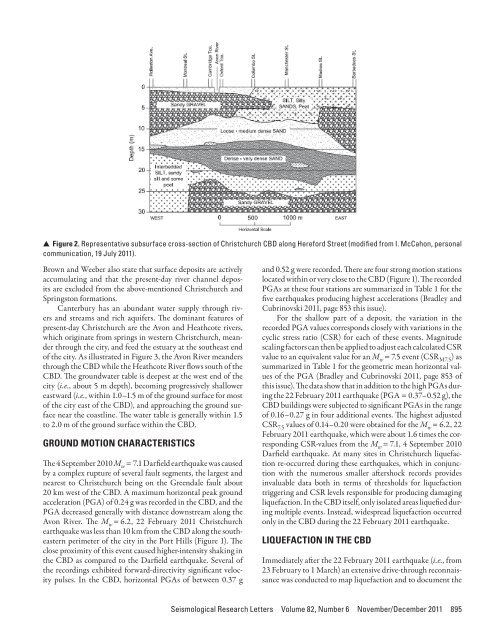
▲ ▲ Figure 2. Representative subsurface cross-section of Christchurch CBD along Hereford Street (modified from I. McCahon, personalcommunication, 19 July 2011).Brown and Weeber also state that surface deposits are activelyaccumulating and that the present-day river channel depositsare excluded from the above-mentioned Christchurch andSpringston formations.Canterbury has an abundant water supply through riversand streams and rich aquifers. The dominant features ofpresent-day Christchurch are the Avon and Heathcote rivers,which originate from springs in western Christchurch, meanderthrough the city, and feed the estuary at the southeast endof the city. As illustrated in Figure 3, the Avon River meandersthrough the CBD while the Heathcote River flows south of theCBD. The groundwater table is deepest at the west end of thecity (i.e., about 5 m depth), becoming progressively shallowereastward (i.e., within 1.0–1.5 m of the ground surface for mostof the city east of the CBD), and approaching the ground surfacenear the coastline. The water table is generally within 1.5to 2.0 m of the ground surface within the CBD.GROUND MOTION CHARACTERISTICSThe 4 September 2010 M w = 7.1 Darfield earthquake was causedby a complex rupture of several fault segments, the largest andnearest to Christchurch being on the Greendale fault about20 km west of the CBD. A maximum horizontal peak groundacceleration (PGA) of 0.24 g was recorded in the CBD, and thePGA decreased generally with distance downstream along theAvon River. The M w = 6.2, 22 February 2011 Christchurchearthquake was less than 10 km from the CBD along the southeasternperimeter of the city in the Port Hills (Figure 1). Theclose proximity of this event caused higher-intensity shaking inthe CBD as compared to the Darfield earthquake. Several ofthe recordings exhibited forward-directivity significant velocitypulses. In the CBD, horizontal PGAs of between 0.37 gand 0.52 g were recorded. There are four strong motion stationslocated within or very close to the CBD (Figure 1). The recordedPGAs at these four stations are summarized in Table 1 for thefive earthquakes producing highest accelerations (Bradley andCubrinovski 2011, page 853 this issue).For the shallow part of a deposit, the variation in therecorded PGA values corresponds closely with variations in thecyclic stress ratio (CSR) for each of these events. Magnitudescaling factors can then be applied to adjust each calculated CSRvalue to an equivalent value for an M w = 7.5 event (CSR M7.5 ) assummarized in Table 1 for the geometric mean horizontal valuesof the PGA (Bradley and Cubrinovski 2011, page 853 ofthis issue). The data show that in addition to the high PGAs duringthe 22 February 2011 earthquake (PGA = 0.37–0.52 g), theCBD buildings were subjected to significant PGAs in the rangeof 0.16–0.27 g in four additional events. The highest adjustedCSR 7.5 values of 0.14–0.20 were obtained for the M w = 6.2, 22February 2011 earthquake, which were about 1.6 times the correspondingCSR-values from the M w = 7.1, 4 September 2010Darfield earthquake. At many sites in Christchurch liquefactionre-occurred during these earthquakes, which in conjunctionwith the numerous smaller aftershock records providesinvaluable data both in terms of thresholds for liquefactiontriggering and CSR levels responsible for producing damagingliquefaction. In the CBD itself, only isolated areas liquefied duringmultiple events. Instead, widespread liquefaction occurredonly in the CBD during the 22 February 2011 earthquake.LIQUEFACTION IN THE CBDImmediately after the 22 February 2011 earthquake (i.e., from23 February to 1 March) an extensive drive-through reconnaissancewas conducted to map liquefaction and to document theSeismological Research Letters Volume 82, Number 6 November/December 2011 895
- Page 89 and 90: A’0 km 4 8−43.5°B’B−43.6°
- Page 91 and 92: REFERENCESAvery, H. R., J. B. Berri
- Page 93 and 94: ▲ ▲ Figure 2. A) shows three-co
- Page 95 and 96: ▲ ▲ Figure 4. Vertical accelera
- Page 97 and 98: 0.8PRPC Z0.40Normalized (Max PGA +
- Page 99 and 100: Near-source Strong Ground MotionsOb
- Page 101 and 102: (A)Magnitude, M w876542009 NZdataba
- Page 103 and 104: Scale0.5 g5 seconds▲▲Figure 4.
- Page 105 and 106: (A)(B)Spectral Acc, Sa (g)North/Wes
- Page 107 and 108: Vertical-to-horizontal PGA ratio543
- Page 109 and 110: (A)(B)Station:CCCCSolid:AvgHorizDas
- Page 111 and 112: REFERENCESAagaard, B. T., J. F. Hal
- Page 113 and 114: ▲ ▲ Figure 1. Shear-wave veloci
- Page 115 and 116: Spectral Acceleration (0.3 s), (g)I
- Page 117 and 118: Spectral Acceleration (3 s), (g)In[
- Page 119 and 120: TABLE 1Mean (μ LLH ) and standard
- Page 121 and 122: Strong Ground Motions and Damage Co
- Page 123 and 124: ings and the Modified Takeda-Slip M
- Page 125 and 126: high, but there were no buildings d
- Page 127 and 128: REFERENCES▲▲Figure 8. Heavily d
- Page 129 and 130: (A)(B)(C)(D)(E)▲▲Figure 1. A) M
- Page 131 and 132: (A) (B) (C)▲ ▲ Figure 3. A) Typ
- Page 133 and 134: (A) (B) (C)▲ ▲ Figure 4. A) Typ
- Page 135 and 136: Case StudyKey ParametersTABLE 1Key
- Page 137 and 138: ▲ ▲ Figure 9. Representative bu
- Page 139: Soil Liquefaction Effects in the Ce
- Page 143 and 144: Location of structures illustrated
- Page 145 and 146: Shading indicates areaover which pr
- Page 147 and 148: 1.8 deg15 cmGround cracking due to
- Page 149 and 150: 30 cm17 cm30 cmFoundation beam▲
- Page 151 and 152: Comparison of Liquefaction Features
- Page 153 and 154: (A)(B)▲▲Figure 2. A) Simplified
- Page 155 and 156: (A)Acceleration (Gal)6004002000-200
- Page 157 and 158: (A)(B)▲▲Figure 7. Distribution
- Page 159 and 160: (A)(B)▲▲Figure 10. Damage to a
- Page 161 and 162: (A)(B)▲ ▲ Figure 14. A) Subside
- Page 163 and 164: ▲▲Figure 17. A trench in a resi
- Page 165 and 166: Ambient Noise Measurements followin
- Page 167 and 168: ▲▲Figure 1. Location of the noi
- Page 169 and 170: ▲▲Figure 5. Site N20 showing HV
- Page 171 and 172: ▲▲Figure 8. Comparison between
- Page 173 and 174: Use of DCP and SASW Tests to Evalua
- Page 175 and 176: ▲ ▲ Figure 2. Aerial image of C
- Page 177 and 178: (A)(B)▲▲Figure 4. DCP test bein
- Page 179 and 180: ▲▲Figure 7. SASW setup at a sit
- Page 181 and 182: where X ~ N(μ X , σ X 2 ) is shor
- Page 183 and 184: Using the same critical layers as s
- Page 185 and 186: Performance of Levees (Stopbanks) d
- Page 187 and 188: ▲▲Figure 3. Typical geometry an
- Page 189 and 190: TABLE 1Damage severity categories (
▲ ▲ Figure 2. Representative subsurface cross-section of Christchurch CBD along <strong>Here</strong>ford Street (modified from I. McCahon, personalcommunication, 19 July 2011).Brown and Weeber also state that surface deposits are activelyaccumulating and that the present-day river channel depositsare excluded from the above-mentioned Christchurch andSpringston formations.Canterbury has an abundant water supply through riversand streams and rich aquifers. The dominant features ofpresent-day Christchurch are the Avon and Heathcote rivers,which originate from springs in western Christchurch, meanderthrough the city, and feed the estuary at the southeast endof the city. As illustrated in Figure 3, the Avon River meandersthrough the CBD while the Heathcote River flows south of theCBD. The groundwater table is deepest at the west end of thecity (i.e., about 5 m depth), becoming progressively shallowereastward (i.e., within 1.0–1.5 m of the ground surface for mostof the city east of the CBD), and approaching the ground surfacenear the coastline. The water table is generally within 1.5to 2.0 m of the ground surface within the CBD.GROUND MOTION CHARACTERISTICSThe 4 September 2010 M w = 7.1 Darfield earthquake was causedby a complex rupture of several fault segments, the largest andnearest to Christchurch being on the Greendale fault about20 km west of the CBD. A maximum horizontal peak groundacceleration (PGA) of 0.24 g was recorded in the CBD, and thePGA decreased generally with distance downstream along theAvon River. The M w = 6.2, 22 February 2011 Christchurchearthquake was less than 10 km from the CBD along the southeasternperimeter of the city in the Port Hills (Figure 1). Theclose proximity of this event caused higher-intensity shaking inthe CBD as compared to the Darfield earthquake. Several ofthe recordings exhibited forward-directivity significant velocitypulses. In the CBD, horizontal PGAs of between 0.37 gand 0.52 g were recorded. There are four strong motion stationslocated within or very close to the CBD (Figure 1). The recordedPGAs at these four stations are summarized in Table 1 for thefive earthquakes producing highest accelerations (Bradley andCubrinovski 2011, page 853 this issue).For the shallow part of a deposit, the variation in therecorded PGA values corresponds closely with variations in thecyclic stress ratio (CSR) for each of these events. Magnitudescaling factors can then be applied to adjust each calculated CSRvalue to an equivalent value for an M w = 7.5 event (CSR M7.5 ) assummarized in Table 1 for the geometric mean horizontal valuesof the PGA (Bradley and Cubrinovski 2011, page 853 ofthis issue). The data show that in addition to the high PGAs duringthe 22 February 2011 earthquake (PGA = 0.37–0.52 g), theCBD buildings were subjected to significant PGAs in the rangeof 0.16–0.27 g in four additional events. The highest adjustedCSR 7.5 values of 0.14–0.20 were obtained for the M w = 6.2, 22February 2011 earthquake, which were about 1.6 times the correspondingCSR-values from the M w = 7.1, 4 September 2010Darfield earthquake. At many sites in Christchurch liquefactionre-occurred during these earthquakes, which in conjunctionwith the numerous smaller aftershock records providesinvaluable data both in terms of thresholds for liquefactiontriggering and CSR levels responsible for producing damagingliquefaction. In the CBD itself, only isolated areas liquefied duringmultiple events. Instead, widespread liquefaction occurredonly in the CBD during the 22 February 2011 earthquake.LIQUEFACTION IN THE CBDImmediately after the 22 February 2011 earthquake (i.e., from23 February to 1 March) an extensive drive-through reconnaissancewas conducted to map liquefaction and to document theSeismological Research Letters Volume 82, Number 6 November/December 2011 895


