Here - Stuff
Here - Stuff Here - Stuff
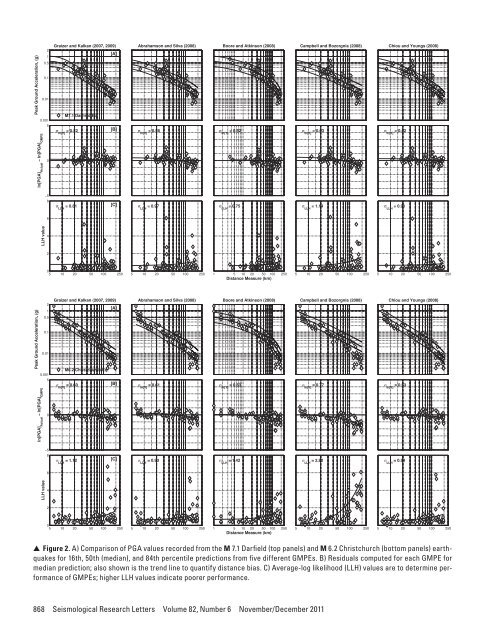
Peak Ground Acceleration, (g)In[PGA] Actual− In[PGA] GMPE210.50.10.010.00150Graizer and Kalkan (2007, 2009)[A]Abrahamson and Silva (2008) Boore and Atkinson (2008) Campbell and Bozorgnia (2008) Chiou and Youngs (2008)M7.1 Darfield Eq.σ = 0.52 In[Y][B] σ = 0.58 In[Y]σ = 0.52 In[Y]σ = 0.63 In[Y]σ = 0.52In[Y]−58σ LLH= 0.81[C]σ LLH= 0.97σ LLH= 0.75σ LLH= 1.14σ LLH= 0.916LLH value4205 10 20 50 100 2505 10 20 50 100 2501 5 10 20 50 100 250Distance Measure (km)5 10 20 50 100 2505 10 20 50 100 250Peak Ground Acceleration, (g)In[PGA] Actual− In[PGA] GMPE210.50.10.010.00150Graizer and Kalkan (2007, 2009)[A]Abrahamson and Silva (2008) Boore and Atkinson (2008) Campbell and Bozorgnia (2008) Chiou and Youngs (2008)M6.2 Christchurch Eq.σ In[Y]= 0.60 [B] σ In[Y]= 0.61 σ In[Y]= 0.63 σ In[Y]= 0.77 σ In[Y]= 0.53−58σ LLH= 1.12[C]σ LLH= 0.93σ LLH= 1.42σ LLH= 2.82σ LLH= 0.946LLH value4205 10 20 50 100 2505 10 20 50 100 2501 5 10 20 50 100 250Distance Measure (km)5 10 20 50 100 2505 10 20 50 100 250▲ ▲ Figure 2. A) Comparison of PGA values recorded from the M 7.1 Darfield (top panels) and M 6.2 Christchurch (bottom panels) earthquakesfor 16th, 50th (median), and 84th percentile predictions from five different GMPEs. B) Residuals computed for each GMPE formedian prediction; also shown is the trend line to quantify distance bias. C) Average-log likelihood (LLH) values are to determine performanceof GMPEs; higher LLH values indicate poorer performance.868 Seismological Research Letters Volume 82, Number 6 November/December 2011
Spectral Acceleration (0.3 s), (g)In[SA(0.3 s)] Actual− In[SA(0.3 s)] GMPE210.50.10.010.00150−58Graizer and Kalkan (2007, 2009)[A]Abrahamson and Silva (2008) Boore and Atkinson (2008) Campbell and Bozorgnia (2008) Chiou and Youngs (2008)M7.1 Darfield Eq.σ In[Y]= 0.59 [B] σ In[Y]= 0.69 σ In[Y]= 0.63 σ In[Y]= 0.71 σ In[Y]= 0.63σ LLH= 0.87[C]σ LLH= 1.00σ LLH= 0.86σ LLH= 1.13σ LLH= 1.016LLH value4205 10 20 50 100 2505 10 20 50 100 2501 5 10 20 50 100 250Distance Measure (km)5 10 20 50 100 2505 10 20 50 100 250Spectral Acceleration (0.3 s), (g)In[SA(0.3 s)] Actual− In[SA(0.3 s)] GMPE210.50.10.010.00150−58Graizer and Kalkan (2007, 2009)[A]Abrahamson and Silva (2008) Boore and Atkinson (2008) Campbell and Bozorgnia (2008) Chiou and Youngs (2008)M6.2 Christchurch Eq.σ In[Y]= 0.63 [B] σ In[Y]= 0.68 σ In[Y]= 0.72 σ In[Y]= 0.80 σ In[Y]= 0.62σ = 1.03[C]σ = 1.00σ = 1.70σ = 2.29σ = 0.99LLH LLH LLH LLH LLH6LLH value4205 10 20 50 100 2505 10 20 50 100 2501 5 10 20 50 100 250Distance Measure (km)5 10 20 50 100 2505 10 20 50 100 250▲ ▲ Figure 3. A) Comparison of 5%-damped spectral acceleration values computed at 0.3 s for the M 7.1 Darfield (top panels) andM 6.2 Christchurch (bottom panels) earthquakes for 16th, 50th (median), and 84th percentile predictions from five different GMPEs.B) Residuals computed for each GMPE for median prediction; also shown is the trend line to quantify distance bias. C) Average-loglikelihood (LLH) values are to determine performance of GMPEs; higher LLH values indicate poorer performance.Seismological Research Letters Volume 82, Number 6 November/December 2011 869
- Page 64 and 65: TABLE 1Pairs of SAR imagery used in
- Page 67 and 68: Depth (km)Coulomb Stress Change(bar
- Page 69 and 70: Crippen, R. E. (1992). Measurement
- Page 71 and 72: AlpineFaultHope Fault38 mm/yr0+ +-1
- Page 73 and 74: σ 1dσ 3Nuσ 3CM w 7.1dw 6.2u70°M
- Page 75 and 76: Right-lateral Faults(A) Range Front
- Page 77 and 78: DISCUSSIONThe 2010-2011 Canterbury
- Page 79 and 80: Large Apparent Stresses from the Ca
- Page 81 and 82: ▲ ▲ Figure 2. Observed vs. pred
- Page 83 and 84: 10Obs SA(1s)AS1AS+SDAB 2006AB+SDSA(
- Page 85 and 86: Fine-scale Relocation of Aftershock
- Page 87 and 88: −43.25°OXZ0 10 20km−43.5°−4
- Page 89 and 90: A’0 km 4 8−43.5°B’B−43.6°
- Page 91 and 92: REFERENCESAvery, H. R., J. B. Berri
- Page 93 and 94: ▲ ▲ Figure 2. A) shows three-co
- Page 95 and 96: ▲ ▲ Figure 4. Vertical accelera
- Page 97 and 98: 0.8PRPC Z0.40Normalized (Max PGA +
- Page 99 and 100: Near-source Strong Ground MotionsOb
- Page 101 and 102: (A)Magnitude, M w876542009 NZdataba
- Page 103 and 104: Scale0.5 g5 seconds▲▲Figure 4.
- Page 105 and 106: (A)(B)Spectral Acc, Sa (g)North/Wes
- Page 107 and 108: Vertical-to-horizontal PGA ratio543
- Page 109 and 110: (A)(B)Station:CCCCSolid:AvgHorizDas
- Page 111 and 112: REFERENCESAagaard, B. T., J. F. Hal
- Page 113: ▲ ▲ Figure 1. Shear-wave veloci
- Page 117 and 118: Spectral Acceleration (3 s), (g)In[
- Page 119 and 120: TABLE 1Mean (μ LLH ) and standard
- Page 121 and 122: Strong Ground Motions and Damage Co
- Page 123 and 124: ings and the Modified Takeda-Slip M
- Page 125 and 126: high, but there were no buildings d
- Page 127 and 128: REFERENCES▲▲Figure 8. Heavily d
- Page 129 and 130: (A)(B)(C)(D)(E)▲▲Figure 1. A) M
- Page 131 and 132: (A) (B) (C)▲ ▲ Figure 3. A) Typ
- Page 133 and 134: (A) (B) (C)▲ ▲ Figure 4. A) Typ
- Page 135 and 136: Case StudyKey ParametersTABLE 1Key
- Page 137 and 138: ▲ ▲ Figure 9. Representative bu
- Page 139 and 140: Soil Liquefaction Effects in the Ce
- Page 141 and 142: ▲ ▲ Figure 2. Representative su
- Page 143 and 144: Location of structures illustrated
- Page 145 and 146: Shading indicates areaover which pr
- Page 147 and 148: 1.8 deg15 cmGround cracking due to
- Page 149 and 150: 30 cm17 cm30 cmFoundation beam▲
- Page 151 and 152: Comparison of Liquefaction Features
- Page 153 and 154: (A)(B)▲▲Figure 2. A) Simplified
- Page 155 and 156: (A)Acceleration (Gal)6004002000-200
- Page 157 and 158: (A)(B)▲▲Figure 7. Distribution
- Page 159 and 160: (A)(B)▲▲Figure 10. Damage to a
- Page 161 and 162: (A)(B)▲ ▲ Figure 14. A) Subside
- Page 163 and 164: ▲▲Figure 17. A trench in a resi
Peak Ground Acceleration, (g)In[PGA] Actual− In[PGA] GMPE210.50.10.010.00150Graizer and Kalkan (2007, 2009)[A]Abrahamson and Silva (2008) Boore and Atkinson (2008) Campbell and Bozorgnia (2008) Chiou and Youngs (2008)M7.1 Darfield Eq.σ = 0.52 In[Y][B] σ = 0.58 In[Y]σ = 0.52 In[Y]σ = 0.63 In[Y]σ = 0.52In[Y]−58σ LLH= 0.81[C]σ LLH= 0.97σ LLH= 0.75σ LLH= 1.14σ LLH= 0.916LLH value4205 10 20 50 100 2505 10 20 50 100 2501 5 10 20 50 100 250Distance Measure (km)5 10 20 50 100 2505 10 20 50 100 250Peak Ground Acceleration, (g)In[PGA] Actual− In[PGA] GMPE210.50.10.010.00150Graizer and Kalkan (2007, 2009)[A]Abrahamson and Silva (2008) Boore and Atkinson (2008) Campbell and Bozorgnia (2008) Chiou and Youngs (2008)M6.2 Christchurch Eq.σ In[Y]= 0.60 [B] σ In[Y]= 0.61 σ In[Y]= 0.63 σ In[Y]= 0.77 σ In[Y]= 0.53−58σ LLH= 1.12[C]σ LLH= 0.93σ LLH= 1.42σ LLH= 2.82σ LLH= 0.946LLH value4205 10 20 50 100 2505 10 20 50 100 2501 5 10 20 50 100 250Distance Measure (km)5 10 20 50 100 2505 10 20 50 100 250▲ ▲ Figure 2. A) Comparison of PGA values recorded from the M 7.1 Darfield (top panels) and M 6.2 Christchurch (bottom panels) earthquakesfor 16th, 50th (median), and 84th percentile predictions from five different GMPEs. B) Residuals computed for each GMPE formedian prediction; also shown is the trend line to quantify distance bias. C) Average-log likelihood (LLH) values are to determine performanceof GMPEs; higher LLH values indicate poorer performance.868 Seismological Research Letters Volume 82, Number 6 November/December 2011


