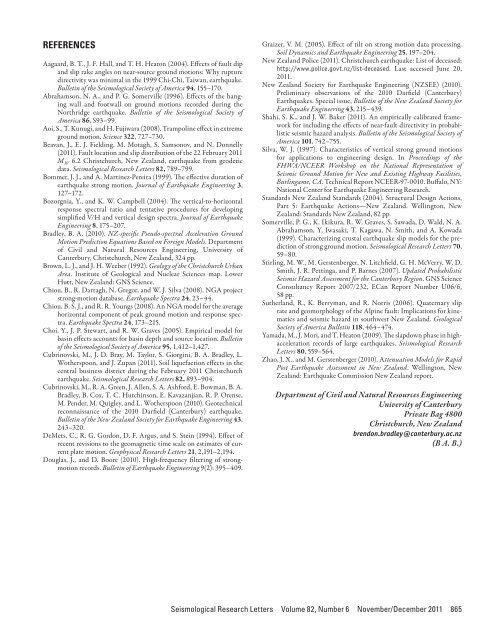
(A)Station:PPHSSolid:AvgHorizDashed:Vert(B)Station:SMTCSolid:AvgHorizDashed:VertSpectral acc, Sa (g)10 -1Spectral acc, Sa (g)10 -110 -210 0 Period, T (s)04/09/201022/02/2011NZS1170.510 -1 10 0 10 110 -210 0 Period, T (s)04/09/201022/02/2011NZS1170.510 -1 10 0 10 1▲ ▲ Figure 14. Similarity of response spectral shapes of horizontal and vertical ground motions observed in the Christchurch and Darfieldearthquakes at: A) Papanui (PPHS); and B) Styx Mill (SMTC).with these phenomena in the Darfield earthquake can be clearlyseen at CCCC, CACS, and HVSC stations. Figure 13A illustratesthat at Christchurch Cathedral College (CCCC), whichis located in the Christchurch CBD, spectral amplitudes in theChristchurch earthquake were approximately twice those ofthe Darfield earthquake for vibration periods less than T = 1.5s. It can also be seen that at CCCC station, spectral amplitudesresulting from the Darfield earthquake were notably below thedesign spectra for T < 2 s. Figure 13C–D also illustrate thatspectral amplitudes from the Darfield earthquake were belowthe design spectra at short periods throughout the majorityof Christchurch, with exceptions being Heathcote Valley(HVSC), Lyttelton Port (LPCC), and several western suburbs(i.e., TPLC, ROLC, LINC) not shown here.Another notable feature illustrated in Figure 13 is the similarityof the response spectral shapes at a given site from thesetwo events. In such an examination it is important to note themarkedly different source locations of the two events, withthe Christchurch earthquake occurring to the southeast andthe Darfield earthquake approximately 30 km west of centralChristchurch. Hence, the source and path effects of the groundmotion at a single site are expected to be significantly differentin both events. For example, Figure 13C and 13D illustratethe similarity of response spectral shapes, for vibration periodsless than T = 2 s, of both horizontal and vertical groundmotion components at Riccarton (RHSC) and CanterburyAero Club (CACS), while Figure 14 illustrates the similaritiesat Papanui (PPHS) and Styx Mill (SMTC). At vibration periodslarger than T = 2 s, the aforementioned source effects fromthe Darfield earthquake become significant, and the responsespectral shapes at a given site from these two events deviate.These observations clearly point to the importance of localsite effects on surface ground motions, particularly at high tomoderate vibration frequencies, and hence the benefits thatcan be obtained via site-specific response analysis as opposedto simple soil classification (recall that most of the sites in theChristchurch basin are assigned as site class D (New ZealandStandards 1170.5 2004)). It should also be noted that the foursites discussed above, while experiencing significant groundmotions, are founded on soils that did not exhibit liquefaction.CONCLUSIONSThe 22 February 2011 M w 6.3 Christchurch earthquakeimposed severe ground motion intensities, which were in excessof the current seismic design spectra and those experienced inthe 4 September 2010 Darfield earthquake, over the majorityof the Christchurch region. The severe ground motion intensitiesresulted in significant nonlinear soil behavior and severeand widespread liquefaction, which were evident in recordedacceleration time histories.The deep Christchurch sedimentary basin likely led to awaveguide effect of seismic waves entering through its thickeningedge, which resulting in increased ground motion durationsand long-period amplitudes over the majority of Christchurch.Very large vertical accelerations were also recorded at nearsourcestations, in part due to the steeply dipping fault plane,which resulted in a large component of slip oriented vertically.In contrast, forward directivity effects were not significant overa wide region, presumably related to the relatively central locationof the inferred hypocenter along-strike and down-dip andthe oblique alignment of the slip and rupture front directions.The similarity of response-spectral shapes of the groundmotion observed at a single station resulting from theChristchurch and Darfield earthquakes, for which source andpath effects were largely different, also illustrated the significanceof site-specific response for short and moderate vibrationfrequencies.ACKNOWLEDGMENTSThe ground motion records utilized in this manuscript werefreely obtained from the GeoNet project. Discussions withJohn Beavan and John Berrill are greatly appreciated.864 Seismological Research Letters Volume 82, Number 6 November/December 2011
REFERENCESAagaard, B. T., J. F. Hall, and T. H. Heaton (2004). Effects of fault dipand slip rake angles on near-source ground motions: Why rupturedirectivity was minimal in the 1999 Chi-Chi, Taiwan, earthquake.Bulletin of the Seismological Society of America 94, 155–170.Abrahamson, N. A., and P. G. Somerville (1996). Effects of the hangingwall and footwall on ground motions recorded during theNorthridge earthquake. Bulletin of the Seismological Society ofAmerica 86, S93–99.Aoi, S., T. Kunugi, and H. Fujiwara (2008). Trampoline effect in extremeground motion. Science 322, 727–730.Beavan, J., E. J. Fielding, M. Motagh, S. Samsonov, and N. Donnelly(2011). Fault location and slip distribution of the 22 February 2011M W 6.2 Christchurch, New Zealand, earthquake from geodeticdata. Seismological Research Letters 82, 789–799.Bommer, J. J., and A. Martinez-Pereira (1999). The effective duration ofearthquake strong motion. Journal of Earthquake Engineering 3,127–172.Bozorgnia, Y., and K. W. Campbell (2004). The vertical-to-horizontalresponse spectral ratio and tentative procedures for developingsimplified V/H and vertical design spectra. Journal of EarthquakeEngineering 8, 175–207.Bradley, B. A. (2010). NZ-specific Pseudo-spectral Acceleration GroundMotion Prediction Equations Based on Foreign Models. Departmentof Civil and Natural Resources Engineering, University ofCanterbury, Christchurch, New Zealand, 324 pp.Brown, L. J., and J. H. Weeber (1992). Geology of the Christchurch UrbanArea. Institute of Geological and Nuclear Sciences map. LowerHutt, New Zealand: GNS Science.Chiou, B., R. Darragh, N. Gregor, and W. J. Silva (2008). NGA projectstrong-motion database. Earthquake Spectra 24, 23–44.Chiou, B. S. J., and R. R. Youngs (2008). An NGA model for the averagehorizontal component of peak ground motion and response spectra.Earthquake Spectra 24, 173–215.Choi, Y., J. P. Stewart, and R. W. Graves (2005). Empirical model forbasin effects accounts for basin depth and source location. Bulletinof the Seismological Society of America 95, 1,412–1,427.Cubrinovski, M., J. D. Bray, M. Taylor, S. Giorgini, B. A. Bradley, L.Wotherspoon, and J. Zupan (2011). Soil liquefaction effects in thecentral business district during the February 2011 Christchurchearthquake. Seismological Research Letters 82, 893–904.Cubrinovski, M., R. A. Green, J. Allen, S. A. Ashford, E. Bowman, B. A.Bradley, B. Cox, T. C. Hutchinson, E. Kavazanjian, R. P. Orense,M. Pender, M. Quigley, and L. Wotherspoon (2010). Geotechnicalreconnaissance of the 2010 Darfield (Canterbury) earthquake.Bulletin of the New Zealand Society for Earthquake Engineering 43,243–320.DeMets, C., R. G. Gordon, D. F. Argus, and S. Stein (1994). Effect ofrecent revisions to the geomagnetic time scale on estimates of currentplate motion. Geophysical Research Letters 21, 2,191–2,194.Douglas, J., and D. Boore (2010). High-frequency filtering of strongmotionrecords. Bulletin of Earthquake Engineering 9(2): 395–409.Graizer, V. M. (2005). Effect of tilt on strong motion data processing.Soil Dynamics and Earthquake Engineering 25, 197–204.New Zealand Police (2011). Christchurch earthquake: List of deceased;http://www.police.govt.nz/list-deceased. Last accessed June 20,2011.New Zealand Society for Earthquake Engineering (NZSEE) (2010).Preliminary observations of the 2010 Darfield (Canterbury)Earthquakes. Special issue, Bulletin of the New Zealand Society forEarthquake Engineering 43, 215–439.Shahi, S. K., and J. W. Baker (2011). An empirically calibrated frameworkfor including the effects of near-fault directivity in probabilisticseismic hazard analysis. Bulletin of the Seismological Society ofAmerica 101, 742–755.Silva, W. J. (1997). Characteristics of vertical strong ground motionsfor applications to engineering design. In Proceedings of theFHWA/NCEER Workshop on the National Representation ofSeismic Ground Motion for New and Existing Highway Facilities,Burlingame, CA. Technical Report NCEER-97-0010. Buffalo, NY:National Center for Earthquake Engineering Research.Standards New Zealand Standards (2004). Structural Design Actions,Part 5: Earthquake Actions—New Zealand. Wellington, NewZealand: Standards New Zealand, 82 pp.Somerville, P. G., K. Ikikura, R. W. Graves, S. Sawada, D. Wald, N. A.Abrahamson, Y. Iwasaki, T. Kagawa, N. Smith, and A. Kowada(1999). Characterizing crustal earthquake slip models for the predictionof strong ground motion. Seismological Research Letters 70,59–80.Stirling, M. W., M. Gerstenberger, N. Litchfield, G. H. McVerry, W. D.Smith, J. R. Pettinga, and P. Barnes (2007). Updated ProbabilisticSeismic Hazard Assessment for the Canterbury Region. GNS ScienceConsultancy Report 2007/232, ECan Report Number U06/6,58 pp.Sutherland, R., K. Berryman, and R. Norris (2006). Quaternary sliprate and geomorphology of the Alpine fault: Implications for kinematicsand seismic hazard in southwest New Zealand. GeologicalSociety of America Bulletin 118, 464–474.Yamada, M., J. Mori, and T. Heaton (2009). The slapdown phase in highaccelerationrecords of large earthquakes. Seismological ResearchLetters 80, 559–564.Zhao, J. X., and M. Gerstenberger (2010). Attenuation Models for RapidPost Earthquake Assessment in New Zealand. Wellington, NewZealand: Earthquake Commission New Zealand report.Department of Civil and Natural Resources EngineeringUniversity of CanterburyPrivate Bag 4800Christchurch, New Zealandbrendon.bradley@canterbury.ac.nz(B A. B.)Seismological Research Letters Volume 82, Number 6 November/December 2011 865
- Page 1:
Volume 82, Number 6 November/Decemb
- Page 7:
News and Notes (continued)Nominatio
- Page 11:
Preface to the Focused Issue on the
- Page 14 and 15:
TABLE 1Peak ground acceleration (PG
- Page 16 and 17:
▲▲Figure 2. A) Sketch of the
- Page 18 and 19:
▲▲Figure 4. A) Adopted moment r
- Page 20 and 21:
▲▲Figure 7. As in Figure 6 but
- Page 22 and 23:
▲ ▲ Figure 8. Misfit parameters
- Page 24 and 25:
▲ ▲ Figure 10. Spatial variabil
- Page 26 and 27:
▲ ▲ Figure 12. Standard spectra
- Page 28 and 29:
Quigley, M., R. Van Dissen, P. Vill
- Page 30 and 31:
slip on a 59-degree striking fault
- Page 32 and 33:
▲▲Figure 4. Convergence of inve
- Page 34 and 35:
observations and other source studi
- Page 36 and 37:
-42. 5-43. 0-43. 5-44. 0-44. 5-43.2
- Page 38 and 39:
“Product CSK © ASI, (ItalianSpac
- Page 40 and 41:
TABLE 2Solutions for fault location
- Page 42 and 43:
-43.45(A)degrees N-43.50-43.552.52.
- Page 44 and 45:
is still a good fit to the horizont
- Page 46 and 47:
Coulomb Stress Change Sensitivity d
- Page 48 and 49:
mation takes on a larger strike-sli
- Page 50 and 51:
P 9.4267BLDU45P 20.1213CASY39P 2.62
- Page 52 and 53:
ERMJNUMAJOINUJHJ2CBIJMIDWJOWYHNBTPU
- Page 54 and 55:
(A)6.146.13(B)6.246.36Misfit6.156.1
- Page 56 and 57:
(A)(B)(C)(D)▲▲Figure 10. The co
- Page 58 and 59:
(A)(B)(C)(D)▲▲Figure 12. The co
- Page 60 and 61: Luo, Y., Y. Tan, S. Wei, D. Helmber
- Page 62 and 63: −44˚00' −43˚00'4-Sep-2010Mw 7
- Page 64 and 65: TABLE 1Pairs of SAR imagery used in
- Page 67 and 68: Depth (km)Coulomb Stress Change(bar
- Page 69 and 70: Crippen, R. E. (1992). Measurement
- Page 71 and 72: AlpineFaultHope Fault38 mm/yr0+ +-1
- Page 73 and 74: σ 1dσ 3Nuσ 3CM w 7.1dw 6.2u70°M
- Page 75 and 76: Right-lateral Faults(A) Range Front
- Page 77 and 78: DISCUSSIONThe 2010-2011 Canterbury
- Page 79 and 80: Large Apparent Stresses from the Ca
- Page 81 and 82: ▲ ▲ Figure 2. Observed vs. pred
- Page 83 and 84: 10Obs SA(1s)AS1AS+SDAB 2006AB+SDSA(
- Page 85 and 86: Fine-scale Relocation of Aftershock
- Page 87 and 88: −43.25°OXZ0 10 20km−43.5°−4
- Page 89 and 90: A’0 km 4 8−43.5°B’B−43.6°
- Page 91 and 92: REFERENCESAvery, H. R., J. B. Berri
- Page 93 and 94: ▲ ▲ Figure 2. A) shows three-co
- Page 95 and 96: ▲ ▲ Figure 4. Vertical accelera
- Page 97 and 98: 0.8PRPC Z0.40Normalized (Max PGA +
- Page 99 and 100: Near-source Strong Ground MotionsOb
- Page 101 and 102: (A)Magnitude, M w876542009 NZdataba
- Page 103 and 104: Scale0.5 g5 seconds▲▲Figure 4.
- Page 105 and 106: (A)(B)Spectral Acc, Sa (g)North/Wes
- Page 107 and 108: Vertical-to-horizontal PGA ratio543
- Page 109: (A)(B)Station:CCCCSolid:AvgHorizDas
- Page 113 and 114: ▲ ▲ Figure 1. Shear-wave veloci
- Page 115 and 116: Spectral Acceleration (0.3 s), (g)I
- Page 117 and 118: Spectral Acceleration (3 s), (g)In[
- Page 119 and 120: TABLE 1Mean (μ LLH ) and standard
- Page 121 and 122: Strong Ground Motions and Damage Co
- Page 123 and 124: ings and the Modified Takeda-Slip M
- Page 125 and 126: high, but there were no buildings d
- Page 127 and 128: REFERENCES▲▲Figure 8. Heavily d
- Page 129 and 130: (A)(B)(C)(D)(E)▲▲Figure 1. A) M
- Page 131 and 132: (A) (B) (C)▲ ▲ Figure 3. A) Typ
- Page 133 and 134: (A) (B) (C)▲ ▲ Figure 4. A) Typ
- Page 135 and 136: Case StudyKey ParametersTABLE 1Key
- Page 137 and 138: ▲ ▲ Figure 9. Representative bu
- Page 139 and 140: Soil Liquefaction Effects in the Ce
- Page 141 and 142: ▲ ▲ Figure 2. Representative su
- Page 143 and 144: Location of structures illustrated
- Page 145 and 146: Shading indicates areaover which pr
- Page 147 and 148: 1.8 deg15 cmGround cracking due to
- Page 149 and 150: 30 cm17 cm30 cmFoundation beam▲
- Page 151 and 152: Comparison of Liquefaction Features
- Page 153 and 154: (A)(B)▲▲Figure 2. A) Simplified
- Page 155 and 156: (A)Acceleration (Gal)6004002000-200
- Page 157 and 158: (A)(B)▲▲Figure 7. Distribution
- Page 159 and 160: (A)(B)▲▲Figure 10. Damage to a
- Page 161 and 162:
(A)(B)▲ ▲ Figure 14. A) Subside
- Page 163 and 164:
▲▲Figure 17. A trench in a resi
- Page 165 and 166:
Ambient Noise Measurements followin
- Page 167 and 168:
▲▲Figure 1. Location of the noi
- Page 169 and 170:
▲▲Figure 5. Site N20 showing HV
- Page 171 and 172:
▲▲Figure 8. Comparison between
- Page 173 and 174:
Use of DCP and SASW Tests to Evalua
- Page 175 and 176:
▲ ▲ Figure 2. Aerial image of C
- Page 177 and 178:
(A)(B)▲▲Figure 4. DCP test bein
- Page 179 and 180:
▲▲Figure 7. SASW setup at a sit
- Page 181 and 182:
where X ~ N(μ X , σ X 2 ) is shor
- Page 183 and 184:
Using the same critical layers as s
- Page 185 and 186:
Performance of Levees (Stopbanks) d
- Page 187 and 188:
▲▲Figure 3. Typical geometry an
- Page 189 and 190:
TABLE 1Damage severity categories (
- Page 191 and 192:
(A)(B)▲▲Figure 6. A) Large sand
- Page 193 and 194:
(A)(B)▲▲Figure 8. A) Representa
- Page 195 and 196:
each of the Waimakariri River and a
- Page 197 and 198:
▲ ▲ Figure 2. Horizontal peak g
- Page 199 and 200:
only minor damage, mostly to their
- Page 201 and 202:
(A)(C)(B)▲▲Figure 5. Ferrymead
- Page 203 and 204:
(A)(B)▲▲Figure 7. Damage to sou
- Page 205 and 206:
(A)(B)▲▲Figure 11. Settlement o
- Page 207 and 208:
(A)(C)(B)▲▲Figure 14. Railway B
- Page 209 and 210:
Events Reconnaissance (GEER) Associ
- Page 211 and 212:
New PublicationsCanGeoRefThe Americ
- Page 213 and 214:
Wednesday, 18 AprilTechnical Sessio
- Page 215 and 216:
Verification of a Spectral-Element
- Page 217 and 218:
EASTERN SECTIONRESEARCH LETTERSReas
- Page 219 and 220:
(A)70°N100°W 60°W70°N(B)100°E1
- Page 221 and 222:
Mongolia SCRThe presence or absence
- Page 223 and 224:
the small horizontal relative motio
- Page 225 and 226:
80°100°120°140°EXPLANATIONBorde
- Page 227 and 228:
Chang, K. H. (1997). Korean peninsu
- Page 229 and 230:
Wheeler, R. L. (2008). Paleoseismic
- Page 231 and 232:
A significant outcome of this study
- Page 233 and 234:
TABLE 1 (continued)Earthquakes for
- Page 235 and 236:
▲▲Figure 2. Earthquakes used in
- Page 237 and 238:
Meeting CalendarM E E T I N GC A L
- Page 239 and 240:
201 Plaza Professional Bldg. • El
- Page 241 and 242:
Seismological Research Letters (SRL
- Page 243 and 244:
Christa von Hillebrandt-Andrade, Pr