Here - Stuff
Here - Stuff Here - Stuff
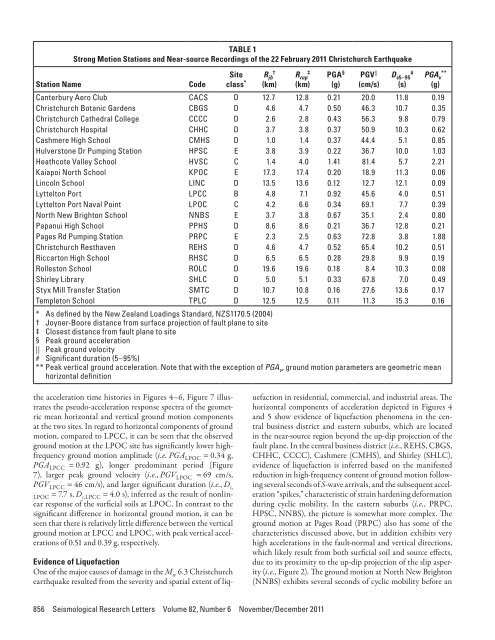
Station NameTABLE 1Strong Motion Stations and Near-source Recordings of the 22 February 2011 Christchurch EarthquakeCodeSiteclass * R jb†(km)R rup‡(km)PGA §(g)PGV ||(cm/s)D s5–95#(s)PGA v**(g)Canterbury Aero Club CACS D 12.7 12.8 0.21 20.0 11.8 0.19Christchurch Botanic Gardens CBGS D 4.6 4.7 0.50 46.3 10.7 0.35Christchurch Cathedral College CCCC D 2.6 2.8 0.43 56.3 9.8 0.79Christchurch Hospital CHHC D 3.7 3.8 0.37 50.9 10.3 0.62Cashmere High School CMHS D 1.0 1.4 0.37 44.4 5.1 0.85Hulverstone Dr Pumping Station HPSC E 3.8 3.9 0.22 36.7 10.0 1.03Heathcote Valley School HVSC C 1.4 4.0 1.41 81.4 5.7 2.21Kaiapoi North School KPOC E 17.3 17.4 0.20 18.9 11.3 0.06Lincoln School LINC D 13.5 13.6 0.12 12.7 12.1 0.09Lyttelton Port LPCC B 4.8 7.1 0.92 45.6 4.0 0.51Lyttelton Port Naval Point LPOC C 4.2 6.6 0.34 69.1 7.7 0.39North New Brighton School NNBS E 3.7 3.8 0.67 35.1 2.4 0.80Papanui High School PPHS D 8.6 8.6 0.21 36.7 12.8 0.21Pages Rd Pumping Station PRPC E 2.3 2.5 0.63 72.8 3.8 1.88Christchurch Resthaven REHS D 4.6 4.7 0.52 65.4 10.2 0.51Riccarton High School RHSC D 6.5 6.5 0.28 29.8 9.9 0.19Rolleston School ROLC D 19.6 19.6 0.18 8.4 10.3 0.08Shirley Library SHLC D 5.0 5.1 0.33 67.8 7.0 0.49Styx Mill Transfer Station SMTC D 10.7 10.8 0.16 27.6 13.6 0.17Templeton School TPLC D 12.5 12.5 0.11 11.3 15.3 0.16* As defined by the New Zealand Loadings Standard, NZS1170.5 (2004)† Joyner-Boore distance from surface projection of fault plane to site‡ Closest distance from fault plane to site§ Peak ground acceleration|| Peak ground velocity# Significant duration (5–95%)** Peak vertical ground acceleration. Note that with the exception of PGA v , ground motion parameters are geometric meanhorizontal definitionthe acceleration time histories in Figures 4–6, Figure 7 illustratesthe pseudo-acceleration response spectra of the geometricmean horizontal and vertical ground motion componentsat the two sites. In regard to horizontal components of groundmotion, compared to LPCC, it can be seen that the observedground motion at the LPOC site has significantly lower highfrequencyground motion amplitude (i.e. PGA LPOC = 0.34 g,PGA LPCC = 0.92 g), longer predominant period (Figure7), larger peak ground velocity (i.e., PGV LPOC = 69 cm/s,PGV LPCC = 46 cm/s), and larger significant duration (i.e., D s,LPOC = 7.7 s, D s,LPCC = 4.0 s), inferred as the result of nonlinearresponse of the surficial soils at LPOC. In contrast to thesignificant difference in horizontal ground motion, it can beseen that there is relatively little difference between the verticalground motion at LPCC and LPOC, with peak vertical accelerationsof 0.51 and 0.39 g, respectively.Evidence of LiquefactionOne of the major causes of damage in the M w 6.3 Christchurchearthquake resulted from the severity and spatial extent of liquefactionin residential, commercial, and industrial areas. Thehorizontal components of acceleration depicted in Figures 4and 5 show evidence of liquefaction phenomena in the centralbusiness district and eastern suburbs, which are locatedin the near-source region beyond the up-dip projection of thefault plane. In the central business district (i.e., REHS, CBGS,CHHC, CCCC), Cashmere (CMHS), and Shirley (SHLC),evidence of liquefaction is inferred based on the manifestedreduction in high-frequency content of ground motion followingseveral seconds of S-wave arrivals, and the subsequent acceleration“spikes,” characteristic of strain hardening deformationduring cyclic mobility. In the eastern suburbs (i.e., PRPC,HPSC, NNBS), the picture is somewhat more complex. Theground motion at Pages Road (PRPC) also has some of thecharacteristics discussed above, but in addition exhibits veryhigh accelerations in the fault-normal and vertical directions,which likely result from both surficial soil and source effects,due to its proximity to the up-dip projection of the slip asperity(i.e., Figure 2). The ground motion at North New Brighton(NNBS) exhibits several seconds of cyclic mobility before an856 Seismological Research Letters Volume 82, Number 6 November/December 2011
Scale0.5 g5 seconds▲▲Figure 4. Observed fault-normal horizontal acceleration time histories at various locations in the Christchurch region from the 22February earthquake.Scale0.5 g5 seconds▲ ▲ Figure 5. Observed fault-parallel horizontal acceleration time histories at various locations in the Christchurch region from the 22February earthquake.Seismological Research Letters Volume 82, Number 6 November/December 2011 857
- Page 52 and 53: ERMJNUMAJOINUJHJ2CBIJMIDWJOWYHNBTPU
- Page 54 and 55: (A)6.146.13(B)6.246.36Misfit6.156.1
- Page 56 and 57: (A)(B)(C)(D)▲▲Figure 10. The co
- Page 58 and 59: (A)(B)(C)(D)▲▲Figure 12. The co
- Page 60 and 61: Luo, Y., Y. Tan, S. Wei, D. Helmber
- Page 62 and 63: −44˚00' −43˚00'4-Sep-2010Mw 7
- Page 64 and 65: TABLE 1Pairs of SAR imagery used in
- Page 67 and 68: Depth (km)Coulomb Stress Change(bar
- Page 69 and 70: Crippen, R. E. (1992). Measurement
- Page 71 and 72: AlpineFaultHope Fault38 mm/yr0+ +-1
- Page 73 and 74: σ 1dσ 3Nuσ 3CM w 7.1dw 6.2u70°M
- Page 75 and 76: Right-lateral Faults(A) Range Front
- Page 77 and 78: DISCUSSIONThe 2010-2011 Canterbury
- Page 79 and 80: Large Apparent Stresses from the Ca
- Page 81 and 82: ▲ ▲ Figure 2. Observed vs. pred
- Page 83 and 84: 10Obs SA(1s)AS1AS+SDAB 2006AB+SDSA(
- Page 85 and 86: Fine-scale Relocation of Aftershock
- Page 87 and 88: −43.25°OXZ0 10 20km−43.5°−4
- Page 89 and 90: A’0 km 4 8−43.5°B’B−43.6°
- Page 91 and 92: REFERENCESAvery, H. R., J. B. Berri
- Page 93 and 94: ▲ ▲ Figure 2. A) shows three-co
- Page 95 and 96: ▲ ▲ Figure 4. Vertical accelera
- Page 97 and 98: 0.8PRPC Z0.40Normalized (Max PGA +
- Page 99 and 100: Near-source Strong Ground MotionsOb
- Page 101: (A)Magnitude, M w876542009 NZdataba
- Page 105 and 106: (A)(B)Spectral Acc, Sa (g)North/Wes
- Page 107 and 108: Vertical-to-horizontal PGA ratio543
- Page 109 and 110: (A)(B)Station:CCCCSolid:AvgHorizDas
- Page 111 and 112: REFERENCESAagaard, B. T., J. F. Hal
- Page 113 and 114: ▲ ▲ Figure 1. Shear-wave veloci
- Page 115 and 116: Spectral Acceleration (0.3 s), (g)I
- Page 117 and 118: Spectral Acceleration (3 s), (g)In[
- Page 119 and 120: TABLE 1Mean (μ LLH ) and standard
- Page 121 and 122: Strong Ground Motions and Damage Co
- Page 123 and 124: ings and the Modified Takeda-Slip M
- Page 125 and 126: high, but there were no buildings d
- Page 127 and 128: REFERENCES▲▲Figure 8. Heavily d
- Page 129 and 130: (A)(B)(C)(D)(E)▲▲Figure 1. A) M
- Page 131 and 132: (A) (B) (C)▲ ▲ Figure 3. A) Typ
- Page 133 and 134: (A) (B) (C)▲ ▲ Figure 4. A) Typ
- Page 135 and 136: Case StudyKey ParametersTABLE 1Key
- Page 137 and 138: ▲ ▲ Figure 9. Representative bu
- Page 139 and 140: Soil Liquefaction Effects in the Ce
- Page 141 and 142: ▲ ▲ Figure 2. Representative su
- Page 143 and 144: Location of structures illustrated
- Page 145 and 146: Shading indicates areaover which pr
- Page 147 and 148: 1.8 deg15 cmGround cracking due to
- Page 149 and 150: 30 cm17 cm30 cmFoundation beam▲
- Page 151 and 152: Comparison of Liquefaction Features
Station NameTABLE 1Strong Motion Stations and Near-source Recordings of the 22 February 2011 Christchurch EarthquakeCodeSiteclass * R jb†(km)R rup‡(km)PGA §(g)PGV ||(cm/s)D s5–95#(s)PGA v**(g)Canterbury Aero Club CACS D 12.7 12.8 0.21 20.0 11.8 0.19Christchurch Botanic Gardens CBGS D 4.6 4.7 0.50 46.3 10.7 0.35Christchurch Cathedral College CCCC D 2.6 2.8 0.43 56.3 9.8 0.79Christchurch Hospital CHHC D 3.7 3.8 0.37 50.9 10.3 0.62Cashmere High School CMHS D 1.0 1.4 0.37 44.4 5.1 0.85Hulverstone Dr Pumping Station HPSC E 3.8 3.9 0.22 36.7 10.0 1.03Heathcote Valley School HVSC C 1.4 4.0 1.41 81.4 5.7 2.21Kaiapoi North School KPOC E 17.3 17.4 0.20 18.9 11.3 0.06Lincoln School LINC D 13.5 13.6 0.12 12.7 12.1 0.09Lyttelton Port LPCC B 4.8 7.1 0.92 45.6 4.0 0.51Lyttelton Port Naval Point LPOC C 4.2 6.6 0.34 69.1 7.7 0.39North New Brighton School NNBS E 3.7 3.8 0.67 35.1 2.4 0.80Papanui High School PPHS D 8.6 8.6 0.21 36.7 12.8 0.21Pages Rd Pumping Station PRPC E 2.3 2.5 0.63 72.8 3.8 1.88Christchurch Resthaven REHS D 4.6 4.7 0.52 65.4 10.2 0.51Riccarton High School RHSC D 6.5 6.5 0.28 29.8 9.9 0.19Rolleston School ROLC D 19.6 19.6 0.18 8.4 10.3 0.08Shirley Library SHLC D 5.0 5.1 0.33 67.8 7.0 0.49Styx Mill Transfer Station SMTC D 10.7 10.8 0.16 27.6 13.6 0.17Templeton School TPLC D 12.5 12.5 0.11 11.3 15.3 0.16* As defined by the New Zealand Loadings Standard, NZS1170.5 (2004)† Joyner-Boore distance from surface projection of fault plane to site‡ Closest distance from fault plane to site§ Peak ground acceleration|| Peak ground velocity# Significant duration (5–95%)** Peak vertical ground acceleration. Note that with the exception of PGA v , ground motion parameters are geometric meanhorizontal definitionthe acceleration time histories in Figures 4–6, Figure 7 illustratesthe pseudo-acceleration response spectra of the geometricmean horizontal and vertical ground motion componentsat the two sites. In regard to horizontal components of groundmotion, compared to LPCC, it can be seen that the observedground motion at the LPOC site has significantly lower highfrequencyground motion amplitude (i.e. PGA LPOC = 0.34 g,PGA LPCC = 0.92 g), longer predominant period (Figure7), larger peak ground velocity (i.e., PGV LPOC = 69 cm/s,PGV LPCC = 46 cm/s), and larger significant duration (i.e., D s,LPOC = 7.7 s, D s,LPCC = 4.0 s), inferred as the result of nonlinearresponse of the surficial soils at LPOC. In contrast to thesignificant difference in horizontal ground motion, it can beseen that there is relatively little difference between the verticalground motion at LPCC and LPOC, with peak vertical accelerationsof 0.51 and 0.39 g, respectively.Evidence of LiquefactionOne of the major causes of damage in the M w 6.3 Christchurchearthquake resulted from the severity and spatial extent of liquefactionin residential, commercial, and industrial areas. Thehorizontal components of acceleration depicted in Figures 4and 5 show evidence of liquefaction phenomena in the centralbusiness district and eastern suburbs, which are locatedin the near-source region beyond the up-dip projection of thefault plane. In the central business district (i.e., REHS, CBGS,CHHC, CCCC), Cashmere (CMHS), and Shirley (SHLC),evidence of liquefaction is inferred based on the manifestedreduction in high-frequency content of ground motion followingseveral seconds of S-wave arrivals, and the subsequent acceleration“spikes,” characteristic of strain hardening deformationduring cyclic mobility. In the eastern suburbs (i.e., PRPC,HPSC, NNBS), the picture is somewhat more complex. Theground motion at Pages Road (PRPC) also has some of thecharacteristics discussed above, but in addition exhibits veryhigh accelerations in the fault-normal and vertical directions,which likely result from both surficial soil and source effects,due to its proximity to the up-dip projection of the slip asperity(i.e., Figure 2). The ground motion at North New Brighton(NNBS) exhibits several seconds of cyclic mobility before an856 Seismological Research Letters Volume 82, Number 6 November/December 2011


