Fishery Management Plan - NC Dept. of Environment and Natural ...
Fishery Management Plan - NC Dept. of Environment and Natural ...
Fishery Management Plan - NC Dept. of Environment and Natural ...
- No tags were found...

You also want an ePaper? Increase the reach of your titles
YUMPU automatically turns print PDFs into web optimized ePapers that Google loves.
North Carolina<strong>Fishery</strong> <strong>Management</strong> <strong>Plan</strong>EstuarineStriped BassAlbemarle Sound AreaCentral/Southern AreaMay 2004
Blockages <strong>of</strong> Historical Spawning Habitat……………………. 162Entrainment <strong>and</strong> Impingement <strong>of</strong> Eggs <strong>and</strong> Larvae…………. 165Water Quality Concerns…………………………………………………. 168Catch <strong>and</strong> Release Mortality in the Hook <strong>and</strong> Line Fisheries……….. 174Enforcement <strong>of</strong> Creel Limits in the Vicinity <strong>of</strong> Inl<strong>and</strong>/JointOr Coastal Boundaries……………………………………………………. 180Albemarle Sound <strong>Management</strong> Area Boundary Line………………… 182Issues Relative to the A/R Striped Bass Stock………………………………… 187Stock Structure……………………………………………………………. 187Biological Reference Points……………………………………… 187Fishing Mortality…………………………………………………………… 197Discard Mortality <strong>of</strong> Striped Bass in the Multi-speciesGill Net <strong>Fishery</strong> ASMA……………….……………………………. 197Harvest <strong>Management</strong> 221<strong>Management</strong> <strong>of</strong> Quotas <strong>and</strong> Harvest Targets in the ASMA….. 221Recreational Striped Bass Harvest Closure-OregonInlet/Atlantic Ocean………………………………………………. 226Issues Relative to the C/S Striped Bass Stocks………………………………. 227Stock Structure……………………………………………………………. 227Biological Reference Points……………………………………… 227Striped Bass Stocking Coastal Rivers…… 235Fishing Mortality…………………………………………………………… 243Catch Curve Exploitation Estimates - Neuse <strong>and</strong> Tar River 243Discard Mortality <strong>of</strong> Striped Bass from Set Gill Nets 275RECOMMENDED MANAGEMENT PROGRAM AND RESEARCH NEEDS………. 299Goals <strong>and</strong> Objectives…………………………………………………………….. 299Optimum Yield…………………………………………………………………….. 299North Carolina Coastal Stocks………………………………………………….. 301Critical Habitat-Spawning <strong>and</strong> Nursery Areas…………………………. 302Blockages <strong>of</strong> Historical Habitat………………………………………….. 302Entrainment <strong>and</strong> Impingement <strong>of</strong> Eggs <strong>and</strong> Larvae………………….. 303<strong>Management</strong> Strategies…………………………………………………. 304Catch <strong>and</strong> Release Mortality in Hook <strong>and</strong> Line Fisheries……. 304Enforcement <strong>of</strong> Creel Limits in the Vicinity <strong>of</strong> Inl<strong>and</strong>/Joint orCoastal Boundaries………………………………………………. 305Albemarle/Roanoke <strong>Management</strong> Area…………………. 306Central/Southern <strong>Management</strong> Area (CSMA)…………………. 307Research Needs Summary………………………………………………………. 309<strong>NC</strong> Coastal Striped Bass Stocks………………………………………… 309A/R Striped Bass Stock………………………………. 312C/S Striped Bass Stocks…………………………………………… 313LITERATURE CITED……………………………………………………………………… 315APPENDICES: Appendix 1- L<strong>and</strong>ings………………………………………………….. 338Appendix 2- Historical Regulations…………………………………………….. 345Appendix 3- Regulations………………………………………………………… 347Appendix 4- Proposed Rule Changes…………………………………………. 3706
3.0 EXECUTIVE SUMMARYThere are two geographic management units for the North Carolina Estuarine StripedBass <strong>Fishery</strong> <strong>Management</strong> <strong>Plan</strong> (FMP). The northern management unit includes theAlbemarle Sound <strong>Management</strong> Area (ASMA)- which includes Albemarle Sound <strong>and</strong>all its Joint <strong>and</strong> Inl<strong>and</strong> water tributaries, (except for the Roanoke, Middle, Eastmost <strong>and</strong>Cashie rivers), Currituck, Roanoke <strong>and</strong> Croatan sounds <strong>and</strong> all their Joint <strong>and</strong> Inl<strong>and</strong>water tributaries, including Oregon Inlet, north <strong>of</strong> a line from Roanoke Marshes Pointacross to the north point <strong>of</strong> Eagle Nest Bay <strong>and</strong> the Roanoke River <strong>Management</strong> Area(RRMA)- Roanoke River <strong>and</strong> its Joint <strong>and</strong> Inl<strong>and</strong> water tributaries, including Middle,Eastmost <strong>and</strong> Cashie rivers, up to the Roanoke Rapids Dam. <strong>Management</strong> <strong>of</strong> stripedbass within the ASMA is the responsibility <strong>of</strong> the North Carolina Marine FisheriesCommission (MFC) <strong>and</strong> within the RRMA, is the responsibility <strong>of</strong> the North CarolinaWildlife Resources Commission (WRC). The striped bass stock in these two harvestmanagement areas is referred to as the Albemarle Sound/Roanoke River (A/R) stock.The southern geographic management unit is the Central/Southern <strong>Management</strong>Area (CSMA) <strong>and</strong> includes all internal Coastal, Joint <strong>and</strong> contiguous Inl<strong>and</strong> waters <strong>of</strong>North Carolina south <strong>of</strong> a line from Roanoke Marshes Point across to Eagle Nest Bay inDare County, to the South Carolina state line. These stocks are referred to as theCentral/Southern (C/S) stocks.Stock StatusA/R StockIn 1997, the A/R striped bass stock was declared by the Atlantic States MarineFisheries Commission (ASMFC) to be restored. Annual population abundance hasincreased sharply from a low <strong>of</strong> 195,000 fish in 1988 to over 2 million fish in 1999. Thepopulation abundance is currently stabilizing at around 2 million fish. Recruitment <strong>of</strong>age 1 fish has been above the long-term average for 8 <strong>of</strong> the last 9 years. Since 1993fishing mortality has varied between 0.13 <strong>and</strong> 0.60 <strong>and</strong> has averaged 0.30. The 2001estimate <strong>of</strong> fishing mortality <strong>of</strong> F=0.13 on ages 3-7 is below the target for these ages (Ftarget =0.28). Spawning stock biomass (total weight <strong>of</strong> sexually mature females in thepopulation) was approximately 600,000 pounds in 1998, <strong>and</strong> has since increased to 1.6million pounds in 2001. Population age structure is exp<strong>and</strong>ing. Age 8 <strong>and</strong> older fishwere nearly absent from the population between 1990 <strong>and</strong> 1994; since 1997conservation measures have resulted in a continuously increasing proportion <strong>of</strong> olderfish in the population.C/S StocksAvailable data are inadequate to estimate the population size for any <strong>of</strong> the C/S stripedbass stocks. Rates <strong>of</strong> total <strong>and</strong> fishing mortality for the Neuse <strong>and</strong> Tar river stocks,estimated from fishery independent sampling indicate that fishing mortality rates for bothstocks are excessive. For the Neuse River stock, the rate <strong>of</strong> fishing mortality wasestimated to be 0.84 <strong>and</strong> for the Tar River, 1.02. These fishing mortality rates aresubstantially higher than those required for population recovery to occur, therefore over7
occur as bycatch <strong>of</strong> the American shad fishery. Since 1994, the average Cape FearRiver l<strong>and</strong>ings were approximately 1,300 pounds.Commercial Discard/Bycatch MortalityThe total striped bass discard estimate for Pamlico Sound <strong>and</strong> the adjacent rivers, usingdata from 2000 <strong>and</strong> 2001, is approximately 94,000 lbs. In Pamlico Sound small meshgill nets accounted for 78.9% <strong>of</strong> the total striped bass discards for the area. Large meshgill nets in the Pamlico <strong>and</strong> Neuse rivers accounted for 81.4% <strong>of</strong> the discards. Thisestimate is based on the best available data <strong>and</strong> will need to be refined through futurestudies.Recreational FisheriesEarly in the 20 th century interest in hook <strong>and</strong> line striped bass fishing began to increase.As recovery <strong>of</strong> the A/R stock continued into the late 1990s, a tremendous increase inrecreational effort for striped bass occurred. Taking <strong>and</strong> possession <strong>of</strong> striped bassusing hook <strong>and</strong> line in coastal North Carolina is regulated by the WRC in designatedInl<strong>and</strong> Waters, jointly by the WRC <strong>and</strong> MFC in designated Joint Waters <strong>and</strong> by the MFCin designated Coastal Waters.Roanoke RiverIn 1988, WRC began monitoring striped bass harvest in the Roanoke River with creelsurveys during the spring months. <strong>Management</strong> <strong>of</strong> recreational striped bass harvest byTAC began in 1991, with an allocation <strong>of</strong> 29,400 lbs. From 1991-1997, the annual TACremained static. Since 1998, four TAC increases have occurred with the 2003allocation being 137,500 lbs. The WRC opened <strong>and</strong> closed the harvest season from1991 through 2001 by proclamation authority <strong>of</strong> the Executive Director. In 2002, theWRC decreased the daily creel limit from three to two fish, but set a 46-day season inthe lower river <strong>and</strong> a 46-day season in the upper river, <strong>and</strong> allowed possession sevendays per week. WRC continues to monitor harvest, size, age <strong>and</strong> sex composition <strong>of</strong>striped bass caught in RRMA through an annual creel survey.Albemarle Sound AreaIn 1991, DMF began management <strong>of</strong> the 29,400 lb. striped bass TAC through a creelsurvey. The TAC was split between a spring <strong>and</strong> fall season. Season, harvest days,creel <strong>and</strong> size limits were established by proclamation authority <strong>of</strong> the FisheriesDirector. The annual TAC remained static for 1991-1997. Since 1998, the TAC hasincreased four times, with the 2003 allocation being 137,500 lbs. The DMF continues toconduct creel surveys when the recreational season is open to determine harvestestimates.C/S AreaLimited information exists on the recreational fisheries in the Tar-Pamlico, Neuse <strong>and</strong>Cape Fear rivers. Although estimates <strong>of</strong> recreational striped bass harvest from thePamlico Sound are not available, WRC <strong>and</strong> DMF staffs believe it could be substantial,especially in northern Pamlico Sound.9
Guided Fishing for Striped BassSince recovery <strong>of</strong> the A/R stock <strong>and</strong> the Atlantic Migratory Stock, striped bass hasbecome one <strong>of</strong> the major species targeted in the guided recreational fishery. Duringearly 2002, nearly 315 for-hire vessels were identified as operating in <strong>NC</strong> coastalwaters, representing a 37% increase from the three prior years. Though many <strong>of</strong> thesevessels pursue a variety <strong>of</strong> species, a growing number target striped bass. Annualsales <strong>of</strong> WRC Guide Licenses have increased steadily from 292 in 1987 to 970 in 2002.Due to the WRC guide’s licenses being a combination hunting/fishing, it is not possibleto determine the exact proportion <strong>of</strong> the increase sales that is attributable to fishingguides only.<strong>Management</strong> GoalsThe goal <strong>of</strong> the <strong>NC</strong> Estuarine Striped Bass FMP is to manage estuarine populationsthrough science based decision-making processes that conserve adequate spawningstock <strong>and</strong> protect the integrity <strong>of</strong> critical habitats. The plan will consider biological,social, <strong>and</strong> economic factors in management <strong>of</strong> the fisheries. The plan will be adaptive,involving regular reviews <strong>and</strong> responding to new information regarding any aspect <strong>of</strong> theplan.<strong>Management</strong> Objectives1. Identify <strong>and</strong> describe population attributes necessary to sustain long-term stockviability.2. Protect, restore <strong>and</strong> enhance spawning <strong>and</strong> nursery area habitat <strong>and</strong>environmental quality to increase growth, survival <strong>and</strong> reproduction.3. Manage the fishery in a manner to sustain long-term stock viability, traditionalharvest <strong>and</strong> prevent overfishing.4. Initiate, enhance <strong>and</strong>/or continue programs to collect <strong>and</strong> analyze biological,social, economic, fishery, essential habitat <strong>and</strong> environmental data needed toeffectively monitor <strong>and</strong> manage the fishery.5. Develop an information program to educate the public <strong>and</strong> elevate awareness <strong>of</strong>the causes <strong>and</strong> nature <strong>of</strong> problems in the striped bass stocks, habitat <strong>and</strong>fisheries <strong>and</strong> explain the rationale for management efforts to solve theseproblems.6. Develop regulations that provide adequate resource protection, optimize yieldfrom the fishery, <strong>and</strong> consider the needs <strong>of</strong> all user groups.7. Promote practices that minimize bycatch <strong>and</strong> discard mortality in recreational <strong>and</strong>commercial fisheries.Optimum Yield (OY)ASMAOptimum yield is defined as that yield provided by exploiting the stock at the targetexploitation rate as determined from the most recent stock assessment. The stock iscurrently managed with a TAC that is analogous to OY. The TAC for 2003 wasconservatively established at 550,000 lbs. based on a target reference point <strong>of</strong> F=0.25.The target reference point recommended by the A/R Advisory Committee is F=0.22.10
CSMAOY is defined as the yield achieved by exploiting the stock at the target exploitation rate.OY as defined for the CSMA differs slightly from that for the ASMA in that a value forOY is not predetermined. The lack <strong>of</strong> data on the commercial <strong>and</strong> recreational fisheriesprevents development <strong>of</strong> a quantitative assessment <strong>of</strong> stock abundance. Therefore, noprojections <strong>of</strong> stock abundance <strong>and</strong> total catch rates are available for the CSMA <strong>and</strong> OYcannot be estimated numerically in advance. Until data for a complete assessment <strong>of</strong>these stocks are available, the only recourse is to manage based on exploitation rates.<strong>Management</strong> Issues <strong>and</strong> Proposed ActionsThe following striped bass management issues <strong>and</strong> options were developed through theFMP process, by DMF <strong>and</strong> WRC through cooperation <strong>and</strong> advice solicited from the A/R<strong>and</strong> C/S Advisory Committees, the public, MFC, Finfish <strong>and</strong> Regional Advisorycommittees, as well as the scientific community. In order to achieve the desired goals<strong>of</strong> the FMP, the MFC <strong>and</strong> WRC, after taking into account the advice <strong>and</strong> commentsfrom the various participants on this plan, has selected the preferred managementoptions on the management issues.The management issues <strong>and</strong> proposed actions are divided as follows: (1) Issuesrelative to North Carolina coastal stocks in general, (2) Issues specific to the A/R stock<strong>and</strong> (3) Issues specific to the C/S stocks.General <strong>NC</strong> Coastal Striped Bass Stock IssuesWater Flow• Rivers with presently unregulated flows work with state water resource authorities tosecure commitments for preservation <strong>of</strong> unaltered flow regimes.• Rivers currently regulated to such a degree that flow patterns depart significantlyfrom unregulated conditions, establish a recommended annual flow regime forstriped bass spawning <strong>and</strong> nursery areas, <strong>and</strong> work with appropriate regulatoryagencies to secure commitments for preservation <strong>of</strong> such regimes.• Require Division <strong>of</strong> Water Resources (DWR) to include Division <strong>of</strong> Water Quality(DWQ), WRC, DMF <strong>and</strong> US Fish <strong>and</strong> Wildlife Service (FWS) in water supplyplanning process <strong>and</strong> future allocation negotiations.• Neuse River- support removal <strong>of</strong> Milburnie Dam, to provide flexibility for flowmanagement.• Pee Dee River- participate (FWS <strong>and</strong> WRC, in cooperation with SC agencies) in relicensing<strong>of</strong> hydropower dams, to obtain adequate flow releases for downstreamhabitats.Critical Habitat• Adopt into rules, measures to protect identified anadromous spawning <strong>and</strong> nurseryareas for striped bass.• Advocate stronger enforcement <strong>of</strong> regulations protecting critical habitat in themanagement areas.11
• Purchase l<strong>and</strong> adjacent to critical striped bass habitat areas to ensure protection.• Continue to make recommendations on all state, federal <strong>and</strong> local permits whereapplicable to require avoidance <strong>of</strong> activities detrimental to critical striped basshabitats.• Support implementation <strong>of</strong> habitat recommendations <strong>of</strong> Albemarle-Pamlico EstuarineStudy (APES), Estuarine Shoreline Protection Stakeholders Report, <strong>and</strong> CoastalHabitat Protection Programs (CHPP).• Maintain, restore <strong>and</strong> improve habitat to increase growth, survival <strong>and</strong> reproduction<strong>of</strong> striped bass. Monies from the Clean Water Trust Fund <strong>and</strong> others should beutilized for this.Blockages <strong>of</strong> Historical Habitat• Neuse River- support removal <strong>of</strong> Milburnie Dam in Raleigh. Removal would openapproximately 15 miles <strong>of</strong> spawning habitat <strong>and</strong> allow better manipulation <strong>of</strong> flows.• Cape Fear River- supports removal <strong>of</strong> Buckhorn Dam, Lock <strong>and</strong> Dam #2 <strong>and</strong> Lock<strong>and</strong> Dam #3. Support construction <strong>of</strong> the proposed “nature-like” fishway aroundLock <strong>and</strong> Dam #1.Entrainment <strong>and</strong> Impingement <strong>of</strong> Eggs <strong>and</strong> Larvae• Continue to review <strong>and</strong> comment on state <strong>and</strong> federal permit requests in whichwater withdrawal structures are involved in coastal rivers.• Monitor the progress <strong>of</strong> US EPA’s implementation <strong>of</strong> Section 316 (b) rules as theserules may apply to water withdrawal points in <strong>NC</strong> coastal rivers.• In absence <strong>of</strong> effective technology, require water users to curtail withdrawal duringperiods in which striped bass eggs, fry <strong>and</strong> juveniles may be present.Water Quality Concerns• Work in coordination with DWQ, DWR, Division <strong>of</strong> L<strong>and</strong> Quality, <strong>and</strong> <strong>Natural</strong>Resource Conservation Service to maintain, restore <strong>and</strong> improve water quality toincrease striped bass stocks.• Support implementation <strong>of</strong> recommendations <strong>of</strong> DWQ basinwide water qualitymanagement plans, particularly measures that will reduce nutrient loading, sedimentdelivery <strong>and</strong> associated turbidity in all coastal watersheds.• Support implementation <strong>of</strong> habitat <strong>and</strong> water quality recommendations <strong>of</strong> CHPPs,APES, <strong>and</strong> the Estuarine Shoreline Protection Stakeholders report.Catch <strong>and</strong> Release Mortality in Hook <strong>and</strong> Line Fisheries• Develop <strong>and</strong> implement creel surveys to estimate numbers <strong>of</strong> striped bass caught<strong>and</strong> released, as well as directed angling effort.• Recreational harvest seasons should be limited to months (October – April) in whichcool water temperatures (
h<strong>and</strong>ling techniques. Continue research on identifying correct hook sizes <strong>and</strong>configuration <strong>of</strong> circle hooks.Enforcement <strong>of</strong> Creel Limits in Vicinity <strong>of</strong> Inl<strong>and</strong>/Joint or Coastal Boundaries• WRC should implement a rule similar to MFC rule that requires compliance withseason, size, <strong>and</strong> creel limits on the waterbody where fishing is taking place.Albemarle Sound <strong>Management</strong> Area Boundary Line• Maintain the current boundary line between the ASMA <strong>and</strong> the CSMA.Albemarle/Roanoke Stock IssuesBiological Reference Points• Support a fishing mortality rate no higher than 0.22 <strong>and</strong> a SSB no lower than400,000 lbs. for the A/R stock.Discard Mortality <strong>of</strong> Striped Bass in Multi-Species Gill Net <strong>Fishery</strong>• Maintain status quo, existing gill net proclamation authority, with the requirement thatsmall mesh nets be sunk after river herring gill net season closes. Small mesh gillnets (3 ¼ inch) would be restricted to no more than 25 – 30 meshes deep <strong>and</strong> set inno less than 7 feet <strong>of</strong> water unless attended. These requirements would remain ineffect when attendance was not required. Also, consider area closures to gillnetting. The following qualifications will also apply: 1. DMF will evaluate existingIGNS small mesh data to determine differences between striped bass catches infloat <strong>and</strong> sink nets <strong>and</strong> 2. Observer data, current <strong>and</strong> future will be collected <strong>and</strong>analyzed to assess the benefits. Should the discard reductions not be within theestimated range <strong>of</strong> the other options in Table 10.14, then DMF may implement otheroptions presented in the FMP, or other options that may be developed over time.<strong>Management</strong> <strong>of</strong> Harvest Targets in the ASMA• Supports no payback for overages in RRMA due to underage in 2003.• Supports TAC allocation: 25% Roanoke River/WRC recreational, 25% AlbemarleSound/DMF recreational <strong>and</strong> 50% Albemarle Sound/DMF commercial.• Penalties/Triggers for Overages: Short-term Overage: point harvest estimateexceeds the total TAC by 10% in a single year, overage deducted from the next year<strong>and</strong> restrictive measures implemented in the responsible fishery (ies). Long-termOverages: five year running average <strong>of</strong> point estimate exceeds the five year runningaverage <strong>of</strong> the total TAC harvest by 2%, the responsible fishery exceeding theharvest limit will be reduced by the amount <strong>of</strong> the overage for the next five years.Should the target F be exceeded, then restrictive measures will be imposed toreduce F to the target level.<strong>Management</strong> <strong>of</strong> Recreational Striped Bass Harvest in Atlantic Ocean• Support remaining at Status Quo- year round recreational fishery.13
Central/Southern Stock IssuesBiological Reference Points• Manage the CSMA stocks under the same exploitation rate targets <strong>and</strong> thresholdsas selected for the A/R stock (F= 0.22, SSB 400,000 lbs.). Improve data collectionon these stocks so that biomass thresholds <strong>and</strong> targets can be developed for thesestocks.Striped Bass Stocking in Coastal River Systems• Continue Phase II stocking program, with two systems in the CSMA (Tar-Pamlico,Neuse <strong>and</strong> Cape Fear rivers) being stocked annually, with a goal <strong>of</strong> 100,000 fish perdrainage.• Continue the Phase I striped bass stocking program, with a goal <strong>of</strong> 100,000 fish peryear, per system in the CSMA.<strong>Management</strong> Options for Recreational Striped Bass Harvest in CSMA• Adequate information to evaluate specific recreational measures are lacking in theCSMS. Regulations should remain at status quo for 2004. A one year creel surveyis being developed by DMF <strong>and</strong> WRC for the Tar-Pamlico <strong>and</strong> Neuse systems. Thissurvey will collect data on recreational striped bass fisheries in these waters. TheWRC will be conducting a creel survey in the Cape Fear system in 2004. Aftercompletion <strong>of</strong> the creel surveys <strong>and</strong> data analysis, appropriate regulations will bedeveloped <strong>and</strong> implemented to distribute the reductions in fishing mortalitynecessary for stock recovery among the various recreational fisheries.Discard Mortality <strong>of</strong> Striped Bass from Set Gill Nets in the CSMA<strong>Management</strong> Options for Neuse River <strong>and</strong> Pamlico River Areas Gill Net <strong>Fishery</strong>• Require “tie-downs” to reduce striped bass bycatch. DMF is currently evaluating theeffectiveness <strong>of</strong> various tie- down configurations.• Rivers- Increase the commercial possession limit to 10 fish per day per operation inthe rivers during the open striped bass season. Require that gill nets in the shad<strong>and</strong> flounder fisheries operating in the Pamlico, Pungo <strong>and</strong> Neuse river areas (west<strong>of</strong> 76° 30’W long.) be tied down after the striped bass quota is reached <strong>and</strong> theseason closed.• Pamlico Sound- commercial possession limit would remain at 5 fish in the PamlicoSound. L<strong>and</strong>ings <strong>of</strong> striped bass will be limited to 50% by weight <strong>of</strong> the total catch,not to exceed 5 fish per day per fishing operation. Gill nets with a mesh length <strong>of</strong> 6inches (stretched mesh) <strong>and</strong> greater would be prohibited during the striped bassseason.• Other portions <strong>of</strong> the CSMA- Maintain striped bass seasons, opening <strong>and</strong> closingthrough proclamation <strong>and</strong> operating under the 25,000 lb. TAC. This option isintended to allow the sale <strong>of</strong> striped bass bycatch resulting from gill net fisheries. Asdata are collected, more restrictive measures may be implemented as needed.14
4.0 INTRODUCTION4.1 <strong>Management</strong> Authority4.1.1 Introduction<strong>Fishery</strong> management includes all activities associated with maintenance, improvement,<strong>and</strong> use <strong>of</strong> the fisheries resources, including research <strong>and</strong> monitoring, development,regulation, enhancement <strong>and</strong> enforcement.North Carolina’s existing fisheries management system is powerful <strong>and</strong> flexible, withrule-making authority vested in the Marine Fisheries Commission (MFC) <strong>and</strong> the WildlifeResources Commission (WRC) within their respective jurisdictions. The Division <strong>of</strong>Marine Fisheries (DMF) implements MFC rules <strong>and</strong> policies. The General Assemblyretains for itself licensing <strong>and</strong> limited entry authorities. In the 1998 Amendment to theFisheries Reform Act <strong>of</strong> 1997 (FRA), the General Assembly established a process forlimiting entry for fisheries under the <strong>Fishery</strong> <strong>Management</strong> <strong>Plan</strong> (FMP) process. Federalauthority under the Magnuson-Stevens Act applies to fisheries in the ExclusiveEconomic Zone (the area from 3 to 200 miles <strong>of</strong>fshore); it also applies to a limited extentin areas within state jurisdiction deemed Essential Fish Habitat (EFH). The Atlanticcoast states work together through the Atlantic States Marine Fisheries Commission(ASMFC) to prepare <strong>and</strong> implement interstate FMPs, but the regulatory responsibility<strong>and</strong> authority remain with the states. Passage <strong>of</strong> the Atlantic Coastal FisheriesCooperative <strong>Management</strong> Act in 1993 gave the ASMFC oversight for species withASMFC plans, but plan actions are implemented by each state. Thus, the MFC/WRC(rules) <strong>and</strong> DMF/WRC (research, enforcement, etc.) utilize their authorities to managethe fisheries. The MFC <strong>and</strong> WRC have the ability to establish seasons, authorize orrestrict fishing methods <strong>and</strong> gear, limit quantities taken or possessed, <strong>and</strong> restrictfishing areas. Thus, all necessary authority needed for management <strong>of</strong> the striped bassfisheries is available through the existing state fishery management process. Protection,enhancement <strong>and</strong> development <strong>of</strong> sustainable fisheries will require appropriate use <strong>of</strong>this authority, along with the cooperation <strong>of</strong> stakeholders.The MFC (August 2001) in their adoption <strong>of</strong> a priority schedule for FMP developmentincluded revisiting the Estuarine Striped Bass FMP that was approved in 1994. The1994 plan was targeted at the recovery <strong>of</strong> the Albemarle Sound-Roanoke River (A/R)striped bass stock but also included some management measures for other striped bassstocks in the state. This 2003 Estuarine Striped Bass FMP document (developed underthe criteria <strong>and</strong> st<strong>and</strong>ards <strong>of</strong> the 1997 FRA) replaces in total the 1994 FMP <strong>and</strong>addresses issues for the various estuarine striped bass stocks in North Carolina.4.1.2 Legal Authority for <strong>Management</strong>Many different state laws (General Statutes- G.S.) provide the necessary authority forfishery management in North Carolina. General authority for stewardship <strong>of</strong> the marine<strong>and</strong> estuarine resources by the North Carolina Department <strong>of</strong> <strong>Environment</strong> <strong>and</strong> <strong>Natural</strong>Resources (DENR) is provided in G.S. 113-131. The DMF is the arm <strong>of</strong> the Department,15
which carries out this responsibility. The same statute also grants managementauthority to the WRC within its jurisdictional area. Enforcement authority for DMFenforcement <strong>of</strong>ficers (Marine Patrol) <strong>and</strong> WRC <strong>of</strong>ficers is provided by G.S. 113-116.Rule-making authority is granted to the MFC <strong>and</strong> WRC by G.S. 113-134. GeneralStatute 113-181 authorizes DMF research <strong>and</strong> statistical programs. The MFC ischarged to “manage, restore, develop, cultivate, conserve, protect <strong>and</strong> regulate themarine <strong>and</strong> estuarine resources <strong>of</strong> the State <strong>of</strong> North Carolina” (G.S. 143B-289.51). TheMFC can regulate fishing times, areas, fishing gear, seasons, size limits, <strong>and</strong> quantities<strong>of</strong> fish harvested <strong>and</strong> possessed (G.S. 113-182 <strong>and</strong> 143B-289.52). General Statute143B-289.52 also allows the MFC to delegate authority to implement its regulations forfisheries “which may be affected by variable conditions” to the Director <strong>of</strong> DMF byissuing public notices called “proclamations.” General Statute 113-292 authorizes theWRC or the Executive Director to suspend or extend the hook <strong>and</strong> line season forstriped bass in all <strong>of</strong> North Carolina’s coastal rivers through issuance <strong>of</strong> proclamations.The General Assembly has retained for itself the authority to establish commercialfishing licenses, but has delegated to the MFC authority to establish permits <strong>and</strong> permitfees for various commercial fishing activities. Thus North Carolina has a very powerful<strong>and</strong> flexible legal basis for coastal fisheries management.The Fisheries Reform Act <strong>of</strong> 1997 (FRA) established a process for preparation <strong>of</strong> FMPsin North Carolina. The FRA states that “the goal <strong>of</strong> the plans will be to ensure that longtermviability <strong>of</strong> the State’s commercially <strong>and</strong> recreationally significant species orfisheries. Each plan will be designated to reflect fishing practices so that one plan mayapply to a specific fishery, while other plans may be based on gear or geographic areas.Each plan will:a. Contain necessary information pertaining to the fishery or fisheries, includingmanagement goals <strong>and</strong> objectives, status <strong>of</strong> the relevant fish stocks, stockassessments for multi-year species, fishery habitat <strong>and</strong> water quality considerationsconsistent with Coastal Habitat Protection <strong>Plan</strong>s (CHPP) adopted pursuant to G.S.143B-279.8, social <strong>and</strong> economic impact <strong>of</strong> the fishery to the State, <strong>and</strong> userconflicts.b. Recommend management actions pertaining to the fishery or fisheries.c. Include conservation <strong>and</strong> management measures that prevent overfishing, whileachieving, on a continuing basis, the optimal yield from each fishery.”Optimal yield is defined in the FRA as “The amount <strong>of</strong> fish that:a. Will provide that greatest overall benefit to the State, particularly with respect t<strong>of</strong>ood production <strong>and</strong> recreational opportunities, <strong>and</strong> taking into account theprotection <strong>of</strong> marine ecosystems;b. Is prescribed on the basis <strong>of</strong> the maximum sustainable yield from the fishery, asreduced by any relevant economic, social, or ecological factors; <strong>and</strong>c. In the case <strong>of</strong> an overfished fishery, provides for rebuilding to a level consistent withproducing the maximum sustainable yield in the fishery.” (FRA; G.S. 113-182.1).16
4.2 General Problem StatementStriped bass are distributed throughout the coastal waters <strong>of</strong> North Carolina <strong>and</strong> havebeen harvested historically (Table 4.1) from virtually all coastal systems. Over the last40-50 years; however, the fisheries have been overwhelmingly concentrated in theAlbemarle Sound area. In addition, historical l<strong>and</strong>ing data (Section 13, Appendix 1)indicate that the striped bass fisheries have always been concentrated in that area, withminor fisheries in other coastal systems. Data collection on the Albemarle/Roanoke(A/R) stock has been ongoing since the 1950s <strong>and</strong> was intensified in the 1980s whenthe stock nearly collapsed. Significant restrictions in harvest <strong>of</strong> A/R striped bass alongwith improvements in Roanoke River flow conditions since the late 1980s brought aboutremarkable improvements in spawning success. In 1997, the A/R stock was declaredrecovered by the ASMFC. The spawning stock biomass has increased <strong>and</strong> the agestructure <strong>of</strong> the stock has exp<strong>and</strong>ed. The 2001 A/R stock assessment (Carmichael2002) continues to indicate that the stock size is increasing. Now that recovery hasbeen achieved, cautious increases in allowable striped bass harvest have beenpermitted. In order for the future management <strong>of</strong> the A/R striped bass stock, areevaluation <strong>of</strong> current management regimes is warranted.Outside the Albemarle Sound <strong>Management</strong> Area (ASMA), the DMF has conductedspawning <strong>and</strong> nursery area surveys, <strong>and</strong> commercial fish house sampling for size, age<strong>and</strong> sex composition data for most coastal streams, but this work ended 15-20 yearsago, varying with area, as federal aid funds were decreased (Table 4.2). The DMF 2003stock status report lists the status <strong>of</strong> striped bass in the Central/Southern (C/S)management unit as overfished. Commercial l<strong>and</strong>ing data for striped bass in theseareas are available <strong>and</strong> the WRC has been monitoring spawning stock status <strong>of</strong> stripedbass in the Neuse <strong>and</strong> Tar rivers since 1994 (Table 4.3). Otherwise, little data on thesestocks exist; clearly indicating a need for the development <strong>of</strong> management strategies toenhance these stocks.The 1994 Fisheries <strong>Management</strong> <strong>Plan</strong> for the Estuarine Stocks <strong>of</strong> Striped Bass in NorthCarolina was developed as a recovery plan for the A/R stock. Since the A/R stock hasrecovered <strong>and</strong> harvest parity has been reached between the commercial <strong>and</strong>recreational fisheries a revised FMP is warranted to explore management options for17
Table 4.1. North Carolina striped bass commercial l<strong>and</strong>ings <strong>and</strong> dockside value, 1972 - 2002.ASMAPamlicoSoundPamlico/Pungo riversNeuse/BayriversCape FearRiverConfidential <strong>and</strong>Other Inside WatersAtlanticOceanState totalYear Pounds Pounds Pounds Pounds Pounds Pounds Pounds Pounds Value ($)1972 304,809 64,978 49,294 500 3,033 11,399 827,047 1,261,060 358,3121973 529,156 27,587 73,638 4,928 1,376 7,082 1,108,169 1,751,936 591,8111974 427,940 19,618 41,986 456 729 32,267 493,316 1,016,312 393,1871975 615,752 17,217 55,870 7,280 1,538 20,545 584,995 1,303,197 629,9281976 668,903 7,117 11,904 8,625 1,814 7,498 332,293 1,038,154 522,6371977 469,402 561 9,839 0 831 316 90,702 571,651 405,2631978 524,999 3,920 2,754 0 1,326 287 164,578 697,864 623,2501979 326,208 6,500 32,945 0 7,811 640 240,080 614,184 577,0041980 372,482 5,282 50,655 * 17,418 4,832 21,834 472,503 435,4791981 333,376 3,556 20,612 * 7,394 845 51,541 417,324 451,8241982 227,626 4,345 11,045 228 1,815 378 92,873 338,310 531,4701983 288,677 1,184 15,035 1,018 2,500 65 52,796 361,275 491,4911984 475,607 690 16,539 3,445 2,081 33 14,501 512,896 452,0021985 269,671 2,842 5,919 988 * 520 * 279,940 229,5861986 172,683 6,104 8,766 687 * 752 * 188,992 189,8591987 228,861 24,797 6,571 1,433 * 559 0 262,221 262,5421988 108,791 3,609 2,538 * * 977 * 115,915 116,7761989 97,061 940 1,987 * * 842 * 100,830 101,0021990 103,757 373 235 * * 904 8,670 113,939 159,6301991 108,460 4,034 321 1,967 * 1,848 6,186 122,816 175,8221992 100,549 6,019 774 9,053 * 16,912 27,702 161,009 204,4341993 109,475 8,134 374 1,797 1,439 65,557 75,671 262,447 330,3511994 102,367 9,974 866 8,289 481 247 139,672 261,896 353,5591995 87,876 6,981 2,439 3,951 264 691 344,587 446,789 606,5291996 90,100 17,321 4,230 6,965 4,140 593 58,217 181,566 220,9031997 96,122 16,435 4,450 5,344 2,187 104 463,144 587,786 711,0911998 123,927 11,520 7,515 5,537 501 900 272,969 422,869 520,0391999 162,875 15,473 10,453 6,093 1,001 934 391,482 588,311 724,8442000 214,029 9,652 16,749 4,808 566 64 161,638 407,506 471,9162001 220,161 8,821 8,936 6,946 * 232 381,446 626,542 773,6922002 220,834 8,616 8,207 4,133 * 16,627 441,046 699,462 853,195* Denotes confidential data.18
Table 4.2. Striped bass research <strong>and</strong> monitoring by the North Carolina Division <strong>of</strong> Marine Fisheries in the rivers <strong>and</strong> sounds <strong>of</strong> eastern North Carolina.Type <strong>of</strong> workSystemSpawning areasJuvenileabundanceAdult size, age <strong>and</strong>sexMigration/TaggingCreel surveyStockassessmentCommercialharvest*AlbemarleSoundareaTar-Pamlico(includesPamlicoSound)1973, 1974, 1978,1993 1972-present 1972-present 1974-present1975-1976, 1980-1981 1974-19801974 - 19811998-present1990-present**MRFSS 1994-2000 1978-present1975-19761979-19811998-2001 **MRFSS 1978- presentNeuse 1977-1979 1976-19801976-1981Sep 1998- Jan 20011977-1981Sep 1998- Jan 2001 **MRFSS 1978- presentWhite Oak 1974-1975 1973-1975 1974-1975 **MRFSS 1978- presentNew 1974-1975 1973-19751974-75Sep 1998- Jan 2001 **MRFSS 1978- presentCape Fear 1976-1981 1975-1981 1976-1981 1976-1981 **MRFSS 1978- present* Commercial harvest available for earlier years by National Marine Fisheries Service (NMFS).** Marine Recreational <strong>Fishery</strong> Statistics Survey (MRFSS) on going in the coastal waters <strong>of</strong> these systems but geographic coverage does not provide a completeestimate <strong>of</strong> harvest. Does provide size data on what is encountered19
the future. Insufficient information exists for the C/S stocks to quantitatively evaluatemake sound, long term management decisions. The purpose <strong>of</strong> this plan is to examine<strong>and</strong> recommend management measures that will promote recovery <strong>of</strong> striped bassstocks in areas where long-term well being is in jeopardy, conserve adequate spawningstock in all <strong>of</strong> North Carolina’s coastal striped bass stocks <strong>and</strong> protect the integrity <strong>of</strong>critical habitats required to maintain the health <strong>of</strong> the stocks. Areas to be addressed inthe management <strong>of</strong> North Carolina’s estuarine striped bass fishery are: (1)management strategies; (2) insufficient data <strong>and</strong> research needs; (3) protection <strong>of</strong>habitat, water quality <strong>and</strong> quantity; <strong>and</strong> (4) socioeconomic factors.Table 4.3.Striped bass research <strong>and</strong> monitoring work by the North Carolina Wildlife ResourcesCommission in rivers <strong>of</strong> eastern North Carolina.Type <strong>of</strong> workSystemSpawning stocksurveyEgg <strong>and</strong> larvaeAdult size, age<strong>and</strong> sexCreel surveyChowan River 2001-2002Roanoke River 1991- present 1981-1990 1991- present 1988- presentAlbemarle Sound 1979-1980Tar- Pamlico1994-19951996- present1970-19751988-1989, 1996 1970-1975 2004-2005Neuse1994- present1970-19751988-19891970-19752002-2003White Oak 1998, 2000Cape Fear 1999-2000 1992-1993 2003-2004Northeast Cape Fear 2000 1998Inl<strong>and</strong> waters <strong>of</strong> <strong>NC</strong> 1966-1968 1966-196820
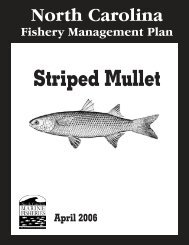
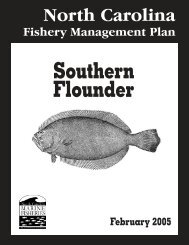
4.3 <strong>Management</strong> UnitsStriped bass are recorded from all <strong>of</strong> North Carolina’s coastal river ecosystems(Menhinick 1991). Coastal basins with striped bass spawning, nursery <strong>and</strong>adult/subadult habitat, which are situated wholly or primarily in North Carolina are:Albemarle Sound <strong>and</strong> its tributaries; Pamlico Sound <strong>and</strong> its tributaries, including theTar/Pamlico River, Pungo River, the Neuse River; the Newport River; the White OakRiver; the New River; the Cape Fear <strong>and</strong> Northeast Cape Fear rivers <strong>and</strong> estuary; <strong>and</strong>the Shallotte River. Additional rivers, which enter the Atlantic Ocean in South Carolinaalso host striped bass <strong>and</strong> some spawning <strong>and</strong> nurseryhabitat for these populations may exist in North Carolina. These include theWaccamaw, Lumber, <strong>and</strong> Pee Dee river systems. The <strong>NC</strong> portions <strong>of</strong> these lattersystems, whose striped bass populations are largely within South Carolina jurisdiction,will be regulated under this plan, but the biology <strong>of</strong> those populations will not bereviewed in the plan at this time.There are two geographic management units for this estuarine striped bass FMP <strong>and</strong>the fisheries throughout the coastal systems <strong>of</strong> North Carolina. The management unitsare defined as follows:Albemarle Sound <strong>Management</strong> Area (ASMA)- which includes Albemarle Sound <strong>and</strong>all its Joint <strong>and</strong> Inl<strong>and</strong> Water tributaries, (except for the Roanoke, Middle, Eastmost <strong>and</strong>Cashie rivers), Currituck, Roanoke, <strong>and</strong> Croatan sounds <strong>and</strong> all their Joint <strong>and</strong> Inl<strong>and</strong>Water tributaries, including Oregon Inlet, north <strong>of</strong> a line from Roanoke Marshes Point35° 48’.3693’ N - 75° 43’.7232’ W across to the north point <strong>of</strong> Eagle Nest Bay 35°44’.1710’ N - 75° 31’.0520’ W (Figure 4.1).Roanoke River <strong>Management</strong> Area (RRMA)- Roanoke River <strong>and</strong> its Joint <strong>and</strong> Inl<strong>and</strong>Water tributaries, including Middle, Eastmost <strong>and</strong> Cashie rivers, up to the RoanokeRapids Dam (Figure 4.2).Central/Southern <strong>Management</strong> Unit (CSMA) - All internal Coastal, Joint <strong>and</strong>contiguous Inl<strong>and</strong> waters <strong>of</strong> North Carolina south <strong>of</strong> a line from Roanoke Marshes Pointacross to Eagle Nest Bay to the South Carolina State line (Figure 4.1).4.4 Existing Agreements, <strong>Plan</strong>s, Statutes <strong>and</strong> Rules4.4.1 Agreements <strong>and</strong> <strong>Plan</strong>sIn 1986, the North Carolina Department <strong>of</strong> <strong>Natural</strong> Resources <strong>and</strong> CommunityDevelopment, WRC <strong>and</strong> United States Fish <strong>and</strong> Wildlife Service (FWS) entered into acooperative agreement (Agreement No. 14-16-0004-87-904) for anadromousspecies restoration in North Carolina’s coastal river basins. The cooperative program’sintent is to restore self-sustaining stocks <strong>of</strong> anadromous fishes in coastal North Carolinawaters through a combination <strong>of</strong> fishery techniques including stocking, regulations, <strong>and</strong>assessment. This cooperative program continues today <strong>and</strong> has resulted in numerouscooperative fishery management ventures between state <strong>and</strong> federal agencies.21
Figure 4.1. Boundary line between Albemarle Sound <strong>Management</strong> Area(ASMA) <strong>and</strong> Central Southern <strong>Management</strong> Area (CSMA).22
Figure 4.2. Boundary line between the ASMA <strong>and</strong> the Roanoke River<strong>Management</strong> Area (RRMA), under the management <strong>of</strong> the <strong>NC</strong>Wildlife Resources Commission.23
In November 1990, a memor<strong>and</strong>um <strong>of</strong> agreement between the MFC <strong>and</strong> WRC wassigned to provide stewardship <strong>and</strong> continuity <strong>of</strong> management for striped bass. Throughthis agreement, two distinct management zones were established: the Albemarle Sound<strong>and</strong> Roanoke River <strong>Management</strong> Areas. Under an additional agreement the MFC,WRC, <strong>and</strong> FWS established a cooperative for the purpose <strong>of</strong> restoring all interjurisdictionalfishery stocks in North Carolina.The ASMFC was directed, under the federal Striped Bass Conservation Act (1984) todevelop a management plan, which would address all striped bass populations fromSouth Carolina/North Carolina border northward. The Act, during reauthorization in1988, was amended to include Section 5, which provided that the FWS, in consultationwith the National Marine Fisheries Service (NMFS), would provide a report to Congresssummarizing the findings <strong>of</strong> a study to be conducted on North Carolina striped bass.The Act specifically instructed the FWS to include: a description <strong>of</strong> the AlbemarleSound-Roanoke River Basin; an investigation <strong>and</strong> analysis <strong>of</strong> the effects <strong>of</strong> l<strong>and</strong> <strong>and</strong>water use practices on the Albemarle Sound-Roanoke River striped bass stock (A/Rstock); determination <strong>of</strong> the abundance, age, geographic distribution <strong>and</strong> amount <strong>and</strong>location <strong>of</strong> migration <strong>and</strong> spawning habitat; the extent <strong>and</strong> causes <strong>of</strong> mortality atsuccessive life stages, including fishing; the effects <strong>of</strong> pollution <strong>and</strong> other alterationsincluding water withdrawals, discharges <strong>and</strong> flows on A/R stock migration, spawning,viability <strong>and</strong> condition <strong>of</strong> eggs <strong>and</strong> larvae; the effectiveness <strong>of</strong> current fishery <strong>and</strong>reservoir management measures; an analysis <strong>of</strong> whether additional measures areneeded to halt the decline <strong>of</strong> the A/R stock <strong>and</strong> initiate recovery; <strong>and</strong> a recommendation<strong>of</strong> whether conservation could be improved by managing the A/R stock under theASMFC Interstate Fisheries <strong>Management</strong> <strong>Plan</strong> for Striped Bass <strong>and</strong> the Act.The report <strong>of</strong> the FWS, Albemarle Sound <strong>and</strong> Roanoke River Basin North CarolinaStriped Bass Study, was submitted to Congress in May 1992. The report containedrecommendations for restoration <strong>of</strong> the A/R stock. One <strong>of</strong> the recommendations wasthat <strong>NC</strong> be allowed to continue management <strong>of</strong> its striped bass fishery, in the A/Rsystem, under the ASMFC plan but with its own separate management provisions. TheC/S management unit was not specifically addressed in the ASMFC plan.Under the ASMFC Striped Bass <strong>Fishery</strong> <strong>Management</strong> <strong>Plan</strong> states are required toimplement a variety <strong>of</strong> regulations <strong>and</strong> monitoring programs within their jurisdictions.These include a preferred minimum size <strong>of</strong> 20 inches in bays <strong>and</strong> estuaries <strong>and</strong> 28inches in ocean waters. States can <strong>and</strong> do deviate from these preferred options, but anyalternative measures must be reviewed by the Striped Bass Technical Committee <strong>and</strong>approved by the Striped Bass <strong>Management</strong> Board (ASMFC 1995).The plan, implemented under ASMFC Amendment 5 <strong>of</strong> the Striped Bass FMP, requiresannual submittal <strong>of</strong> a fishing plan, as well as a report on the previous year’s fishery.Both the annual fishing plan <strong>and</strong> annual fishery report for the A/R stock must beaccepted <strong>and</strong> approved by the ASMFC Striped Bass Technical Committee <strong>and</strong> also bythe Striped Bass <strong>Management</strong> Board. Amendment 6 to the ASMFC Striped Bass FMPwas adopted in February 2003 (ASMFC 2003).24
The North Carolina Estuarine Striped Bass <strong>Fishery</strong> <strong>Management</strong> <strong>Plan</strong> was developed<strong>and</strong> approved by the MFC <strong>and</strong> WRC in 1994. This plan set forth measures necessaryfor continuing the recovery <strong>of</strong> the A/R stock, <strong>and</strong> advised the ASMFC <strong>of</strong> measureswhich North Carolina was taking in that regard. It also put in place a commercial quota<strong>and</strong> recreational size <strong>and</strong> bag limits for the CSMA. This coastwide plan also satisfiedthe recommendation, contained in the Report to Congress, that such a plan beprepared.4.4.2 StatutesAll management authority for North Carolina’s striped bass fishery is vested in the State<strong>of</strong> North Carolina. Since the stocks depend greatly on habitats found in both Coastal<strong>and</strong> Inl<strong>and</strong> Waters, the MFC <strong>and</strong> the WRC will implement management actions in theirrespective jurisdictions.General authorities noted in Section 4.1.2 provide the MFC <strong>and</strong> WRC with regulatorypowers to manage the fisheries. There are some statutes (G.S. 113-268 (a), (b), <strong>and</strong> (c)<strong>and</strong> G.S. 113-282 c.1.) which promulgate specific rules to implement managementobjectives.4.4.3 RulesThe following rules have been enacted to manage striped bass stocks in North Carolinathrough the authority vested in the MFC <strong>and</strong> WRC. (North Carolina AdministrativeCode- 15A <strong>NC</strong>AC)4.4.3.1 Marine Fisheries Commission Rules15A <strong>NC</strong>AC SUBCHAPTER 3J- NETS, POTS, DREDGES, AND OTHER FISHINGDEVICESSECTION .0100 – NETS RULES, GENERAL.0101 FIXED OR STATIONARY NETSIt is unlawful to use or set fixed or stationary net:(1) In the channel <strong>of</strong> the Intracoastal Waterway or in any other location where itmay constitute a hazard to navigation;(2) So as to block more than two-thirds <strong>of</strong> any natural or manmade waterway,sound, by, creek, inlet or any other body <strong>of</strong> water;(3) In the middle third <strong>of</strong> any marked navigation channel;(4) In the channel third <strong>of</strong> the following rivers: Roanoke, Cashie, Middle,Eastmost, Chowan, Little, Perquimans, Pasquotank, North, Alligator, Pungo,Pamlico, <strong>and</strong> Yeopim..0102 NETS OR NET STAKESIt is unlawful to use nets or net stakes:25
(1) Within 150 yards <strong>of</strong> railroad or highway bridge crossing the Northeast CapeFear River, New River, White Oak River, Trent River, Neuse River, PamlicoRiver, Roanoke River, <strong>and</strong> Alligator River;(2) Within 300 yards <strong>of</strong> any highway bridge crossing Albemarle Sound,.0103 GILL NETS, SEINES, IDENTIFICATION, RESTRICTIONS(a) It is unlawful to use a gill net with a mesh length less than 2 ½ inches.(b) The Fisheries Director may, by proclamation, limit or prohibit the use <strong>of</strong> gillnets or seines in coastal waters, or any portion there<strong>of</strong>, or impose any or all <strong>of</strong>the following restrictions on the use <strong>of</strong> gill nets or seines:(1) Specify area.(2) Specify season.(3) Specify gill net mesh length.(4) Specify means/methods.(5) Specify net number <strong>and</strong> length.(c) It is unlawful to use fixed or stationary gill nets in the Atlantic Ocean, drift gillnets in the Atlantic Ocean for recreational purposes, or any gill nets in internalcoastal waters unless such nets are marked by attaching to them at each endtwo separate yellow buoys which shall be <strong>of</strong> solid foam or other solid buoyantmaterial no less than five inches in diameter <strong>and</strong> no less than five inches inlength. Gill nets which are not connected together at the top line shall beconsidered as individual nets, requiring two buoys at the end <strong>of</strong> each individualnet. Gill nets connected together at the top line shall be considered as acontinuous net requiring two buoys at each end <strong>of</strong> the continuous net. Anyother marking buoys on gill nets used for recreational purposes shall be yellowexcept one additional buoy, any shade <strong>of</strong> hot pink in color, constructed asspecified in Paragraph (c) <strong>of</strong> this Rule, shall be added at each end <strong>of</strong> eachindividual net. Any other marking buoys on gill nets used in commercial fishingoperations shall be yellow except that one additional identification buoy <strong>of</strong> anycolor or any combination <strong>of</strong> colors, except any shade <strong>of</strong> hot pink may be usedat either or both ends. The owner shall always be identified on a buoy on eachend either by using engraved buoys or by attaching engraved metal or plastictags to the buoys. Such identification shall include owner’s name <strong>and</strong> initials<strong>and</strong> if a vessel is used, one <strong>of</strong> the following:(1) Owner’s N.C. motor boat registration number, or(2) Owner’s U.S. vessel documentation name.(d) It is unlawful to use gill nets:(1) Within 200 yards <strong>of</strong> any pound net with lead <strong>and</strong> pound or heart in use;(2) From March 1 through October 31 in the Intracoastal Waterway within150 yards <strong>of</strong> any railroad or highway bridge.(e) It is unlawful to use gill nets within 100 feet either side <strong>of</strong> the center line <strong>of</strong> theIntracoastal Waterway Channel south <strong>of</strong> Quick Flasher No. 54 in AlligatorRiver at the southern entrance <strong>of</strong> the Intracoastal Waterway to the SouthCarolina line, unless such net is used in accordance with the followingconditions:(1) No more than two gill nets per boat may be used at any one time;26
(f)(2) Any net used must be attended by the fisherman from a boat who shallat no time be more than 100 yards from either net; <strong>and</strong>(3) Any individual setting such nets shall remove them, when necessary, insufficient time to permit unrestricted boat navigation.It is unlawful to use drift gill nets in violation <strong>of</strong> 15A <strong>NC</strong>AC 3J .0101(2) <strong>and</strong>Paragraph (e) <strong>of</strong> this Rule.(g) It is unlawful to use unattended gill nets with a mesh length less than fiveinches in a commercial fishing operation in the following areas:(1) Pamlico River, west <strong>of</strong> a line beginning at a point on Mauls Point 35° 26.9176’ N - 76° 55 .5253’ W; to a point on Ragged Point at 35° 27 .5768’N - 76° 54 .3612 W;(2) Within 200 yards <strong>of</strong> any shoreline in Pamlico River <strong>and</strong> its tributarieseast <strong>of</strong> the line from Mauls Point at 35° 26 .9176’ N - 76° 55 .5253’ W;to Ragged Point at 35° 27. 5768’ N - 76° 54 .3612’ W <strong>and</strong> west <strong>of</strong> a linebeginning at a point on Pamlico Point at 35° 18 .5906’ N - 76° 28 .9530’W; through Marker #1 to a point on Roos Point at 35° 22 .3622’ N - 76°28. 2032’ W;(3) Pungo River, east <strong>of</strong> a line beginning at a point on Durants Point at 35°30 .5312’ N - 76° 35’ 12. 1594’ W; to the northern side <strong>of</strong> thebreakwater at 35° 31 .7198’ N - 76° 36 .9195’ W;(4) Within 200 yards <strong>of</strong> any shoreline in Pungo River <strong>and</strong> its tributarieswest <strong>of</strong> a line from Durants Point at 35° 30 .5312’ N - 76° 35 .1594’W;to the northern side <strong>of</strong> the breakwater at 35° 31 .7198’ N - 76° 35 .1594’W, <strong>and</strong> west <strong>of</strong> a line beginning at a point on Pamlico Point at 35° 18.5906’ N - 76° 28 .9530’ W; through Marker #1 to a point on Roos Pointat 35° 22 .3622’ N - 76° 28 .2032’W;(5) Neuse River <strong>and</strong> its tributaries northwest <strong>of</strong> the Highway 17 high-risebridge;(6) Trent River <strong>and</strong> its tributaries;(7) Within 200 yards <strong>of</strong> any shoreline in Neuse River <strong>and</strong> its tributaries east<strong>of</strong> Highway 17 high-rise bridge <strong>and</strong> west <strong>of</strong> a line beginning at a pointon Wilkinson Point at 34° 57 .9166’ N - 76° 48 .2240’ W; to a point onCherry Point at 34° 56 .3658’ N - 76° 48 .7110’ W.(h) It is unlawful to use unattended gill nets with a mesh length less than fiveinches in a commercial fishing operation from May 1 through October 31 in thefollowing internal coastal <strong>and</strong> joint waters <strong>of</strong> the state south <strong>of</strong> a line beginningat a point on Roanoke Marshes Point at 35° 48 .3693’ N - 75° 43 .7232’ W; toa point on Eagle Nest Bay at 35° 44 .1710’ N - 75° 31 .0520’ W to the SouthCarolina State Line:(1) All primary nursery areas described in 15A <strong>NC</strong>AC 3R .0103, allpermanent secondary nursery areas described in 15A <strong>NC</strong>AC 3R .0104,<strong>and</strong> no trawl areas described in 15A <strong>NC</strong>AC 3R .0106(3), (4), (6), <strong>and</strong>(7);(2) In the area along the Outer Banks, beginning at a point on Core Banksat 34° 58 .7853’ N - 76° 09 .8922’ W; to a point on Wainwright Isl<strong>and</strong> at27
34° 59 .4664’ N - 76° 12 .4859’ W; to a point at 35° 00 .2666’ N - 76° 12.2000’ W; (M) to a point near Beacon “HL” at 35° 01. 5833’ N - 76° 11.4500’ W; to a point near North Rock at 35° 06 .4000’ N - 76° 04 .3333’W; to a point near Nine Foot Shoal Channel at 35° 08 .4333’ N - 76° 02.5000’ W; to a point near the west end <strong>of</strong> Clark Reef at 35° 09 .3000’ N- 75° 54 .8166’ W; to a point south <strong>of</strong> Legged Lump at 35° 10 .9666’ N -75° 49 .7166’ W; to a point on Legged Lump at 35° 11 .4833’ N - 75° 51.0833’ W; to a point near No. 36 in Rollinson Channel at 35° 15 .5000’N - 75° 43 .4000’ W; to a point near No. 2 in Cape Channel at 35° 19.0333’ N - 75° 36 .3166’ W; to a point near No. 2 in Avon Channel at35° 22 .3000’ N - 75° 33 .2000’ W; to a point on Gull Isl<strong>and</strong> at 35° 28.4500’ N - 75° 31 .3500’ W; to a point west <strong>of</strong> Salvo at 35° 32 .6000’ N -75° 31 .8500’W; to a point west <strong>of</strong> Rodanthe Pier at 35° 35 .0000’N -75° 29 .8833’W; to a point near No. 2 in Chicamacomico Channel, to apoint west <strong>of</strong> Beach Slough at 35° 40 .0000’N - 75° 32 .8666’W; to apoint west <strong>of</strong> Pea Isl<strong>and</strong> at 35° 45 .1833’ N - 75° 34 .1000’ W; to a pointat 35° 44 .1710’ N - 75° 31 .0520’W. Thence running south along theshoreline across the inlets to the point <strong>of</strong> beginning;(3) In Back <strong>and</strong> Core sounds, beginning at a point on Shackleford Banks at34° 39 .6601’ N - 76° 34 .4078 W; to a point at Marker #3 at 34° 41.3166’ N - 76° 33 .8333’ W; to a point at 34° 40 .4500’ N - 76° 30 .6833’W; to a point near Marker “A37” at 34° 43 .5833’ N - 76° 28 .5833’ W; toa point at 34° 43 .7500’ N - 76° 28 .6000’ W; to a point at 34° 48 .1500’N - 76° 24 .7833’ W; to a point near Drum Inlet at 34° 51 .0500’ N - 76°20 .3000’ W; to a point at 34° 53 .4166’ N - 76° 17 .3500’ W; to a pointat 34° 53 .9166’ N - 76° 17 .1166’ W; to a point at 34° 53 .5500’ N - 76°16 .4166’ W; to a point at 34° 56 .5500’ N - 76° 13 .6166’ W; to a pointat 34° 53 .5500’ N - 76° 16 .4166’ W; to a point at 34° 56 .4833’ N - 76°13 .2833 W; to a point at 34°58 .1833 N - 76° 12 .3000 W; to a point at34° 58 .8000’ N - 76° 12 .5166’ W; to a point on Wainwright Isl<strong>and</strong> at34° 59 .4664’ N - 76° 12 .4859’ W; to a point on Core Banks at 34° 58.7832’ N - 76° 09 .8922’ W; thence following the shoreline south acrossDrum <strong>and</strong> Barden inlets to a point <strong>of</strong> beginning;(4) Within 200 yards <strong>of</strong> any shoreline, except from October 1 throughOctober 31, south <strong>and</strong> east <strong>of</strong> Highway 12 in Carteret County <strong>and</strong> south<strong>of</strong> a line from a point on Core Banks at 34° 58 .7853’ N - 76° 09 .8922’W; to Camp Point at 34° 59 .7942’ N - 76° 14 .6514’ W to the SouthCarolina State Line.15A <strong>NC</strong>AC SUBCHAPTER 3M- FINFISHSECTION .0100 – FINFISH, GENERAL28
.0101 MUTILATED FINFISHIt is unlawful to possess aboard a vessel or while engaged in fishing from theshore or a pier any species <strong>of</strong> finfish which is subject to a size or harvestrestriction without having head <strong>and</strong> tail attached. Blueback herring, hickory shad<strong>and</strong> alewife shall be exempt from this Rule when used for bait provided that notmore than two fish per boat or fishing operation may be cut for bait at any onetime.SECTION .0200- STRIPED BASS.0201 GENERAL(a) Striped bass is defined as striped bass (Morone saxatilis) <strong>and</strong> its hybridstaken in coastal <strong>and</strong> joint waters.(b) Hook-<strong>and</strong>-line fishing equipment is not commercial fishing equipment in thestriped bass fishery. It is unlawful to sell or purchase striped bass taken byhook-<strong>and</strong>-line. Striped bass taken legally with hook-<strong>and</strong>-line may bepossessed <strong>and</strong> transported.(c) It is unlawful to possess striped bass imported from other states less than 18inches long (total length).(d) It is unlawful to import, buy, sell, transport, <strong>of</strong>fer to buy or sell, or possessstriped bass except:(1) during the open season in internal coastal waters established in 15A<strong>NC</strong>AC 3M .0202;(2) during any open season established for the Atlantic Ocean in 15A<strong>NC</strong>AC 3M 0.204; or(3) during any open season <strong>of</strong> another state without possession <strong>of</strong> thefollowing:(A) A bill <strong>of</strong> lading as described in 15A <strong>NC</strong>AC 3O .0114;(B) A numbered, state-issued tag from the State <strong>of</strong> origin affixedthrough the mouth <strong>and</strong> gill cover. This tag must remain affixeduntil processed for consumption by the consumer..0202 SEASON, SIZE AND HARVEST LIMIT: INTERNAL COASTAL WATERS(a) The Fisheries Director may, by proclamation, impose any or all thefollowing restrictions on the taking <strong>of</strong> striped bass in internal coastal waters:(1) Specify season or seasons:(A) for recreational purposes;(B) for commercial fishing operations from October 1 through April 30,(2) Specify areas,(3) Specify quantity,(4) Specify means/methods,(5) Specify size, but the minimum size specified shall not be less than18 inches total length, <strong>and</strong>(6) Require submission <strong>of</strong> statistical <strong>and</strong> biological data. Fish that donot meet the minimum size limit specified by proclamation shall29
(b)immediately be returned to the waters from which takenregardless <strong>of</strong> condition.The Fisheries Director may, by proclamation, impose any or all the followingrestrictions on the taking <strong>of</strong> striped bass by hook-<strong>and</strong>-line or for recreationalpurposes in internal coastal waters in order to comply with the managementrequirements incorporated in the North Carolina Estuarine Striped Bass <strong>Plan</strong>:(1) Specify quantity, but shall not exceed possession <strong>of</strong> more than threefish in any one day, <strong>and</strong>(2) Specify size, but the minimum size specified shall not be less than 18inches total length..0204 SEASON, SIZE AND HARVEST LIMIT: ATLANTIC OCEAN(a) It is unlawful to possess striped bass taken from the Atlantic Ocean less thanthe size limit as determined by the Atlantic States Marine FisheriesCommission in their Interstate Fisheries <strong>Management</strong> <strong>Plan</strong> for striped bass.The Fisheries Director shall issue proclamations necessary to bring NorthCarolina’s size limit in compliance with the Interstate Fisheries <strong>Management</strong><strong>Plan</strong>.(b) It is unlawful to buy, sell, transport, or possess striped bass from the AtlanticOcean by any means except that the Fisheries Director may establish anopen season at any time, <strong>and</strong> is further empowered to impose any or all <strong>of</strong>the following restrictions:(1)Specify number <strong>of</strong> days,(2)Specify areas,(3)Specify means <strong>and</strong> methods which may be employed in the taking,(4)Specify time period,(5)Limit the quantity, both commercially <strong>and</strong> recreationally, <strong>and</strong>(6)Provide for biological sampling <strong>of</strong> fish harvested..0205 PROHIBITED TRAWLING(a) It is unlawful to possess striped bass on a vessel with a trawl net on thatvessel in internal coastal waters except during transit from ocean fishinggrounds to port during any open season in the Atlantic Ocean established byproclamation. Striped bass so possessed must meet the minimum size limitset by proclamation.(b)It is unlawful to possess striped bass on a vessel in the Atlantic Ocean with atrawl net on that vessel except during any open season in the Atlantic Oceanestablished by proclamation..0206 HYBRID STRIPED BASS CULTURECulture <strong>and</strong> sale <strong>of</strong> hybrid striped bass conducted in accordance with Rule 15A<strong>NC</strong>AC 10H Section .0700 <strong>of</strong> the North Carolina Wildlife Resources Commissionshall be exempt from rules <strong>of</strong> the North Carolina Marine Fisheries Commissionconcerning striped bass.30
15A<strong>NC</strong>AC SUBCHAPTER 3O- LICENSES, LEASES AND FRA<strong>NC</strong>HISESSECTION .0300- RECREATIONAL COMMERCIAL GEAR LICENSES.0301 ELIGIBILITY FOR RECREATIONAL COMMERCIAL GEAR LICENSES(a) It is unlawful for any individual to hold more than on RecreationalCommercial Gear License.(b) Recreational Commercial Gear Licenses shall only be issued to individuals..0302 AUTHORIZED GEAR(a) The following are the only commercial fishing gear authorized (includingrestrictions) for use under a valid Recreational Commercial Gear License:(1) One seine 30 feet or over in length but not greater than 100 feet with amesh length less than 2 ½ inches when deployed or retrieved withoutthe use <strong>of</strong> a vessel or any other mechanical methods. A vessel mayonly be used to transport the seine;(2) One shrimp trawl with a headrope not exceeding 26 feet in length pervessel. Mechanical methods for retrieving the trawl are not authorizedfor recreational purposes, including but not limited to, h<strong>and</strong> winches<strong>and</strong> block <strong>and</strong> tackle;(3) With or without a vessel, five eel, fish, shrimp, or crab pots in anycombination, except only two pots <strong>of</strong> the five may be eel pots. Peelerpots are not authorized for recreational purposes;(4) One multiple hook or multiple bait trotline up to 100 feet in length;(5) Gill Nets:(A) Not more than 100 yards <strong>of</strong> gill nets with a mesh length equal toor greater than 2 ½ inches except as provided in (5) (C) <strong>of</strong> thisRule. Attendance is required at all times;(B) Not more than 100 yards <strong>of</strong> gill nets with a mesh length equal toor greater than 5 ½ inches except as provided in (5) (C) <strong>of</strong> thisRule. Attendance is required when used from one hour aftersunrise through one hour before sunset in the Atlantic Ocean <strong>and</strong>north <strong>and</strong> west <strong>of</strong> a line beginning at a point at the Fort Maconrock jetty at 34° 41.8100’ N - 76° 40.6244’ W, running to a point atthe east end <strong>of</strong> the Beaufort Highway 70 Drawbridge at 34°43.3417’ N - 76° 40.0992’ W including Newport River. Thenorthern boundary in Newport River is the Highway 101 Bridge.Attendance is required at all times south <strong>and</strong> west <strong>of</strong> that line ininternal waters; <strong>and</strong>(C) Not more than 100 yards <strong>of</strong> gill net may be used at any one time,except that when two or more Recreational Commercial GearLicense holders are on board, a maximum <strong>of</strong> 200 yards may beused from a vessel;(D) It is unlawful to possess aboard a vessel more than 100 yards <strong>of</strong>gill nets with a mesh length less than 5 ½ inches identified asrecreational commercial fishing equipment when only one31
ecreational Commercial Gear License holder is on board. It isunlawful to possess aboard a vessel more than 200 yards <strong>of</strong> gillnets with a mesh length less than 5 ½ inches <strong>and</strong> more than 200yards <strong>of</strong> gill nets with a mesh length equal to or greater than 5 ½inches identified as recreational commercial fishing equipmentwhen two or more Recreational Commercial Gear License holdersare on board; <strong>and</strong>(6) A h<strong>and</strong>-operated device generating pulsating electrical current for thetaking <strong>of</strong> catfish in the area described in 15A <strong>NC</strong>AC 03J .0304.(b) It is unlawful to use more than the quantity <strong>of</strong> authorized gearspecified in Subparagraphs (a) (1) – (a) (6) <strong>of</strong> this Rule,regardless <strong>of</strong> the number <strong>of</strong> individuals aboard a vesselpossessing a valid recreational Commercial Gear License.(c) It is unlawful for a person to violate the restrictions <strong>of</strong> or use gearother than authorized by Paragraph (a) <strong>of</strong> this Rule.(d) Unless otherwise provided, this Rule does not exemptRecreational Commercial Gear License holders from theprovisions <strong>of</strong> other applicable rules <strong>of</strong> the Marine FisheriesCommission or provisions <strong>of</strong> proclamations issued by theFisheries Director as authorized by the Marine FisheriesCommission..0303 RECREATIONAL COMMERCIAL GEAR LICENSE POSSESSION LIMITS(a) It is unlawful to possess more than a single recreational possession limitwhen only one person aboard a vessel possesses a valid RecreationalCommercial Gear License <strong>and</strong> recreational commercial fishing equipment asdefined in 15A <strong>NC</strong>AC 03O.0302 (a) is used, regardless <strong>of</strong> the number <strong>of</strong>persons on board.(b) It is unlawful to possess individual recreational possession limits in excess <strong>of</strong>the number <strong>of</strong> individuals aboard a vessel holding valid RecreationalCommercial Gear Licenses.(c) It is unlawful for any person who holds both a Recreational Commercial GearLicense <strong>and</strong> a St<strong>and</strong>ard or Retired St<strong>and</strong>ard Commercial Fishing License<strong>and</strong> who is in possession <strong>of</strong> identified recreational commercial fishingequipment as defined in 15A <strong>NC</strong>AC 03O .0302 (a), to exceed the singlerecreational possession limit.(d) It is unlawful for persons aboard a vessel collectively holding only oneRecreational Commercial Gear License <strong>and</strong> any St<strong>and</strong>ard CommercialFishing License or Retired St<strong>and</strong>ard Commercial fishing License <strong>and</strong> whoare in possession <strong>of</strong> any identified recreational commercial fishing equipmentas defined in 15A <strong>NC</strong>AC 03O .0302 (a), to exceed one recreationalpossession limit.SECTION .0500 PERMITS32
.0503 PERMIT CONDITIONS; SPECIFIC(b) Dealers Permits for Monitoring Fisheries under a Quota/Allocation:(1) During the commercial season opened by proclamation or rule for thefishery for which a Dealers Permit for Monitoring Fisheries under aQuota/Allocation permit is issued, it is unlawful for fish dealers issuedsuch permit to fail to:(A) Fax or send via electronic mail by noon daily, on forms providedby the Division, the previous day’s l<strong>and</strong>ings for the permittedfishery to the dealer contact designated on the permit. L<strong>and</strong>ingsfor Fridays or Saturdays may be submitted on the followingMonday. If the dealer is unable to fax or electronic mail therequired information, the permittee may call in the previous day’sl<strong>and</strong>ings to the dealer contact designated on the permit but t mustmaintain a log furnished by the Division;(B) Submit the required log to the Division upon request or no laterthan five days after the close <strong>of</strong> the season for the fisherypermitted;(C) Maintain faxes <strong>and</strong> other related documentation in accordancewith 15A <strong>NC</strong>AC 3I .0114;(D) Contact the dealer contact daily regardless <strong>of</strong> whether or not atransaction for the fishery for which a dealer is permitted occurred:(E) Record the permanent dealer identification number on the bill <strong>of</strong>lading or receipt for each transaction or shipment from thepermitted fishery.(2) Striped Bass Dealer Permit:(A) It is unlawful for a fish dealer to possess, buy, sell or<strong>of</strong>fer for sale striped bass taken from the followingareas without first obtaining a Striped Bass DealerPermit validated for the applicable harvest area:(i) Atlantic Ocean;(ii) Albemarle Sound <strong>Management</strong> Area for StripedBass, which is, defined as Albemarle Sound <strong>and</strong>all its joint water tributaries including RoanokeRiver, up to the Hwy. 258 bridge; Eastmost <strong>and</strong>Middle Rivers, <strong>and</strong> Cashie River below SansSouci Ferry; Currituck Sound <strong>and</strong> all its joint watertributaries; Roanoke <strong>and</strong> Croatan Sounds <strong>and</strong> alltheir joint water tributaries, including Oregon Inlet,east <strong>of</strong> a line from Baum Point 34° 55 .1602’ N -75° 39 .5736’ W; to Rhodoms Point 36° 00 .2146’N - 75° 43 .6399’ W <strong>and</strong> east <strong>of</strong> a line fromEagleton Point 36° 01 .3178’ N - 75° 43 .6585’W; to Long Point 36° 02 .4971’ N - 75° 44 .2261’W at the mouth <strong>of</strong> Kitty Hawk Bay <strong>and</strong> north <strong>of</strong> aline from Roanoke Marshes Point 35° 48 .3693’N – 75° 43 .1710’ W, to the north point <strong>of</strong> Eagle33
(B)(iii)Nest Bay 35° 44 .1710’ N - 75° 31 .0520’ W;Croatan Sound south <strong>of</strong> a line at the Highway64/264 bridge at Manns Harbor <strong>and</strong> north <strong>of</strong> a linefrom Roanoke Marshes Point 35° 48 .3693’ N -75° 43 .7232’ W; to the north point <strong>of</strong> Eagle NestBay 35° 44 .1710’ N - 75° 31 .0520’ W;Central Area which is defined as all internalcoastal waters <strong>of</strong> Carteret, Craven, Beaufort, <strong>and</strong>Pamlico counties; Pamlico <strong>and</strong> Pungo rivers; <strong>and</strong>Pamlico Sound south <strong>of</strong> line from RoanokeMarshes Point 35° 48 .3693’ N - 75° 43 .7232’ W,to the north point <strong>of</strong> Eagle Nest Bay 35° 44 .1710’N - 75° 31 .0520’ W (southern boundary <strong>of</strong>Albemarle Sound <strong>Management</strong> Area for StripedBass) to the county boundaries;(iv) Southern Area, which is, defined as all internalcoastal waters <strong>of</strong> Pender, Onslow, New Hanover<strong>and</strong> Brunswick counties.No permittee may possess, buy, sell or <strong>of</strong>fer for sale stripedbass taken from the harvest areas opened by proclamationwithout having a North Carolina Division <strong>of</strong> Marine Fisheriesissued valid tag for the applicable area affixed through themouth <strong>and</strong> gill cover or, in the case <strong>of</strong> striped bass importedfrom other states, a similar tag that is issued for striped bassin the state <strong>of</strong> origin. North Carolina Division <strong>of</strong> MarineFisheries striped bass tags may not be bought, sold, <strong>of</strong>feredfor sale, or transferred. Tags shall be obtained at the NorthCarolina Division <strong>of</strong> Marine Fisheries Offices. The Division <strong>of</strong>Marine Fisheries shall specify the quantity <strong>of</strong> tags to beissued based on historical striped bass l<strong>and</strong>ings. It isunlawful for the permittee to fail to surrender unused tags tothe Division upon request.15A <strong>NC</strong>AC SUBCHAPTER 3Q- JURISDICTION OF AGE<strong>NC</strong>IES: CLASSIFICATIONOF WATERSSECTION.0100- GENERAL REGULATIONS: JOINT.0107 SPECIAL RULES, JOINT WATERSIn order to effectively manage all fisheries resources in joint waters <strong>and</strong> in order toconfer enforcement powers on both fisheries enforcement <strong>of</strong>ficers <strong>and</strong> wildlifeenforcement <strong>of</strong>ficers with respect to certain rules, the Marine FisheriesCommission <strong>and</strong> the Wildlife Resources Commission deem it necessary to adoptspecial rules for joint waters. Such rules supersede any inconsistent rules <strong>of</strong> theMarine Fisheries Commission or the Wildlife Resources Commission that would34
otherwise be applicable in joint waters under the provisions <strong>of</strong> 15A <strong>NC</strong>AC 3Q.0106:(1) Striped bass:(a) It is unlawful to possess any striped bass or striped bass hybrid takenby any means which is less than 18 inches long (total length).(b) It is unlawful to possess more than three striped bass or striped bassby hook <strong>and</strong> line or with gear authorized by a Recreational CommercialGear License in any one day from joint waters.(c) It is unlawful to engage in net fishing for striped bass or striped basshybrids in joint waters except as authorized by duly adopted rules <strong>of</strong> theMarine Fisheries Commission.(d) It is unlawful to possess striped bass or striped bass hybrids in the jointwaters <strong>of</strong> Albemarle, Currituck, Roanoke, <strong>and</strong> Croatan Sounds <strong>and</strong>their tributaries, excluding the Roanoke River, except during seasonsas authorized by duly adopted rules <strong>of</strong> the Marine FisheriesCommission.(e) In the joint waters <strong>of</strong> the Roanoke River <strong>and</strong> its tributaries includingCashie, Middle <strong>and</strong> Eastmost Rivers, striped bass <strong>and</strong> hybrid stripedbass fishing season, size limits <strong>and</strong> creel limits shall be the same asthose established by duly adopted rules <strong>of</strong> the Wildlife ResourcesCommission for adjacent inl<strong>and</strong> fishing waters..0108 MANAGEMENT PLANS FOR STRIPED BASS IN JOINT WATERSIn order to effectively manage the recreational hook <strong>and</strong> line harvest in joint waters<strong>of</strong> the Albemarle-Roanoke stock <strong>of</strong> striped bass, the Marine Fisheries Commission<strong>and</strong> the Wildlife resources Commission deem it necessary to establish twomanagement areas for the joint waters <strong>of</strong> the Albemarle Sound <strong>and</strong> the RoanokeRiver, along with their defined tributaries. The Wildlife Resources Commission shallhave principal management responsibility for the stock when it is in the joint <strong>and</strong>inl<strong>and</strong> fishing waters <strong>of</strong> the Roanoke River <strong>and</strong> its tributaries including Cashie,Middle, <strong>and</strong> Eastmost Rivers. The Marine Fisheries Commission shall have principalmanagement responsibility for the stock in the remaining waters <strong>of</strong> the Albemarle,Currituck, Roanoke <strong>and</strong> Croatan Sounds <strong>and</strong> their tributaries, including joint <strong>and</strong>inl<strong>and</strong> waters. The annual quota for recreational harvest <strong>of</strong> the Albemarle-Roanokestriped bass shall be divided equally between the two management areas. Themanagement plan shall:(1) Be consistent with the guidelines established in the Atlantic States MarineFisheries Commission <strong>Plan</strong> for Striped Bass.(2) Limit harvest to a one fish per person per day creel limit in areas for which nodata collection program is ongoing..0109 IMPLEMENTATION OF STRIPED BASS MANAGEMENT PLANS:RECREATIONAL FISHINGThe Marine Fisheries <strong>and</strong> Wildlife Resources Commissions shall implement theirrespective striped bass management plans for recreational fishing pursuant to their35
espective rule-making powers. To preserve jurisdictional authority <strong>of</strong> eachCommission while establishing a means to implement their management plans, theCommissions find it necessary to create a means through which managementmeasures can be implemented by a single instrument in each management area.(1) In the Roanoke River <strong>and</strong> tributaries, the exclusive authority to open <strong>and</strong>close seasons <strong>and</strong> areas, whether inl<strong>and</strong> or joint fishing waters shall bevested in the Wildlife Resources Commission. The Wildlife ResourcesCommission shall initiate action to close the management area when 90percent <strong>of</strong> the assigned quota has been taken. An instrument closing anymanagement area in joint waters shall operate as <strong>and</strong> shall be a jointlyissued instrument opening or closing seasons or areas to harvest in theRoanoke River management area.(2) In the Albemarle Sound management area, the exclusive authority to open<strong>and</strong> close seasons <strong>and</strong> areas, whether coastal or joint fishing waters shall bevested in the Marine Fisheries Commission. The Marine FisheriesCommission shall initiate action to close the management area when 90percent <strong>of</strong> the assigned quota has been taken. In the Albemarle Soundmanagement area administered by the Marine Fisheries Commission, aninstrument or action by the Marine Fisheries Commission affecting theharvest in joint <strong>and</strong> coastal waters, excluding the Roanoke Rivermanagement area, shall automatically be implemented <strong>and</strong> effective as aWildlife Resources Commission action in the inl<strong>and</strong> waters <strong>and</strong> tributaries tothe waters affected.4.4.3.2 Wildlife Resources Commission Rules15A <strong>NC</strong>AC 10C .0107 SPECIAL REGULATIONS: JOINT WATERSIn order to effectively manage all fisheries resources in joint waters <strong>and</strong> in order toconfer enforcement powers on both fisheries enforcement <strong>of</strong>ficers <strong>and</strong> wildlifeenforcement <strong>of</strong>ficers with respect to certain rules; the Marine FisheriesCommission <strong>and</strong> the Wildlife Resources Commission deem it necessary to adoptspecial rules for joint waters. Such rules supercede any inconsistent rules <strong>of</strong> theMarine Fisheries Commission or the Wildlife Resources Commission that wouldotherwise be applicable in joint waters under the provisions <strong>of</strong> 15A <strong>NC</strong>AC 10C.0106:(1) Striped Bass(a) It shall be unlawful to possess any striped bass or striped bass hybridtaken by any means which is less than 18 inches long (total length).(b) It shall be unlawful to possess more than three striped bass or theirhybrids taken by hook <strong>and</strong> line in any one day from joint waters.(c) It shall be unlawful to engage in net fishing for striped bass or theirhybrids in joint waters except as authorized by duly adopted rules <strong>of</strong> theMarine Fisheries Commission.(d) It is unlawful to possess striped bass or striped bass hybrids in the jointwaters <strong>of</strong> Albemarle, Currituck, Roanoke <strong>and</strong> Croatan Sounds <strong>and</strong> their36
(e)tributaries, excluding the Roanoke River, except during seasons asauthorized by duly adopted rules <strong>of</strong> the Marine Fisheries Commission.In the joint waters <strong>of</strong> the Roanoke River <strong>and</strong> its tributaries, includingCashie, Middle <strong>and</strong> Eastmost Rivers, striped bass <strong>and</strong> hybrid stripedbass fishing season, size limits <strong>and</strong> creel limits shall be the same asthose established <strong>and</strong> authorized by duly adopted rules <strong>of</strong> the WildlifeResources Commission for adjacent inl<strong>and</strong> fishing waters.15A <strong>NC</strong>AC 10C .0110 MANAGEMENT PLANS FOR STRIPED BASS IN JOINTWATERSIn order to effectively manage the recreational hook <strong>and</strong> line harvest in joint waters<strong>of</strong> the Albemarle-Roanoke stock <strong>of</strong> striped bass, the Marine Fisheries Commission<strong>and</strong> the Wildlife Resources Commission deem it necessary to establish twomanagement areas for the joint waters <strong>of</strong> the Albemarle Sound <strong>and</strong> Roanoke River,along with their defined tributaries. The Wildlife Resources Commission shall haveprincipal management responsibility for the stock when it is in the joint <strong>and</strong> inl<strong>and</strong>fishing waters <strong>of</strong> the Roanoke River <strong>and</strong> its tributaries, including Cashie, Middle <strong>and</strong>Eastmost Rivers. The Marine Fisheries Commission shall have principalmanagement responsibility for the stock in the remaining waters <strong>of</strong> the Albemarle,Currituck, Roanoke <strong>and</strong> Croatan Sounds <strong>and</strong> their tributaries, including joint <strong>and</strong>inl<strong>and</strong> waters. The annual quota for recreational harvest <strong>of</strong> the Albemarle-Roanokestriped bass stock shall be divided equally between the two management areas.The management plans shall:(1) Be consistent with the guidelines established in the Atlantic States MarineFisheries Commission <strong>Plan</strong> for Striped Bass.(2) Limit harvest to a one fish per person per day creel limit in areas for which nodata collection program is ongoing.15A <strong>NC</strong>AC 10C .0111 IMPLEMENTATION/STRIPED BASS MANAGEMENTPLAN/RECREATIONAL FISHINGThe Marine Fisheries <strong>and</strong> Wildlife Resources Commissions shall implement theirrespective striped bass management plans for recreational fishing pursuant to theirrespective rulemaking powers. To preserve jurisdictional authority <strong>of</strong> eachCommission while establishing a means to implement their management plans, theCommissions find it necessary to create a means through which managementmeasures can be implemented by a single instrument in each management area.(1) In the Roanoke River <strong>and</strong> tributaries, the exclusive authority to open <strong>and</strong> closeseasons <strong>and</strong> areas, whether inl<strong>and</strong> or joint fishing waters shall be vested in theWildlife Resources Commission. The Wildlife Resources Commission shallinitiate action to close the management area when 90 percent <strong>of</strong> the assignedquota has been taken. An instrument closing any management area in jointwaters shall operate as <strong>and</strong> shall be a jointly issued instrument opening orclosing seasons or areas to harvest in the Roanoke River management area.(2) In the Albemarle Sound management area, the exclusive authority to open<strong>and</strong> close seasons <strong>and</strong> areas, whether coastal or joint fishing waters shall bevested in the Marine Fisheries Commission. The Marine Fisheries Commission37
shall initiate action to close the management area when 90 percent <strong>of</strong> theassigned quota has been taken. In the Albemarle Sound management areaadministered by the Marine Fisheries Commission, an instrument or action bythe Marine Fisheries Commission affecting the harvest in joint <strong>and</strong> coastalwaters, excluding the Roanoke River management area, shall automatically beimplemented <strong>and</strong> effective as a Wildlife Resources Commission action in theinl<strong>and</strong> waters <strong>and</strong> tributaries to the waters affected.15A <strong>NC</strong>AC 10C .0215 REPLACEMENT COSTS OF WILDLIFE RESOURCES-FISH(a) Replacement Costs Distinguished. As it applies to fishes the term“replacement costs” must be distinguished from the “value” <strong>of</strong> the fishconcerned. Except in cases where fish may lawfully be sold on the openmarket, as with commercially reared species, the monetary value <strong>of</strong> thespecimens cannot be determined easily. The degree <strong>of</strong> special interest orconcern in a particular species by the public, including not only anglers, butalso conservationists <strong>and</strong> those whom the value <strong>of</strong> fishes is primarilyaesthetic, cannot be measured in dollar amounts. The average cost per fishlegally taken by anglers including travel <strong>and</strong> lodging, fishing equipment <strong>and</strong>bait, excise taxes on equipment, licenses <strong>and</strong> other fees, may fairly beestimated. This too, however, is a reflection <strong>of</strong> the value <strong>of</strong> fish speciesshould be considered only as they may bear on the necessity or desirability<strong>of</strong> actual replacement.(b) Factors to be Considered. The factors which should be considered indetermining the replacement costs <strong>of</strong> resident species <strong>of</strong> fishes that havebeen taken, injured, removed, harmfully, altered, damaged, or destroyedinclude the following:(1) whether the species is classified as endangered or threatened;(2) the relative frequency <strong>of</strong> occurrence <strong>of</strong> the species in the state;(3) the extent <strong>of</strong> existing habitat suitable for the species within the state;(4) the dependency <strong>of</strong> the species on unique habitat requirements;(5) the cost <strong>of</strong> improving <strong>and</strong> maintaining suitable habitat for the species;(6) the cost <strong>of</strong> capturing the species in areas <strong>of</strong> adequate populations <strong>and</strong>transplanting them to areas <strong>of</strong> suitable habitat with low populations;(7) the cost <strong>of</strong> propagating <strong>and</strong> rearing the species in a hatchery <strong>and</strong> thecost <strong>of</strong> transporting them to areas <strong>of</strong> suitable habitat with lowpopulations;(8) the availability <strong>of</strong> the species <strong>and</strong> the cost <strong>of</strong> acquisition for restockingpurposes;(9) the cost <strong>of</strong> those species which, when released, have a probability <strong>of</strong>survival in the wild;(10) the ratio between the natural life expectancy <strong>of</strong> the species <strong>and</strong> theperiod <strong>of</strong> its probable survival when, having been reared in a hatchery,it is released to the wild;(11) the change in value <strong>of</strong> money as reflected by the consumer price index,38
(c)Costs <strong>of</strong> Replacement. Based on the factors listed in Paragraph(b) <strong>of</strong> this Rule, including the June, 1980, consumer price index <strong>of</strong>247.6 percent <strong>of</strong> the 1967 base, the following fishes are listed withthe estimated replacement cost:Species Weight Replacement CostStriped bass <strong>and</strong> up to 5 lbs. $ 25/fishBodie bass 5 lbs. to 10 lbs. $ 20/lb.10 lbs. to 20 lbs. $ 25/lb.Over 20 lbs.$ 30/lb.15A <strong>NC</strong>AC 10C .0301 INLAND GAME FISHES DESIGNATEDThe following fishes are classified <strong>and</strong> designated as inl<strong>and</strong> game fishes:(10) striped bass <strong>and</strong> Morone hybrids (striped bass-white bass), when found ininl<strong>and</strong> fishing waters;15A <strong>NC</strong>AC 10C .0302 MANNER OF TAKING INLAND GAME FISHES(d) In the inl<strong>and</strong> waters <strong>of</strong> the Roanoke River upstream <strong>of</strong> U.S. 258 bridge, onlya single barbless hook or a lure with a single barbless hook may be usedfrom 1 April to 30 June. Barbless as used in this Rule, requires that the hookdoes not have a barb or the barb is bent down.15A <strong>NC</strong>AC 10C .0304 TAKING AND POSSESSION OF INLAND GAME FISHES(a) It is unlawful to take in one day more than the daily creel limit <strong>of</strong> thosespecies <strong>of</strong> inl<strong>and</strong> game fish having a specified creel limit; to possess morefish than the daily creel limit in effect on those waters being fished; topossess any fish outside <strong>of</strong> the size limit in effect on those waters beingfished; to possess more fish than the daily creel limit while boating or afield;or to possess at any place more than three days creel limit. It is unlawful todestroy unnecessarily any inl<strong>and</strong> game fish taken from public fishing waters.(b) No person while fishing shall remove the head or tail or otherwise change theappearance <strong>of</strong> any game fish having a minimum size limit so as to render itimpracticable to measure its total original length. No person while fishingshall change the appearance <strong>of</strong> any game fish having a daily creel limit so asto obscure its identification or render it impracticable to count the number <strong>of</strong>fish in possession.15A <strong>NC</strong>AC 10C .0305 OPEN SEASONS: CREEL AND SIZE LIMITS(a) Generally. Subject to the exceptions listed in Paragraph (b) <strong>of</strong> this Rule, theopen seasons <strong>and</strong> creel <strong>and</strong> size limits are as indicated in the following table:39
Game Fishes Daily Creel Limits Minimum Size Limits Open SeasonStriped Bass<strong>and</strong> their hybrids(Morone Hybrids)8 aggregate(excs. 1, 5 & 12)16 in.(excs. 1, 6, 5 & 10)All Year(excs. 5, 12, &14)(b)Exceptions(5) In the inl<strong>and</strong> fishing waters <strong>of</strong> Cape Fear, Neuse, Pee Dee, Pungo <strong>and</strong>Tar Pamlico rivers <strong>and</strong> their tributaries extending upstream to the firstimpoundment, <strong>and</strong> Lake Mattamuskeet, the daily creel limit for stripedbass <strong>and</strong> their hybrids is three fish in aggregate <strong>and</strong> the minimumlength is 18 inches. In the Tar Pamlico River <strong>and</strong> its tributariesupstream <strong>of</strong> the <strong>NC</strong> 55 bridge in Lenior County, no striped bass orstriped bass hybrids between the lengths <strong>of</strong> 22 inches <strong>and</strong> 27 inchesshall be retained during the period April 1 through May 31.(6) The open season for taking <strong>and</strong> possessing striped bass <strong>and</strong> theirhybrids in the Roanoke River Striped Bass <strong>Management</strong> Area is March1 through April 15 from the joint-coastal fishing waters boundary atAlbemarle Sound upstream to the US 258 bridge <strong>and</strong> is March 15through April 30 from the US 258 bridge upstream to Roanoke RapidsLake dam. During the open season the daily creel limit for striped bass<strong>and</strong> their hybrids is two fish <strong>and</strong> no fish between 22 inches <strong>and</strong> 27inches in length shall be retained.(13) In designated inl<strong>and</strong> fishing waters <strong>of</strong> Roanoke Sound, Croatan Sound,Albemarle Sound, Chowan River, Currituck Sound, Alligator River,Scuppernong River, <strong>and</strong> their tributaries (excluding the Roanoke River,<strong>and</strong> Cashie River <strong>and</strong> their tributaries), striped bass fishing season, sizelimits <strong>and</strong> creel limits shall be the same as those established by dulyadopted rules or proclamations <strong>of</strong> the Marine Fisheries Commission inadjacent joint or coastal fishing waters.(15) The Executive Director may, by proclamation, suspend or extend thehook-<strong>and</strong>-line season for striped bass in the inl<strong>and</strong> <strong>and</strong> joint waters <strong>of</strong>coastal rivers <strong>and</strong> their tributaries. It is unlawful to violate the provisions<strong>of</strong> any proclamation issued under this authority.SECTION .0500- PRIMARY NURSERY AREAS15A <strong>NC</strong>AC 10C .0501 SCOPE AND PURPOSETo establish <strong>and</strong> protect those fragile inl<strong>and</strong> waters which support embryonic,larval or juvenile populations <strong>of</strong> marine or estuarine fish or crustacean species.These rules will set forth permanent nursery areas in inl<strong>and</strong> fishing waters.Nursery areas are necessary for the early growth <strong>and</strong> development <strong>of</strong> virtually all<strong>of</strong> North Carolina’s important marine or estuarine fish or crustacean species.Nursery areas need to be maintained, as much as possible, in their natural state,<strong>and</strong> the fish <strong>and</strong> crustacean populations within them must be permitted to developin a normal manner with as little interference from man as possible.40
15A <strong>NC</strong>AC 10C .0502 PRIMARY NURSERY AREAS DEFINEDPrimary nursery areas are defined as those areas inhabited by the embryonic,larval or juvenile life stages <strong>of</strong> marine or estuarine fish or crustacean species dueto favorable physical, chemical or biological factors.15A <strong>NC</strong>AC 10C .0503 DESCRIPTIVE BOUNDARIESThe following waters have been designated as primary nursery areas:(1) North River:(a) Broad Creek- Camden County- Entire stream;(b) Deep Creek- Currituck County- Entire stream;(c) Lutz Creek- Currituck County- Entire stream.(2) Alligator River:(a) East Lake- Dare County- Inl<strong>and</strong> waters portion;(b) Little Alligator River- Tyrrell County- Entire stream.(3) Currituck Sound:(a) Martin Point Creek- Dare County- Entire stream (Jean GuiteCreek);(b) Tull Creek <strong>and</strong> Bay- Currituck County- Tull Bay to mouth <strong>of</strong>Northwest River;Tull Creek from mouth upstream to SR 1222 bridge.(4) Pamlico River:(a) Duck Creek- Beaufort County- Entire stream;(b) Bath Creek- Beaufort County- Entire stream;(c) Mixons Creek- Beaufort County- Entire stream;(d) Porter Creek- Beaufort County- Entire stream;(e) Tooleys Creek- Beaufort County- Entire stream;(f) Jacobs Creek- Beaufort County- Entire stream;(g) Jacks Creek- Beaufort County- Entire stream;(h) Bond Creek- Beaufort County- Entire stream;(i) Muddy Creek- Beaufort County- Entire stream;(j) Strawhorn Creek- Beaufort County- Entire stream;(k) South Prong Wright Creek- Beaufort County- Entire stream;(l) Jordan Creek- Beaufort County- Entire stream.(5) Neuse River:(a) Slocum Creek- Craven County- Entire stream;(b) Hancock Creek- Craven County- entire stream.(6) New River:(a) French Creek- Onslow County- Entire stream;(b) New River- Onslow County- US Highway 17 bridge to point 0.75miles upstream.(7) Roanoke River: Halifax <strong>and</strong> Northhampton counties- US Hwy 258 bridgeto Roanoke Rapids dam(8) Tar-Pamlico River: Nash, Edgecombe, Pitt <strong>and</strong> Beaufort counties- N&Srailroad at Washington upstream to Rocky Mount Mills Dam.(9) Neuse River: Wake, Johnson, Wayne, Lenior, Pitt <strong>and</strong> Craven counties-Pitchkettle Creek upstream to Millburnie Dam.41
(10) Cape Fear River: Chatham, Lee, Harnett, Cumberl<strong>and</strong> <strong>and</strong> Bladencounties- Lock <strong>and</strong> Dam No. 1 to Buckhorn dam.5.0. GENERAL LIFE HISTORY5.1 Description <strong>and</strong> DistributionThe accepted common <strong>and</strong> scientific names for the species are striped bass, Moronesaxatilis, (Walbaum) (Robins et al. 1991). In North Carolina it is also known as striper,rockfish, or rock. The body <strong>of</strong> a striped bass is elongate <strong>and</strong> moderately compressedwith a slightly arched back. The lower jaw protrudes <strong>and</strong> extends posteriorly to themiddle <strong>of</strong> the orbit. Color dorsally ranges from shades <strong>of</strong> green to steel blue or almostblack. The sides are silvery with 7 or 8 dark, more or less continuous stripes, one <strong>of</strong>which always follows the lateral line, with 3 or 4 others above it <strong>and</strong> 3 below. Ventrally,the fish are white to silver with brassy iridescence. They have one s<strong>of</strong>t <strong>and</strong> one spinydorsal fin separated at the base <strong>and</strong> about equal in length. Striped bass are relativelylong-lived <strong>and</strong> capable <strong>of</strong> attaining moderately large size. Fish weighing 50 or 60pounds are not exceptional. In general, females grow larger than males; reportedmaximum lengths are 1,524 mm FL (60.0 inches) <strong>and</strong> 1,156 mm FL (45.5 inches),respectively (Hill et al. 1989; ASMFC 1990). The largest striped bass on record are tw<strong>of</strong>emales caught in Albemarle Sound, North Carolina weighing 125 pounds each (Smith1907).5.2 General Life HistoryStudies from 1938 through the 1990s indicate that only a small portion <strong>of</strong> striped bassspawned in the A/R system migrates out <strong>of</strong> the system to <strong>of</strong>fshore waters (NorthCarolina Striped Bass Study <strong>Management</strong> Board 1992). Since the A/R stock hasrecovered <strong>and</strong> exp<strong>and</strong>ed however, an increasing number <strong>of</strong> tag returns indicate thatlarger A/R striped bass are migrating to the Atlantic Ocean <strong>and</strong> to northern coastalwaters. This increase in distant tag returns likely reflects an increase in survival <strong>of</strong> largerindividuals <strong>and</strong> the inability <strong>of</strong> these individuals to tolerate high summertime watertemperatures <strong>of</strong> Albemarle Sound. In order to spawn successfully, striped bass requirewaters having suitable flows, salinities, temperatures, <strong>and</strong> other aspects <strong>of</strong> habitatquality, which make the species particularly vulnerable to river flow alterations (Rulifsonet al. 1982b).5.2.1 SpawningStriped bass spawn in fresh water or nearly freshwater portions <strong>of</strong> North Carolinacoastal rivers from late March to June depending upon water temperatures (Hill et al.1989). Peak spawning activity occurs when water reaches 62°-67° F (16.7°-19.4° C) onthe Roanoke River (Rulifson 1990 <strong>and</strong> 1991a), 66.2° F (19° C) on the Cape Fear(Sholar 1977; Fischer 1980), <strong>and</strong> 68°-70.7° F (20°- 21.5° C) on the Neuse (Hawkins1979; Baker 1968), <strong>and</strong> 64°- 69°F (18°- 22° C) in Tar River (Kornegay <strong>and</strong> Humphries1975). Spawning behavior is characterized by brief peaks <strong>of</strong> surface activity when amature female is surrounded by up to 50 males as eggs are broadcast into thesurrounding water, <strong>and</strong> males release sperm (Setzler et al. 1980). Spawning by a givenfemale is probably completed within a few hours (Lewis <strong>and</strong> Bonner 1966).42
5.2.2 EggsMature eggs are .039 to 0.59 inch (1.0-1.5 mm) in diameter when spawned, <strong>and</strong> remainviable for about 1 hour (hr) before fertilization (Stevens 1966). Fertilized eggs arespherical, non-adhesive, semi-buoyant <strong>and</strong> nearly transparent. Water hardening occursin a few hours, <strong>and</strong> eggs will range in diameter from .051 to .181 inch (1.3-4.6 mm)(Albrecht 1964; Murawski 1969). To keep eggs in suspension, minimum water velocities<strong>of</strong> .984 feet per second (ft/s) (30 cm/s) are generally required (Albrecht 1964). Theincubation period at peak spawning temperatures ranges from 42 to 55 hours. At 68° F(20.0° C) (Hassler et al. 1981) found that eggs hatch in 38 hours. After hatching, larvaeare carried by the current to the downstream nursery areas.5.2.3 LarvaeThe larval development <strong>of</strong> striped bass is dependent upon water temperature <strong>and</strong> isusually regarded as having three stages: 1) yolk-sac larvae are .20 to .31 inch (5-8 mm)in total length (TL) <strong>and</strong> depend on yolk material as an energy source for 7 to 14 days; 2)fin-fold larvae (.31-.47 inch; 8-12 mm TL) having fully developed mouth parts <strong>and</strong>persist about 10 to 13 days; <strong>and</strong> 3) post fin-fold larvae attain length up to 1.18 inches(30 mm) in 20 to 30 days (Hill et al. 1989). Researchers <strong>of</strong> North Carolina stocks <strong>of</strong>striped bass (primarily Albemarle-Roanoke) divide larval development into yolk-sac <strong>and</strong>post yolk-sac larvae. Growth occurs generally within the same rates described abovedepending upon temperature. At temperatures ≥ 68° F (20° C), larvae reach the juvenilestage in approximately 42 days (Hassler et al. 1981). Yolk-sac larvae can feed as earlyas 5 days post-hatch; the survival rate is reduced as time to first feeding increases. Thiscan become critical, because the nursery grounds where primary food sources occurare considerable distances downstream (especially the Albemarle-Roanoke stock).Larvae are totally dependent upon river flows for transport <strong>and</strong> timing <strong>of</strong> arrival to thenursery grounds where feeding is initiated.5.2.4 JuvenilesMost striped bass enter the juvenile stage at about 1.18 inches (30 mm) TL; the fins arethen fully formed, <strong>and</strong> the external morphology <strong>of</strong> the young is similar to that <strong>of</strong> theadults. Juveniles are <strong>of</strong>ten found in schools <strong>and</strong> apparently prefer clean s<strong>and</strong>y bottoms(Hill et al. 1989). They may spend the first two years <strong>of</strong> life maturing in <strong>and</strong> around thenursery area (Hassler et al. 1981).5.2.5 Maturation <strong>and</strong> FecundityInformation on rates <strong>of</strong> maturation <strong>and</strong> fecundity are unavailable for coastal NorthCarolina stocks except the A/R stock. Recent research conducted on this stockindicates that females begin reaching sexual maturity in approximately 3 years, at sizes<strong>of</strong> 22-24 inches TL (Olsen <strong>and</strong> Rulifson 1991, Trent <strong>and</strong> Hassler 1968). Specifically,about 45% <strong>of</strong> the Roanoke females have reached sexual maturity by age 3; however,the viability <strong>of</strong> the eggs <strong>and</strong> resultant contribution <strong>of</strong> the progeny to the forming yearclass are unknown (Olsen <strong>and</strong> Rulifson 1991). Previous investigators determined theage at first maturity to be age 3 for male <strong>and</strong> age 4 for females (Trent <strong>and</strong> Hassler 1968;Harris <strong>and</strong> Burns 1983; Harris et al. 1984). In general, there is a strong positivecorrelation between the length, weight, <strong>and</strong> age <strong>of</strong> a female striped bass <strong>and</strong> the43
number <strong>of</strong> eggs it produces. All Roanoke River females are mature by age 6, <strong>and</strong> acurvilinear relationship exists between the fish age <strong>and</strong> the number <strong>of</strong> eggs produced,with greatest increase between age 6 <strong>and</strong> age 10. Potential fecundity estimates rangefrom approximately 181,000 eggs for age 3 to 5,000,000 eggs for age 16 (Olsen <strong>and</strong>Rulifson 1991). Lewis (1962) noted that some females in the Roanoke River, age seven<strong>and</strong> older, did not spawn annually.5.2.6 Growth Pattern5.2.6.1 RatesGrowth rates for the A/R stock are rapid during the first three years <strong>of</strong> life, <strong>and</strong> thendecrease to a relatively slow rate as the fish reach sexual maturity. Striped bass growapproximately 270 mm during their 1 st year, 150 mm during their 2 nd year, 70 mm duringtheir 3 rd year, <strong>and</strong> 40-20 mm yearly thereafter (Olsen <strong>and</strong> Rulifson 1991). Mean lengthsat age from large samples <strong>of</strong> Roanoke River striped bass sampled on the spawninggrounds indicate female striped bass grow faster than males (Table 5.1). Growth ratesfor young-<strong>of</strong>-year striped bass ranged from 0.272 mm per day to 0.664 per daydetermined from a 20-year time series during 1955-1978 (Hassler et al. 1981).Statistically significant differences were found in these yearly growth rates. Additionallyanalyses indicated positive correlation with young-<strong>of</strong>-year growth rates <strong>and</strong> riverdischarge. Hassler speculated that increased river discharge transports greater amount<strong>of</strong> organic detritus to the estuary, which results in high productivity <strong>and</strong> faster growthrates for young-<strong>of</strong>-year striped bass.5.2.6.2 Length-Weight RelationshipsLength-weight relationships have been determined specifically for the A/R stock femalesfrom samples collected in 1989 <strong>and</strong> 1990. Regression analysis indicated a highlysignificant linear length-weight relationship (Olsen <strong>and</strong> Rulifson 1991);Total fish weight = -.6381598 + 0.016316 (FL) (r = 0.94, p≤0.0001, n = 265).Trent (1962) established the following relation for first-summer growth <strong>of</strong> striped bass inAlbemarle Sound:Y = 1.84615 + 2.91977X,Where Y is log weight (mg) <strong>and</strong> X is log total length (cm). After maturity, the weight <strong>of</strong>male striped bass is generally less than that <strong>of</strong> females <strong>of</strong> the same length (Merriman1941; Mansueti 1961).5.3 Ecological Relationships5.3.1 Food HabitsMajor food items <strong>of</strong> larvae collected in Albemarle Sound were Bosmina sp. <strong>and</strong>copepodite stage copepods (Rulifson et al. 1991). Several food habit studies have beenconducted on44
Table 5.1.Mean lengths (mm) at age for striped bass sampled from the Roanoke River spawning grounds, yearclasses examined since 1991 (<strong>NC</strong>WRC data).AgeSex <strong>and</strong> YearClass 2 3 4 5 6 7Males1988 465 510 545 573 5811989 384 445 495 523 553 5861990 383 452 494 525 560 5971991 397 450 483 539 569 6131992 397 450 474 543 579 6101993 373 428 511 535 573 6171994 311 462 488 537 569 6081995 383 435 496 534 5641996 382 441 495 5301997 369 450 4891998 387 4381999 389Females1988 493 524 578 592 6211989 399 473 518 549 580 6261990 414 472 513 545 596 6261991 376 478 503 553 597 6311992 447 466 511 572 595 6381993 375 441 536 551 602 6641994 - 469 507 563 616 6361995 381 462 513 573 5841996 423 476 531 5411997 429 472 5121998 439 4621999 -juvenile <strong>and</strong> adult striped bass since 1955 in the Roanoke River <strong>and</strong> Albemarle Sound.The most recent sampling on juvenile striped bass in Albemarle Sound foundzooplankton <strong>and</strong> mysid shrimp as primary prey items for smaller juveniles in thesummer, with small fish (most likely bay anchovies) entering the diet later in the season(Rulifson <strong>and</strong> Bass 1991, Cooper, Rulifson <strong>and</strong> Winslow 1998). Adults feed extensivelyon blueback herring <strong>and</strong> alewives in the river during the spawning migration (Trent <strong>and</strong>Hassler 1968). Manooch (1973) conducted a seasonal food habit study in AlbemarleSound. Fish primarily clupeids (Atlantic menhaden, blueback herring, alewife <strong>and</strong>gizzard shad) <strong>and</strong> engraulids (anchovies), dominated the diet in the summer <strong>and</strong> fall.Atlantic menhaden (54%) was the most frequently eaten species, which comprised arelatively large percentage <strong>of</strong> the volume (50.1%). In the winter <strong>and</strong> spring months,invertebrates occurred more frequently in the diet (primarily amphipods during thewinter <strong>and</strong> blue crabs in the spring). Patrick <strong>and</strong> Moser (2001) found similar results fromthe Cape Fear River, with Atlantic menhaden <strong>and</strong> threadfin shad being the predominatespecies. Rulifson <strong>and</strong> Price (2001) collected striped bass stomachs (34) from the upperCurrituck Sound during 2000 <strong>and</strong> determined that prey within the family Alosinae hadthe highest occurrence. The American shad was the most common species observed inthe fall. DMF through the <strong>Fishery</strong> Independent Gill Net Survey (IGNS) has collected <strong>and</strong>analyzed stomach (1,167) contents from the Albemarle Sound area since 1995. River45
herring (51.8%) was the predominate species from the western sound samples,followed by Atlantic menhaden (25.7%). The dominance <strong>of</strong> river herring during thespawning migration supports that reported by Trent <strong>and</strong> Hassler (1968) <strong>and</strong> Manooch(1973). Blue crabs only accounted for 0.4% <strong>of</strong> the total from the western sound. Atlanticmenhaden (47.8%), Atlantic croaker (18.3%) <strong>and</strong> anchovies (16.9%) dominated theeastern sound samples. Blue crabs comprised 3.2% <strong>of</strong> the stomach contents from theeastern sound.5.3.2 Feeding BehaviorStriped bass are opportunistic feeders; specific food types depend upon the size <strong>of</strong> thefish, habitat, <strong>and</strong> the season (Rulifson et al. 1982a). They undergo an ontogenetic shiftin diet with larvae feeding primarily on mobile planktonic invertebrates (Doroshev 1970;Markle <strong>and</strong> Grant 1970; Bason 1971). As they grow, their diet includes larger aquaticinvertebrates <strong>and</strong> small fish (Shapovalov 1936; Ware 1971).5.3.3 PredatorsThe only likely predators on adult striped bass would include some marine species thatmight ascend rivers <strong>and</strong> sounds or, in the case <strong>of</strong> the A/R stock, during a coastalmigration. These predators might include sharks, bluefish, goose fish/monkfish (Lophiussp.), tuna <strong>and</strong> tarpon. Any sympatric piscivorous fish may be a predator <strong>of</strong> larvae <strong>and</strong>juvenile striped bass. Examination <strong>of</strong> stomach contents <strong>of</strong> white <strong>and</strong> yellow perch,American eel, Atlantic croaker, white <strong>and</strong> channel catfish, <strong>and</strong> striped bass in AlbemarleSound showed that only white <strong>and</strong> channel catfish stomach contents contained Moronesp. (Rulifson 1984).5.3.4 CompetitorsBecause striped bass share forage species with other piscivores, they are potentialcompetitors (Setzler et al. 1980). Young striped bass may also compete with otherfishes for food. Similar nursery areas <strong>and</strong> food habits show a potential for competitionbetween young white perch <strong>and</strong> striped bass (Milhursky et al. 1976). The young mayalso compete with some species <strong>of</strong> clupeids (Hollis 1967).Research in Cape Fear River suggests hybrid striped bass that have escaped fromupstream reservoirs compete for food <strong>and</strong> spawning space with native striped bass(Patrick <strong>and</strong> Moser 2001).5.4 Migration5.4.1 Albemarle-Roanoke Adult Striped BassNumerous tagging or migration studies have been conducted on striped bass in NorthCarolina <strong>and</strong> along the Atlantic Coast since the 1930s. Several <strong>of</strong> these studies suggestthat the A/R stock is migratory with primarily older adults migrating <strong>of</strong>fshore. Tagrecapture studies from previous investigators (Merriman 1941, Vladykov <strong>and</strong> Wallace1952, Davis <strong>and</strong> Sykes 1960, Chapotan <strong>and</strong> Sykes 1961, Nichols <strong>and</strong> Cheek 1966,Holl<strong>and</strong> <strong>and</strong> Yelverton 1973, Street et al. 1975, Hassler et al. 1981. Boreman <strong>and</strong>Lewis, 1987 <strong>and</strong> Benton 1992) indicate that a small amount <strong>of</strong> migration occurs (Table46
5.2). However the studies conducted in the 1980s <strong>and</strong> 1991 were when the agestructure <strong>of</strong> the stock was truncated <strong>and</strong> while the stock, in general was at lowabundance. It was noted by several <strong>of</strong> these investigators that larger, older femaleswere more migratory than males. Fish tagged <strong>and</strong> released at various locations in theAlbemarle Sound have been recaptured on the spawning grounds in Roanoke River, inAlbemarle, Pamlico, <strong>and</strong> Croatan sounds, <strong>and</strong> <strong>of</strong>fshore from North Carolina to NewEngl<strong>and</strong>. These studies from 1937- 1985 showed a 0.7- 19.8% exchange rate (Table5.2). Though the percent contribution in general has remained low, it is apparent thatthe Albemarle Sound <strong>and</strong> North Carolina territorial seas serve as a wintering ground foreast coast stocks <strong>and</strong> to a lesser degree for the A/R stock.In 1985, DMF reinstated adult striped bass tagging in the Albemarle <strong>and</strong> Croatan soundareas <strong>and</strong> this has continued to the present. Due to the population being at a low level,very few fish were tagged from 1985-1989 (n=16). Striped bass have been tagged <strong>and</strong>released from hook <strong>and</strong> line, DMF trawl surveys, gill nets, pound nets, DMF gill netsurveys <strong>and</strong> electro-fishing efforts. A total <strong>of</strong> 14,260 striped bass was tagged <strong>and</strong>released in the ASMA from 1990 through the spring 2002 (Table 5.3). The percentage<strong>of</strong> fish tagged <strong>and</strong> released 18 inches (TL) <strong>and</strong> larger has ranged from 44.2 – 68.6%annually. Of the total number tagged, 23 striped bass captured <strong>and</strong> released throughthe DMF gill net surveys were 28 inches TL <strong>and</strong> larger (Table 5.4). A total <strong>of</strong> 1,087 tags(7.6%) have been returned, with 95.3% <strong>of</strong> the returns being from the ASMA. Nineteen <strong>of</strong>the returns were from the Atlantic Ocean <strong>of</strong>f North Carolina or from areas north <strong>of</strong> thestate (Table 5.3). The percentage <strong>of</strong> returns from outside the internal waters <strong>of</strong> the statehas ranged from 1.4 – 33.3%. Most <strong>of</strong> these returns occurred within one year <strong>of</strong> release,while two were at large for over four years. The majority <strong>of</strong> the tag returns (n=14) fromthe northern areas were from April through July, from fish tagged during the fall <strong>and</strong>winter months (October – February) in the eastern Albemarle <strong>and</strong> Croatan sound areas.These returns further support the speculation by Street et al. (1975) that the easternAlbemarle <strong>and</strong> Croatan sounds serve as a wintering ground for a portion <strong>of</strong> themigratory stock. Figure 5.1 shows the returns by length from the DMF Gill Net Survey,Fall-Winter segments from outside the internal waters. A total <strong>of</strong> 11 tags have beenreturned. These fish have ranged in length from 14-24 inches TL. The returns from theSpring segments <strong>of</strong> the Gill Net Survey are presented in Figure 5.2. Only 2 returns (26in TL <strong>and</strong> 31 in TL) have been from outside the internal waters <strong>of</strong> the state.The Division in cooperation with the WRC has tagged <strong>and</strong> released 22,552 striped bassfrom the Roanoke River on the spawning grounds since 1991 (Table 5.3). Sixty-fourpercent <strong>of</strong> these fish were 18 inches TL or larger when tagged <strong>and</strong> released. Thenumber <strong>of</strong> striped bass 28 inches TL <strong>and</strong> larger tagged <strong>and</strong> released has increasedsince the stock has been recovered (Table 5.5). A total <strong>of</strong> 2,460 (10.9%) tags havebeen returned, with 84.7 – 98.9% <strong>of</strong> the returns being from the ASMA or RRMA.Twenty-six <strong>of</strong> the returns (1%) have been from the ocean <strong>of</strong>f <strong>NC</strong> or from waters to thenorth <strong>of</strong> the state (Table 5.3). The percentage <strong>of</strong> returns from the ocean <strong>and</strong> areasnorth has ranged from 0.3 – 3.0%. Generally, these returns occurred from May –September (n=12) <strong>and</strong> the fish have been at large up to eight years prior to capture.47
Table 5.2. Summary <strong>of</strong> adult striped bass tagging efforts <strong>and</strong> returns.TaggingperiodNov 1937ReferenceVladykov <strong>and</strong> Wallace(1952)TagginglocationCurrituck SoundCroatan SoundKitty HawkNumbertaggedNumberrecapturedPercentreturn1792986483 137 28.4Recapture location136 <strong>NC</strong>1 NJ 0.7Percent exchange(based on totalreturns)Mar-Apr1937 Merriman (1941)Kitty Hawk (ocean)/Albemarle Sound 600 45 7.524- Albemarle Sound9- Ocean <strong>of</strong>f VA Beach8- Chesapeake Bay2- NJ1- NY1- RI 19.6Apr 1938 Merriman (1941) Western Albemarle Sound 506 47 9.3 47- Albemarle Sound areaOct 1955-May 1957Davis <strong>and</strong> Sykes(1960), Nichols <strong>and</strong>Cheek (1966) Albemarle Sound 5,242 1,651 31.51,565- Albemarle Sound79- Pamlico Sound5- Chesapeake Bay1- New Engl<strong>and</strong>1- Ocean <strong>of</strong>f <strong>NC</strong> 0.41956-1983 Hassler et al. (1981) Roanoke River 11,662 3,264 28.0Albemarle Sound <strong>and</strong>Roanoke RiverDec1956-1958Chapotan <strong>and</strong> Sykes(1961)Atlantic Ocean <strong>of</strong>f OregonInlet 81 19 23.55- Ocean2- Albemarle Sound8- Chesapeake Bay2- NJ1- RI1- MA 10.5Albemarle Sound 34 14 41.2Roanoke River 63 9 14.312- Albemarle Sound1- Roanoke River1- MA 7.11- Roanoke River8- Albemarle Sound48
Table 5.2 (Continued)Taggingperiod1968-1971ReferenceHoll<strong>and</strong> <strong>and</strong> Yelverton(1973)TagginglocationNumbertaggedNumberrecapturedPercentreturnOcean- Cape Lookout to<strong>NC</strong>/VA line 1,752 197 11.2Oct- Dec1973 Street et al. (1975) Croatan Sound 462 128 27.7Recapture location39- Albemarle/Pamlico S.25- Ocean <strong>of</strong>f <strong>NC</strong>78- Chesapeake Bay55- NJ-MECroatan SoundAlbemarle SoundPercent exchange(based on totalreturns)19.81964-1985Boreman <strong>and</strong> Lewis(1987)Chesapeake Bay toCanada 27,674 1,959 7.118 Albemarle <strong>and</strong> CroatanSound 0.91988-2002Benton (1992), Laney(2002)Cape Hatteras to mouth <strong>of</strong>Chesapeake Bay 30,6182002Hewitt <strong>and</strong> Hightower(2002)Roanoke River- nearScotl<strong>and</strong> Neck 729 20 2.71 Pungo River19 Albemarle Sound/Roanoke RiverTable 5.3. Number <strong>of</strong> adult striped bass tagged <strong>and</strong> released throughout the ASMA <strong>and</strong> RRMA <strong>and</strong> recapture areas.NumbertaggedNumberreturnedPercentreturnOregon InletNumber/ PercentOutside <strong>NC</strong>internal watersNumber/PercentInternal waters outsideASMANumber/ PercentYear Tagging locationHook <strong>and</strong> line1990 Batchelor Bay 15 01992 Albemarle Sound area 108 5 4.61993 Albemarle Sound area 50 4 8.01993 Pasquotank River 63 1 1.61994 Pasquotank River 375 20 5.31994 Albemarle Sound area 124 7 5.61995 Albemarle Sound area 74 6 8.1 2 (33.3) 1 (16.6)1996 Perquimans River 26 1 3.8 1 (100)1997 Albemarle Sound area 42 049
Table 5.3 (Continued)YearTagging locationNumbertaggedNumberreturnedPercentreturnOregon InletNumber/ PercentOutside <strong>NC</strong>internal watersNumber/PercentInternal waters outsideASMANumber/ Percent1998 Albemarle Sound area 107 1 0.91998 Perquimans River 30 2 6.71999 Albemarle <strong>and</strong> Croatan sounds 244 5 2.02000 Albemarle <strong>and</strong> Croatan sounds 194 18 9.3 1 (5.6)Total 1,452 70Trawls1994 Albemarle Sound area 24 0Pound Nets1990 Batchelor Bay 275 34 12.41990 Eastern Albemarle Sound 420 69 16.41991 Eastern Albemarle Sound 183 30 16.31992 Eastern Albemarle Sound 88 18 20.4 2 (11.1)1993 Eastern Albemarle Sound 209 39 18.71994 Eastern Albemarle Sound 77 5 6.51995 Eastern Albemarle Sound 352 66 18.7 2 (3.1) 4 (6.2)1998 Chowan River 13 2 15.4Total 1,617 263Gill NetSurvey Fall-Winter1990/91 Albemarle/Croatan sounds 245 55 22.41991/92 Albemarle/Croatan sounds 329 69 21.0 1 (1.4)1992/93 Albemarle/Croatan sounds 267 36 13.5 2 (5.6) 1 (2.8) 2 (5.6)1993/94 Albemarle/Croatan sounds 166 29 17.51994/95 Albemarle/Croatan sounds 776 72 9.3 2 (2.8) 1 (1.4) 1 (1.4)1995/96 Albemarle/Croatan sounds 464 41 8.8 1 (2.4) 4 (9.7) 2 (4.9)1996/97 Albemarle/Croatan sounds 782 49 6.3 1 (2.0) 3 (6.1) 1 (2.0)1997/98 Albemarle/Croatan sounds 695 55 7.9 3 (5.4) 1 (1.8)1998/99 Albemarle/Croatan sounds 1,054 83 7.8 2 (2.4) 1 (1.2)1999/00 Albemarle/Croatan sounds 586 59 10.0 5 (8.5) 1 (1.6)2000/01 Albemarle/Croatan sounds 382 23 6.0 2 (9.5)2001/02 Albemarle/Croatan sounds 537 23 4.32002/03 Albemarle/Croatan sounds 427Total 6,710 59450
Table 5.3 (Continued)NumbertaggedNumberreturnedPercentreturnOregon InletNumber/ PercentOutside <strong>NC</strong>internal watersNumber/PercentInternal waters outsideASMANumber/ PercentYear Tagging locationSpring1993 Western Albemarle Sound 106 11 10.41994 Western Albemarle Sound 64 4 6.21995 Western Albemarle Sound 553 23 4.21996 Western Albemarle Sound 406 20 4.9 2 (10.0) 1 (5.0)1997 Western Albemarle Sound 582 10 1.71998 Western Albemarle Sound 582 8 1.41999 Western Albemarle Sound 785 25 3.1 2 (8.0) 4 (16.0)2000 Western Albemarle Sound 627 14 2.2 3 (21.4) 1 (7.1) 2 (14.2)2001 Western Albemarle Sound 648 23 3.5 1 (4.3) 3 (13.0)2002 Western Albemarle Sound 531 22 4.1 1 (4.8)2003 Western Albemarle Sound 299Total 5,183 160Electro-fishing1992 Albemarle Sound area 53 3 5.71993 Albemarle/Roanoke 51 1 1.91996 Albemarle/Roanoke 33 1 3.01988 Roanoke River 37 9 24.31989 Roanoke River 27 1 3.71990 Roanoke River 335 33 9.8 1 (3.0)1991 Roanoke River 1,657 177 10.7 2 (1.1)1992 Roanoke River 2,453 355 14.5 1 (0.3) 2 (0.5) 4 (1.1)1993 Roanoke River 2,338 283 12.1 1 (0.3) 1 (0.3) 2 (0.7)1994 Roanoke River 9 3 33.31995 Roanoke River 1,265 132 10.4 2 (1.5) 2 (1.5) 3 (2.3)1996 Roanoke River 1,378 126 9.1 3 (2.4) 2 (1.6) 2 (1.6)1997 Roanoke River 2,167 271 12.5 9 (3.3) 5 (1.8) 11 (4.1)1998 Roanoke River 2,060 242 11.7 17 (7.0) 3 (1.2) 10 (4.1)1999 Roanoke River 2,177 213 9.8 9 (4.3) 1 (0.4) 6 (2.8)2000 Roanoke River 1,970 189 9.6 11 (5.9) 1 (0.5) 13 (7.0)2001 Roanoke River 2,647 278 10.5 10 (3.7) 4 (1.5) 14 (5.2)2002 Roanoke River 2,032 120 5.9 9 (9.3) 2 (2.1)` 2 (2.1)2003 Roanoke River 3,146 36 1.1Total 25,835 5,64251
Table 5.4. Total number <strong>of</strong> striped bass tagged <strong>and</strong> released, 28 inches (TL) <strong>and</strong> larger through DMF Gill Net Survey <strong>and</strong> returns by area.Percent <strong>of</strong> Total –Fish 28 Inches <strong>and</strong>LargerNumber <strong>and</strong> Percent <strong>of</strong>Returns Oregon InletAreaNumber <strong>and</strong> Percent <strong>of</strong>Returns Outside <strong>NC</strong>Internal WatersSegment/YearTotal NumberTaggedNumber Tagged 28Inches <strong>and</strong> LargerFall/Winter 1992-1993 267 4 1.5 1 (25%)Fall/Winter 1993-1994 166 2 1.2Fall/Winter 1994-1995 776 1 0.1Spring 1995 553 3 0.5Spring 1996 406 1 0.2 1 (100%)Fall/Winter 1997-1998 695 1 0.1Fall/Winter 1999-2000 586 2 0.3Spring 2000 627 1 0.1Fall/Winter 2000-2001 382 1 0.2Spring 2001 648 5 0.7Spring 2002 531 2 0.4Fall/Winter 2002-2003 427 2 0.4Spring 2003 299 6 2.052
43Number <strong>of</strong> Individuals2Oregon Inlet Area (N=16)Outside <strong>NC</strong> Internal Waters (N=11)<strong>NC</strong> Outside ASMA (N=10)1013-1415-1617-1819-2021-2223-2425-2627-2829-3031-32Figure 5.1.Size Group (Inches, TL)Length <strong>of</strong> tagged striped bass through DMFIndependent Gill Net Survey, Fall-Winter segments byreturn areas outside the ASMA.4Number <strong>of</strong> Individuals32Oregon Inlet Area (N=8)Outside <strong>NC</strong> Internal Waters (N=2)<strong>NC</strong> Outside ASMA (N=10)1013-1415-1617-1819-2021-2223-2425-2627-2829-3031-32Figure 5.2.Size Group (Inches, TL)Length <strong>of</strong> tagged striped bass through DMFIndependent Gill Net Survey, Spring segments, byreturn areas outside the ASMA.53
Table 5.5.Total number <strong>of</strong> striped bass tagged <strong>and</strong> released, 28 inches <strong>and</strong> larger from the Roanoke River <strong>and</strong> returns by area. (Male, F-Female)YearTotalNumberTaggedNumberTagged 28Inches <strong>and</strong>LargerPercent <strong>of</strong> Total– Fish 28 Inches<strong>and</strong> LargerNumber <strong>of</strong>FemalesNumber <strong>of</strong>Males1996 1,378 4 0.2 4 -Number <strong>and</strong>Percent <strong>of</strong>Returns InsideRRMANumber <strong>and</strong>Percent <strong>of</strong>Returns OregonInlet Area1 (F)(25%)Number <strong>and</strong> Percent<strong>of</strong> Returns Outside <strong>NC</strong>Internal Waters1997 2,167 7 0.3 6 11 (M)(100%)1998 2,060 10 0.4 10 -2 (F)(20%)1999 2,177 22 1.0 17 51 (F)(5.9%)2000 1,970 14 0.7 11 31 (F)(9 %)2 (F)(18.1%)1 (M)(33.3%)2001 2,647 45 1.7 32 131 (F)(3.1%)2 (F)(6.3%)1 (M)(7.7%)2002 2,032 72 3.5 48 242 (F)(4.2%)4 (M)(16.7%)2 (M)(8.3%)2003 3,146 134 4.2 107 2754
Hewitt <strong>and</strong> Hightower (2002) tagged <strong>and</strong> released 729 striped bass from a fishwheel,located near Scotl<strong>and</strong> Neck, <strong>NC</strong> during the spring 2002. Twenty tags have beenreturned with no returns from outside the internal waters <strong>of</strong> the state (Table 5.3). Thesereturns continue to show very little contribution <strong>of</strong> the A/R stock to the migratorypopulation. The returns from fish tagged on the Roanoke River, near Weldon <strong>and</strong>recaptured outside the internal waters are presented in Figure 5.3, by sex. A total <strong>of</strong> 17males <strong>and</strong> 9 females returns have occurred. Males have ranged from 14-29 inches TL,with the 17-18 inch size group accounting for 23.5%. Females have ranged from 15-33inches TL, with 22-23 inch size group contributing 33.3% <strong>of</strong> the returns.Historical adult tag recovery databases (Street et al. 1975; Johnson et al. 1981; Hassler<strong>and</strong> Taylor 1986) suggested that the A/R striped bass stock was composed principally<strong>of</strong> a discrete resident population; however these conclusions were based upon tagreturns from 3 through 5 year old fish that were not likely to migrate out <strong>of</strong> the system.Since the mid-1990s however, the age structure <strong>of</strong> the stock has broadenedsignificantly <strong>and</strong> 35 (77.8%) <strong>of</strong> the 45 returns from outside the internal coastal waters <strong>of</strong>North Carolina have occurred during the period 1996 – 2002. Carmichael (1995)1412Number <strong>of</strong> Individuals1086Male N=17)Female (N=9)42013-1415-1617-1819-2021-2223-2425-2627-2829-3031-3233-3435-36Size Group (Inches, TL)Figure 5.3. Length <strong>of</strong> tagged striped bass from the Roanoke River spawning grounds byreturn from outside North Carolina internal waters.56
conducted telemetry studies on striped bass in the management area <strong>and</strong> the resultssupported the contention <strong>of</strong> Setzler et al. (1980) that there may be some mixing <strong>of</strong> themigratory <strong>and</strong> A/R populations within the Croatan Sound during the winter. Haeseker etal. (1996) through telemetry studies in the Albemarle Sound area during the summerfound there was no evidence <strong>of</strong> migration to the Atlantic Ocean. Even though thenumber <strong>of</strong> returns from outside <strong>NC</strong> has increased over the last several years the datacontinues to indicate that the A/R stock contributes minimally to the Atlantic migratorystock.Tag-recapture or tag recovery studies can be used to estimate rates <strong>of</strong> migration amongdifferent geographic regions, provided fish are released from several different regionssimultaneously with tags that identify the region <strong>of</strong> release (Schaefer 1951; Darroch1961; Dorazio et al. 1994). The number <strong>of</strong> tagged fish that are recaptured in eachgeographic region will depend on the frequency <strong>of</strong> migration to the region from all others<strong>and</strong> on the intensity <strong>of</strong> sampling or fishing effort in the area (Dorazio et al. 1994). Lowreturns from other areas could indicate less fishing in those areas or a low rate <strong>of</strong>migration. A high rate from internal waters may mean that few fish migrate, or that fishremaining within the sound are at a much higher risk <strong>of</strong> harvest than fish migrating tothe ocean. A difference in tag return rates can also affect perceived migration rates. Thesize <strong>of</strong> tagged fish must be considered when examining return rates from differentareas. Dorazio et al. (1994) reports relating total length to probability <strong>of</strong> migration tonorthern ocean waters, indicated that the probability <strong>of</strong> migration does not achieve 0.5until fish are nearly 80 cm (31 inches TL). Considering the current size distribution forthe A/R stock much observation <strong>of</strong> migration to the coastal stock would not beexpected.The recreational fishery around Oregon Inlet has grown significantly since the mid-1990s. One hundred tags have been returned from the Oregon Inlet area since 1996(Table 5.3). Thirty-eight <strong>of</strong> these returns have occurred during October throughDecember. The time period mid-April through August has accounted for 51 returns fromthis area. The majority <strong>of</strong> these returns (n=28) are from fish tagged on the spawninggrounds that spring <strong>of</strong> capture, with a growing number exceeding 28 inches total lengthwhen released. The line <strong>of</strong> demarcation between the Atlantic Ocean <strong>and</strong> the ASMA isthe centerline <strong>of</strong> the Bonner Bridge <strong>and</strong> east <strong>of</strong> the line is open year round. Someanglers during the summer months target striped bass in this area <strong>and</strong> due to the 28 inTL minimum size limit only large fish are retained.Figure 5.1 shows the length frequency for the tag returns from the Fall-Winter DMF GillNet Survey segments <strong>and</strong> Figure 5.2 for the Spring segments. Sixteen returns werefrom the Fall-Winter surveys, with 93.7% <strong>of</strong> the returns less than 28 inches TL (Figure5.1). All returns (N=8) from fish tagged during the Spring segment were less than 28 inTL.The Oregon Inlet area returns for striped bass tagged in the Roanoke River are shownin Figure 5.4, by sex. A total <strong>of</strong> 48 males have been recaptured ranging from 13-31 inTL. Ninety four percent <strong>of</strong> the males were less than 28 in TL <strong>and</strong> 6% were 28 in TL or57
1412Number <strong>of</strong> Individuals1086Male (N=48)Female (N=22)42013-1415-1617-1819-2021-2223-2425-2627-2829-3031-3233-3435-3637-3839-40Size Group (Inches, TL)Figure 5.4.Length <strong>of</strong> tagged striped bass from the Roanoke Riverspawning grounds by return from the Oregon Inlet area.ranging from 19-40 in TL. Of these returns, 63.6% <strong>of</strong> the females were less than 28 inTL <strong>and</strong> 36.4% were 28 in TL <strong>and</strong> larger.There has been an increase over time <strong>of</strong> fish tagged in the ASMA <strong>and</strong> RRMA <strong>and</strong> thenumber <strong>of</strong> returns from waters that flow into the Chowan River <strong>and</strong> southern systems in<strong>NC</strong>Three returns have occurred from the Blackwater <strong>and</strong> Nottoway rivers, VA from fishtagged during the Fall-Winter segments <strong>of</strong> the DMF Gill Net Survey in Albemarle Sound.Nine tag returns from the Nottoway <strong>and</strong> Meherrin rivers, VA have occurred from fish thatwere tagged on the spawning grounds in Roanoke River one to four years previously.All <strong>of</strong> these returns have occurred in the spring. The striped bass spawning areas havenot been determined in these systems by Virginia but based on early sampling by Streetet al. (1975) spawning does occur in these systems.The number <strong>of</strong> returns (n=73) from the areas to the south (Pamlico Sound, PamlicoRiver, Pungo River, Tar River, Neuse River) <strong>of</strong> the ASMA have significantly increasedduring the period 1996-2002.58
Though fish tagged in the ASMA <strong>and</strong> returned from these southern areas has increasedsomewhat, contributing 2.1% <strong>of</strong> the returns, the significance is the number <strong>of</strong> returns(n=54) from these areas <strong>of</strong> fish tagged on the spawning grounds in Roanoke River(Table 5.3). Hewitt <strong>and</strong> Hightower (2002) have had one return from the Pungo River;the fish was tagged <strong>and</strong> released on the spawning grounds in Roanoke River. Themajority <strong>of</strong> these returns (n=36) have occurred within the last four years <strong>and</strong> duringJune through December. Record increases in juvenile production since the early 1990scoupled with a significantly exp<strong>and</strong>ing age structure have resulted in an expansion inrange <strong>of</strong> the A/R origin striped bass.Twenty tag returns have occurred from <strong>NC</strong> outside the ASMA from striped bass taggedthrough the DMF Gill Net Survey, Fall-Winter segments (N=10) <strong>and</strong> Spring segments(N=10), (Figures 5.1 <strong>and</strong> Figure 5.2). Striped bass from the Fall-Winter segmentsranged from 12-22 in TL <strong>and</strong> 19-23 in TL from the Spring segments.A total <strong>of</strong> 49 males have been returned from internal waters outside the ASMA from fishtagged <strong>and</strong> released in the Roanoke River, near Weldon (Figure 5.5). Males ranged inlength from 15-23 in TL <strong>and</strong> the 19-20 in size group accounted for 24.5%. Fifteenfemales were returned from outside the ASMA. The 23-24 in TL <strong>and</strong> 24-25 in TL sizegroups accounted for 53.5% <strong>of</strong> the female returns (Figure 5.5).5.4.2 Phase II Striped Bass- Albemarle AreaThe DMF in cooperation with the USFWS began a Phase II (5-8 inches TL) striped bassstocking program in the Albemarle Sound area in 1981. Annual stockings occurredthrough 1996 with a portion or all <strong>of</strong> the fish tagged prior to release. A total <strong>of</strong> 53,555tagged Phase II fish was released <strong>and</strong> 4,711 tags (8.8%) returned. Over the sixteenyear period a total <strong>of</strong> 17 returns was from the ocean <strong>of</strong>f <strong>NC</strong> or waters to the north (Table5.6). These percentages ranged from 0.3 – 3.2%. Fourteen <strong>of</strong> the 17 returns occurredwithin one year from release. These returns indicate very little contribution. However,these fish were considerably smaller (14 – 16 inches TL) than expected to be migratory.Tags from Phase II fish were also returned from internal waters south <strong>of</strong> the ASMA. Atotal <strong>of</strong> 31 returns have occurred (Table 5.6). The percentage <strong>of</strong> returns from theseareas has ranged from 0.6 – 50%. The Pungo River area has accounted for 90.3% <strong>of</strong>these returns. No tags from these stockings have been returned since 1997 from theseareas.5.4.3 Central/ Southern Area5.4.3.1 Division <strong>of</strong> Marine Fisheries- AdultsTagging studies conducted by Marshall (1977) <strong>and</strong> Hawkins (1980) indicate that NeuseRiver <strong>and</strong> Tar-Pamlico striped bass are riverine <strong>and</strong> endemic. These data alsosuggested that fish spend the winter in the Pamlico River between Washington <strong>and</strong> themouth <strong>of</strong> the Pungo River <strong>and</strong> move up the Tar River during the spring spawning run(Pate 1975; Marshall 1976; Winslow et al. 1983). It should be noted that these fish59
were <strong>of</strong> a young age when tagged <strong>and</strong> recaptured. Historically, both the New <strong>and</strong> WhiteOak rivers were shown to support runs <strong>of</strong> striped bass (Baker 1968). Sholar (1975)1412Number <strong>of</strong> Individuals1086Male (N=49)Female (N=15)42015-16 17-18 19-20 21-22 23-24 25-26Size Group (Inches, TL)Figure 5.5.Length <strong>of</strong> tagged striped bass from the Roanoke Riverspawning grounds by return from North Carolina internalwaters outside the ASMA/RRMA.reported no striped bass found in the New River <strong>and</strong> only three in the White Oak River.Fischer (1980) <strong>and</strong> Winslow et al. (1983) reported that striped bass were abundant inthe Cape Fear River below Wilmington, January through May. Tagging studies asreported by Winslow et al. (1983) suggest that this stock is riverine endemic withexchange between the Cape Fear <strong>and</strong> the Northeast Cape Fear rivers.Since 1980, very little tagging effort has occurred on adult striped bass in the CSMA.The DMF since 1999, through various gill net surveys <strong>and</strong> minimal hook <strong>and</strong> line efforthas tagged <strong>and</strong> released striped bass in the Pamlico (n=66) <strong>and</strong> Neuse (n=25) systems(Table 5.7). The percentage <strong>of</strong> returns from the Pamlico tagging has ranged from 7.1 –10.5%, but only five tags have been returned. One <strong>of</strong> the returns (Apr 2002) was fromthe spawning grounds on the Roanoke River at Scotl<strong>and</strong> Neck. The percentage <strong>of</strong> tagreturns from fish tagged in the Neuse River has ranged from 25 – 33.3% (Table 5.7). All<strong>of</strong> these returns (n=8) were from the Neuse <strong>and</strong> Trent rivers.60
Table 5.6. Phase II striped bass tag returns from outside the release areas in North Carolina <strong>and</strong> outside North Carolina internal waters.SystemReleasedateNumbertaggedNumberrecapturedTotalpercentreturnRecapture locationsinside <strong>NC</strong>Percent returnsother <strong>NC</strong>systemsRecapture locationsoutside <strong>NC</strong>Percent returnsoutside <strong>NC</strong>22- Pungo R.1- Long Shoal R.1- Topsail Sound 1.3 9- Chesapeake Bay 0.52- Atlantic Ocean <strong>of</strong>f CapeJan 25, 1983 2,500 719 28.8 4- Pungo R. 0.6Lookout 0.31- York River, VA1- Indian River, DE 0.7AlbemarleSound area Jan 26, 1981 10,000 1,817 18.2Dec 16, 1983 2,493 277 11.1Dec 10, 1984 6,445 575 8.9Jan 10, 1986 1,110 38 3.4Dec 9, 1986 4,999 453 9.1Dec 9, 1987 2,500 214 8.6Dec 9, 1988 5,000 94 1.9Dec 7, 1989 1,400 22 1.6Dec 19, 1990 2,000 62 3.1Dec 11, 1991 2,994 320 10.7Dec 15, 1992 2,465 84 3.4Dec 9, 1993 2,180 20 0.9Dec 8, 1994 2,481 2 0.08Jan 10, 1996 2,498 12 0.4 2- Pungo Creek 16.7Dec 12, 1996 2,490 2 0.08 1- Neuse River 50.0Total 53,555 4,7111- Mystic River, MA1- Newport River, RI 3.21- Deep Creek, VA1- Damariscotta River, ME 0.6Tar-PamlicoRiverJan 28, 1983 2,500 500 20.0 7- Alligator River7.212- Albemarle S.1- Chowan River13- Neuse River2- Off Cedar Is.1- Trent RiverDec 20, 1984 1,000 28 2.8Dec 11, 1987 2,500 39 1.6Dec 12, 1991 1,993 78 3.9Dec 8, 1993 2,204 39 1.8 1- Currituck Sound5.11- Neuse RiverDec 9, 1994 2,320 27 1.2 1- Roanoke River11.12- Croatan SoundJan 10, 1996 2,497 51 2.0 1- Neuse River 1.9 1- Cape Cod Canal, MA1- Providencetown, MADec 11, 1997 4,865 104 2.13.961
Table 5.6 (Continued)SystemReleasedateNumbertaggedNumberrecapturedTotalpercentreturnRecapture locationsinside <strong>NC</strong>Percent returnsother <strong>NC</strong>systemsRecapture locationsoutside <strong>NC</strong>Percent returnsoutside <strong>NC</strong>Dec 8, 1999 2,750 117 4.2 3- Neuse River1- Trent River1- Roanoke RiverDec 14, 2001 3,000 6 0.2Total 25,629 9894.6NeuseRiverFeb 3, 1982 2,100 230 11.0 1- Pungo River1- Trent River1- Albemarle S.Jan 13, 1986 2,119 60 2.8Dec 8, 1988 2,500 22 0.9Dec 11, 1990 2,992 84 2.81.3 1- Conowingo Dam, MD1- Hudson River, NY0.9NeuseRiverCape FearRiverDec 14, 1992 2,527 137 5.4Dec 9, 1994 2,212 7 0.3 1- Albemarle S. 14.3Dec 13, 1996 4,998 116 2.3 1- Pamlico River 0.9Dec 11, 1998 2,500 70 2.8 1- Tar River13.02- Croatan Sound6- Roanoke RiverDec 6, 2000 2,900 26 0.8Dec 6, 2002 2,960 0Total 24,848 752Jan 24, 1980 2,900 17 0.6Jan 17, 1984 1,395 6 0.4Dec 8, 1989 1,300 23 1.8Total 5,595 4662
Table 5.7. Number <strong>of</strong> adult striped bass tagged <strong>and</strong> released in the Pamlico Sound, Pamlico <strong>and</strong> Neuse river areas.Year Tagging location1999 Pamlico, Pungo, LongShoal river areas- Gill netsurveyReturnsNumberNumbertagged 2000 2001 2002 returned2 0Percentreturned2000 Pamlico, Pungo, LongShoal river areas- Gill netsurvey2001 Pamlico, Pungo, LongShoal river areas- Gill netsurvey2002 Pamlico, Pungo, LongShoal river areas- Gill netsurvey2001 Pamlico <strong>and</strong> Pungo rivers-Hook <strong>and</strong> line19 1 1 2 10.528 1 1* 2 7.113 1 1 7.74 01999 Neuse River area 12 1 2 3 25.02000 Neuse River area 13 1 1 1 33.3Total 91 3 4 1 8 8.8* Recaptured in Roanoke River at Scotl<strong>and</strong> Neck (Apr 25, 2002)5.4.3.2 Wildlife Resources Commission- Adult Striped BassDuring the spring 2002, the WRC began tagging <strong>and</strong> releasing adult striped bass on thespawning grounds in Tar <strong>and</strong> Neuse rivers. A total <strong>of</strong> 298 striped bass was tagged <strong>and</strong>released in the Tar River. Ten tags have been returned, all from the Tar-Pamlico system(Table 5.8). Seventy-nine striped bass were tagged in the Neuse River <strong>and</strong> released<strong>and</strong> six tags have been returned from the New Bern area (Table 5.8).Table 5.8. Number <strong>of</strong> adult striped tagged by the <strong>NC</strong>WRC on the spawning grounds,Tar River <strong>and</strong> Neuse River, spring 2002 <strong>and</strong> 2003. All returns from withinsystem <strong>of</strong> release.System Number tagged Number returned Percent returnsTar River- 2002 298 10 3.3Neuse River- 2002 79 6 7.6Tar River- 2003 211Neuse River- 2003 35263
5.4.4 CSMA Phase II Striped Bass5.4.4.1 Pamlico RiverThe Pamlico River has been stocked with Phase II striped bass on a biannual rotatingbasis since 1983. A total <strong>of</strong> 25,629 tagged fish has been released <strong>and</strong> 989 tags (3.9%)returned (Table 5.6). The return rates have ranged from 0.1 – 20%. Only two tags havebeen returned from outside <strong>NC</strong> waters; both were released in January 1996. One returnwas from Cape Cod Canal, MA in June 1998 <strong>and</strong> the other from Providencetown, MA inJune 2001.The percentage <strong>of</strong> returns from the ASMA/RRMA <strong>and</strong> the Neuse River drainage hasranged from 1.9 – 11.1% (Table 5.6), showing exchange between the internal waters <strong>of</strong>the state. The largest number <strong>of</strong> returns from these areas was from fish stocked in 1983<strong>and</strong> recaptured within one year <strong>of</strong> release (Table 5.6). The returns from areas outsidethe Pamlico system, from fish stocked since 1993, have been at large two to sevenyears. A tagged fish released in Pamlico River in 1996 was recaptured in Neuse Riverat Raleigh, in May 1998 an area where spawning occurred historically. In May 2001, atagged fish released in December 1999 was recaptured in the Roanoke River on thespawning grounds at Weldon.5.4.4.2 Neuse RiverThe Neuse River has also been stocked on a rotating basis since 1982. Tagged fishreleased in the system have totaled 24,848. Three percent (n=752) <strong>of</strong> these tags havebeen returned (Table 5.6). A tagged fish was recaptured at Conowingo Dam, MD <strong>and</strong>one in Hudson River, NY in July 1983. Both <strong>of</strong> these fish were released on February 3,1982. These are the only returns from outside the state for the Neuse River stockings.The number <strong>of</strong> returns (n=14) from other internal waters <strong>of</strong> <strong>NC</strong> have been north <strong>of</strong> theNeuse River <strong>and</strong> ranged from 0.9 – 14.3%. Six <strong>of</strong> the fourteen returns occurred from theRoanoke River during the spring 2002 <strong>and</strong> the ASMA accounted for two <strong>of</strong> the returns.All <strong>of</strong> these fish were four years old. Similar to the Pamlico River stockings, from 1986through 1996 essentially all <strong>of</strong> the returns were from the system where the stockingsoccurred.The tag returns from the Phase II stocking program in the Pamlico <strong>and</strong> Neuse riversindicate there is insignificant exchange with the Atlantic Migratory Stock. The returndata show there is exchange between the ASMA/RRMA <strong>and</strong> the CSMA <strong>and</strong> in recentyears the rate <strong>of</strong> exchange has increased.5.4.4.3 Cape Fear RiverPhase II stockings only occurred in three years (1980, 1984, <strong>and</strong> 1989) in the CapeFear River. A total <strong>of</strong> 5,595 tagged striped bass was released <strong>and</strong> 46 tags (0.8%)returned. Return rates ranged from 0.4 – 1.8%, with all returns from the system within ayear <strong>of</strong> release. Stocking <strong>of</strong> this system was discontinued in 1989, due to the lack <strong>of</strong> apositive impact on the striped bass population <strong>and</strong> the high abundance <strong>of</strong> hybrids in thesystem.64
6.0 STATUS OF THE STOCK6.1 Albemarle-Roanoke Stock (ASMA)6.1.1 Historical ConditionDr. W. W. Hassler <strong>of</strong> <strong>NC</strong>SU conducted extensive research on striped bass fisheries <strong>and</strong>the striped bass stock <strong>of</strong> the Albemarle-Roanoke system from 1956 to 1983 (Hassler etal. 1981, Hassler 1984; Hassler <strong>and</strong> Taylor, 1984 ). Over most <strong>of</strong> those years Hasslerestimated spawning population abundance through mark-recapture <strong>and</strong> regression <strong>of</strong>catch <strong>and</strong> effort, conducted juvenile abundance surveys, estimated exploitation, <strong>and</strong>estimated egg production. L<strong>and</strong>ings <strong>and</strong> effort for the primary commercial <strong>and</strong>recreational fisheries for striped bass in the Roanoke River <strong>and</strong> Albemarle Sound arealso tabulated, however, that information is addressed in the description <strong>of</strong> the fisheries.Except where noted, information used to develop the following assessment <strong>of</strong> historicstock condition is all excerpted from Hassler’s final report (Hassler et al. 1981), <strong>and</strong> twoadditional reports covering the later years (Hassler 1984, Hassler <strong>and</strong> Taylor, 1984).Hassler estimated the size <strong>of</strong> the spawning stock by estimating the size <strong>of</strong> thepopulation in the Roanoke River during the spring spawning run. Two methods wereused: 1) a Petersen mark-recapture method, based on annual estimates <strong>of</strong> exploitationfrom tag recoveries <strong>and</strong> total Roanoke River catch, for 1956-1981; <strong>and</strong> 2) Ricker’s(Ricker 1940) regression <strong>of</strong> catch per unit effort for the commercial fishery, from 1956 -1977. Hassler <strong>and</strong> Taylor (1984) noted a considerable decline in tag returns in 1981following the imposition <strong>of</strong> considerable regulatory constraints. To avoid introducing abias from the regulatory changes, they slightly modified the Petersen method <strong>and</strong>estimated spawning population abundance from annual Roanoke River harvest <strong>and</strong>average Roanoke River exploitation (tag derived), <strong>and</strong> provided updated estimates forthe entire time series (1956-1983). All three estimates give similar pictures <strong>of</strong> spawnerabundance over time (Figure 6.1). From 1956 – 1979 spawner abundance wasvariable, averaging around 300,000 fish <strong>and</strong> never falling below 100,000 fish.Estimated spawner abundance dropped nearly 70% between 1979 <strong>and</strong> 1980, <strong>and</strong> thendeclined even further in 1981 to only 12% <strong>of</strong> the 25 year average. Spawner abundanceremained low in 1982 <strong>and</strong> 1983, although values for those years may be biased slightlylow if regulatory changes imposed in 1981 reduced both harvest <strong>and</strong> exploitation.Hassler developed an index <strong>of</strong> juvenile abundance based on trawl sampling inAlbemarle Sound. These data provide a long time series based on consistentmethodology from which trends can be evaluated. Juvenile abundance variedconsiderably during the 1960’s <strong>and</strong> 1970’s, averaging 6.5 <strong>and</strong> ranging from 0.2 in 1958to nearly 24 in 1959. Between 1955 <strong>and</strong> 1977 only one observation fell below 2, whileJAI values in 5 <strong>of</strong> the 6 years from 1978 – 1983 fell below 2 (Figure 6.2). Totalmortality was estimated from tag recoveries over successive years, from 1956 to 1974.This estimate65
700,000Hassler Spawner Abundance EstimatesTAG CPUE 25Y mean FSpawning Stock Abundance600,000500,000400,000300,000200,000100,00001955 1960 1965 1970 1975 1980 1985YEARFigure 6.1.Roanoke River striped bass spawning stock abundance in numbers<strong>of</strong> fish, estimated from CPUE <strong>and</strong> mark-recapture methods.30Juvenile Abundance Index25JAI mean201510501955 1960 1965 1970 1975 1980YearFigure 6.2. Juvenile abundance index values, 1955 – 1983.66
would include both fishing <strong>and</strong> natural mortality, although the current estimate <strong>of</strong> naturalmortality, M=0.15, is but a small fraction <strong>of</strong> the estimated total mortality over the period.Total mortality averaged around 1 from 1956 – 1964, then increased to over 2.5 by1968 before declining to around 1.5 in the mid 1970’s (Figure 6.3). These values arenot adjusted for tag loss or tag induced mortality, <strong>and</strong> may therefore be biased high.3Tag Estimate <strong>of</strong> Mortality2.5Total Mortality (Z)21.510.501955 1960 1965 1970 1975YearFigure 6.3. Total mortality estimated from multi-year tag return data,1956-1974.Relative exploitation was estimated annually from 1956-1983, based on the percentageannual releases returned in the same year. This method provides a relative measure <strong>of</strong>exploitation subsequent to the release events, but no information on exploitation prior tothe release. Several other conditions can affect the validity <strong>of</strong> both the absolute valueseach year <strong>and</strong> the time series trend. First, the reporting rate (proportion <strong>of</strong> tagsrecovered that are actually reported) must be constant. Hassler notes that the apparentreporting rate dropped considerably following regulatory changes in 1981, <strong>and</strong> changedthe estimation procedure for spawner abundance accordingly. Tag programs are alsovulnerable to a decline in reporting rate over time, as anglers become saturated with therewards <strong>and</strong> the novelty <strong>of</strong> capturing a tagged fish wanes. Second, tags must beretained for the annual values to be valid, <strong>and</strong> the retention rate must not change overtime for the time series to be valid. Fish were tagged with three separate tags over thestudy: 1956-1964, streamer tag; 1965-1969, spaghetti tag; 1970-1980 Floy T-baranchor tag. Hassler attributed the decline in the proportion <strong>of</strong> tags recovered after 1970to tag retention problems stemming from inadequately anchoring the T-bar tags. Finally,tagged <strong>and</strong> untagged fish must be equally vulnerable to harvest. Most fish were taggedin the lower Roanoke River, <strong>and</strong> many were recaptured soon after <strong>and</strong> downstream <strong>of</strong>release. Striped bass have a tendency to ‘fall back’, or return downstream toward67
estuarine areas when h<strong>and</strong>led during migration (Carmichael et al. 1998), <strong>and</strong> thus thevulnerability <strong>of</strong> tagged fish to capture by the significant upriver fisheries was likelyreduced. Overall, annual estimates <strong>of</strong> mortality may be a reasonable, relative measure<strong>of</strong> exploitation from 1956-1969, but they are not a reliable indicator <strong>of</strong> the magnitude <strong>of</strong>exploitation <strong>and</strong> values for 1970-1983 are likely significantly biased.Annual exploitation estimated multi-year recovery data is considerably less than thatestimated for a single-year recovery (Figure 6.4). This can be attributed to exploitation10090Annual percent <strong>of</strong> stock exploitedMulti YearSingle year100%90%Single-Year Percent807060504030201080%70%60%50%40%30%20%10%Multi-Year Percent00%1955 1960 1965 1970 1975 1980 1985YearFigure 6.4. Relative annual exploitation estimated from single-year tagreturn data, 1956-1983.before the tagging event, non-reporting <strong>of</strong> tags, unequal vulnerability <strong>of</strong> tagged fish <strong>and</strong>untagged fish to significant fishery components, <strong>and</strong> tag loss. Single-year recoveryexploitation is relatively constant during the 1960’s, whereas the multi-year recoveryestimate increases, which may indicate a general decline in reporting rate over time.Moreover, the single year recovery estimates decline after 1970 when the programadopted the T-bar anchor tags (with known retention problems), while the multi-yearrecovery estimates remain high. All evidence suggests that the decline in relativeexploitation after 1970 is related to survey changes <strong>and</strong> not reduced exploitation.Hassler estimated both egg production <strong>and</strong> egg viability. Production provides ameasure <strong>of</strong> the magnitude <strong>of</strong> annual spawning, <strong>and</strong> viability provides a measure <strong>of</strong> eggsurvival. The two measures together provide an indication <strong>of</strong> overall spawning success,with the product <strong>of</strong> eggs spawned <strong>and</strong> percent viability a measure <strong>of</strong> total viable eggproduction. Egg production increased during the 1960’s, to a high <strong>of</strong> nearly 5 billion in1972. Production dropped to around 2 million until 1979, then dropped sharply in 1980<strong>and</strong> 1981 (Figure 6.5). Viability averaged nearly 90% until 1975 when it dropped to68
elow 60%. There was some recovery in 1980 <strong>and</strong> 1981, but viability did not reach thepre-1975 average <strong>and</strong> dropped again in 1983. Although egg production did not varyappreciably from the long-term average until 1980, the decline in viability led to anoverall decline in viable egg production after the 1972 peak, with viable egg productionfalling below 1 million by 1976 <strong>and</strong> remaining low for the next 8 years (Figure 6.6).A number <strong>of</strong> factors contribute to the decline in Albemarle-Roanoke striped bass in thelate 1970’s <strong>and</strong> early 1980’s. Exploitation rates were beyond any level now believed tobe sustainable throughout the series, <strong>and</strong> were at their highest levels in the late 1960’s<strong>and</strong> early 1970’s when declining egg production <strong>and</strong> poor juvenile survival began todrive down recruitment success. Any stock experiencing even moderate exploitation<strong>and</strong> reduced recruitment will begin to decline in abundance <strong>and</strong> biomass, <strong>and</strong> a stockthat has sustained high exploitation for several generations has less reserve capacity<strong>and</strong> will typically show signs <strong>of</strong> decline within a few years. Spawning success generallydeclines as the average age in the population declines, <strong>and</strong> spawning magnitudedeclines as overall mature biomass declines.6000Egg Production <strong>and</strong> Viability# Eggs Viability1.2Million Eggs Spawned50004000300020001000019601962196419661968197019721974197619781980198210.80.60.40.2% Viable Eggs0YearFigure 6.5. Total egg production <strong>and</strong> percentage viable eggs, 1960-1983.Successful recruitment requires more than just spawning success <strong>and</strong> egg production;eggs must also hatch <strong>and</strong> juveniles must survive. Comparing juvenile abundance <strong>and</strong>total viable egg production, it is apparent that decreased juvenile survival may havebeen one <strong>of</strong> the earliest challenges to the stock (Figure 6.7). Egg production was69
Spaw ning Success5000Million Viable Eggs Spaw ned450040003500300025002000150010005000196019621964196619681970197219741976197819801982YearFigure 6.6. Total spawning success, 1961 – 1983.JAI <strong>and</strong> Viable Egg Production30JAIViable Egg5000JAI25201510545004000350030002500200015001000500Million Viable Eggs001955 1960 1965 1970 1975 1980YearFigure 6.7 Juvenile abundance <strong>and</strong> total viable egg production, 1955 – 1983.70
highest in 1969 <strong>and</strong> 1972, yet JAI values in those years are among the lower values <strong>of</strong>the series. From the JAI, the only good year class produced from 1969 to 1973 was in1970, even though viable egg production over these years was better than average.This suggests that poor larval survival may have been the cause <strong>of</strong> the initialrecruitment failures.High fishing mortality likely harvested any surplus stock generated by the strong 1970year class within a few years, <strong>and</strong> with no other strong cohorts coming into thepopulation, spawning stock abundance declined sharply after 1979. Reduced eggviability combined with declining egg production resulted in a steady decline in viableegg production after the 1972 peak. There is little information available from which tojudge the reliability <strong>of</strong> the estimated decline in egg viability; the trend may be real or itmay be an artifact <strong>of</strong> sampling. The FWS Striped Bass Study Report to Congress (May1992) suggests that the population age structure was truncated by the 1950s. Giventhat mortality estimates are high during the 1960s <strong>and</strong> 1970s, the age structure mayhave become severely truncated by the 1970s, with the spawning stock possiblycomposed <strong>of</strong> primarily first time spawners. First-time spawners are commonlyconsidered to produce fewer eggs <strong>and</strong> to have a lower proportion <strong>of</strong> viable eggs thanexperienced spawners. Some combination <strong>of</strong> truncated age structure, the possibility fora majority <strong>of</strong> the spawners being inexperienced, <strong>and</strong> environmental degradation orvariation is likely to blame for the decline in viable egg production reported by Hassler etal. (1980) in the mid-1970s. The moderate 1975 <strong>and</strong> 1976 year classes indicated bythe JAI apparently sustained the fishery <strong>and</strong> the spawning stock biomass through 1979,but were largely ‘fished out’ by 1980, therefore spawner abundance dropped markedly.Support for this scenario is provided by DMF sampling <strong>of</strong> the age composition <strong>of</strong> theAlbemarle Sound commercial fishery, which shows that in 1980 <strong>and</strong> 1981 nearly 80% <strong>of</strong>the harvest was composed <strong>of</strong> age 1 <strong>and</strong> 2 fish from the 1978-1980 cohorts.Although additional management measures were imposed in 1981, the damage to thestock had already occurred. The few recruits produced by the stock in the early 1980’slargely supported the fisheries <strong>and</strong> provided no improvement in spawner abundance.Commercial fishery harvest shifted from 3 – 5 year old fish in the 1970’s to 1 <strong>and</strong> 2 yearold fish in 1980 <strong>and</strong> 1981, then 2 <strong>and</strong> 3 year old fish under the increased minimum sizeafter 1981. It is likely that recreational fisheries exhibited a similar shift, although nodata are available on the recreational fishery age composition until the 1990’s. Thestock remained at low abundance <strong>and</strong> fishery yields remained low for over 10 yearsuntil the 1990’s.6.1.2 Comparison <strong>of</strong> current <strong>and</strong> historic stock conditionSince fish ascending the river to spawn are presumably mature, <strong>and</strong> there is noresearch indicating that mature striped bass do not spawn every year, Hassler’sestimates <strong>of</strong> abundance should be useful as a measure <strong>of</strong> spawning stock abundance.Hassler used several methods to estimate abundance, <strong>and</strong> as noted above, the resultsare consistent for each. The comparison between historic <strong>and</strong> current spawnerabundance is based on Hassler’s mark-recapture method (Hassler <strong>and</strong> Taylor 1984), asthis provides the longest time series <strong>and</strong> some overlap with the VPA estimates. Both71
1,000,000900,000800,000HasslerVPASpawner Abundance700,000600,000500,000400,000300,000200,000100,00001955 1960 1965 1970 1975 1980 1985 1990 1995 2000YEARFigure 6.8. Estimated spawning stock abundance in numbers. 1956-1983represents Hassler's estimates, 1982-2001 represents currentVPA estimates.series show that spawner abundance declined to very low levels in the early 1980’s(Figure 6.8) Hassler initiated sampling <strong>of</strong> juvenile striped bass through trawling at fixedstations that are still in use for current juvenile sampling. This provides an unbrokentime series <strong>of</strong> sampling based on consistent methods that can be used to comparerelative juvenile abundance over the last 46 years. Recruitment estimated from the VPA<strong>and</strong> JAI values for 1982-1999 are modeled using a Ricker-type stock recruitment curveto predict recruitment from JAI values for 1956-1981 (Figure 6.9). Predictedrecruitment values are then combined with VPA estimates for 1982-1999 to plot a timeseries <strong>of</strong> recruitment (Figure 6.10). Recruitment possibly averaged just under 700,000fish during the 1960’s <strong>and</strong> 1970’s. A string <strong>of</strong> relatively poor year classes occurred from1971-1973 <strong>and</strong> again from 1978-1980. Most <strong>of</strong> the high estimated recruitment valuesoccurred when the JAI averaged around 10, by the mid 1970’s the 5 year movingaverage drops to around 5, <strong>and</strong> then in the 1980’s it drops even further to around 1(Figure 6.11). Recent JAI values are very variable, with a notable lack <strong>of</strong> observationsaround 10 which would allow more robust evaluation <strong>of</strong> predicted historic recruitmentvalues.6.1.3 Current ConditionThe DMF assesses the status <strong>of</strong> the Albemarle-Roanoke stock <strong>of</strong> striped bass annually,using the ADAPT program for solving a tuned Virtual Population Analysis (VPA). Thefollowing is a summary <strong>of</strong> current stock status as reported in Carmichael (2002).72
The A/R stock <strong>of</strong> striped bass is at a high level <strong>of</strong> abundance <strong>and</strong> fishing mortality ratesare within management targets. The stock is not overfished <strong>and</strong> overfishing is notoccurring.1000800Est Rec6004002000Obs RecPred Rec0 10 20 30 40 50JAI Observed SurveyFigure 6.9. Relationship between juvenile survey values <strong>and</strong> estimatedrecruitment.Recruits in Thous<strong>and</strong>s.PREDICTED1000VPA90080070060050040030020010001950 1960 1970 1980 1990 2000 2010YEARFigure 6.10. Time series <strong>of</strong> recruitment at age-1, estimated from the JAI<strong>and</strong> 'observed' values from VPA estimates.73
60JAIPREDICTED5yr Avg.5040JAI30201001955 1965 1975 1985 1995YEARFigure 6.11. Juvenile Abundance Index, Hassler Trawl Stations 1956-2000 <strong>and</strong> 5 year moving average.Annual population abundance increased sharply from a low <strong>of</strong> 195,000 fish in 1988 toover 2 million fish by 1999. Population abundance is currently stabilizing at around 2million fish, although uncertain abundance estimates for recent cohorts over the last fewyears <strong>of</strong> the analysis leads to considerable variation in estimated abundance from yearto year. To remove these effects, overall abundance is plotted for age 3 <strong>and</strong> older fish(Figure 6.12), which is stabilizing lower, at around 1.2 million fish. Recruitment at age 1was below the 1982-2000 average <strong>of</strong> 284,000 fish from 1982-1983 with the exception <strong>of</strong>1991, <strong>and</strong> has been above average since 1984 for every year except 2000. Although allindications are that the 2001 age 1 abundance will be well above average, thecombination <strong>of</strong> low precision in the current estimate <strong>and</strong> a significant retrospective biaswhen young-<strong>of</strong>-the-year survey values are extremely high results in an estimate for2001 that is unreasonable. This value will likely decline as more years are added to theseries <strong>and</strong> this cohort recruits to the fishery.Recruitment at age 1 was below the long term average (1982-2000, mean =282,000)from 1982 until 1993 with the exception <strong>of</strong> 1991. Recruitment has been above the longterm average for 8 <strong>of</strong> the last 9 years ( Figure 6.13).Fishing mortality averaged over the exploited ages (3-7) was generally high from 1982to 1991 (averaging F=.90), then declined to F=.31 in 1992. Since 1993 fishing mortalityhas varied between 0.13 <strong>and</strong> 0.60 <strong>and</strong> has averaged 0.30. The 2001 estimate <strong>of</strong> fishingmortality on ages 3-7 <strong>of</strong> F=0.13 is below the target for these ages (Ftarget = 0.28)(Figure 6.14).Spawning stock biomass (SSB) based on females dropped from 200,000 pounds in1982 to a low <strong>of</strong> 35,000 pounds in 1990. SSB then climbed gradually to nearly 600,00074
1,4001,200Thous<strong>and</strong>s age 3+1,00080060040020001982 1984 1986 1988 1990 1992 1994 1996 1998 2000 2002YearFigure 6.12. Abundance <strong>of</strong> Albemarle-Roanoke striped bass, age 3 <strong>and</strong> older.1,000900800Thous<strong>and</strong>s age 170060050040030020010001982 1984 1986 1988 1990 1992 1994 1996 1998 2000 2002YearFigure 6.13. Recruitment in thous<strong>and</strong>s <strong>of</strong> age-1 fish. (line represents mean;2001 estimate omitted for scaling.75
1.803,7 Target1.601.40Fishing Mortality (F)1.201.000.800.600.400.200.001982 1984 1986 1988 1990 1992 1994 1996 1998 2000 2002YearFigure 6.14. Estimated fishing mortality over ages 3-7 <strong>and</strong> fishing mortality target.1,8001,600TotalThresholdThousan Pounds Female SSB1,4001,2001,00080060040020001982 1984 1986 1988 1990 1992 1994 1996 1998 2000 2002YearFigure 6.15. Female spawning stock biomass in thous<strong>and</strong>s <strong>of</strong> pounds <strong>and</strong>threshold value.76
pounds in 1998, <strong>and</strong> has since increased rapidly, reaching 1.6 million pounds in 2001(Figure 6.15).Population age structure shows signs <strong>of</strong> expansion over the last 10 years (Figure 6.16).In the early 1990’s age 5 <strong>and</strong> older fish represented less than 1% <strong>of</strong> the population,although this ratio has increased to 10-20% since 1995. As expected, the recovery <strong>of</strong>age 8+ fish is somewhat behind that <strong>of</strong> age 5+. Age 8 <strong>and</strong> older fish were absent fromthe population between 1990 <strong>and</strong> 1994; since 1997 this component has averaged about5% <strong>of</strong> the population.0.258+ 5+Percent <strong>of</strong> Population0.200.150.100.050.001982 1984 1986 1988 1990 1992 1994 1996 1998 2000 2002YearFigure 6.16. Percent composition <strong>of</strong> age 5+ <strong>and</strong> 8+ striped bass in the total6.2 Central/Southern <strong>Management</strong> Area StocksExploitation was estimated for the Tar <strong>and</strong> Neuse River stocks from survey catches perunit effort. No estimates <strong>of</strong> stock abundance are available at this time.6.2.1 Neuse River StockResults <strong>of</strong> the catch curve analysis suggest that total mortality is excessive for theNeuse River stock <strong>of</strong> striped bass. Cohort catch curve estimates <strong>of</strong> total mortalityaverage Z=0.99, resulting in an estimate <strong>of</strong> average fishing mortality <strong>of</strong> F=0.84. Annualcatch curves indicate only slightly lower mortality levels (Z=0.86, F=0.71). Estimatedmortality is significantly higher than the proposed threshold mortality rate(F10%SPR=0.40) based on life history characteristics <strong>of</strong> striped bass in general <strong>and</strong> theRoanoke River stock specifically, therefore overfishing is currently occurring. There isno apparent trend in mortality over time, suggesting that current management measuresmay be adequate to prevent stock collapse. However, current measures are notpreventing overfishing <strong>and</strong> are not expected to provide any stock improvement. As onlyrelative abundance estimates are available, it is not known whether the stock is77
overfished. However, the prolonged overfishing indicated by the catch curve analysis<strong>and</strong> the truncated age structure <strong>of</strong> the stock suggest the Neuse River striped bass stockis also overfished.Total mortality must be reduced substantially to stop overfishing <strong>of</strong> Neuse River stripedbass. Current fishing mortality (average from cohort catch curves, F=0.84) is estimatedat more than twice the overfishing threshold (F10% SPR = 0.40). Converting frominstantaneous to annual exploitation rates, the current removal rate <strong>of</strong> 53% must bereduced by 42% to reach the threshold. Mortality will have to be reduced even further,by 61%, to reach target levels.6.2.2 Tar River StockEstimates <strong>of</strong> total mortality for the Tar River striped bass stock indicate that mortality isexcessive. Cohort catch curve estimates <strong>of</strong> total mortality average Z=1.17, resulting inan estimate <strong>of</strong> fishing mortality <strong>of</strong> F=1.02. Annual catch curve estimates are slightlyhigher, with total mortality averaging Z=1.30 <strong>and</strong> fishing mortality averaging F=1.15.These mortality estimates are significantly higher than the proposed threshold mortalityrate (F10% SPR=0.40) based on life history characteristics striped bass in general <strong>and</strong>the Roanoke River stock specifically, therefore overfishing is currently occurring. Asonly relative abundance estimates are available, it is not known whether the stock isoverfished. However, the prolonged overfishing indicated by the catch curve analysis<strong>and</strong> the truncated age structure <strong>of</strong> the stock suggest the Tar River striped bass stock isalso overfished. Although the Tar River analysis is based on fewer years <strong>of</strong> survey datathan the Neuse River analysis, the available data fit the catch curve models quite well,based on the strong linear trend in log transformed CPUE that is evident in both cohort<strong>and</strong> annual catches, consistency in the estimated slope parameters which can beconsidered evidence <strong>of</strong> consistent recruitment, <strong>and</strong> relatively small st<strong>and</strong>ard errors inboth slope <strong>and</strong> intercept parameters for most years.Total mortality must be reduced substantially to stop overfishing <strong>of</strong> Tar River stripedbass. Current fishing mortality (average from cohort catch curves, F= 1.02) is estimatedat more than two times the overfishing threshold (F10% = 0.40). Converting frominstantaneous to annual exploitation rates, the current removal rate <strong>of</strong> 60% must bereduced by 49% to reach the threshold. Mortality will have to be reduced even further,by 66%, to reach target levels.6.2.3. Cape Fear River StockNo current information is available on the status <strong>of</strong> the Cape Fear stock at this time.7.0 STATUS OF THE FISHERIES7.1 IntroductionIn North Carolina coastal sounds <strong>and</strong> tributary rivers, striped bass are harvested in bothcommercial <strong>and</strong> recreational fisheries. Commercial fisheries occur in Coastal <strong>and</strong> Jointwaters <strong>and</strong> recreational fisheries occur in Coastal, Joint, <strong>and</strong> Inl<strong>and</strong> waters. Stripedbass harvest in the Atlantic Ocean; both commercial <strong>and</strong> recreational are managedconsistent with coastwide specifications in the ASMFC Striped Bass <strong>Fishery</strong><strong>Management</strong> <strong>Plan</strong> (2003).78
7.2 A/R Stock7.2.1 Commercial Fisheries7.2.2 HistoricalThe Albemarle Sound area commercial striped bass fishery has been documented innumerous reports for over 100 years. In 1872, one <strong>of</strong> the most important striped bassfisheries began to develop through the haul seine fishery in Albemarle Sound. Stripedbass were a bonanza to the haul seine fisheries in the Edenton area. Capehart’s Avocahaul seine fishery in western Albemarle Sound was considered the best location tocapture striped bass. Catches were phenomenal, on May 6, 1876 the first haul <strong>of</strong> theseine yielded 38,000 pounds <strong>and</strong> the second haul 13,000 pounds. Many <strong>of</strong> the fishweighing 80-90 pounds, with one reported at 105 pounds. Virtually all <strong>of</strong> the fish wereiced <strong>and</strong> shipped to Norfolk, VA <strong>and</strong> sold to dealers in Washington, DC, Baltimore, MD,Philadelphia, PA <strong>and</strong> New York, NY (Taylor 1992).During the early 1880s, a large fishery developed on Roanoke Isl<strong>and</strong> catching stripedbass in the spring <strong>and</strong> fall. Gears included haul seines, drag nets, purse seines, fishtraps <strong>and</strong> gill nets. The fish were small, averaging 1 – 2 pounds but the numbers werestaggering. In 1886, a typical year, the 215 striped bass fishermen <strong>of</strong> Roanoke Isl<strong>and</strong>caught roughly 380,000 pounds. By the late 1880s, S.G. Worth reported that “Theestablishment <strong>and</strong> continuance <strong>of</strong> the pursuit accounts fully for the decrease ordisappearance <strong>of</strong> the striped bass at the fisheries higher up on the Albemarle Sound”(Taylor 1992).The huge haul seines, though very efficient, ultimately became victims <strong>of</strong> their own size.Harvest was high for a period <strong>of</strong> time <strong>and</strong> then dropped drastically. In 1869, two Ohiobrothers, Captain John <strong>and</strong> William Hetterick, arrived in Edenton <strong>and</strong> began fishing withpound nets in Albemarle Sound (Earll 1887). The pound net, a simple device, is a longline <strong>of</strong> stakes draped with netting extended out into the channel which divert migratingfish into a small, heart-shaped funnel <strong>and</strong> then into the “pound”. One or two men in asmall boat used large dip nets to remove the fish from the pound. The use <strong>of</strong> the poundnets revolutionized fishing in North Carolina, especially in Albemarle Sound (Taylor1992).Pound nets had several advantages over the large haul seines: cost was just a fewhundred dollars, were tended by only two or three men, <strong>and</strong> could be set any where.The number <strong>of</strong> pound nets increased from 117 in 1880 to 1,125 by 1896 in AlbemarleSound (Taylor 1992). Chestnut <strong>and</strong> Davis (1975) reported that 2,767 pound nets wereset in North Carolina in 1927. Although the pound nets were set primarily for riverherring <strong>and</strong> shad; striped bass were a considerable portion <strong>of</strong> the harvest. From the late1880s through 1954 pound nets accounted for 26-62% <strong>of</strong> the total striped basscommercial harvest (Section 13, Appendix 1). The fish caught in the pound nets variedin size. Smith (1907) reported several striped bass captured in pound nets at Edenton in1891 that weighed 125 pounds. By the late 1960’s through the early 1970’s, pound netcontribution to the striped bass harvest had dropped to 4.8 – 7.3% <strong>of</strong> the total. Gill nets,79
anchor <strong>and</strong> drift, have historically been utilized in the striped bass fishery. Since thedevelopment <strong>of</strong> mon<strong>of</strong>ilament webbing, gill nets have been the dominant harvest gear.By the late 1960’s to the early 1970’s, gill nets were accounting for up to 77% <strong>of</strong> thestriped bass harvest. Striped bass were harvested by purse seines, fish wheels, hoop<strong>and</strong> fyke nets <strong>and</strong> trotlines.The Albemarle Sound area (ASMA) <strong>and</strong> Roanoke River historically supported thelargest year-round commercial fishery for striped bass in North Carolina, accounting forup to 95% <strong>of</strong> the states striped bass harvest from 1930 through 1960. From 1972-1987,the Albemarle Sound area produced up to 87% <strong>of</strong> the striped bass l<strong>and</strong>ings from thestate’s internal waters. Chestnut <strong>and</strong> Davis (1975) presented a synopsis <strong>of</strong> striped bassl<strong>and</strong>ings by gear for the state (1887-1971), annual l<strong>and</strong>ings <strong>and</strong> value for some years,<strong>and</strong> l<strong>and</strong>ings by county (Section 13, Appendix 1). Annual l<strong>and</strong>ings by gear are shown inTable 7.1 for 1978 – 2002 <strong>and</strong> in Table 4.1 by waterbody for 1972 – 2002.From 1915 through 1965, various regulations were promulgated for the AlbemarleSound fisheries, some specifically for striped bass, while others affected the harvest <strong>of</strong>the species though not developed directly for striped bass. The regulations includedarea closures, yardage restrictions, harvest limits <strong>and</strong> other restrictions (Section 13,Appendix 2). Appendix 3 summarizes rules <strong>and</strong> regulations enacted since 1979 forstriped bass conservation <strong>and</strong> management.The commercial fishery for striped bass has principally occurred from Novemberthrough April in the Albemarle Sound, whereas, Roanoke River commercial effort wasconcentrated during the spring spawning run. During the summer months, all l<strong>and</strong>ingswere much lower (Hassler et al. 1981). Anchor <strong>and</strong> drift gill nets were the mostproductive gear types in the spring spawning run portion <strong>of</strong> the Roanoke River fishery.In 1981, anchor gill nets were prohibited in the Roanoke River, <strong>and</strong> the mesh size <strong>of</strong>drift gill nets was restricted, resulting in sharply curtailed l<strong>and</strong>ings during the spawningrun (Hassler 1984). Bow <strong>and</strong> dip netting was a productive method <strong>of</strong> harvestingspawning fish in Roanoke River until it was prohibited in 1981. Prior to this rule,fishermen using bow nets in the upper Roanoke River were allowed to retain 25 stripersper day when taken incidentally to shad <strong>and</strong> river herring fishing. A local law, allowingthe commercial sale <strong>of</strong> striped bass in Halifax <strong>and</strong> Northhampton counties was enactedby the <strong>NC</strong> General Assembly <strong>and</strong> created a prominent commercial fishery for stripedbass in its principal spawning area (Hassler et al. 1981). This law was repealed in 1981<strong>and</strong> commercial fishing for striped bass was totally eliminated in the Roanoke River.Limited commercial fishing seasons were implemented in Albemarle Sound in 1984(October-May) (Henry et al. 1992). State regulations enacted in 1985 prohibited the sale<strong>of</strong> hook <strong>and</strong> line caught striped bass.7.2.3 CurrentThe ASMA commercial striped bass fishery from 1990 through 1997 operated on a98,000 pound total allowable catch (TAC). The TAC was split in order to have a spring<strong>and</strong> fall fishery.80
Table 7.1. North Carolina commercial striped bass l<strong>and</strong>ings from internal waters, by gear 1978-2002.Gill Net Haul/BeachYear Float SinkRunaroundDrift Pound net Seine Swipe net Trawl Trolling Rod-n-reel Pots Fyke netsUnknown/otherInternalState total1978 492,269 36,314 1,164 102 1,924 1,513 533,2861979 274,940 131 16,844 16,542 180 56,057 9,410 374,1041980 410,236 13,826 7,276 * 1,589 17,332 410 450,6691981 336,035 17,645 2,310 * * 9,165 628 365,7831982 195,847 32,048 7,859 * * 9,093 590 245,4371983 286,066 * 11,793 374 * * 9,016 1,230 308,4791984 487,600 7,618 846 * 2,329 2 498,3951985 259,746 19,782 * * * 229 279,7571986 182,853 5,596 * * 532 188,9811987 232,744 29,477 262,2211988 108,622 7,254 115,8761989 91,387 9,253 * 98 100,7381990 95,214 10,055 105,2691991 113,247 3,341 * * 42 116,6301992 128,592 * 4,626 79 10 133,3071993 180,233 * 1,919 4,600 * 24 186,7761994 48,465 56,368 303 253 12,800 2,290 500 341 905 122,2251995 50,829 41,130 120 * 4,277 4,592 * 42 80 254 790 89 102,2031996 64,681 50,541 429 197 4,990 1,820 * * 137 513 40 123,3481997 34,746 71,964 1,300 120 14,007 773 56 206 * 835 440 196 124,6431998 33,776 96,430 1,493 80 14,735 1,890 118 * 749 517 112 149,9001999 57,111 122,380 274 * 12,820 2,100 * * 934 705 506 196,8302000 42,547 181,093 476 * 17,590 * * 1,227 1,343 1,592 245,8682001 44,690 184,857 1,401 12,761 538 * * 1,176 2,696 201 248,3202002 33,480 192,117 5,644 3,640 18,862 1,621 * 196 1,485 1,376 258,41681
The commercial fishery operated with net yardage restrictions, mesh size restrictions,size limit restrictions <strong>and</strong> daily l<strong>and</strong>ing limits. The A/R stock was declared recovered in1997 by the ASMFC. In 1998, the commercial TAC was increased to 125,440 pounds<strong>and</strong> additional increases in poundage occurred in 1999 <strong>and</strong> 2000. From 2000 through2002, the commercial TAC has remained at 225,000 pounds. The ASMFC Striped Bass<strong>Management</strong> Board approved a 50,000 pound TAC increase for the ASMA commercialharvest for 2003, for a total commercial harvest <strong>of</strong> 275,000 pounds. Since recovery,seasons, yardage <strong>and</strong> mesh size restrictions <strong>and</strong> daily l<strong>and</strong>ing limits have been used tocontrol harvest <strong>and</strong> bycatch (Appendix 3). A summary <strong>of</strong> the ASMA commercialseasons, 1991-2003 is presented in Table 7.2.From 1991 through 2002, the ASMA accounted for 85 – 93% <strong>of</strong> the internal striped bassl<strong>and</strong>ings in North Carolina (Table 4.1). The ASMA averaged approximately 407fishermen reporting l<strong>and</strong>ings <strong>of</strong> striped bass for 1994 – 2002. Gill nets continue tocontribute the highest percentage to the harvest, followed by pound nets (Table 7.1).The amount <strong>of</strong> fyke net effort has increased in the ASMA since 1994 <strong>and</strong> is reflected inthe striped bass l<strong>and</strong>ings (Table 7.1).Striped bass continue to be managed as a bycatch <strong>of</strong> the multi-species fishery in theASMA. During 2002, when the striped bass season was open, commercial fishermenwere allowed to l<strong>and</strong> 5 fish per day, not to exceed 50% by weight <strong>of</strong> the total catch, withan 18 inch total length minimum size limit. Finfish dealers who purchase striped bassare required to obtain a striped bass dealer permit from DMF. The dealers are requiredto report their l<strong>and</strong>ings daily to DMF in order for the quota to be monitored. Dealers arealso required to affix striped bass sale tags, provided by DMF, to the fish whenpurchased from the fishermen.7.2.4 A/R Commercial Discard/Bycatch MortalityThe ASMA supports a substantial anchored gill net fishery for species such as flounder,striped mullet, white perch, river herring <strong>and</strong> shad. As a result <strong>of</strong> the recovery <strong>of</strong> the A/Rstock, the incidental bycatch <strong>of</strong> striped bass has increased. Preventive measures havebeen implemented to address this issue, which has ranged from the prohibition <strong>of</strong>certain mesh sizes in gill nets, limiting the amount <strong>of</strong> yardage that can be fishes, areaclosures <strong>and</strong> required net attendance for small mesh gill nets during times <strong>of</strong> the year(Appendix 3). The MFC allows the multi-species gill net fishery to be pursued asindicated above. Since 1996, DMF has worked with commercial fishermen, to allowobservers on their vessels, on a voluntary basis in the ASMA while gill net fishing.These observer trips have mainly focused on the flounder gill net fishery, during thesummer <strong>and</strong> early fall, when personnel have been available. Some trips have beenmade in the shad <strong>and</strong> small mesh gill net fisheries, but insufficient data has beengathered to make an accurate estimate.82
Table 7.2. Summary <strong>of</strong> striped bass commercial seasons in the Albemarle Sound <strong>Management</strong> Area, 1991 – 2003.YearAnnualQuota (lbs.)2003 275,000(270,287)SpringSeasonJan 6 – Mar 19Mar 20 – Apr 142002 225,000(216,121)Jan 7 – Apr 1498 days2001 225,000 Jan 5 – Mar 25(211,348) Mar 26 – Apr 14100 days2000 225,000 Jan 7 – Mar(200,109)26Mar 27 – Apr1499 days1999 137,984 Feb 9 – Mar28Mar 29 – Apr 1465 days1998 125,440 Feb 16 –Mar 6Mar 7 – Apr 1458 days1997 98,000 Feb 15 –Mar 23Mar24 – Apr1459 days1996 98,000 Feb 16 – Apr 7Apr 8 – Apr 1459 days1995 98,000 Mar 1– Apr 4Apr 5– Apr 1445 days1994 98,000 Feb 21 – Mar 1321 days1993 98,000 Feb 1 – Feb28Mar 1 – Apr 564 daysBag Limit5 fish/18” TL10 fish/ 18” TLPoundage L<strong>and</strong>ed Fall Season BagLimit193,554(preliminary-QuotaMonitoring)5 fish/18”TL 166,471 Nov 4 – Dec 205 fish/18”TL10 fish/ 18” TL5 fish/18”TL10 fish/ 18” TL5 fish/18”TL10 fish/ 18” TL5 fish/18”TL10 fish/ 18” TL3 fish/18”TL7 fish/ 18”TL5 fish/18”TL3 fish/18”TL5 fish/18”TL2 fish/ 18” TL10 fish/18”TL5 fish/18”TL3 fish/ 18” TL47 days185,585 Nov 19 – Dec 2133 days162,467 Nov 13 –Dec 3149 days116,833 Dec 1 – Dec12Dec 13 – Dec 3131 days101,093 Dec 1 – Dec3131 days73,534 Nov 3 – Dec533 days79,678 Nov 30 – Dec 22Dec 23 – Dec 3132 days85,302 Nov 22 – Dec 31PoundageL<strong>and</strong>edTotalPoundsL<strong>and</strong>ed? ? ? ?5 fish/18”TL 54,363 220,834*5 fish/18”TL 34,642 220,227*5 fish/ 18”TL 51,294 213,761*10 fish/18”TL5 fish/ 18”TL10 fish/18”TL5 fish/18”TL38,343 162,87523,096 123,92722,116 96,1225 fish/18”TL10fish/18”TL9,946 90,1002 fish/18”TL 4,200 87,87640 days53,698 Nov 21 – 5 fish/ 18”TL 48,503 102,367Dec 2333 days109,475 No Season 109,47583
Table 7.2 (Continued)YearAnnualQuota (lbs.)SpringSeason1992 98,000 Jan 11 – Feb 2Feb 3 – Mar 18Mar 19 – Apr 1697 days1991 98,000 Jan 7 – Jan9Jan 18 – Feb 12Feb 13 – Feb 28Mar 1 – Mar 24Mar 25 – Apr 5Apr 6 – Apr 1386 daysBag Limit10 fish/18”TL5 fish/ 18” TL3 fish/18”TLMonthlyquota/14”TLCoastal/16”TLJoint3 fish/20”TL5 fish/18”TL10 fish/18”TL20 fish/14”TLCoastal/16”TLJointPoundage L<strong>and</strong>ed Fall Season BagLimit96,435 Nov 9 –Nov 2012 days101,219 Nov 1 –Dec 2050 days3 fish/18”TL3 fish/18”TLPoundageL<strong>and</strong>edTotalPoundsL<strong>and</strong>ed4,114 100,5497,241 108,4605 fish/18”TL*Total allowable catch adjusted to compensate for overages in previous year.84
The bycatch <strong>of</strong> striped bass in the ASMA gill net fisheries has been a point <strong>of</strong>compliance with the ASMFC Striped Bass Interstate <strong>Fishery</strong> <strong>Management</strong> <strong>Plan</strong> since1994. An annual estimate <strong>of</strong> striped bass discards has occurred since 1994. Themethods utilized <strong>and</strong> the estimates can be found in Section 10.3.2.1, Discard Mortality<strong>of</strong> Striped Bass in the Multi-species Gill Net <strong>Fishery</strong> Issue Paper.7.3 Central/Southern Stocks7.3.1 Pamlico <strong>and</strong> Tar Rivers <strong>and</strong> Pamlico Sound7.3.1.1 Commercial7.3.1.2 HistoricalCommercial striped bass fisheries have historically occurred throughout Pamlico Sound<strong>and</strong> its tributaries. However, these fisheries were not <strong>of</strong> the magnitude <strong>of</strong> the Albemarle<strong>and</strong> ran second in total l<strong>and</strong>ings for the state. As with the Albemarle, the progression <strong>of</strong>various gears was the same over time from haul seines, pound nets to gill nets.From the 1930s through the 1960’s the Pamlico Sound, Pamlico <strong>and</strong> Tar riversaccounted for 3.4 – 5.5% <strong>of</strong> the total internal striped bass l<strong>and</strong>ings in North Carolina.During the 1970’s <strong>and</strong> 1980’s this area contributed 7 – 10% <strong>of</strong> the state’s internalstriped bass l<strong>and</strong>ings. Chestnut <strong>and</strong> Davis (1975) presented a synopsis <strong>of</strong> striped bassl<strong>and</strong>ings by gear for the state (1887 – 1971), annual l<strong>and</strong>ings <strong>and</strong> value for some years,<strong>and</strong> l<strong>and</strong>ings by county (Section 13, Appendix 1). Annual l<strong>and</strong>ings by gear are shown inTable 7.1 from 1978 – 2002 <strong>and</strong> in Table 4.1 by waterbody for 1972 – 2002.From 1915 – 1965, various regulations were enacted on the fisheries <strong>of</strong> the Pamlicosystem. The regulations included net restrictions <strong>and</strong> area restrictions (Section 13,Appendix 2). Appendix 3 summarizes rules <strong>and</strong> regulations enacted since 1979 relativeto striped bass management.7.3.1.3 CurrentSince 1994, when the North Carolina Striped Bass <strong>Management</strong> <strong>Plan</strong> was approved,the CSMA (all areas south <strong>of</strong> the ASMA line) has operated on a 25,000 pound TAC.The fishery has operated as a low harvest level fishery, using set seasons with size limitrestrictions <strong>and</strong> daily l<strong>and</strong>ing limits. The various rules <strong>and</strong> regulations are shown inAppendix 3.The Pamlico Sound <strong>and</strong> Pamlico/Pungo River complex has accounted for 10.5% <strong>of</strong> thestate’s internal striped bass l<strong>and</strong>ings since 1994. During 1999 <strong>and</strong> 2000, these areasexceeded the total 25,000 pound TAC for the entire Central/Southern area <strong>of</strong> the state(Table 4.1). In the Central/Southern region between 1994 – 2000, there was an average<strong>of</strong> 211 fishermen reporting l<strong>and</strong>ings in a given year. The majority <strong>of</strong> these fishermenwere from the Pamlico Sound <strong>and</strong> Pamlico/Pungo river areas. Gill nets account for thehighest percentage <strong>of</strong> the striped bass l<strong>and</strong>ings from this area.85
The striped bass low harvest level fishery is divided into a spring <strong>and</strong> fall season. Duringthe open season fishermen are restricted to daily l<strong>and</strong>ing limits <strong>and</strong> minimum size limits.Finfish dealers are required to obtain a striped bass permit, with a Central/Southernvalidation, report l<strong>and</strong>ings daily to DMF <strong>and</strong> affix a sale tag to the striped bass whenpurchased from the fishermen.7.3.2 Neuse River7.3.2.1 Commercial7.3.2.2 HistoricalStriped bass commercial fisheries have occurred in the Neuse River since colonialtimes. Worth (1903) reported that striped bass were numerous at New Bern <strong>and</strong> at otherpoints along the Neuse River.The progression <strong>of</strong> commercial gears was similar to the other areas <strong>of</strong> the state.Commercial fisheries on the Neuse River employed drift gill nets with a full range <strong>of</strong>mesh sizes upstream to Pitch Kettle Creek <strong>and</strong> stake gill nets <strong>and</strong> haul seinesprincipally from New Bern downstream (Marshall 1977).From the 1930s through the 1980’s commercial l<strong>and</strong>ings <strong>of</strong> striped bass in the NeuseRiver were insignificant compared to the statewide l<strong>and</strong>ings. The commercial stripedbass fishery may have been important at the turn <strong>of</strong> the century but has remained atvery low levels for the last 50 years. Chestnut <strong>and</strong> Davis (1975) presented striped bassl<strong>and</strong>ings by county for the period 1930 – 1968 (Appendix 1), which shows the smallamount <strong>of</strong> l<strong>and</strong>ings for the counties along the Neuse River. Table 4.1 shows the NeuseRiver l<strong>and</strong>ings from 1972 – 2002.The fisheries <strong>of</strong> the Neuse were affected by various regulations enacted from 1915 –1965 (Appendix 2). The rules <strong>and</strong> regulations enacted since 1979 relative to stripedbass management are shown in Appendix 3.7.3.2.3 CurrentThe harvest <strong>of</strong> striped bass is from bycatch <strong>of</strong> other fisheries <strong>and</strong> the l<strong>and</strong>ings are part<strong>of</strong> the 25,000 pound TAC. Since 1994, the Neuse River striped bass commerciall<strong>and</strong>ings have increased from that <strong>of</strong> the 1970’s <strong>and</strong> 1980’s (Table 4.1). The l<strong>and</strong>ingssince 1995 have been fairly consistent <strong>and</strong> averaged 5,950 pounds, which are thehighest commercial l<strong>and</strong>ings for the Neuse River since 1976 (Table 4.1). Gill netsaccount for the majority <strong>of</strong> the harvest.7.3.3 Cape Fear River7.3.3.1 Commercial86
7.3.3.2 HistoricalThe striped bass fishery in the Cape Fear River system has typically been smallcompared to the other systems <strong>of</strong> the state. In 1923, a law was passed that made itunlawful to catch or take with nets or seines any striped bass (rock) in any waters <strong>of</strong>New Hanover County (<strong>NC</strong> Fishing Laws- 1923) (Section 13, Appendix 2). This lawremained in effect through 1987. The majority <strong>of</strong> the striped bass l<strong>and</strong>ed were taken asincidental bycatch in the American shad fishery. Striped bass l<strong>and</strong>ings by county from1930 – 1968 are presented in Appendix 1. Since 1979, various rules <strong>and</strong> regulationshave been enacted by the state that have affected striped bass harvest (Appendix 3).7.3.3.3 CurrentThe Cape Fear River system striped bass fishery has operated under theCentral/Southern TAC since 1994. The fishery has been prosecuted as the other parts<strong>of</strong> the state with seasons, minimum size limits, daily l<strong>and</strong>ings limits <strong>and</strong> dealer permitrequirements. The Cape Fear River season is only open to striped bass commercialharvest during the spring ( Jan – Apr).The striped bass l<strong>and</strong>ings primarily occur as bycatch <strong>of</strong> the American shad fishery.Since 1994, the average annual l<strong>and</strong>ings are approximately 1,300 pounds, which is lessthan it was in the 1970’s <strong>and</strong> early 1980’s (Table 4.1).7.3.4 C/S Commercial Discard/Bycatch MortalityThe CSMA estuarine gill net fishery is a year round multi-species fishery where nettingused <strong>and</strong> species targeted varies by area <strong>and</strong> season. Species commonly caught by thegill net fishery include American shad, Atlantic croaker, southern flounder, red drum,spot, spotted seatrout, striped bass, striped mullet <strong>and</strong> weakfish. Even though a 25,000TAC, daily l<strong>and</strong>ing limits <strong>and</strong> seasons exist in the CSMA, striped bass is a targetedcatch. Even with the 5 fish per operation daily l<strong>and</strong>ing limit, over 30% <strong>of</strong> the gill net tripsduring the open season were composed primarily <strong>of</strong> striped bass (defined as over 50%<strong>of</strong> the trip tickets).An estimate <strong>of</strong> the discarded catch for a gear may be computed by estimating the “totalcatch” (quantity taken that reaches the deck <strong>of</strong> vessel) <strong>and</strong> subtracting from it the“l<strong>and</strong>ed catch” (that which is brought ashore). The discarded catch may then bemultiplied by a mortality estimate (percent that are dead at the time <strong>of</strong> harvest) to givean estimate <strong>of</strong> the quantity <strong>of</strong> dead discard. Since the DMF does not have acomprehensive onboard observer program, the total catch must be estimated. TheDivision data <strong>and</strong> methods utilized to calculate a discard (dead) estimate for the set gillnet fishery in Pamlico Sound <strong>and</strong> Pamlico, Pungo, Bay <strong>and</strong> Neuse rivers can be foundin Section 10.4.3.2 Discard Mortality <strong>of</strong> Striped Bass From Set Gill Nets in the CSMA.Similar data for other areas in the CSMA is not available.7.4 Recreational Fisheries87
7.4.1 IntroductionThe origins <strong>of</strong> recreational angling in North Carolina are poorly documented in existingliterature. Most likely, Native Americans <strong>and</strong> early colonists first took striped bass withhook <strong>and</strong> line purely as a matter <strong>of</strong> subsistence. After the industrial revolution <strong>and</strong> withthe advent <strong>of</strong> outboard motors, anglers began to seek striped bass with hook <strong>and</strong> linefor both subsistence <strong>and</strong> recreation. Early in the 20 th century, in the Croatan <strong>and</strong>Roanoke Sound areas <strong>of</strong> Dare County, charter boat fishing fleets developed, signaling amove towards angling for striped bass, purely as a recreational activity. An increase indisposable income <strong>and</strong> leisure time during the mid-1900s gave rise to a great interest infishing for striped bass in North Carolina’s sounds <strong>and</strong> rivers. As recovery <strong>of</strong> the A/Rstock continued into the late 1990’s, a tremendous increase in recreational effort forstriped bass occurred.Keeping striped bass for food has always been an important element <strong>of</strong> the recreationalexperience, but because striped bass caught recreationally were allowed to be sold insome areas the distinction between recreational <strong>and</strong> commercial fisheries has beenunclear at times. For example, until the early 1980’s, striped bass were caught withrecreationally licensed bow nets in the upper reaches <strong>of</strong> Roanoke River <strong>and</strong> locallegislation allowed these fish to be bought <strong>and</strong> sold. Striped bass caught on hook <strong>and</strong>line in the eastern Albemarle Sound charter boat fisheries were also bought <strong>and</strong> sold.After the near collapse <strong>of</strong> the A/R striped bass stock in the late 1970’s, regulatoryagencies recognized the need to remove economic incentives to sell striped bass takenwith traditional recreational gear so that commercial harvest could be limited <strong>and</strong>quantified. Statutes allowing the sale <strong>of</strong> recreationally caught striped bass wererepealed <strong>and</strong> rules <strong>of</strong> the MFC were changed to implement distinctions between themanner in which commercially saleable striped bass could be taken.Taking <strong>and</strong> possession <strong>of</strong> striped bass using hook <strong>and</strong> line in coastal North Carolina isregulated by the WRC in designated Inl<strong>and</strong> waters, jointly by the WRC <strong>and</strong> MFC indesignated Joint waters <strong>and</strong> by MFC in designated Coastal waters. In designated Jointwaters, rules governing harvest seasons, creel limits <strong>and</strong> size limits are jointly enactedby the WRC <strong>and</strong> the MFC <strong>and</strong> are jointly enforced by <strong>of</strong>ficers <strong>of</strong> both agencies.Techniques for catching striped bass on hook <strong>and</strong> line include trolling, casting, <strong>and</strong>jigging with artificial lures <strong>and</strong> the use <strong>of</strong> live bait (eels, herring, shiners) <strong>and</strong> cut bait,primarily river herring. The North Carolina Fisheries Reform Act approved by the <strong>NC</strong>General Assembly in 1997 established the Recreational Commercial Gear License(RCGL). An individual holding a RCGL is allowed to use limited amounts <strong>of</strong> specifiedcommercial gear to catch seafood for personal consumption or recreational purposes.The holder <strong>of</strong> this license cannot sell the catch <strong>and</strong> the catch must stay within therecreational size <strong>and</strong> creel limits. This license is not transferable <strong>and</strong> expires one yearfrom the date <strong>of</strong> purchase. In 2002/2003, there were 6,213 RCGL holders. In certaindesignated joint <strong>and</strong> coastal waters, a daily creel limit <strong>of</strong> striped bass may be harvestedwith gill nets by persons holding a RCGL issued by DMF. Holders <strong>of</strong> the RCGL mustadhere to the daily recreational creel limits <strong>and</strong> minimum size limits for striped bass. Inthe ASMA, RCGL holders are also restricted to harvest days during the open season.88
During 2002, a total <strong>of</strong> 8,945 lbs. (1,925 fish) <strong>of</strong> striped bass was harvested by RCGLholders in the state. An estimated 3,188 striped bass were discarded by RCGL holdersfor the entire state. The Northern District accounted for 5,315 lbs. <strong>of</strong> the total l<strong>and</strong>ed <strong>and</strong>the Pamlico District the remaining poundage (<strong>NC</strong>DMF 2003).7.4.2 Roanoke RiverUsing a combination <strong>of</strong> observer tallies <strong>and</strong> angler post card surveys, Hassler et al.(1981) estimated numbers <strong>of</strong> striped bass caught on hook <strong>and</strong> line in the Weldon area<strong>of</strong> Roanoke River from 1959 through 1980 <strong>and</strong> in the entire length <strong>of</strong> the river from 1970through 1980. Catch (<strong>and</strong> presumably harvest) in the Weldon area survey ranged from3,174 striped bass in 1963 to 37,446 in 1971. In the survey <strong>of</strong> the entire Roanoke River,estimates <strong>of</strong> striped bass catch were lowest in 1980 (15,239) <strong>and</strong> highest in 1971(65,399). Based upon angler reports, Hassler et al. (1981) also estimated numbers <strong>of</strong>striped bass caught by drift bow nets <strong>and</strong> fight bow nets for the period 1961 through1980. Striped bass catches by drift bow net fishermen ranged from 69 fish in 1968 to8,655 in 1964. Fight bow net catches ranged from 1,051 striped bass in 1978 to 10,393in 1969.In 1988, WRC began monitoring striped bass harvest in the Roanoke River with creelsurveys during spring months. The area surveyed, later to be designated the RoanokeRiver Striped Bass <strong>Management</strong> Area (RRMA) included Roanoke River from RoanokeRapids Lake dam, downstream to Albemarle Sound, <strong>and</strong> the Middle, Eastmost, <strong>and</strong>Cashie rivers. As the agencies recognized that significant harvest restrictions would benecessary to rebuild the A/R stock, WRC first closed recreational springtime stripedbass harvest in Roanoke River with emergency rules on May 10, 1990. <strong>Management</strong> <strong>of</strong>striped bass harvest by TAC began in both the RRMA <strong>and</strong> ASMA in 1991 <strong>and</strong> WRCclosed the RRMA by emergency rules on May 1, 1991. From 1991 until 2002, WRCopened <strong>and</strong> closed the spring striped bass harvest season in the RRMA byproclamation authority <strong>of</strong> the Executive Director. Season closures were based uponweekly estimates <strong>of</strong> striped bass harvest as compared to the TAC <strong>of</strong> striped bassallocated to the RRMA. Because <strong>of</strong> high angling pressure, WRC, in 1994, began limitingstriped bass harvest to three days per week during the spring season. After recovery <strong>of</strong>the stock in 1997, substantial increases in the TAC were implemented <strong>and</strong> WRCincreased the number <strong>of</strong> days per week in which striped bass could be possessed fromthree to four. In 2002, after another increase in the TAC, WRC decreased the daily creellimit for striped bass from three to two, but set a 46 day season in the lower river (March1 though April 15) <strong>and</strong> a 46 day season in the upper river (March 15 through April 30),<strong>and</strong> allowed striped bass to be possessed seven days per week. From the period <strong>of</strong>1988 through 2002, estimates <strong>of</strong> striped bass harvest in the RRMA ranged from 7,471fish in 1995 to 38,206 in 2000 (Table 7.3). The number <strong>of</strong> days open to harvest, anglereffort, number <strong>and</strong> weight <strong>of</strong> striped bass harvested are directly related to the harvestmanagement regime for that year.7.4.3 Albemarle SoundRecreational striped bass harvest in Albemarle Sound <strong>and</strong> tributaries as well as Croatan<strong>and</strong> Roanoke sounds was monitored by Hassler et al. (1981) from 1967 through 1973.89
Table 7.3. Estimates <strong>of</strong> striped bass angling effort, harvest, <strong>and</strong> numbers caught <strong>and</strong> released from the Roanoke River Striped Bass <strong>Management</strong> Area, 1988-2002.Number <strong>of</strong> DaysOpenTo HarvestHarvestSeason Effort(angler hours)Pounds <strong>of</strong>Allowable HarvestPounds Overthe AllowableHarvest*Number Caught &Released DuringHarvest SeasonNumber Caught<strong>and</strong>Released AfterHarvest Season*Number PoundsYearHarvested Harvested1988 - a 99,981 16,657 74,809 - 8,898 no estimate1989 - b 46,566 8,753 32,180 - 8,666 no estimate1990 - c 56,169 15,694 42,210 - 52,372 no estimate1991 120 74,596 26,934 72,529 29,400 98,148 no estimate1992 109 49,277 13,372 36,016 29,400 23,710 no estimate1993 84 52,932 14,325 45,145 29,400 10566 46,2251994 23 44,693 8,284 28,089 29,400 3,826 no estimate1995 17 56,456 7,471 28,883 29,400 6,892 52,6981996 11 46,164 8,367 28,178 29,400 15,230 148,2221997 8 23,139 9,364 29,997 29,400 597 10,748 271,3281998 21 72,410 23,109 73,541 62,700 10,841 87,679 102,2991999 21 72,717 22,479 72,979 68,970 4,009 50,161 113,3942000 28 95,622 38,206 120,113 112,500 7,613 93,148 no estimate2001 61 100,119 35,231 112,823 112,500 323 71,003 no estimate2002 61 122,584 36,422 112,698 112,500 198 55,775 no estimateano defined season opening or closure dates- estimates based on period surveyed: March 28-June 19, 1988bno defined season opening or closure dates- estimates based on period surveyed: March 27-June 18, 1989cno defined season opening date, first year with season closure date- estimates based on period surveyed: March 26-May 9, 1990* <strong>NC</strong> Striped Bass FMP effective 1994, overages in TAC were to be adjusted from the next year’s TAC.90
Estimates <strong>of</strong> striped bass harvest were based upon records <strong>of</strong> marina or l<strong>and</strong>ingowners, angler interviews, <strong>and</strong> angler post card surveys. Striped bass catch wasestimated to be 67,172 in 1967 with a peak catch <strong>of</strong> 96,170 in 1970, <strong>and</strong> a low catch <strong>of</strong>30,783 fish in 1973. Mullis <strong>and</strong> Guier (1982) used a non-uniform probability,roving/access creel survey to estimate recreational striped bass harvest <strong>and</strong> effort inAlbemarle, Roanoke, <strong>and</strong> Croatan sounds as well as tributary rivers (excludingRoanoke River) from 1977 through 1980. An average <strong>of</strong> 118,340 angler hours (54,914party hours) was exerted each year <strong>of</strong> the study specifically for striped bass. Estimatedstriped bass harvest was 33,202 fish (71,871 lb.) in 1977, 16,599 fish (30,915 lb.) in1978, <strong>and</strong> 5,235 fish (12,553 lb.) in 1979.In 1991, DMF began monitoring the recreational harvest <strong>of</strong> striped bass in theAlbemarle Sound <strong>and</strong> it’s tributaries, excluding the Roanoke, Middle, Eastmost, <strong>and</strong>Cashie Rivers. In 1994, the survey was exp<strong>and</strong>ed to cover the Currituck, Croatan, <strong>and</strong>Roanoke Sounds to fully encompass the ASMA. Beginning on November 26, 1989,DMF opened <strong>and</strong> closed the spring <strong>and</strong> fall striped bass harvest seasons in the ASMAby proclamation authority <strong>of</strong> the Fisheries Director. <strong>Management</strong> <strong>of</strong> striped bass harvestthrough a TAC began in the ASMA on January 1, 1991. Season closures were basedupon weekly estimates <strong>of</strong> striped bass harvest as compared to the TAC <strong>of</strong> striped bassallocated to the management area. Because <strong>of</strong> high angling pressure, DMF, in 1994,began limiting striped bass harvest to three days per week. In an effort to extend thenumber <strong>of</strong> fishing days, from 1995 through 1997, the daily creel limit for the fall seasonwas reduced from three to two fish per person <strong>and</strong> the minimum size limit wasincreased to 21 inches. After 1997, the daily creel limit was reduced to two fish perperson for both the spring <strong>and</strong> fall season, with a minimum size limit <strong>of</strong> 18 inches. In2000, increases in the TAC allowed the number <strong>of</strong> fishing (possession) days to beincreased from three to four per week. From the period <strong>of</strong> 1991 through 2002, estimates<strong>of</strong> striped bass harvest in the ASMA ranged from 6,901 in 1997 to 40,127 in 2001(Table 7.4). The number <strong>of</strong> days open to harvest, angler effort, number <strong>and</strong> weight <strong>of</strong>striped bass harvested are directly related to the harvest management regime for thatyear.7.4.4 Tar RiverRecreational anglers in the upper reaches <strong>of</strong> Tar River pursue striped bass duringspring months <strong>and</strong> in the lower reaches into Pamlico River year-round. Anecdotalobservations indicate a year-round fishery for striped bass occurs around bridges nearWashington, N.C. No surveys have been conducted to estimate striped bass anglingeffort or harvest, however, WRC will begin a 12-month creel survey on the Tar/Pamlicoin July 2004.7.4.5 Neuse RiverLittle information exists on the status <strong>of</strong> the recreational striped bass fisheries in NeuseRiver. Borawa (1983) surveyed a limited area (Pitch Kettle Creek downstream to theHighway 17 bridge at New Bern) <strong>of</strong> the Neuse River in 1981 <strong>and</strong> estimated only 16391
Table 7.4. Estimates <strong>of</strong> striped bass angling effort, harvest, <strong>and</strong> numbers caught <strong>and</strong> released from the Albemarle Sound Striped Bass <strong>Management</strong> Area, 1991-2002.HarvestSeason Effort(anglerhours)Pounds overthe AllowableHarvest*Number Caught &Released DuringHarvest SeasonNumber Caught &Released AfterHarvest Season*YearNumber <strong>of</strong> Days OpenTo HarvestNumberHarvestedPoundsHarvestedPounds <strong>of</strong>Allowable Harvest1991 143 337,830 14,395 35,344 29,400 23,540 17,9971992 150 198,976 10,542 30,758 29,400 19,981 24,8441993 77 a 161,070 11,404 36,049 29,400 7,540 5,7011994 19 b 52,397 8,591 30,217 29,400 817 971 no estimate1995 24 53,692 7,343 30,564 29,400 (28,583) 1,164 No data no estimate1996 22 35,809 7,433 29,186 29,400 (28,236) 11,865 (Fall only) no estimate1997 26 14,457 6,901 26,724 29,400 30,771 no estimate1998 46 90,820 19,566 64,761 62,700 2,061 91,888 no estimate1999 61 64,441 16,967 61,447 68,970 (66,909) 40,321 no estimate2000 99 100,426 38,085 116,414 112,500 3,914 78,941 no estimate2001 77 109,687 40,127 118,644 112,500 (108,586) 6,144 61,417 no estimate2002 84 97,480 27,896 92,650 112,500 (106,356) 51,555asurvey conducted from January – June 1993.b1994 <strong>and</strong> after- survey conducted only during the open harvest season.* <strong>NC</strong> Striped Bass FMP effective 1994, overages in TAC were adjusted for the next year’s TAC.currently notavailable92
angler hours exerted for striped bass with a harvest <strong>of</strong> 29 fish. The WRC conducted acreel survey on Neuse River from July 2002 through June 2003. The survey wasconducted from Smithfield downstream to New Bern on the Neuse River <strong>and</strong> fromTrenton to New Bern on the Trent River. The total striped bass harvest (preliminary) forthe year was estimated to be 9,677 fish <strong>and</strong> the total catch was 15,061 fish. The totaleffort for striped bass was 53,959 angler hours.7.4.6 Pamlico SoundAlthough estimates <strong>of</strong> striped bass harvest specifically from Pamlico Sound are notavailable, WRC <strong>and</strong> DMF personnel believe it to be substantial, especially in northernPamlico Sound. DMF, in cooperation with National Marine Fisheries Service, estimatesrecreational harvest <strong>of</strong> fish in ocean <strong>and</strong> estuarine areas <strong>of</strong> North Carolina through theMarine Recreational Fisheries Statistics Survey (MRFSS). The MRFSS estimatescategorize catch estimates as having come from <strong>of</strong>fshore, nearshore, or from insidewaters. In North Carolina, inside estuarine waters include all southern <strong>and</strong> centralsounds <strong>and</strong> extreme lower portions <strong>of</strong> coastal rivers, extending up to <strong>and</strong> includingCroatan <strong>and</strong> Roanoke sounds. Striped bass harvest in Croatan <strong>and</strong> Roanoke sounds istherefore included in both the ASMA creel survey <strong>and</strong> the MRFSS estimates, so there isno valid method to attribute harvest in this area to Pamlico Sound.7.4.7 Cape Fear RiverStriped bass are pursued by recreational anglers in the upper reaches <strong>of</strong> Cape FearRiver during spring months <strong>and</strong> are caught incidentally in the lower reaches year-round.Anecdotal reports suggest that striped bass anglers commonly catch striped basshybrids. These hybrids are likely escapees from those stocked in Jordan Lake by WRC.Stocking <strong>of</strong> hybrid striped bass in Jordan Lake was terminated by WRC in 2001 whenmanagers began to plan for the recovery <strong>of</strong> the Cape Fear River striped bass stock. Nosurveys have been conducted to estimate striped bass angling effort or harvest howeverWRC began a 12-month creel survey on the Cape Fear River in July 2003.7.5 Guided Fishing for Striped BassIn 1984, a North Carolina license requirement for charter boats, headboats or guideboats (“for-hire” vessels) was initiated when North Carolina General Statute 113-152(Licensing <strong>of</strong> vessels) was amended to include “Commercial fishing operations alsoincludes taking people fishing for hire”. After much public debate <strong>and</strong> with the passage<strong>of</strong> the Fisheries Reform Act in 1997, “fishing for-hire” was eliminated from the definition<strong>of</strong> commercial fishing operations, <strong>and</strong> the license requirement for charter boats <strong>and</strong>headboats was eliminated, effective July 1, 1999 (<strong>NC</strong>DMF 2003). In designated joint<strong>and</strong> inl<strong>and</strong> waters, fishing guides (persons receiving monetary compensation for takingothers fishing) are required to purchase an annual guide’s license from WRC.Since the recovery <strong>of</strong> the A/R stock <strong>and</strong> the Atlantic Migratory Stock, striped bass hasbecome one <strong>of</strong> the major species in the guided recreational fishery. During early 2002,nearly 315 for-hire vessels were identified as operating in North Carolina’s coastalwaters, representing a 37% increase from the three prior years. Though many <strong>of</strong> thesevessels pursue a variety <strong>of</strong> species, a growing number target striped bass. In 2002, 9693
new vessels entered the for-hire fishery with 48% <strong>of</strong> these occurring in the northerncoastal area <strong>of</strong> North Carolina. This assessment <strong>of</strong> the coastal charter fleet size is mostlikely low given the difficulties in identifying these transient <strong>and</strong> mobile vessels,generally less than 25 feet in length (<strong>NC</strong>DMF 2003).Annual sales <strong>of</strong> WRC guide licenses have increased steadily from 292 in 1987 to 970 in2002. Because the WRC guide license is a combination hunting/fishing guide license, itis not possible to determine the exact proportion <strong>of</strong> the increase in license sales that isattributable to fishing guides only, but WRC wildlife management biologists believe thenumbers <strong>of</strong> hunting guides, while increasing in recent years, have not increased at therate <strong>of</strong> total guide license sales (D. Luszcz, S. Osborne, WRC, pers. comm.). It wouldbe reasonable to conclude therefore, that perhaps a majority <strong>of</strong> the increase in WRCguide license sales since 1987 may be a result <strong>of</strong> an increase in fishing guides <strong>and</strong>observations by WRC field staff indicate many guides who have historically targetedother species, now include striped bass in their seasonal itineraries.7.6 Catch <strong>and</strong> Release FishingSince the early 1990’s, conservative striped bass creel limits have been in effect duringopen harvest seasons in the ASMA <strong>and</strong> RRMA. As this striped bass population hasgrown, an extensive catch <strong>and</strong> release fishery has developed both within <strong>and</strong> outside <strong>of</strong>the harvest seasons. During open harvest seasons, many anglers catch <strong>and</strong> retain theirdaily creel limit, then continue catching <strong>and</strong> releasing striped bass with individual catchrates sometimes exceeding 100 fish per day. Anglers <strong>of</strong>ten express the opinion thatcatching <strong>and</strong> releasing large numbers <strong>of</strong> striped bass after taking the daily creel limit<strong>of</strong>fsets their desire to harvest more fish. Still, other anglers enjoy catching <strong>and</strong> releasingstriped bass regardless <strong>of</strong> whether the harvest season is open, expressing no desire tokeep any striped bass.A proportion <strong>of</strong> striped bass caught <strong>and</strong> released in the hook <strong>and</strong> line fisheries die as aresult <strong>of</strong> injuries or physiological stress. Hooking injuries that cause damage to the gillsor puncture the esophagus are <strong>of</strong>ten fatal. Striped bass that are bleeding heavily uponcapture generally die immediately (referred to as “initial mortality”) but many stripedbass that are apparently in good condition upon release die at a later time (referred toas “delayed mortality”). The physical exertion associated with being hooked, fought,dehooked, h<strong>and</strong>led, <strong>and</strong> released causes the fish’s metabolic rate to increase greatlyabove normal limits <strong>and</strong> as a result, large amounts <strong>of</strong> lactic acid are produced with themuscle tissues. Although this severe condition known as “lactic acidosis” is <strong>of</strong>ten fatal,death occurs slowly over a period <strong>of</strong> several days. Many anglers are under the falseimpression that if a striped bass caught <strong>and</strong> released swims away, then it will survivethe encounter. Section 10.2.3 Catch <strong>and</strong> Release Mortality in the Hook <strong>and</strong> LineFisheries provides a through discussion on this issue.7.7 HybridsHybrid striped bass (striped bass X white bass) have been identified in the Cape FearRiver system <strong>and</strong> the Pamlico Sound area. These populations are the result <strong>of</strong>incidental introductions.94
Hybrids have been introduced inadvertently into the Cape Fear River by stockingpractices performed in Lake Jordan by the WRC, which escaped into the river (Patrick<strong>and</strong> Moser, 2001). Stocking <strong>of</strong> hybrids in Lake Jordan occurred from 1983 until 2001,<strong>and</strong> during this period hybrid striped bass abundance in the Cape Fear River increasedfrom approximately a 25:75 (hybrid:native) ratio in 1990 to a 50:50 ratio in 2001 (Mallinet at. 2001, Patrick <strong>and</strong> Moser 2001).The occurrence <strong>of</strong> hybrid striped bass in the Pamlico Sound area is a relatively recentobservation made by DMF <strong>and</strong> commercial fishermen. The majority <strong>of</strong> the hybrids arecaptured in the Pungo River. Sources <strong>of</strong> these hybrids could be a result <strong>of</strong> escapementfrom aquaculture facilities during the floods that resulted from the hurricanes in the late1990’s.Hybrid striped bass have been documented to reproduce under hatchery conditions(Forshage et al. 1986; Harrell <strong>and</strong> Webster, 1997) <strong>and</strong> in the wild (Ware 1975; Avise<strong>and</strong> Van Den Avyle 1984; Harrell et al. 1993). However, Smith <strong>and</strong> Jenkins (1984)reported only a 10% hatching rate in the wild for hybrids.MFC regulations that apply to striped bass also apply to hybrids in coastal <strong>and</strong> jointwaters <strong>of</strong> the state. Culture <strong>and</strong> sale <strong>of</strong> hybrid striped bass conducted throughaquaculture facilities in accordance with WRC rules (15A <strong>NC</strong>AC 10H Section .0700)shall be exempt from rules <strong>of</strong> the MFC concerning striped bass.7.8 Protected SpeciesThe two predominate commercial fishing gears used for harvesting striped bass in NorthCarolina are gill nets <strong>and</strong> pound nets. In the Albemarle Sound <strong>Management</strong> Area(ASMA), striped bass are considered a “bycatch” species that cannot be targeted.Striped bass may be harvested in conjunction with other targeted species. Outside theASMA, there is no “bycatch” provision for the harvest <strong>of</strong> striped bass. However, the dailyl<strong>and</strong>ing limits are held to such a low level that limited targeting occurs for the species.Most encounters with protected species have occurred in the gill net fisheries <strong>of</strong> thecoastal North Carolina waters. Encounters with pound nets have occurred, but because<strong>of</strong> the configuration <strong>of</strong> the gear, mortality is very rare. Although there were no observedtakes <strong>of</strong> marine mammals in the <strong>NC</strong> inshore gill net fisheries for the years 1997 – 2000,six str<strong>and</strong>ings <strong>of</strong> bottlenose dolphins during the time period were attributed to <strong>Fishery</strong>Interactions- gear attached, net or line marks indicative <strong>of</strong> gill nets by the Nationalmarine Fisheries Service. None <strong>of</strong> the six str<strong>and</strong>ings occurred in areas <strong>and</strong>/or duringtime periods when striped bass fisheries are normally prosecuted with gill nets. Three <strong>of</strong>the str<strong>and</strong>ings occurred in Dare County in the months <strong>of</strong> July, August <strong>and</strong> December,two <strong>of</strong> the str<strong>and</strong>ings occurred in Carteret County, one in September <strong>and</strong> one inOctober <strong>and</strong> one str<strong>and</strong>ing occurred in Hyde County in November.There have been interactions with sea turtles in the gill net fisheries <strong>of</strong> Pamlico Sound.On December 10, 1999, the National Marine Fisheries Service (NMFS) issued an95
emergency rule closing southeastern Pamlico Sound to the use <strong>of</strong> gillnets larger thanfive inch mesh to protect endangered <strong>and</strong> threatened sea turtles. From 2000 – 2002,<strong>NC</strong>DMF working with NMFS has continued to close portions <strong>of</strong> the Pamlico Sound inthe fall to the use <strong>of</strong> large mesh gill nets. Fishing is allowed in these areas during theclosed time only after acquiring a special permit. This permit allows the use <strong>of</strong> arelatively small amount <strong>of</strong> large mesh webbing to be fishing in the area. One <strong>of</strong> thestipulations <strong>of</strong> the permit is to allow observers on-board the vessel during fishing.Observers monitor the catch <strong>of</strong> these gillnets <strong>and</strong> when a certain number <strong>of</strong> sea turtleinteractions occur (numbers differ per species) all gill nets are removed from the area.Documented reports <strong>of</strong> the shortnose sturgeon in North Carolina are limited to twoareas; western Albemarle Sound (1881 <strong>and</strong> 1998) <strong>and</strong> the Cape Fear River (1987).Interactions <strong>of</strong> shortnose <strong>and</strong> Atlantic sturgeons in the <strong>NC</strong>DMF Independent Gill NetSurvey shows a very low mortality rate with fish captured in the survey gear.PROTECTED SPECIES LIST:BIRDS:Bald eagle (Haliaeetus leucocephalus)Roseate tern (Sterna dougallii dougallii)Piping plover (Charadrius melodus)MAMMALS:West Indian manatee (Trichechus manatus)FISH:Shortnose sturgeon (Acipenser brevirostrum)Carolina Madtom (Noturus furiosus)REPTILES:Kemp’s ridley sea turtle (Lepidochelys kempii),Hawksbill sea turtle (Eretmochelys imbricata)Leatherback sea turtle (Dermochelys coriacea)Green sea turtle (Chelonia mydas)Loggerhead sea turtle (Caretta caretta)8.0 DESCRIPTION OF THE SOCIOECONOMIC CHARACTERISTICS OF THEFISHERY8.1 DefinitionsCommercial Fishing – Fishing in which fish harvested, either in whole or in part, areintended to enter commerce or enter commerce through sale, barter or trade. In NorthCarolina, a commercial fisherman is required to have a license issued by the NorthCarolina Division <strong>of</strong> Marine Fisheries ( DMF) <strong>and</strong> is allowed only to sell to a licenseddealer. (Definition applies only after 1999.)96
Confidential data - Direct or indirect identity <strong>of</strong> a fisherman <strong>and</strong>/or dealer (i.e., licensee)is considered confidential according to G.S. 113-170.3. Long-st<strong>and</strong>ing DMF policy(st<strong>and</strong>ard supported by all Atlantic coast fisheries agencies) identifies confidential dataas data derived from fewer than three fishermen or dealers (termed the ‘Rule <strong>of</strong> Three’).Confidential data can only be released in a summarized format that does not allow theuser to track l<strong>and</strong>ings or purchases to any individual unless by direct court order.Ex-vessel price <strong>and</strong> value - The total l<strong>and</strong>ed dollar amount <strong>of</strong> a given species (orspecies l<strong>and</strong>ing condition <strong>and</strong> market category). Example: 100 lbs. <strong>of</strong> striped bass at aPRICE <strong>of</strong> $1.50 per pound will have a VALUE <strong>of</strong> $150.Fishing Trip – A period <strong>of</strong> time over which fishing occurs. The time spent fishingincludes configuring, deploying, <strong>and</strong> retrieving gear, clearing animals from the gear, <strong>and</strong>storing, releasing or discarding catch. When watercraft are used, a fishing trip alsoincludes the time spent traveling to <strong>and</strong> from fishing areas or locales <strong>and</strong> ends when thevessel <strong>of</strong>floads product at sea or returns to the shore. When fishing from shore or manmadestructures, a fishing trip may include travel between different fishing sites within a24-hour period.Inflation-adjusted values – Inflation is overall general upward price movement <strong>of</strong> goods<strong>and</strong> services in an economy, usually as measured by the Consumer Price Index (CPI).Ex-vessel prices <strong>and</strong> values can be adjusted according to the CPI to remove the effects<strong>of</strong> inflation so that the value <strong>of</strong> a dollar remains the same across years. Inflationadjusted values allow for easier underst<strong>and</strong>ing <strong>and</strong> analysis <strong>of</strong> changes in values.Recreational Fishing - Any trip for the purpose <strong>of</strong> recreation from which none <strong>of</strong> thecatch is sold or bartered. This includes trips with effort but no catch. A license isrequired for those who fish in waters controlled by the North Carolina Wildlife ResourcesCommission. Anglers who wish to use limited amounts <strong>of</strong> commercial fishing gear incoastal waters under the jurisdiction <strong>of</strong> the <strong>NC</strong> DMF are required to have a license.8.2 Commercial Fishing8.2.1 Ex-vessel Value <strong>and</strong> PriceIn 1972, <strong>NC</strong>DMF began collecting commercial value statistics. The trip ticket programbegan in 1994 <strong>and</strong> it was m<strong>and</strong>ated that all commercial l<strong>and</strong>ings be reported to DMF.Reporting the value <strong>of</strong> the l<strong>and</strong>ing continues to remain optional; however, the values <strong>of</strong>l<strong>and</strong>ings are reliable estimates. Considering that there is nearly thirty years <strong>of</strong> data tocompare, it is useful not only to report the actual dollars paid for the seafood, but also totie the value <strong>of</strong> annual l<strong>and</strong>ings back to an established baseline to control for the effects<strong>of</strong> inflation. In this way changes in l<strong>and</strong>ings values since 1972 can be more clearlyunderstood.Albemarle Sound <strong>Management</strong> Area (ASMA). From 1972 to 1978 there was a generaltrend for increased l<strong>and</strong>ings value from the ASMA as shown in Figure 8.1 that areassociated with increases in l<strong>and</strong>ings. From 1978 on the overall trend is towardsdecreasing value. As is typical, the inflation adjusted figures show less volatility,97
$120,000$100,000Annual ValueValue in 1972$$80,000$60,000$40,000$20,000$01972197419761978198019821984198619881990199219941996199820002002Figure 8.1.Value <strong>of</strong> ASMA striped bass l<strong>and</strong>ings, 1972 – 2002 (<strong>NC</strong>DMF TripTicket Program).nonetheless, the 1978 high <strong>of</strong> $272,335 (inflation adjusted) is eight to nine times greaterthan the lows <strong>of</strong> approximately $30,000 - $40,000 from 1988 through 1998. In 1999 <strong>and</strong>2002 the value <strong>of</strong> the l<strong>and</strong>ings increased, but were still lower than the pre-1988 values.Much <strong>of</strong> this reduction in value is due to the lower total allowable catch from theseyears.Central/Southern <strong>Management</strong> Areas. Striped bass l<strong>and</strong>ings from the CSMA waterstend to be much lower than from the ASMA <strong>and</strong> more erratic. Consequently, the value<strong>of</strong> l<strong>and</strong>ings is also lower (Figure 8.2). Controlling for inflation, 1980 saw l<strong>and</strong>ings withthe highest value ($41,358). Since then, in only two years (1987 <strong>and</strong> 1993) have annuall<strong>and</strong>ings from these waters been greater than $15,000.Ocean. While some years were better than others, the overall trend in striped bassl<strong>and</strong>ings from the ocean decreased from a high <strong>of</strong> $367,671 (adjusted for inflation) in1973 to a low <strong>of</strong> $17,529 in 1984 (Figure 8.3). From 1985 through 1989 the ocean wasclosed to harvesting <strong>of</strong> striped bass as m<strong>and</strong>ated by the ASMFC Interstate FMP.L<strong>and</strong>ings <strong>of</strong> striped bass from the ocean began to increase significantly in 1993, butdropped <strong>of</strong>f sharply in 1996 due to changes in the total allowable catch. L<strong>and</strong>ingsvalues have increased somewhat in recent years, but they have not recovered to a levelmuch higher than the 1976 inflation-adjusted values.Figure 8.4 shows the 1972 inflation-adjusted values <strong>of</strong> the l<strong>and</strong>ings for all water bodiescombined for each year from 1972 through 2002. As can be seen, the vast majority <strong>of</strong>l<strong>and</strong>ings for any given year can be accounted for in the l<strong>and</strong>ings from the ASMA or from98
$120,000$100,000Annual ValueValue in 1972$$80,000$60,000$40,000$20,000$01972197419761978198019821984198619881990199219941996199820002002Figure 8.2. Value <strong>of</strong> Central/Southern waters striped bass l<strong>and</strong>ings, 1972 – 2002(<strong>NC</strong>DMF Trip Ticket Program).$600,000$500,000Annual ValueValue in 1972$$400,000$300,000$200,000$100,000$01972197419761978198019821984198619881990199219941996199820002002Figure 8.3.Value <strong>of</strong> ocean striped bass l<strong>and</strong>ings, 1972 – 2002 (<strong>NC</strong>DMF TripTicket Program).99
$600,000$500,000$400,000OceanCentral/SouthernASMA$300,000$200,000$100,000$01972197419761978198019821984198619881990199219941996199820002002Figure 8.4.Total value <strong>of</strong> striped bass l<strong>and</strong>ed by water body (adjusted forinflation), 1972 – 2002 (<strong>NC</strong>DMF Trip Ticket Program).the ocean, except for the years 1984 through 1992 when ocean harvesting was closedor extremely limited.As shown in Figure 8.5, the total number <strong>of</strong> pounds l<strong>and</strong>ed diminished steadily from ahigh <strong>of</strong> 1.75 million pounds in 1973 to a low <strong>of</strong> just over 100,000 pounds in 1989. Much<strong>of</strong> the decrease in harvest can be attributed to moratoria <strong>and</strong> changes in the totalallowable catch in the different water bodies during this period. The average number <strong>of</strong>pounds has been increasing since the early 1990’s with 1997 <strong>and</strong> 1999 showing thelargest annual l<strong>and</strong>ings <strong>of</strong> approximately 600,000 pounds each.In the early 1970’s the largest portion <strong>of</strong> striped bass were caught in the ocean. By themid-1970’s the majority <strong>of</strong> l<strong>and</strong>ings were coming from the ASMA. From the mid-1980’sto the early 1990’s l<strong>and</strong>ings from the ocean were extremely limited or nonexistent due toclosures or limited fishing opportunities. From the mid-1990’s on, with the exception <strong>of</strong>1996 <strong>and</strong> 2000, ocean l<strong>and</strong>ings accounted for at least 50% <strong>of</strong> the total annual l<strong>and</strong>ings.The average price per pound paid to the fisherman tends not to vary much at any giventime period for fish caught in the ASMA or in the CSMA (Figures 8.6 <strong>and</strong> 8.7). Price perpound in these waters increased steadily from $0.28 in 1972 to a high <strong>of</strong> $1.45 in 1992.The general trend has been towards decreasing price per pound since 1992. Whencontrolling for inflation, the price per pound reached a high <strong>of</strong> about $.58 in 1983 <strong>and</strong>has been declining gradually since then. The price per pound <strong>of</strong> striped bass l<strong>and</strong>ed100
2,000,0001,800,0001,600,0001,400,0001,200,0001,000,000800,000600,000400,000200,000019721974OceanCentral/SouthernASMA1976197819801982198419861988199019921994199619982000Figure 8.5. Number <strong>of</strong> pounds <strong>of</strong> striped bass l<strong>and</strong>ed by water body, 1972 –2002 (<strong>NC</strong>DMF Trip Ticket Program).$1.60$1.40$1.20$1.00$0.80$0.60$0.40$0.20$0.00Price Per PoundPrice in 1972$20021972197419761978198019821984198619881990199219941996199820002002Figure 8.6. Price per pound by year for striped bass caught in ASMA, 1972 –2002 (<strong>NC</strong>DMF Trip Ticket Program).101
$1.60$1.40$1.20Price Per PoundPrice in 1972$$1.00$0.80$0.60$0.40$0.20$0.001972197419761978198019821984198619881990199219941996199820002002Figure 8.7.Price per pound by year for striped bass caught in Central/Southernwaters, 1972 – 2002 (<strong>NC</strong>DMF Trip Ticket Program).from the ocean was more volatile from 1972 to 1987 (Figure 8.8), from a low <strong>of</strong> $.28 perpound in 1972 to a high <strong>of</strong> $3 per pound in 1984. Since 1992, there has been a gradualdecline in the price per pound <strong>of</strong> striped bass l<strong>and</strong>ed from the ocean where it currentlyis about $1.20 per pound.Table 8.1 shows the number <strong>of</strong> participants in the fishery by year, major water body <strong>and</strong>the value <strong>of</strong> their annual l<strong>and</strong>ings from 1994 – 2002. In those years, the ASMAaveraged approximately 407 fishermen reporting l<strong>and</strong>ings <strong>of</strong> striped bass. Of those,52% had annual l<strong>and</strong>ings with values less than $200. In the Central/Southern regions,there is an average <strong>of</strong> 207 fishermen reporting l<strong>and</strong>ings in a given year. Seventy-fivepercent reported annual l<strong>and</strong>ings valued less than $200.8.2.2 Gear <strong>and</strong> PriceFrom 1972 – 2002, 59% <strong>of</strong> all striped bass were caught using gill nets (84% floating gillnets, 15% sink gill nets, remaining 1% drift <strong>and</strong> runaround gill nets). An additional 22%were caught using beach seines <strong>and</strong> 4% in pound nets. The remaining 5% were caughtas bycatch using other gears such as haul seines, other kinds <strong>of</strong> nets, pots, or trolling.Table 8.2 shows by year from 1994 – 2002 the number <strong>of</strong> trips made by each <strong>of</strong> thegears listed in Figure 8.9. The table also shows the number <strong>of</strong> pounds l<strong>and</strong>ed, the totalvalue <strong>and</strong> the price per pound. In each case it can be seen that flounder trawls <strong>and</strong>beach seines have a much greater CPUE than do gill nets, yet 88% <strong>of</strong> all trips that102
$3.50$3.00Price per PoundPrice in 1972 $$2.50$2.00$1.50$1.00$0.50$0.001972197419761978198019821984198619881990199219941996199820002002Figure 8.8.Price per pound by year for striped bass caught in the ocean,1972 (courtesy <strong>of</strong> the <strong>NC</strong>DMF Trip Ticket Program)Table 8.1Number <strong>of</strong> participants in the Striped Bass <strong>Fishery</strong> by year, waterbody, <strong>and</strong> value <strong>of</strong> annuall<strong>and</strong>ings, 1994-2002 (<strong>NC</strong>DMF Trip Ticket Program). *Confidential data, included with the precedingcategory.YearWaterbody Income Level 1994 1995 1996 1997 1998 1999 2000 2001 2002 AverageASMA $2,000 4 0 4 3 13 13 21 25 34 13Total 403 431 418 405 355 401 438 414 396 407Cent./So. $2,000 0 0 3 0 0 0 0 0 0 0103
Table 8.1 (Continued)YearWaterbody Income Level 1994 1995 1996 1997 1998 1999 2000 2001 2002 AverageTotal 123 166 197 272 258 226 235 197 193 207Ocean $2,000 19 77 18 58 48 85 24 67 99 55Total 76 254 75 230 212 223 96 267 377 201l<strong>and</strong>ed striped bass were using a gill net. Overall, there is very little difference in terms<strong>of</strong> the gear used on the average price per pound. Table 8.2 does not show inflationadjustedamounts, but as can be seen in a comparison with Figures 8.6 – 8.8, theaverage price per pound has followed a general downward trend.Tables 8.3 to 8.5 show the gears that were used to l<strong>and</strong> striped bass in the ASMA,CSMA, <strong>and</strong> ocean from 1996 – 2002. Gill nets accounted for the vast majority <strong>of</strong>l<strong>and</strong>ings in all water bodies for these years. The only other gear with significantl<strong>and</strong>ings was the use <strong>of</strong> beach seines in the ocean.8.2.3 Marketing, Distribution, <strong>and</strong> ProcessingStriped bass purchased by licensed dealers generally is sold fresh. By the time it getsto the consumer the vast majority <strong>of</strong> the fish have been processed into fillets. A few fishare sold whole, but as many <strong>of</strong> the individual fish are quite large, processing the fish int<strong>of</strong>illets is a matter <strong>of</strong> practicality as much as preference. A large percentage <strong>of</strong> thestriped bass l<strong>and</strong>ed in North Carolina are destined for markets in the Northeast orMidwest US. In the past striped bass were frequently sold to consumers labeled asother kinds <strong>of</strong> fish. In recent years there has been a change towards selling stripedbass under its own name, or simply as “rock fish”.The price <strong>of</strong> striped bass is marked up about $.25 to $.35 per pound as it is h<strong>and</strong>led byeach <strong>of</strong> the middlemen prior to arriving on the consumer’s plate. Freight chargesaverage $.10 per pound as the product moves from processor to processor. By thetime it reaches a consumer in a large market such as New York or Chicago, the priceper 8 ounce portion reaches approximately $6.00.8.2.4 Economic Impact <strong>of</strong> Commercial FishingHistorically, striped bass have provided a significant source <strong>of</strong> income for manyfishermen, primarily for fishermen in the Albemarle Sound <strong>Management</strong> Area (refer toSection 8.1.1). Ocean l<strong>and</strong>ings through the mid 1970’s were also a significant source <strong>of</strong>income. Since the mid-1990’s l<strong>and</strong>ings from the ocean, once again are providing asignificant source <strong>of</strong> income. Comparatively speaking, l<strong>and</strong>ings from Central/Southerninternal waters have not provided more than about $125,000 total income in any givenyear.104
Table 8.2.The average price per pound for striped bass (unadjusted for inflation) usingdifferent gears for the years 1994 – 2002 (<strong>NC</strong>DMF Trip Ticket Program).Beach FlounderHaul Pound All OtherGill NetSeine TrawlSeine Net GearsTotal1994 Trips 74 9 2,835 68 297 62 3,345Pounds 60,693 16,485 139,796 2,290 12,800 29,832 261,896Ave. pounds/trip 820 1,832 49 34 43 481 78Value $81,936 $22,255 $188,725 $3,091 $17,279 $40,273 $353,559Price/pound $1.35 $1.35 $1.35 $1.35 $1.35 $1.35 $1.351995 Trips 244 34 5,647 152 321 141 6,539Pounds 169,201 16,184 232,768 3,195 4,277 20,534 446,159Ave. pounds/trip 693 476 41 21 13 146 68Value $229,943 $22,867 $315,741 $4,372 $5,706 $27,899 $606,528Price/pound $1.36 $1.41 $1.36 $1.37 $1.33 $1.36 $1.361996 Trips 87 * 6,030 91 344 86 6,638Pounds 39,607 * 130,052 1,820 4,990 5,096 181,565Ave. pounds/trip 455 * 22 20 15 59 27Value $47,243 * $159,433 $2,199 $6,098 $6,211 $221,184Price/pound $1.19 * $1.23 $1.21 $1.22 $1.22 $1.221997 Trips 349 15 7,295 46 671 339 8,715Pounds 185,890 5,145 201,330 773 14,007 180,640 587,785Ave. pounds/trip 533 343 28 17 21 533 67Value $224,619 $6,377 $242,605 $921 $15,654 $220,914 $711,090Price/pound $1.21 $1.24 $1.21 $1.19 $1.12 $1.22 $1.211998 Trips 147 34 5,783 98 421 219 6,702Pounds 75,004 22,607 237,427 1,890 14,735 71,205 422,868Ave. pounds/trip 510 665 41 19 35 325 63Value $93,980 $26,725 $293,087 $2,309 $18,829 $85,110 $520,040Price/pound $1.25 $1.18 $1.23 $1.22 $1.28 $1.20 $1.231999 Trips 98 0 8,276 114 462 148 9,098Pounds 61,774 0 509,465 2,100 12,820 2,153 588,312Ave. pounds/trip 630 0 62 18 28 15 65Value $76,394 $0 $627,337 $2,590 $15,866 $2,657 $724,844Price/pound $1.24 $0.00 $1.23 $1.23 $1.24 $1.23 $1.232000 Trips 102 62 10,603 21 677 274 11,739Pounds 58,147 46,169 226,243 369 17,590 58,987 407,505Ave. pounds/trip 570 745 21 18 26 215 35Value $67,177 $52,849 $261,363 $417 $20,627 $68,901 $471,334Price/pound $1.16 $1.14 $1.16 $1.13 $1.17 $1.17 $1.162001 Trips 184 41 10,986 * 504 381 12,096Pounds 93,580 37,301 348,415 * 12,761 134,539 626,596Ave. pounds/trip 509 910 32 * 25 353 52Value $120,037 $43,638 $429,355 * $15,753 $163,121 $771,904Price/pound $1.28 $1.17 $1.23 * $1.23 $1.21 $1.232002 Trips 332 35 9,751 67 845 261 11,291Pounds 237,983 36,090 341,634 8,267 19,785 57,686 701,445Ave. pounds/trip 717 1031 35 123 23 221 62Value $295,042 $43,308 $412,348 $9,896 $23,748 $70,707 $855,050Price/pound $1.24 $1.20 $1.21 $1.20 $1.20 $1.23 $1.22* Data are confidential105
70%60%59%50%40%30%20%10%0%22%BeachSeine10%FlounderTrawl1%4%4%Gill Net Haul Seine Pound Net All OthersGearsFigure 8.9. Percent <strong>of</strong> l<strong>and</strong>ings by gear used to harvest striped bass in all NorthCarolina waters, 1972 – 2002 (<strong>NC</strong>DMF Trip Ticket Program).In 1999 a self-reported survey <strong>of</strong> ASMA commercial fishermen <strong>and</strong> seafood dealers wasconducted by the DMF (Diaby, 2000). Except for those fishermen who operated vesselslonger than 38 feet, the average ASMA finfish fisherman (includes those who targetstriped bass) reported an overall loss when subtracting annual costs from income.Striped bass accounted for approximately two percent <strong>of</strong> all seafood harvested from theASMA sold by dealers.8.3 Recreational FishingAnnually, there are three survey programs in North Carolina that collect data fromrecreational striped bass anglers. Figure 8.10 shows the areas covered by thesesurveys. The Marine Recreational Fisheries Statistics Survey (MRFSS) collects datafrom the ocean l<strong>and</strong>ings <strong>of</strong> 0 – 3 mile from the coast <strong>and</strong> inside waters from part <strong>of</strong> theASMA south to the SC border. Data are also collected up into the major river systems,but not far enough to cover the entire range where striped bass are caught. The DMFconducts the ASMA Creel survey during the spring <strong>and</strong> fall seasons. There is someoverlap between the coverage areas <strong>of</strong> these two surveys. The WRC conducts surveys106
Table 8.3Striped bass l<strong>and</strong>ings <strong>and</strong> value by gears for the ASMA, 1997 – 2002 (<strong>NC</strong>DMF Trip Ticket Program).1997 1998Gear Value ($) PoundsPrice/lb.($)Value in1972 ($)Price/lb. in1972 ($) Gear Value ($) PoundsPrice/lb.($)Value in1972 ($)Price/lb. in1972 ($)Crab pot 660 549 1.20 171.94 0.31 Crab pot 255.18 216 1.18 65.44 0.30Fyke net 495 440 1.12 128.85 0.29 Fyke net 628.35 517 1.22 161.14 0.31Gill net (runaround) 249 201 1.24 64.76 0.32 Gill net (runaround) 1,610.23 1,363 1.18 412.93 0.30Gill net set (float) 27,909 23,473 1.19 7,268.61 0.31 Gill net set (float) 27,121.50 21,928 1.24 6,955.04 0.32Gill net set (sink) 66,604 57,172 1.16 17,346.24 0.30 Gill net set (sink) 107,858.35 83,502 1.29 27,659.20 0.33Haul seine 544 469 1.16 141.77 0.30 Haul seine 2,309.26 1,890 1.22 592.19 0.31Pound net 14,851 13,359 1.11 3,867.78 0.29 Pound net 18,139.21 14,151 1.28 4,651.62 0.33Unknown & Conf. 535 459 1.17 139.46 0.30 Unknown & Conf. 454.21 360 1.26 116.48 0.32Total or Average* 111,311 95,663 1.16 29,129.41 0.30 Total or Average* 157,922.07 123,567 1.28 40,614.01 0.331999 2000Gear Value ($) PoundsPrice/lb.($)Value in1972 ($)Price/lb. in1972 ($) Gear Value ($) PoundsPrice/lb.($)Value in1972 ($)Price/lb. in1972 ($)Crab pot 180.85 147 1.23 45.37 0.31 Crab pot 401.32 352 1.14 97.42 0.28Fyke net 873.07 705 1.24 219.05 0.31 Fyke net 1,588.70 1,343 1.18 385.64 0.29Gill net set (float) 52,868.54 42,870 1.23 13,264.72 0.31 Gill net (runaround) 372.94 328 1.14 90.53 0.28Gill net set (sink) 128,295.40 103,916 1.23 32,189.32 0.31 Gill net set (float) 29,816.18 25,929 1.15 7,237.58 0.28Haul seine 2,539.87 2,059 1.23 637.25 0.31 Gill net set (sink) 194,531.58 167,758 1.16 47,220.60 0.28Pound net 15,857.75 12,813 1.24 3,978.71 0.31 Pound net 20,588.09 17,520 1.18 4,997.55 0.29Unknown & Conf. 452.23 365 1.24 113.46 0.31 Unknown & Conf. 909.90 799 1.14 220.87 0.28Total or Average* 200,615.48 162,510 1.23 50,447.89 0.31 Total or Average* 247,298.80 213,230 1.16 60,250.18 0.282001 2002Gear Value ($) PoundsPrice/lb.($)Value in1972 ($)Price/lb. in1972 ($) Gear Value ($) PoundsPrice/lb.($)Value in1972 ($)Price/lb. in1972 ($)Crab Pot 675 530 1.27 159.31 0.30 Crab Pot 139 127 1.09 32.26 0.25Fyke Net 3,258 2,648 1.23 768.84 0.29 Fyke Net 1,659 1,459 1.14 385.46 0.26Gill Net (Runaround) 1,289 1,107 1.16 304.15 0.27 Gill Net (Runaround) 869 728 1.19 201.96 0.28Gill Net Set (Float) 39,504 31,179 1.27 9,322.98 0.30 Gill Net Set (Float) 17,055 14,201 1.20 3,963.52 0.28Gill Net Set (Sink) 211,698 171,420 1.23 49,960.68 0.29 Gill Net Set (Sink) 222,172 184,101 1.21 51,632.69 0.28Pound Net 15,270 12,341 1.24 3,603.68 0.29 Pound Net 22,993 19,156 1.20 5,343.67 0.28Unknown or Conf. 1,296 1,009 1.28 305.75 0.30 Other 3,768 3,070 1.23 875.61 0.29Total or Average 272,989 220,234 1.24 64,425.40 0.29 Total or Average 268,654 222,842 1.21 62,435.18 0.28107
Table 8.4Striped bass l<strong>and</strong>ings <strong>and</strong> value by gears for central/southern, 1997 – 2002 (<strong>NC</strong>DMF Trip Ticket Program.GearValue ($) Pounds1997 1998Price/lb.Price/lb. Value in in 1972Value in($) 1972 ($) ($) Gear Value ($) Pounds Price/lb. ($) 1972 ($)Price/lb. in1972 ($)Crab pot 303 245 1.24 78.93 0.32 Crab pot 405 343 1.18 103.76 0.30Crab Trawl 58 47 1.24 15.17 0.32 Crab Trawl 72 61 1.18 18.48 0.30Gill net (drift) 127 103 1.23 32.95 0.32 Gill net (drift) 94 80 1.18 24.08 0.30Gill net (runaround) 1,362 1,099 1.24 354.69 0.32 Gill net (runaround) 153 130 1.18 39.23 0.30Gill net set (float) 13,855 11,273 1.23 3,608.41 0.32 Gill net set (float) 14,021 11,848 1.18 3,595.43 0.30Gill net set (sink) 17,824 14,792 1.20 4,642.16 0.31 Gill net set (sink) 15,389 12,929 1.19 3,946.39 0.31Haul seine 377 304 1.24 98.14 0.32 Pound net 690 584 1.18 176.93 0.30Pound net 803 648 1.24 209.18 0.32 Total or Average* 30,823 25,973 1.19 7,904.30 0.30Rod-n-Reel 9 7 1.24 2.32 0.32Swipe Net 3 3 1.24 0.81 0.32Unknown & Conf. 389 314 1.24 101.27 0.32Total or Average* 35,110 28,834 1.22 9,144.02 0.32GearValue ($) Pounds1999 2000Price/lb.Price/lb. Value in in 1972Value in($) 1972 ($) ($) Gear Value ($) Pounds Price/lb. ($) 1972 ($)Price/lb. in1972 ($)Crab pot 832 677 1.23 208.73 0.31 Crab pot 974 854 1.14 236.38 0.28Gill net (drift) 18 15 1.23 4.63 0.31 Flynet 864 758 1.14 209.81 0.28Gill net (runaround) 267 217 1.23 66.98 0.31 Gill net (drift) 64 56 1.14 15.59 0.28Gill net set (float) 17,524 14,241 1.23 4,396.78 0.31 Gill net (runaround) 176 148 1.20 42.80 0.29Gill net set (sink) 22,727 18,464 1.23 5,702.27 0.31 Gill net set (float) 19,029 16,617 1.15 4,619.10 0.28Haul seine 50 41 1.23 12.65 0.31 Gill net set (sink) 15,410 13,336 1.16 3,740.61 0.28Pound net 9 7 1.23 2.16 0.31 Pound net 79 70 1.13 19.26 0.28Rod-n-Reel 310 252 1.23 77.87 0.31 Unknown & Conf. 1,008 884 1.14 244.66 0.28Swipe Net 50 41 1.23 12.65 0.31 Total or Average* $37,605 32,723 1.15 9,128.22 0.28Unknown & Conf. 438 356 1.23 109.96 0.31Total or Average* 42,227 34,311 1.23 10,594.68 0.31108
Table 8.4 (Continued)GearValue ($) Pounds2001 2002Price/lb.Price/lb. Value in in 1972($) 1972 ($) ($) Gear Value ($) Pounds Price/lb. ($)Value in1972 ($)Price/lb.in 1972($)Crab Pot 484 389 1.25 114.30 0.29 Gill net (runaround) 5,884 4,904 1.20 1,367.54 0.28Gill net (runaround) 309 269 1.15 73.01 0.27 Gill net set (float) 22,896 19,104 1.20 5,321.09 0.28Gill net set (float) 16,138 13,509 1.19 3,808.55 0.28 Gill net set (sink) 11,123 9,289 1.20 2,584.94 0.28Table 8.4 (Continued)GearValue ($) Pounds1997 1998Price/lb.Price/lb. Value in in 1972Value in($) 1972 ($) ($) Gear Value ($) Pounds Price/lb. ($) 1972 ($)Price/lb. in1972 ($)Gill net set (sink) 13,117 10,265 1.28 3,095.52 0.30 Pound net 755 629 1.20 175.42 0.28Pound net 483 420 1.15 113.99 0.27 Other 4,388 3,660 1.20 1,019.75 0.28Other 89 65 1.38 21.10 0.32 Total or Average* 45,046 37,586 1.20 10,468.73 0.28Table 8.5. Striped bass l<strong>and</strong>ings <strong>and</strong> value by gears for the ocean, 1996-2002 (<strong>NC</strong>DMF Trip Ticket Program).1997 1998Gear Value ($) PoundsPrice/lb.$)Value in1972 ($)Price/lb.in 1972($) Gear Value ($) PoundsPrice/lb.($)Value in1972 ($)Price/lb. in1972 ($)Beach seine 224,619 185,890 1.21 58,499.73 0.31 Beach seine 93,980 75,004 1.25 24,100.21 0.32Flounder trawl 6,377 5,145 1.24 1,660.88 0.32 Flounder trawl 26,725 22,607 1.18 6,853.30 0.30Flynet 217,773 178,024 1.22 56,716.86 0.32 Flynet 83,210 69,637 1.19 21,338.39 0.31Gill net set (sink) 114,344 92,948 1.23 29,779.83 0.32 Gill net set (sink) 126,540 105,395 1.20 32,449.91 0.31Unknown & Conf. 1,409 1,137 $1.24 $367 $0.32 Unknown & Conf. 385 326 1.18 98.76 0.30Total or Average* 564,523 463,144 $1.22 $147,024 $0.32 Total or Average* 330,840 272,969 1.21 84,840.58 0.31109
Table 8.5. (Continued)Gear Value ($) PoundsGear Value ($) PoundsPrice/lb.$)Value in1972 ($)Price/lb.in 1972($) Gear Value ($) PoundsPrice/lb.($)1999 2000Price/lb. Value in Price/lb. inPrice/lb.($) 1972 ($) 1972 ($) Gear Value ($) Pounds ($)Value in1972 ($)Value in1972 ($)Price/lb. in1972 ($)Price/lb. in1972 ($)Beach seine 76,394 61,774 1.24 19,167.15 0.31 Beach seine 67,218 58,147 1.16 16,316.49 0.28Gill net set (sink) 405,566 329,685 1.23 101,756.55 0.31 Flounder trawl 52,867 46,169 1.15 12,832.96 0.28Unknown & Conf. 28 23 1.23 7.10 0.31 Flynet 64,647 55,240 1.17 15,692.44 0.28Total or Average* 481,988 391,482 1.23 120,930.79 0.31 Gill net set (sink) 2,366 2,072 1.14 574.38 0.28Unknown & Conf. 11 10 1.14 2.77 0.28Total or Average* 187,110 161,638 1.16 45,419.04 0.28Gear Value ($) Pounds2001 2002Price/lb. Value in Price/lb. inPrice/lb.($) 1972 ($) 1972 ($) Gear Value ($) Pounds ($)Value in1972 ($)Price/lb. in1972 ($)Beach Seine 120,037 93,580 1.28 28,328.73 0.30 Beach Seine 295,042 237,983 1.24 68,567.76 0.29Flounder Trawl 43,638 37,301 1.17 10,298.61 0.28 Flounder Trawl 43,308 36,090 1.20 10,064.78 0.28Flynet 157,319 129,898 1.21 37,127.19 0.29 Flynet 59,912 48,705 1.23 13,923.50 0.29Table 8.5 (Continued)Gear Value ($) Pounds1997 1998Price/lb.Price/lb. Value in in 1972Price/lb.$) 1972 ($) ($) Gear Value ($) Pounds ($)Value in1972 ($)Price/lb. in1972 ($)Gill Net Set (Sink) 144,193 117,965 1.22 34,029.48 0.29 Gill Net Set (Sink) 131,256 108,397 1.21 30,503.79 0.28Unknown & Conf. 3,107 2,702 1.15 733.25 0.27 Unknown & Conf. 11,831 9,843 1.20 2,749.61 0.28Total or Average* 468,293 381,446 1.23 110,517.26 0.29 Total or Average* 541,349 441,018 1.23 125,809.44 0.29110
Figure 8.10. Map <strong>of</strong> annual recreational fishing surveys conducted in NorthCarolina (<strong>NC</strong>DMF GIS Program.111
l<strong>and</strong>ings in the Roanoke River both during their spring season, aswell as catch <strong>and</strong> release out <strong>of</strong> season for striped bass, during some years.8.3.1 Historical Trends in L<strong>and</strong>ingsCreel Survey. Since 1991 the DMF has conducted a recreational creel survey in theASMA (see Table 8.6). The survey samples many fishermen throughout each season<strong>and</strong> then estimates the number <strong>of</strong> fish harvested, pounds harvested <strong>and</strong> the number <strong>of</strong>fish released.In the earlier years <strong>of</strong> the survey (pre-1994), the season length was much longer withoverall higher l<strong>and</strong>ings, but much smaller numbers <strong>of</strong> pounds harvested per day than inthe years since 1994. There appears to be a statistically significant relationship (r (18) = -0.485, p < 0.05) between the number <strong>of</strong> days in the season <strong>and</strong> the average weight <strong>of</strong>fish l<strong>and</strong>ed, with longer seasons resulting in a smaller average fish. For the years inwhich there are data, more fish were released than were harvested. It isn’t clearwhether fish were released because they were undersized, or because the fishermenhad reached their bag limit.MRFSS. The Marine Recreational Fisheries Statistics Survey (MRFSS) providescoverage <strong>of</strong> saltwater sport fishing (including estuarine <strong>and</strong> brackish water) fromprivate/rental boats, charter <strong>and</strong> head boats, manmade structures, <strong>and</strong> the shorethroughout North Carolina.MRFSS data is collected by two independent, but complementary, surveys; 1) atelephone survey <strong>of</strong> households in coastal counties, <strong>and</strong> 2) an intercept (i.e. interview)survey <strong>of</strong> anglers at fishing access sites. Catch data are obtained from anglersintercepted by creel clerks stationed at fishing access sites. In North Carolina, accesssites are recognized as any site where the likelihood <strong>of</strong> encountering marine speciesmay exist. These sites do not extend much farther inl<strong>and</strong> than the boundariesestablished for the coastal zone.Only sites located in the eastern portion <strong>of</strong> the ASMA are covered through MRFSSsampling. These sites are located at Mann's Harbor, Manteo, Wanchese, Oregon Inlet,Kill Devil Hills, Kitty Hawk, <strong>and</strong> Southern Shores. Anglers intercepted at these sites fishprimarily in Croatan, Roanoke, <strong>and</strong> Pamlico Sounds. Occasionally, anglers fishing inthe most eastern section <strong>of</strong> Albemarle Sound near Mashoes Light are also intercepted.Additionally, MRFSS does not collect l<strong>and</strong>ings for striped bass in the Tar-Pamlico,Neuse, Trent, or Cape Fear rivers where there are known to be significant l<strong>and</strong>ings.Table 8.7 shows l<strong>and</strong>ings estimates made by MRFSS for internal waters, <strong>and</strong> in theocean. Furthermore, l<strong>and</strong>ings are displayed by mode <strong>of</strong> fishing, <strong>and</strong> year.As might be expected, fish l<strong>and</strong>ed in the ocean tend to be heavier than those harvestedfrom internal waters. MRFSS collection <strong>of</strong> striped bass l<strong>and</strong>ings began in 1988 whenoverall l<strong>and</strong>ings were low. L<strong>and</strong>ings in these early years varied greatly from estimates<strong>of</strong> 264 fish in 1993 to 6,141 in 1988 <strong>and</strong> with no l<strong>and</strong>ings captured by MRFSS in 1990.112
Table 8.6.Division <strong>of</strong> Marine Fisheries ASMA striped bass creel survey, 1991 – 2003 (<strong>NC</strong>DMF).Averagenumber <strong>of</strong>fishharvestedper dayAverageweight <strong>of</strong>each fishharvestedTotalpoundsharvestedAveragenumber <strong>of</strong>poundsharvestedper dayNumber <strong>of</strong>fishreleasedAveragenumber <strong>of</strong>fishreleasedper daySeasonLength indaysFishharvested1991 Spring 120 9,978 83 2.5 24,561 205 11,701 98Fall 30 4,417 147 2.4 10,783 359 11,839 3951992 Spring 120 8,034 67 2.9 23,582 197 13,167 110Fall 30 2,508 84 2.9 7,176 239 6,814 2271993 Spring 77 11,404 148 3.2 36,049 468 13,241 172Fall 0 -- -- -- -- -- -- --1994 Spring 12 4,005 334 3.5 14,087 1,174 no data no dataFall 7 4,586 655 3.5 16,130 2,304 no data no data1995 Spring 9 4,240 471 4.1 17,355 1,928 no data no dataFall 15 3,103 207 4.3 13,209 881 no data no data1996 Spring 8 4,374 547 3.4 14,851 1,856 no data no dataFall 14 3,059 219 4.7 14,335 1,024 no data no data1997 Spring 5 4,941 988 3.5 17,315 3,463 6,111 1,222Fall 21 1,960 93 4.8 9,409 448 24,660 1,1741998 Spring 18 9,310 517 3.3 30,709 1,706 25,060 1,392Fall 28 10,256 366 3.3 34,052 1,216 66,828 2,3871999 Spring 37 10,137 274 3.6 36,970 999 32,742 885Fall 24 6,830 285 3.6 24,477 1,020 7,579 3162000 Spring 67 13,993 209 3.7 51,428 768 23,205 346Fall 32 24,092 753 2.7 64,986 2,031 55,736 1,7422001 Spring 53 17,582 332 2.7 47,448 895 16,737 316Fall 24 22,545 939 3.2 71,197 2,967 44,681 1,8622002 Spring 52 17,989 346 3.3 59,297 1,140 20,502 394Fall 32 9,907 310 3.4 33,352 1,042 31,053 9702003 Spring 61 8,937 147 3.4 30,141 494 14,283 234Total 896 181,846 355 3.4 600,748 1,201 369,177 791With the exceptions <strong>of</strong> 1998 <strong>and</strong> 2000, recreational l<strong>and</strong>ings <strong>of</strong> striped bass increasedfrom the mid 1990’s through 2000.Table 8.8 shows l<strong>and</strong>ings estimated by MRFSS for internal <strong>and</strong> ocean waters. MRFSSestimates show greater numbers <strong>of</strong> fish being harvested from internal waters than fromthe ocean. However, fish harvested from the ocean were much larger on average(~12.7 pounds) compared to fish from internal waters (~4.5 pounds). Part <strong>of</strong> thisdifference most certainly is due to the total size limit differences for fish from internalwaters as opposed to those from the ocean. In years where there were no l<strong>and</strong>ingsreported from a given location it is because the waters were closed to striped bassfishing.WRC. The WRC estimates striped bass harvest from Roanoke River using an intensivecreel survey when the springtime harvest season is open (usually mid-March through113
Table 8.7.Recreational l<strong>and</strong>ings <strong>of</strong> striped bass, 1988 – 2002 (<strong>NC</strong> MRFSS).Mode <strong>of</strong>fishingNumberl<strong>and</strong>edPoundsl<strong>and</strong>edAverageweight/fishMode <strong>of</strong>fishingNumberl<strong>and</strong>edPoundsl<strong>and</strong>edAverageweight/fishYearAreaYearArea1988 Private/Rental Ocean 367 972 2.6 1998 Manmade Ocean 1,105 16,076 14.5Internal 5,774 17,242 3.0 Internal 305 2,288 7.5Total 6,141 18,214 3.0 Beach/Bank Ocean 7,113 108,440 15.21989 Private/Rental Internal 512 8,472 16.5 Internal 1,006 6,237 6.2Total 512 8,472 16.5 Charter Ocean 5,364 90,678 16.91990 No L<strong>and</strong>ings Internal 4,911 21,768 4.41991 Beach/Bank Ocean 391 3,882 9.9 Private/Rental Ocean 17,098 200,392 11.7Total 391 3,882 9.9 Internal 32,826 146,139 4.51992 Beach/Bank Ocean 967 16,197 16.7 Total 69,728 592,018 8.5Private/Rental Internal 350 586 1.7 1999 Manmade Ocean 302 3,272 10.8Total 1,317 16,783 12.7 Beach/Bank Ocean 4,623 54,996 11.91993 Beach/Bank Ocean 264 3,029 11.5 Charter Ocean 5,201 60,968 11.7Total 264 3,029 11.5 Internal 4,840 22,818 4.71994 Beach/Bank Ocean 3,758 53,739 14.3 Private/Rental Ocean 36,672 437,686 11.9Private/Rental Ocean 3,667 17,456 4.8 Internal 40,059 178,729 4.5Internal 504 857 1.7 Total 91,697 758,469 8.3Total 7,929 72,052 9.1 2000 Manmade Ocean 933 6,378 6.81995 Manmade Ocean 507 6,665 13.1 Beach/Bank Ocean 1,768 23,627 13.4Beach/Bank Ocean 3,590 49,024 13.7 Charter Ocean 4,418 89,654 20.3Internal 1,255 5,441 4.3 Internal 1,165 3,807 3.3Charter Ocean 654 9,183 14.0 Private/Rental Ocean 5,074 69,475 13.7Internal 737 3,600 4.9 Internal 25,023 127,051 5.1Private/Rental Ocean 6,699 93,226 13.9 Total 38,381 319,992 8.3Internal 17,379 68,468 3.9 2001 Manmade Ocean 4,404 10,276 2.3Total 30,821 235,607 7.6 Internal 628 3,016 4.81996 Manmade Ocean 1,908 17,630 9.2 Beach/Bank Ocean 7,317 130,437 17.8Beach/Bank Ocean 6,970 84,258 12.1 Internal 3,215 11,076 3.4Internal 2,337 13,232 5.7 Charter Ocean 2,671 47,077 17.6Charter Ocean 3,061 39,936 13.0 Internal 1,637 9,107 5.6Internal 465 1,556 3.3 Private/Rental Ocean 25,623 420,827 16.4Private/Rental Ocean 5,196 57,853 11.1 Internal 20,145 88,521 4.4Internal 14,456 70,609 4.9 Total 65,640 720,337 11.0Total 34,393 285,074 8.3 2002 Manmade Ocean 1,493 24,447 16.41997 Manmade Ocean 3,034 41,149 13.6 Beach/Bank Ocean 3,820 62,697 16.4Internal 1,450 5,329 3.7 Charter Ocean 2,900 54,363 18.7Beach/Bank Ocean 11,451 133,261 11.6 Internal 3,198 13,979 4.4Charter Ocean 5,385 84,412 15.7 Private/Rental Ocean 25,397 461,079 18.2Internal 791 1,581 2.0 Internal 23,484 95,459 4.1Private/Rental Ocean 27,282 349,156 12.8 Total 60,292 712,024 11.8Internal 35,517 148,702 4.2Total 84,910 763,590 9.0 Gr<strong>and</strong> Total 492,416 4,509,543 9.2April). The WRC uses all <strong>of</strong> its allowable harvest (112,500 lbs. in 2001) during thespring season whereas DMF allots half their allowable harvest in Albemarle Soundduring the spring <strong>and</strong> the remainder during the fall. The WRC estimates the numbers <strong>of</strong>114
Table 8.8.Recreational striped bass l<strong>and</strong>ings from wat4ers surveyed by MRFSS (courtesy <strong>NC</strong> MRFSS).OceanInternalYear Number l<strong>and</strong>ed Pounds l<strong>and</strong>ed Number l<strong>and</strong>ed Pounds l<strong>and</strong>ed1988 367 972 5,774 17,2421989 0 0 512 8,4721990 0 0 0 01991 391 3,882 0 01992 967 16,197 350 5861993 264 3,029 0 01994 7,425 71,195 504 8571995 11,450 158,098 19,371 77,5091996 17,135 199,677 17,258 85,3971997 47,152 607,978 37,758 155,6121998 30,680 415,586 39,048 176,4321999 46,798 556,922 44,899 201,5472000 12,193 189,134 26,188 130,8582001 40,015 608,517 25,625 111,7202002 33,610 602,586 26,682 109,438Total 214,837 2,831,187 217,287 966,232striped bass caught <strong>and</strong> released during the harvest season (Table 8.9). In addition,there are some data for a few years in which the WRC monitored the catch & releasefishery after the harvest season closed.Table 8.9.Recreational fishing trips l<strong>and</strong>ing striped bass from the Roanoke River (courtesy <strong>NC</strong> WRC).Open HarvestPost Harvest PeriodNumber <strong>of</strong> fishNumber <strong>of</strong> Number <strong>of</strong> Number <strong>of</strong>Number <strong>of</strong> NumberYearWeight hrs. fished trips fish Weight hrs. fished <strong>of</strong> trips1989 153,185 32,034 46,566 9,803 * * * *1990 106,073 42,108 56,169 11,825 * * * *1991 26,934 72,365 74,596 15,704 * * * *1992 13,372 35,935 49,277 10,374 * * * *1993 14,325 45,043 52,932 11,144 * * * *1994 8,284 28,026 44,693 9,409 * * * *1995 7,471 28,818 56,456 11,885 52,698 * 20,639 4,3451996 8,367 28,114 46,164 9,719 148,222 * 32,743 6,8931997 9,364 29,929 23,139 4,871 271,328 * 47,001 9,8951998 23,109 73,374 72,410 15,244 102,299 * 26,367 5,5511999 22,479 72,813 72,717 15,309 113,394 * 30,633 6,4492000 38,206 119,841 95,622 20,131 * * * *2001 35,231 112,567 100,119 21,078 * * * *2002 36,422 112,698 122,584 25,807 * * * ** no data8.3.2 Recreational Fishing ActivityThe DMF creel survey estimates anglers targeted striped bass for approximately 60,370hours <strong>of</strong> in the fall <strong>of</strong> 2001 in the areas <strong>of</strong> the ASMA surveyed. This estimate isdetermined by analysis <strong>of</strong> the number <strong>of</strong> interviews completed, angler success rates115
<strong>and</strong> a trailer counting survey at ramps. The majority <strong>of</strong> fishermen interviewed lived in thecounty where they were fishing. Nearly all the other fishermen were from surroundingcounties. Counties closer to the Virginia border were more likely to have fishermen whotraveled from there to fish.The MRFSS survey did not capture any fishermen who targeted striped bass in theyears prior to 1991. In subsequent years, anglers who target striped bass in internalwaters were more likely to use privately owned or rented boats. Anglers who targetstriped bass in the ocean were more likely to fish from a beach or a manmade structuresuch as a pier. Approximately 1.5-2.0% <strong>of</strong> trips in the areas where MRFSS data arecollected target striped bass. It was estimated that 368,473 striped bass trips weretaken in internal waters <strong>and</strong> 964,030 striped bass trips were taken in ocean watersbetween 1991 <strong>and</strong> 2002 (Table 8.10). Of significant interest is a trend towards anincreased percent <strong>of</strong> internal charter trips that target striped bass. Prior to 1995,MRFSS captured no internal waters charter trips that targeted striped bass. In 1995,almost 16% <strong>of</strong> these trips reported targeting striped bass. It increased each year until itpeaked at 62% in 1999. MRFSS estimates there are over 1,000 <strong>of</strong> these trips a year.The WRC collects data on the number <strong>of</strong> hours anglers fish for striped bass. It uses aconversion factor <strong>of</strong> 4.75 hours to determine the number <strong>of</strong> trips taken. Table 8.9 showsthese data. In the years <strong>of</strong> 1989 to 1996, the number <strong>of</strong> trips taken by anglers to reachthe quota <strong>of</strong> striped bass was between, 9,400, <strong>and</strong> 15,700. In 1997, there was a smallerquota <strong>and</strong> it was reached in fewer than,4,900 trips. From 1998 to 2001, the quotaincreased each year. Consequently the number <strong>of</strong> trips made before the quota wasreached was from 15,200 in 1998 to a high <strong>of</strong> 21,000 in 2001.8.3.3 Economic Value <strong>of</strong> the Recreational <strong>Fishery</strong>There has been one study (Schuhmann, 1999) that measured the value <strong>of</strong> therecreational fishery <strong>and</strong> it only included the Roanoke River areas covered by the WRCcreel survey. Economic value was determined using a willingness to pay analysis <strong>and</strong> ameasurement <strong>of</strong> actual expenditures. Anglers were separated into two groups: catch<strong>and</strong> release vs. catch <strong>and</strong> keep. The economic value <strong>of</strong> the fishery was determined as“the benefits realized by the recreational anglers over <strong>and</strong> above the actualexpenditures” (Schuhmann, 1999). Overall willingness to pay to catch a fish wasdetermined to be in the range <strong>of</strong> $796,500 - $814,000 (in 1998 dollars), with 95% <strong>of</strong> thatamount coming from the catch <strong>and</strong> release fishery. The reason for this difference isbecause catch <strong>and</strong> keep anglers are limited to the number <strong>of</strong> fish they can l<strong>and</strong> <strong>and</strong>keep. Catch <strong>and</strong> release anglers do catch more fish <strong>and</strong> according to the survey, arewilling to spend more money to catch each fish.Anglers who participate in catch <strong>and</strong> release incurred approximately $70 in expensesper trip while the average catch <strong>and</strong> keep angler incurred $22 in additional expenses.Average additional expenses are shown in Table 8.11. When the data are aggregatedacross all fishermen, these expenditures amounted to approximately $918,000 inrevenues that may have been realized by local businesses.116
Table 8.10. Recreational fishing trips targeting striped bass (courtesy <strong>NC</strong> MRFSS).117
Table 8.11.Expenditures by recreational striped bass anglers on the RoanokeRiver, 1998 (Schumann, 1999)Catch <strong>and</strong> release ($) (n=146) Catch <strong>and</strong> keep ($) (n=213)Lodging 8.83 1.08Bait 7.37 5.65Fuel 5.03 4.08Guide 38.77 3.02Other 9.55 7.00Total 69.55 21.838.4 Demographic Characteristics8.4.1 Commercial FishermenThere is no source <strong>of</strong> sociodemographic data <strong>of</strong> commercial fishermen who specificallytarget striped bass. Johnson <strong>and</strong> Orbach (1996) provide a statewide summary <strong>of</strong>commercial fisherman characteristics. Their results are very similar to the findings <strong>of</strong>Diaby (2000) which states that in some ways such as income level, the demographicpr<strong>of</strong>ile <strong>of</strong> ASMA fishermen is not unlike that <strong>of</strong> the typical North Carolina worker. Asshown in Table 8.12, ASMA fishermen averaged about 43 years old. However, onlyabout 6% <strong>of</strong> commercial fishermen were 65 or older compared to 12% <strong>of</strong> all workers inNorth Carolina. The average fisherman has been working commercially for 13 years.Eighty-seven percent <strong>of</strong> the fishermen have less than 20 years experience. Two thirds<strong>of</strong> them fish full-time.Table 8.12. Socioeconomic pr<strong>of</strong>ile <strong>of</strong> ASMA survey respondents, 1998 (Diaby, 2000).Characteristics Fishermen (n=114) State population 1Fisherman statusFull-timePart-time66.4%33.6%N/AAgeUnder 2020-3435-4445-5455-6465 <strong>and</strong> overYears <strong>of</strong> experience in commercial fishingLess than 11-55-1010-2020-3030-4040 <strong>and</strong> over27.7%29.4%24.4%12.6%5.9%13.4%31.1%42.9%9.2%3.4%27.5%23.1%15.3%13.7%8.5%12.0%N/AGenderMaleFemale97.5%2.5%49.7%50.3%Marital status (Married) 65.5% 45.0%118
Table 8.12. (Continued)EthnicityCaucasianAfrican-AmericanNative AmericanAsian or Asian-AmericanLatino or Hispanic-American93.3%6.7%73.4%22.2%1.6%1.2%1.6%Characteristics Fishermen (n=114) State population 1EducationLess than high schoolHigh school graduateSome collegeCollege graduateGraduate school or Pr<strong>of</strong>essional degree0.8%52.1%30.3%13.4%3.4%38.9%25.8%19.2%11.8%4.4%Characteristics Fishermen (n=114) State population 1Household incomeUnder $15,000$15,000-29,999$30,000-49,999$50,000-74,999$75,000-99,999$100,000 <strong>and</strong> overAverage percent <strong>of</strong> household income fromcommercial fishing10.2%28.7%34.3%13.9%12.0%1.9%66.6%12.4%23.0%24.3%20.5%10.4%9.6%N/A1Current Population Survey 1998, March Supplement, Office <strong>of</strong> State <strong>Plan</strong>ning, Office <strong>of</strong> the Governor.The vast majority <strong>of</strong> fishermen are men, with only 2.5% <strong>of</strong> respondents being female.Two thirds are married. The fishermen were also overwhelmingly Caucasian. Asian-Americans made up 6.7% <strong>of</strong> the respondents. No other racial or ethnic groups wereinterviewed.The average ASMA fisherman interviewed was better educated than the average NorthCarolinian with over 50% being high school graduates <strong>and</strong> approximately 47% havinghad at least some college or one or more college degrees. Households with acommercial fisherman on average rely on fishing for two thirds <strong>of</strong> the total householdincome.8.4.2 Recreational FishermenOf the three sources <strong>of</strong> data for recreational fishing activity, only the <strong>NC</strong> MRFSSroutinely collects sociodemographic data on anglers (Table 8.13). Of those anglers whotargeted striped bass in 1999 in the ASMA, only male anglers were intercepted. Inaddition, anglers in the ASMA tended to be older than anglers who fished in otherareas. Anglers who fished in the ASMA or ocean, <strong>and</strong> targeted striped bass were morelikely to be North Carolina residents. Those who targeted striped bass <strong>and</strong> fished ininternal waters other than the ASMA <strong>and</strong> surveyed by MRFSS were more likely to beanglers who resided in other states.119
Table 8.13.Sociodemographic characteristics <strong>of</strong> striped bass anglers, 1999 (courtesy <strong>of</strong> <strong>NC</strong> MRFSS).Percent distribution by age, gender <strong>and</strong> area fishedAREAASMA INLAND OTHER OCEANAge Male Female ALL Male Female ALL Male Female ALL5 to 15 3.6 37.5 11.1 2.3 2.216 to 25 3.6 2.826 to 35 17.9 17.9 21.4 12.5 19.4 25.3 20 2536 to 45 14.3 14.3 32.1 25 30.6 31 40 31.546 to 55 25 25 32.1 12.5 27.8 18.4 40 19.656 to 65 32.1 32.1 3.6 12.5 5.6 19.5 18.565 <strong>and</strong>older 10.7 10.7 3.6 2.8 3.4 3.3Percent distribution in-state/out <strong>of</strong> state residency by area fishedASMA INLAND OTHER OCEANIn-State Out State In-State Out State In-State Out State82.1 17.9 35 65 63.9 36.19.0 ENVIRONMENTAL STATUS9.1 Habitat9.1.1 Essential Fish HabitatStriped bass which inhabit coastal rivers <strong>and</strong> estuaries in North Carolina exhibit twodiffering life history strategies. Some portion <strong>of</strong> the Roanoke River stock isunquestionably migratory (based on tag returns), with mature adults residing in theAtlantic Ocean, returning to the river to spawn in the spring, <strong>and</strong> migrating back to theocean for the summer <strong>and</strong> fall months. Based on the numbers <strong>of</strong> striped bass observedin the river in the aftermath <strong>of</strong> a late July, 1995 fish kill (Kornegay <strong>and</strong> Jones 1995), aswell as anecdotal reports <strong>of</strong> large, mature striped bass captured in late summer in theRoanoke Rapids Dam tailrace (Ben Ricks, Roanoke Rapids, <strong>NC</strong>, personalcommunication, March 5, 2003), there may be some portion <strong>of</strong> the A/R stock which isresident in the river <strong>and</strong> Albemarle Sound estuary on a year-round basis. All otherstocks which spawn in North Carolina waters apparently reside in their natal rivers<strong>and</strong>/or adjacent estuaries for their entire life cycle, using the lower river <strong>and</strong> estuarinewaters as adult habitat (Raney 1957).Both striped bass life history strategies (migratory or resident) evident in coastal NorthCarolina necessitate use <strong>of</strong> river segments with sufficiently flowing waters for spawning;riverine <strong>and</strong> estuarine nursery habitat for egg, larval <strong>and</strong> early juvenile stages; <strong>and</strong>estuarine, as well as oceanic, habitats for subadults <strong>and</strong> mature adult fish. For thepurposes <strong>of</strong> this discussion, subadult striped bass are those which have grown beyondthe early juvenile age (arbitrarily set for this discussion as age 1) but have not yetreached sexual maturity (which occurs at ages 2-3 for males <strong>and</strong> 4-5 for females).Adults are fish which have reached sexual maturity.120
Striped bass habitats that occur within the jurisdiction <strong>of</strong> state fishery managementagencies include the water column <strong>of</strong> riverine spawning areas; <strong>and</strong> water column <strong>of</strong>riverine <strong>and</strong> estuarine nursery areas <strong>and</strong> residence areas for subadult <strong>and</strong> adult fish inthe rivers, sounds <strong>and</strong> nearshore Atlantic Ocean from the beach to three milesoceanward. Larval <strong>and</strong> juvenile striped bass also occasionally may use habitats such ass<strong>of</strong>t bottom, submerged aquatic vegetation, shell bottom, ocean hard bottom <strong>and</strong>wetl<strong>and</strong>s. Migratory adults also may use water column, s<strong>of</strong>t bottom <strong>and</strong> ocean hardbottom habitat located in federal waters over three miles from shore (USFWS,unpublished data). Habitat terms in bold type in this text are defined in the CoastalHabitat Protection <strong>Plan</strong> (CHPP) (DMF, in preparation) as follows:Water columnThe water covering a submerged surface <strong>and</strong> its physical, chemical <strong>and</strong> biologicalcharacteristics.S<strong>of</strong>t bottomAreas <strong>of</strong> primarily unvegetated, unconsolidated sediment (particles smaller than rocks)beneath the water column not within other categories below.Submerged aquatic vegetationHabitat dominated by one <strong>of</strong> more species <strong>of</strong> submerged rooted vascular plants ormacroalgae.Shell bottomBottom composed <strong>of</strong> oyster shell, live oysters, <strong>and</strong> other estuarine shell-buildingorganisms that are discrete, contiguous <strong>and</strong> clearly distinguishable from scattered shellsin marshes <strong>and</strong> mudflats.Ocean hard bottomExposed areas <strong>of</strong> rock or consolidated sediments that may or may not be characterizedby a thin covering <strong>of</strong> live or dead animals, generally located in the ocean rather than anestuary.Wetl<strong>and</strong>sSection 404 <strong>of</strong> the Federal Water Pollution Control Act defines wetl<strong>and</strong>s as: “areas thatare inundated or saturated by surface or groundwater at a frequency <strong>and</strong> durationsufficient to support, <strong>and</strong> that under normal circumstances do support, a prevalence <strong>of</strong>vegetation typically adapted for life in wet soil conditions.” Fish habitat wetl<strong>and</strong>s areadjacent to, or periodically flooded by riverine or coastal waters.Successful restoration, recovery <strong>and</strong> maintenance <strong>of</strong> striped bass populations in allcoastal river systems cannot occur unless the extent <strong>and</strong> quality <strong>of</strong> all the requiredhabitats are maintained. Parameters which are important for defining the quality <strong>of</strong>habitats used by striped bass <strong>and</strong> their prey include dissolved oxygen (DO),temperature, salinity, current velocity, flow delivery pattern <strong>and</strong> timing (for spawningreaches), <strong>and</strong> prey abundance. In-stream oxygen concentrations greater than 5121
milligrams per liter (mg/l) are recommended for all life stages <strong>of</strong> striped bass (Setzler-Hamilton <strong>and</strong> Hall 1991, Funderburk et al. 1991).Striped bass are recorded from all <strong>of</strong> North Carolina's coastal river ecosystems(Menhinick 1991). Coastal basins with historical or potential striped bass spawning,nursery <strong>and</strong> adult/subadult habitats which are situated wholly or primarily in NorthCarolina are: Albemarle Sound, including its tributaries, the major ones being theChowan <strong>and</strong> Roanoke Rivers; Pamlico Sound with its tributaries, with the Neuse <strong>and</strong>Tar/Pamlico Rivers the largest; the Newport River; the White Oak River; the New River;the Cape Fear <strong>and</strong> Northeast Cape Fear Rivers <strong>and</strong> estuary; <strong>and</strong> the Shallotte River.Additional rivers which enter the Atlantic Ocean in South Carolina also host striped bass<strong>and</strong> some spawning <strong>and</strong> nursery habitats for these populations are present in NorthCarolina. These include the Pee Dee River system <strong>and</strong> its Waccamaw <strong>and</strong> LumberRiver tributaries.Habitat requirements for all life stages <strong>of</strong> migratory <strong>and</strong> coastal resident striped bass aregenerally summarized in Hill et al. (1989) <strong>and</strong> Bain <strong>and</strong> Bain (1982). A generaldiscussion <strong>of</strong> the habitat requirements <strong>of</strong> each striped bass life stage, which borrowsliberally from those reports, is provided in the following sections. Localities <strong>and</strong>attributes <strong>of</strong> particular striped bass habitats in individual North Carolina river/estuarysystems or portion there<strong>of</strong> are documented in specific references for each system asindicated in the text following the general habitat descriptions.9.1.1.1 Spawning HabitatStriped bass spawn in inl<strong>and</strong> reaches <strong>of</strong> Atlantic slope drainage North Carolina riverswhere water temperatures, dissolved oxygen <strong>and</strong> flows are adequate for maintainingthe semi-buoyant eggs in suspension <strong>and</strong> providing for proper development <strong>and</strong>hatching. Historically, in the absence <strong>of</strong> dams, striped bass migrated well into thePiedmont physiographic province. At present, dams on most <strong>of</strong> the major rivers[Meherrin (at Emporia, VA), Roanoke (Roanoke Rapids, Gaston <strong>and</strong> Kerr Dams), Tar-Pamlico (Rocky Mount Mills), Neuse (Milburnie <strong>and</strong> Falls Dams near Raleigh), CapeFear (Lock <strong>and</strong> Dams Numbers 1-3) <strong>and</strong> Pee Dee (Blewett Falls near Rockingham, <strong>NC</strong>,<strong>and</strong> five other adjacent upstream dams)] (Figure 9.1 <strong>and</strong> 9.2) confine spawning tothose reaches located at the lower end <strong>of</strong> the Fall Zone. Since 1998, the Quaker NeckDam <strong>and</strong> other small dams in the Neuse River drainage have been removed, <strong>and</strong>passage is planned for other dams (Lock <strong>and</strong> Dam No. 1 on the Cape Fear). Damremoval or provision <strong>of</strong> passage will reestablish access to historic striped bassspawning areas.Striped bass spawning in North Carolina rivers use the water column <strong>of</strong> fresh or nearlyfresh portions <strong>of</strong> the rivers, with specific locations in individual rivers ranging as farinl<strong>and</strong> as the Fall Zone (historically well above the Fall Zone, for example see Jenkins<strong>and</strong> Burkhead 1993) to portions much closer to the river mouth. Hill et al. (1989) reportthat preferred areas are shallow (0.3 to 6.1 m) <strong>and</strong> <strong>of</strong>ten turbid, extending from the tidalzone upstream as far as 320 km. Spawning sites in the southeastern Atlantic Coastal122
Figure 9.1.Dam blockages to striped bass historical spawning habitats in North Carolina.123
Figure 9.2.Dams within the Roanoke River basin, North Carolina <strong>and</strong> Virginia.124
Plain were reported as <strong>of</strong>ten in the downstream portions <strong>of</strong> river systems, typically inreaches within 60 km <strong>of</strong> the coast.Striped bass stocks which spawn in the inl<strong>and</strong> portions <strong>of</strong> rivers requires water columnhabitat with appropriate patterns <strong>and</strong> volumes <strong>of</strong> freshwater discharge before <strong>and</strong>during spawning season (Bain <strong>and</strong> Bain 1982). The Habitat Suitability Index (HIS)model developed for coastal stocks <strong>of</strong> striped bass assumes that 100 percent <strong>of</strong> thenatural river discharge will provide optimal spawning conditions (Bain <strong>and</strong> Bain 1982).River discharge above the average is believed to reduce habitat suitability; however ithas been speculated that on the Roanoke <strong>and</strong> other <strong>NC</strong> rivers with broad floodplainslocated downstream <strong>of</strong> spawning grounds, eggs, larvae <strong>and</strong> early juveniles may betransported into adjacent wetl<strong>and</strong>s where higher mortality may occur. Specific currentvelocities are required to suspend eggs in the water column during incubation.Minimum velocities <strong>of</strong> about 30 cm/sec are generally required (Albrecht 1964). Velocityrequired by different stocks may vary due to differences in egg buoyancy.9.1.1.2 Nursery Habitats (eggs, larvae, early juveniles)Nursery habitat for striped bass eggs, larvae <strong>and</strong> early juveniles (age less than a year)in North Carolina rivers consists <strong>of</strong> the water column habitat in river channelsdownstream from the spawning areas, <strong>and</strong> water column, s<strong>of</strong>t bottom, submergedaquatic vegetation <strong>and</strong> wetl<strong>and</strong>s <strong>of</strong> river deltas at the river moths, <strong>and</strong> in adjacentestuaries.As noted above, eggs require minimum current velocities <strong>of</strong> about 30 cm/sec forsuspension in the water column during incubation, but differences in egg buoyancyamong spawning stocks may dictate different current velocity requirements (Albrecht1964, Hill et al. 1989). Eggs which settle to the bottom may still hatch, providedsubstrates are relatively coarse (Bayless 1968).Striped bass larvae pass through three development stages (yolk-sac 5-8 mm TL, finfold 8-12 mm TL, <strong>and</strong> post fin fold 13-30 mm TL) all <strong>of</strong> which inhabit the water column <strong>of</strong>riverine systems downstream <strong>of</strong> the spawning reaches. Hill et al. (1989) report that littleis known about microhabitat requirements <strong>of</strong> larvae in the wild. In natural waters, yolksaclarvae apparently sink between efforts to swim, <strong>and</strong> turbulence may be required tokeep them suspended in some waters (Pearson 1938, Mansueti 1958, Dickson 1958<strong>and</strong> Barkuloo 1970 as cited in Hill et al. 1989). Density <strong>of</strong> yolk-sac larvae variedsignificantly with time <strong>of</strong> day <strong>and</strong> depth in the Potomac River (Boynton et al. 1977). Finfold larvae have been reported to form schools <strong>and</strong> migrate inshore at 13-14 mm(Raney 1952, Texas Instruments, Inc. 1974). In Chesapeake Bay, fin fold <strong>and</strong> largerlarvae were collected in mid-channel areas near the bottom (Kernehan et al. 1981).Several studies have demonstrated a downstream movement <strong>of</strong> early larval states, butit is unknown whether this is due to passive drift or a directed migration (TexasInstruments, Inc. 1974, Polgar et al. 1975, Mihursky et al. 1976). Other studies haveindicated either little movement from the spawning area, an upstream migration(Setzler-Hamilton et al. 1981), or that larvae remain in the open surface waters <strong>of</strong> natalestuaries (Raney 1952). Inconsistencies in reported habitat use by larval life stages may125
e a reflection <strong>of</strong> continual upstream migration <strong>of</strong> spawning fish, prolonged spawningperiods <strong>and</strong> different mortality rates <strong>of</strong> the life stages (Polgar et al. 1976).Striped bass enter the early juvenile stage at about 30 mm, when fins are fully formed<strong>and</strong> the external morphology is similar to that <strong>of</strong> adults (Hill et al. 1989). Early juvenilestolerate a broader range <strong>of</strong> environmental conditions than eggs <strong>and</strong> larvae (Bain <strong>and</strong>Bain 1982). Movements, distribution <strong>and</strong> habitat use <strong>of</strong> early juveniles, especially in thewater column <strong>of</strong> southeastern U.S. rivers, are little known (Hill et al. 1989). Setzler et al.(1980) indicated that the migration <strong>of</strong> early juveniles varies with locality. In Virginia,Markle <strong>and</strong> Grant (1970) reported a downstream migration to higher salinities during thefirst summer <strong>of</strong> life. In the Potomac River, early juveniles left spawning areas at about70 mm TL (Mihursky et al. 1976). Bason (1971) reported largest concentrations <strong>of</strong>juveniles in protected areas <strong>of</strong> moderate salinity. Other authors (Sasaki 1966, Carlson<strong>and</strong> McCann 1968) reported that shoals were used as nursery areas. Rathjen <strong>and</strong> Miller(1957) reported the largest catches <strong>of</strong> juvenile striped bass were near clean s<strong>and</strong>ybottoms. Young-<strong>of</strong>-the-year from the Hudson River began to move <strong>of</strong>fshore in the fall(Carlson <strong>and</strong> McCann 1969, Texas Instruments, Inc. 1974) but no similar movementwas observed in the Patuxent River (Ritchie <strong>and</strong> Koo 1968).An additional habitat consideration for larval <strong>and</strong> early juvenile striped bass is high foodavailability (Bain <strong>and</strong> Bain 1982). Some authors believe that striped bass year classstrength is established, at least in part, by the availability <strong>of</strong> abundant zooplankton in thehabitats required by the larval <strong>and</strong> early juvenile stages (i.e., in the downstream watercolumn, s<strong>of</strong>t bottoms, submerged aquatic vegetation <strong>and</strong> wetl<strong>and</strong>s <strong>of</strong> rivers, river deltas<strong>and</strong> the l<strong>and</strong>ward portions <strong>of</strong> estuaries)(see Heinle et al. 1975, Eldridge et al. 1981 ascited in Bain <strong>and</strong> Bain 1982). Zooplankton abundance is in turn related to riverine <strong>and</strong>estuarine productivity, which are further linked to freshwater inflows <strong>and</strong> associateddetrital inputs.9.1.1.3 Subadult HabitatThese fish (age 1 though sexual maturity at ages 2-5) use the water column <strong>and</strong> s<strong>of</strong>tbottom habitat present in North Carolina’s coastal rivers <strong>and</strong> estuaries, <strong>and</strong> migratorysubadults may likely use the water column <strong>and</strong> ocean hard bottom <strong>of</strong> the nearshoreAtlantic Ocean as well. It is generally believed that striped bass less than 2 years <strong>of</strong> agedo not migrate (Boreman <strong>and</strong> Lewis 1987), therefore these fish would use only habitatsin rivers <strong>and</strong> adjacent estuaries. Some subadult fish which appeared less than age 2(based on TL), however, have been captured in Atlantic Ocean waters <strong>of</strong>f Virginia <strong>and</strong>North Carolina (USFWS, South Atlantic Fisheries Coordination Office, unpublisheddata), so to the extent subadults may travel <strong>of</strong>fshore, there is limited use at least <strong>of</strong>ocean water column, s<strong>of</strong>t bottom <strong>and</strong> hard bottom habitats.9.1.1.4 Adult HabitatMigratory striped bass (presumed to be only some <strong>of</strong> the Albemarle/Roanoke stock in<strong>NC</strong>) use the water column <strong>of</strong> inl<strong>and</strong> <strong>and</strong> coastal rivers for spawning, <strong>and</strong> migrate to <strong>and</strong>from the spawning grounds through the water column <strong>of</strong> rivers <strong>and</strong> adjacent estuaries<strong>and</strong> inlets to the Atlantic Ocean, where they spend much <strong>of</strong> the spring, summer <strong>and</strong> fall.126
Migrating fish move north in the spring <strong>and</strong> summer <strong>and</strong> south in the fall <strong>and</strong> winter(Merriman 1941, Clark 1968, Boreman <strong>and</strong> Lewis 1987). All adults from rivers south <strong>of</strong>the Roanoke <strong>and</strong> Chowan remain in rivers or adjacent estuaries for their entire lifecycle, as do most <strong>of</strong> the A/R stock. The water column <strong>of</strong> s<strong>and</strong>y beaches, rocky shores<strong>and</strong> shallow bays are inhabited in both marine <strong>and</strong> estuarine environments (Bigelow<strong>and</strong> Schroeder 1953). Striped bass adults are reported to remain relatively close (6-8km; 4-5 mi) to shore when in the ocean (Bain <strong>and</strong> Bain 1982).9.1.1.5 Striped Bass Habitats in <strong>NC</strong> River/Estuary SystemsThe following sections contain as much information as is presently available regardingthe use <strong>of</strong> specific habitats in North Carolina by coastal striped bass life stages (Figure9.3). For the sake <strong>of</strong> completeness, all habitats used by a stock are included, eventhough in some cases, fish which use habitats in North Carolina may spawn <strong>of</strong>fspringwhich use habitats up- or downstream in other states. North Carolina fisherymanagement agencies <strong>and</strong> institutions, both state <strong>and</strong> federal, as well as anglers, needto be aware <strong>of</strong> the need to protect these habitats <strong>and</strong> enact compatible managementmeasures for these stocks throughout their ranges.9.1.1.5.1 Albemarle Sound <strong>Management</strong> AreaChowan River <strong>and</strong> Tributaries (Blackwater, Meherrin <strong>and</strong> Nottoway Rivers)Spawning AreasStriped bass are known to have spawned in the Chowan River basin both historically(Mike Street, DMF, personal communication) <strong>and</strong> recently (1998) in the Meherrin River,based on the collection <strong>of</strong> eggs. Dr. Gilbert Tripp <strong>and</strong> students <strong>of</strong> Chowan Collegecollected eggs in April, 1998, at Boone’s Bridge (SR 1311) in Northampton County (J.W.Kornegay, <strong>NC</strong> Division <strong>of</strong> Inl<strong>and</strong> Fisheries, personnel communication <strong>and</strong> unpublisheddata). No recent surveys <strong>of</strong> spawning activity or habitats used for spawning have beenconducted by the WRC or DMF. A spawning stock survey is currently being conductedin Virginia tributaries <strong>of</strong> the Chowan by the Virginia Department <strong>of</strong> Game <strong>and</strong> Inl<strong>and</strong>Fisheries (J.W. Kornegay, <strong>NC</strong> Division <strong>of</strong> Inl<strong>and</strong> Fisheries, personal communication).Nursery AreasExcept for the aforementioned collection <strong>of</strong> striped bass eggs from the Meherrin River inNorthampton County, no information was located on nursery areas which are used bystriped bass eggs, larvae or early juveniles in the Chowan River or its tributaries.Adult Movements, Summer Habitats, MigrationNo information was located on habitats used by adult striped bass which occupy theChowan River or its tributaries. Although Jenkins <strong>and</strong> Burkhead (1993) depict onecapture site for striped bass in the Virginia portion <strong>of</strong> the Chowan River, they do not127
Figure 9.3.Striped bass spawning <strong>and</strong> nursery areas in North Carolina coastalrivers.discuss the species in the text. Rulifson et al. (1982a) conducted an extensive review <strong>of</strong>striped bass literature, but also do not mention the Chowan River or its tributaries ashosting striped bass.Roanoke RiverSpawning AreasResults <strong>of</strong> previous investigations (Fish 1959; McCoy 1959; Smith 1907; Hassler et al.1981) were compared with a recent study (Rulifson 1991a) to determine the extent <strong>and</strong>128
location <strong>of</strong> spawning habitat. Construction <strong>of</strong> the Roanoke Rapids Dam in 1955 at RiverMile (RM) 137.5 blocked access to any spawning grounds farther upstream; however,historical accounts indicate major spawning activity centered around Weldon (RM 130).Spawning grounds now range from RM 78 to RM 137.5 with most <strong>of</strong> the activitybetween RM 120 <strong>and</strong> RM 137, still centered around Weldon.Nursery AreasThe primary nursery area for Roanoke-spawned fish is the low amplitude tidal, windinfluencedprimarily fresh waters <strong>of</strong> western Albemarle Sound (Figure 9.3). Striped bassmay spend the first two years <strong>of</strong> life maturing in <strong>and</strong> around this nursery area (Hassleret al. 1981). Dr. W. W. Hassler <strong>and</strong> the North Carolina State University staff conductedjuvenile abundance surveys from 1955 to 1987. The DMF began sampling the sevenstations established by Hassler in 1982 <strong>and</strong> has continued these surveys to presentestablishing a long-term relative index <strong>of</strong> abundance. In 1984 the DMF began samplingtwelve stations in central Albemarle Sound to determine is a shift in the nursery areahad occurred. Juveniles have also been collected in the central sound indicatingdispersal throughout the Albemarle Sound <strong>and</strong> its tributaries (Henry et al. 1991).Adult Movements, Summer Habitats, MigrationTagging studies suggest that some portion <strong>of</strong> this stock is migratory with primarily olderadults migrating <strong>of</strong>fshore, <strong>and</strong> that the percent migration may be increasing as the agestructure <strong>and</strong> population size rebuild. Tag-recapture studies from previous investigators(Fish 1959, Merriman 1941, Hassler <strong>and</strong> Taylor 1986, Davis <strong>and</strong> Sykes 1960, Chapoton<strong>and</strong> Sykes 1961, Street et al. 1975, Henry et al. 1992, Holl<strong>and</strong> <strong>and</strong> Yelverton 1973,Benton 1992, Boreman <strong>and</strong> Lewis 1987, <strong>and</strong> ASMFC 1990), were examined todetermine the amount <strong>and</strong> extent <strong>of</strong> migration from the spawning grounds to otherseasonal habitats. It has been speculated that Croatan Sound <strong>and</strong> <strong>of</strong>fshore watersserve as a wintering ground (Street et al.1975), <strong>and</strong> movement <strong>of</strong>fshore <strong>and</strong> northoccurs during the summer. Fish tagged <strong>and</strong> released at various locations in AlbemarleSound have been recaptured on the spawning grounds, in Albemarle, Pamlico <strong>and</strong>Croatan sounds, <strong>and</strong> <strong>of</strong>fshore from North Carolina to New Engl<strong>and</strong>. Studies from 1938to present indicate a small amount <strong>of</strong> migration occurs. It was noted by several <strong>of</strong> theseinvestigators that larger, older females were more migratory than males. However, it isapparent that the Albemarle Sound <strong>and</strong> North Carolina territorial seas serve as awintering ground for not only the A/R stock, but for other east coast stocks as well.Limited tag returns suggest that some fish from other east coast systems also move intoAlbemarle Sound during winter.9.1.1.5.2 Central Southern <strong>Management</strong> AreaTar-Pamlico RiverSpawning AreasThe Tar-Pamlico River system ranks second to the Roanoke River in production. Thearea <strong>of</strong> peak spawning activity was documented to occur upstream <strong>of</strong> Tarboro betweenRM 50 <strong>and</strong> RM 85 (Figure 9.3) (Humphries 1966). Eggs have been collected from129
Rocky Mount to Grimesl<strong>and</strong> (just upstream <strong>of</strong> Washington) (Marshall 1976). Upstreammigration <strong>of</strong> anadromous fish is blocked by a dam at <strong>NC</strong> 43 (Collier <strong>and</strong> Odom 1989).Nursery AreasLarval striped bass, juveniles, <strong>and</strong> yearlings were collected in 1978 above Washingtonin the Tar River, <strong>and</strong> downstream in the Pamlico River to the Pungo River that wereconsidered to originate from natural stock (Hawkins 1980).Adult Movements, Summer Habitats, MigrationTagging studies indicate that Tar-Pamlico <strong>and</strong> Neuse river striped bass are riverine <strong>and</strong>endemic (Marshall 1977; Hawkins 1980). These data also suggest that fish spend thewinter in the Pamlico River between Washington <strong>and</strong> the mouth <strong>of</strong> the Pungo River <strong>and</strong>move up the Tar River during the spring spawning run (Marshall 1976; Pate 1975;Winslow et al. 1983).Neuse RiverSpawning AreasSpawning in the Neuse River was documented in 1978 <strong>and</strong> 1979 to occur between RM80 <strong>and</strong> RM 145 approximately between Kinston <strong>and</strong> Goldsboro, respectively (Figure9.3). Spawning activity is concentrated between RM 80 <strong>and</strong> RM 120 in an area <strong>of</strong> highturbulence (Hawkins 1980). The Quaker Neck Dam at Goldsboro has been reported toblock the upstream migration <strong>of</strong> striped bass (Baker 1968). However, a few eggs havebeen collected above the low-head dam indicating that some striped bass do migratebeyond the dam <strong>and</strong> spawn successfully. Distribution was greatly hindered by the dam(Hawkins 1980), until removal in 1998, opening up historical spawning reaches.Nursery AreasA few striped bass larvae <strong>and</strong> juveniles have been collected in the New Bern area in1978 on the Neuse River that were thought to originate from natural stock (i.e. notstocked fish) (Hawkins 1980). The nursery area is considered to be downstream <strong>of</strong> NewBern (Figure 9.3).Adult Movements, Summer Habitats, MigrationTagging studies indicate that Neuse River striped bass are riverine <strong>and</strong> endemic(Marshall 1977; Hawkins 1980).Newport, White Oak <strong>and</strong> New RiversLittle information is available on these medium-sized streams in southern NorthCarolina. Historically, both the New <strong>and</strong> White Oak Rivers are shown as supporting runs<strong>of</strong> striped bass in Baker's (1968) Reconnaissance <strong>of</strong> Inl<strong>and</strong> Fishing Waters. In 1973-1975, DMF conducted a fishery-independent anadromous fish survey for eggs, larvae,<strong>and</strong> adults.130
No striped bass eggs, larvae, or adults were found in the New River. Habitat previouslyfound above Jacksonville no longer exists because <strong>of</strong> channelization. Three adultstriped bass were collected in the White Oak River. Two were three year old females<strong>and</strong> one was a seven year old female (Sholar 1975).Cape Fear RiverDistributionStriped bass eggs, larvae <strong>and</strong> juveniles have been collected in the Cape Fear <strong>and</strong>Northeast Cape Fear rivers. Other major tributaries including the South <strong>and</strong> Black riversdo not seem to support spawning populations (Winslow et al. 1983). However, this mayreflect a lack <strong>of</strong> sampling effort, since interviews with local recreational anglers in 1984indicated that striped bass were caught in the spring well up the tributaries <strong>of</strong> the BlackRiver (Laney 1984).Spawning AreasSpawning activity has been document on the Cape Fear River from RM 10 to RM 30(upstream <strong>of</strong> Wilmington) where relatively high tidal currents keep eggs in suspension(Figure 9.3)(Fischer 1980; Winslow et al. 1983). Spawning activity has beendocumented on the Northeast Cape Fear from Ness Creek to Crooms Bridge. TheSouth <strong>and</strong> Black Rivers apparently do not support spawning habitat for striped bass(Sholar 1977; Winslow et al. 1983).Nursery AreasJuveniles have been collected on the Cape Fear <strong>and</strong> Northeast Cape Fear rivers,though infrequently. The nursery area on the Cape Fear is centered around Wilmington(Figure 9.3)(Fischer 1980; Winslow et al. 1983). The nursery area on the NortheastCape Fear ranges from Wilmington to Lanes Ferry (Sholar 1977; Winslow et al. 1983).Adult Movements, Summer Habitats, MigrationAdults have been collected from Pikes Creek to the lower river in the Northeast CapeFear. Some large striped bass (45 pounds) have been reported by recreationalfishermen (Sholar 1977; Winslow et al. 1983). The distribution is more compressed inthe Cape Fear River because <strong>of</strong> a series <strong>of</strong> locks <strong>and</strong> dams. The range extends fromReed Creek (below Lock <strong>and</strong> Dam No. 1) to the lower river. In the early 1980s, stripedbass were abundant January-May below Wilmington (Fischer 1980; Winslow et al.1983). Tagging studies suggest that this stock is riverine endemic with exchangebetween the Cape Fear <strong>and</strong> Northeast Cape Fear Rivers (Winslow et al. 1983).Waccamaw RiverSpawning AreasNo references were located which document spawning in the Waccamaw Riverdrainage; however, striped bass weighing 20 pounds have been caught in the river131
above Conway, <strong>and</strong> smaller fish have been caught only 15-20 miles below the NorthCarolina state line (Craig Sasser, U.S. Fish <strong>and</strong> Wildlife Service, Waccamaw NationalWildlife Refuge, personal communication). Investigation <strong>of</strong> the North Carolina portions<strong>of</strong> the Waccamaw River should be undertaken during the appropriate season.Nursery AreasNo information on nursery areas used by striped bass eggs, larvae or early juveniles inthe Waccamaw River drainage was located.Adult Movements, Summer Habitats, MigrationNo information has been located on habitats used by adult striped bass in theWaccamaw River system.Lumber RiverNo information has been located on any habitats used by any striped bass life stages inthe Lumber River system.Pee Dee RiverSpawning AreasThe only portion <strong>of</strong> the Pee Dee River presently available for spawning striped bass inNorth Carolina waters is the approximately 14-mile reach from Blewett Falls Dam, nearRockingham, <strong>NC</strong>, to the South Carolina state boundary. Areas reported as constitutingstriped bass spawning habitat include the Pee Dee River or Intercoastal Waterway inSouth Carolina (Crochet et al. 1976) <strong>and</strong> the Pee Dee River upstream from the US 301bridge (White <strong>and</strong> Curtis 1969).Nursery AreasNo information has been located on areas used as nursery habitats by striped bass lifestages in the Pee Dee River system.Adult Movements, Summer Habitats, MigrationNo information has been located on areas used by striped bass adults in the Pee DeeRiver ecosystem. The Pee Dee River was listed by Burns (1887) as having a stripedbass population. The population was still extant in 1980 (McIlwain 1980).9.1.2 Habitat Protection StatusProtection <strong>of</strong> the quantity <strong>and</strong> quality <strong>of</strong> striped bass habitat, particularly areasdesignated as critical (i.e. spawning <strong>and</strong> nursery areas) is essential to the goal <strong>of</strong> thisplan. Increasing human activity across North Carolina continues to have a significantinfluence on habitat quantity <strong>and</strong> quality as well as associated wildlife <strong>and</strong> fisheriesresources.The WRC has the authority to designate waters as Inl<strong>and</strong> Primary Nursery Areas.Currently portions <strong>of</strong> the Roanoke, Tar, Neuse, <strong>and</strong> Cape Fear rivers are designated.However, the WRC has no additional regulatory authority <strong>and</strong> can only regulate fishing132
activities in these areas. Permitting agencies give these areas additional considerationrelative to impacts prior to issuing development permits.DMF has the authority to designate Critical Habitat Areas, Anadromous SpawningAreas, <strong>and</strong> Nursery Areas. Anadromous spawning <strong>and</strong> nursery area surveys have beenconducted in the watersheds <strong>of</strong> Currituck Sound, Albemarle Sound, Tar-Pamlico River,Neuse River, White Oak River, New River, <strong>and</strong> Cape Fear River, but no directedsurveys have occurred since the early 1980s outside <strong>of</strong> the Albemarle Sound area.Areas in each system that has been documented to function as spawning <strong>and</strong>/ornursery areas for striped bass. Although these areas have been identified by DMF, theareas have not been adopted into rule at this time. Furthermore, MFC has no additionalregulatory authority in these areas <strong>and</strong> can only regulate fish size, creel, <strong>and</strong> method <strong>of</strong>fishing.The 1997 Fisheries Reform Act m<strong>and</strong>ates the Department <strong>of</strong> <strong>Environment</strong> <strong>and</strong> <strong>Natural</strong>Resources (DENR) shall coordinate the preparation <strong>of</strong> CHPP for critical fisherieshabitats. The goal <strong>of</strong> the CHPP shall be the long-term enhancement <strong>of</strong> coastal fisheriesassociated with coastal habitat. The DMF, North Carolina Division <strong>of</strong> Water Quality(DWQ) <strong>and</strong> North Carolina Division <strong>of</strong> Coastal <strong>Management</strong> (DCM) shall prepare theCHPP, with assistance from other federal <strong>and</strong> state agencies. The plans shall: (1)describe <strong>and</strong> classify biological systems in the habitats, (2) evaluate the function, valueto coastal fisheries, status, <strong>and</strong> trends <strong>of</strong> the habitats, (3) identify existing <strong>and</strong> potentialthreats to the habitats <strong>and</strong> the impact on coastal fishing <strong>and</strong> (4) recommend actions toprotect <strong>and</strong> restore the habitats. The CHPP management units are: Coastal Ocean,Albemarle, Chowan, Roanoke, Tar-Pamlico, Pamlico, Neuse, Core/Bogue, New/WhiteOak, Cape Fear <strong>and</strong> Southern Estuaries. The MFC, the North Carolina <strong>Environment</strong>al<strong>Management</strong> Commission (EMC) <strong>and</strong> the North Carolina Coastal ResourcesCommission (CRC) will jointly approve these plans <strong>and</strong> all regulatory action must beconsistent with approved CHPP. The CHPP must be completed by December 31, 2004<strong>and</strong> must be reviewed every five years.9.1.3 Habitat Concerns9.1.3.1 River FlowsThe flow pattern <strong>of</strong> a coastal river (the timing, rate, <strong>and</strong> delivery pattern <strong>of</strong> water in thechannel <strong>of</strong> the waterway) is critical to maintaining proper oxygen, salinity, <strong>and</strong>temperature regimes <strong>and</strong> dissipating wastes throughout the watershed, including thereceiving estuary. This pattern is also important to striped bass <strong>and</strong> other anadromousspecies. North Carolina rivers typically have exhibited higher flows during the spring <strong>of</strong>the year, providing an attractant flow for adult fish migrating toward the spawninggrounds. Because striped bass have buoyant eggs, river discharge (the rate <strong>of</strong> flow perunit time) must be high enough to keep the eggs in suspension until they hatch <strong>and</strong> totransport the larval <strong>and</strong> postlarval stages to the appropriate nursery areas in the river.River flows must also be sufficient to maintain appropriate salinities in the estuarinenursery areas used by juvenile striped bass.133
Disruptions to the historical patterns <strong>of</strong> flow, in volume <strong>and</strong>/or timing can render habitatunsuitable for use by fish <strong>and</strong> other aquatic organisms, or can significantly alter theextent <strong>of</strong> nursery or spawning habitats. Flow regimes can be altered by a number <strong>of</strong>human activities including dam operations, diversions, <strong>and</strong> water withdrawals. Somerivers in North Carolina have been dammed for hydropower generation, water supply,<strong>and</strong> flood control. Hydropower operations can vary discharge patterns in a highlyunnatural manner, over a short time period causing rapid changes in depth <strong>and</strong>temperatures, <strong>and</strong> accumulation <strong>of</strong> water in adjacent back swamps. Reservoirsconstructed for water supply <strong>and</strong>/or recreational purposes can alter downstream flowpatterns when water is retained for those purposes <strong>and</strong> not released downstream. Floodcontrol operations by the ACOE result in reduced maximum flows, but prolonged higherdischarge levels, <strong>of</strong>ten for weeks at a time. Water diversions alter flows in river channelsegments. Withdrawals <strong>of</strong> water from the river alter the flow temporarily below theintake, or permanently if the withdrawal is consumptive (not returned to the river) or isdischarged into another distant basin (an interbasin transfer). Another potential source<strong>of</strong> impact to river flow patterns is groundwater withdrawal, which can affect subsurfaceflow to river ecosystems. Withdrawals from shallow wells which intersect groundwatersupplies maintaining river base flows could be detrimental, especially during low-flowperiods. All <strong>of</strong> these alterations may impact the cues which striped bass <strong>and</strong> otherspecies require to successfully complete their life cycles.Flow patterns in some North Carolina river systems exhibit significant deviations fromhistorical patterns due to the regulation <strong>of</strong> flows within them or their major tributaries(Chowan, Roanoke, Tar-Pamlico, Neuse, Cape Fear, Yadkin-Pee Dee). Other riversremain largely in an unregulated condition (White Oak, Northeast Cape Fear,Waccamaw). A Water Flow Issue Paper can be found in Section 10.2.1.1.Preliminary evaluations <strong>of</strong> the flow patterns, as well as present <strong>and</strong> future predictedwater dem<strong>and</strong>, suggest that measures should be taken to provide for appropriate futureflows to maintain striped bass populations <strong>and</strong> all other ecological functions. Suchauthority rests with the DWQ, the North Carolina Division <strong>of</strong> Water Resources (DWR),ACOE, <strong>and</strong> individual hydropower operators, subject to license under the FederalEnergy Regulatory Commission. None <strong>of</strong> the federal or state fishery managementagencies have the authority to regulate or specify flows. At present, the only river forwhich any sort <strong>of</strong> flow agreement is in effect, other than prescribed minimum flowreleases for individual dams (mostly for water quality purposes), is the Roanoke.9.1.3.2 Blockage <strong>of</strong> Historical Spawning HabitatIn North Carolina, dams are located along each <strong>of</strong> the major coastal rivers <strong>and</strong>/or theirtributaries (Figures 9.1 <strong>and</strong> 9.2). The lowermost dam is <strong>of</strong>ten located near the fall line(transitional area between the piedmont <strong>and</strong> coastal plain) (Hightower 2001). Stripedbass have historically migrated above the fall line to spawn, especially when river flowsare above average. It is believed that by limiting access to spawning habitat, theseblockages have contributed to the decline <strong>of</strong> striped bass populations. Section 10. 2.1.3describes Blockages to Historical Spawning Habitat in detail.134
9.1.3.3 Losses <strong>of</strong> Striped Bass Eggs <strong>and</strong> Fry to Water IntakesMillions <strong>of</strong> gallons <strong>of</strong> water are pumped daily from coastal rivers by industrial, municipal,<strong>and</strong> agricultural water users. During the striped bass spawning season, striped basseggs <strong>and</strong> larvae drifting downstream with river currents are subject to entrainment(drawing organisms into a system through water suction) or impingement (pinningorganisms against a screen by water intake pressure) by these various water intakes.Juvenile striped bass that have not fully developed their swimming abilities are alsosusceptible to be removed. Once entrained, eggs, larvae, <strong>and</strong> juveniles can beconsidered completely lost from the river. Even if the withdrawn water is returned to theriver (such as is the case with industrial cooling water), striped bass are killed by highwater pressure, turbulence, abrasion, <strong>and</strong> exposure to excessive temperatures. Someintake structures are equipped with fine-mesh screens to exclude fish eggs <strong>and</strong> larvae;however, in many instances, fish eggs <strong>and</strong> larvae are impinged on these screens bywater pressure. Furthermore, these screens require constant cleaning with air <strong>and</strong>water jets to remove debris. Little is known about the survival rates <strong>of</strong> eggs <strong>and</strong> larvaethat are impinged <strong>and</strong> then released by cleaning operations. However, damage frompressure <strong>and</strong> abrasion seems likely. Removal <strong>of</strong> these eggs, larvae, <strong>and</strong> juvenilesthrough water intakes represents a direct loss in striped bass reproductive success.Although the overall impact is currently unknown, these losses could theoretically besignificant for those striped bass populations in which spawners are few. Issuesrelative to Entrainment <strong>and</strong> Impingement <strong>of</strong> Eggs <strong>and</strong> Larvae is presented inSection 10.2.1.3.9.1.3.4 Loss <strong>of</strong> Wetl<strong>and</strong>sWetl<strong>and</strong>s form a unique interface between terrestrial <strong>and</strong> aquatic ecosystems, providingvaluable water related functions <strong>and</strong> important habitat for a broad range <strong>of</strong> fish <strong>and</strong>wildlife species. Major conversions <strong>of</strong> coastal <strong>and</strong> freshwater wetl<strong>and</strong>s have occurreddue to agricultural <strong>and</strong> silvicultural expansion, industrial development, <strong>and</strong> urbanencroachment. It is estimated that North Carolina has already lost 34% <strong>of</strong> its coastalwetl<strong>and</strong>s (<strong>NC</strong>DCM 1999), which are critical fisheries habitat.9.2 Water Quality9.2.1 Water Quality RequirementsTemperatures required for spawning range from 12-24 degrees (°) C, with peaks usuallybetween 18-21°C, although spawning has been observed between 14 <strong>and</strong> 24°C(Scruggs 1957, May <strong>and</strong> Fuller 1965, Smith 1973 <strong>and</strong> Barkuloo 1967). Spawning mayterminate if temperatures decline as a function <strong>of</strong> weather (passage <strong>of</strong> cold fronts) orreservoir releases (see Calhoun et al. 1950, Mansueti <strong>and</strong> Hollis 1963, Boynton et al.1977, as cited in Hill et al. 1989; Rulifson 1990 <strong>and</strong> 1991b). Although salinity <strong>and</strong> totaldissolved solids (TDS) concentrations have been reported as important factors in somesystems (Bain <strong>and</strong> Bain 1982), they have not been reported to influence spawningbehavior in <strong>NC</strong> rivers.Striped bass eggs develop optimally within a temperature range <strong>of</strong> 17-20°C (63-68°F,Bain <strong>and</strong> Bain 1982 citing Barkuloo 1970, Doroshev 1970, <strong>and</strong> Morgan et al. 1981).135
Normal development <strong>and</strong> hatching require dissolved oxygen (DO) concentrations <strong>of</strong> atleast 3-5 mg/l (Turner <strong>and</strong> Farley 1971, Harrell <strong>and</strong> Bayless 1982); however, “low” DO(2.0-3.5 mg/l) was determined responsible for the absence <strong>of</strong> eggs <strong>and</strong> larvae in theDelaware River (Murawski 1969, Chittenden 1971). Turner <strong>and</strong> Farley (1971) reportedthat moderate reductions in DO (from 5 to 4 mg/l) decreased egg survival. Larvaerequire 5-6 mg/l <strong>and</strong> the optimum range for juveniles is probably 6-12 mg/l (Bogdanov etal. 1967). Neither turbidity nor suspended sediments have been observed tosignificantly decrease hatching success (Talbot 1966, Schubel <strong>and</strong> Auld 1974 as citedin Bain <strong>and</strong> Bain 1982). Striped bass eggs in North Carolina spawning areas areunlikely to encounter significant salinities; however, levels typically encountered by eggsare not detrimental to survival <strong>and</strong> low salinity is considered optimal for water hardening(Albrecht 1964, Morgan et al. 1981).Temperature, DO <strong>and</strong> salinity appear to play important roles in determining larvalsurvival (Bain <strong>and</strong> Bain 1982). Larvae need a minimum <strong>of</strong> 3 mg/l to survive (Chittenden1971). Moderate reductions in DO (from 5 to 4 mg/l) reduced the survival <strong>of</strong> larvae(Turner <strong>and</strong> Farley 1971). A temperature range <strong>of</strong> 18 to 21°C (64 to 70°F) is consideredoptimal for larvae (Rogers et al. 1977). Temperatures <strong>of</strong> 12 to 23°C (54 to 73°F) aretolerated (Doroshev 1970). The optimal salinity range is 3-7 parts per thous<strong>and</strong> (ppt) but0-15 ppt are tolerated (Lal et al. 1977, Albrecht 1964).For early juveniles, optimal growth was reported to occur at temperatures <strong>of</strong> 14 to 21°C(57-70°F), with tolerance <strong>of</strong> a range 10-27°C (50°-81°F). Dissolved oxygen levelsrequired for high survival were 5 mg/l or above (Krouse 1968).Adults appear to have similar water temperature <strong>and</strong> DO requirements as juveniles.Preferred temperatures vary depending on the ambient acclimation temperature(Meldrim <strong>and</strong> Gift 1971), with maximum upper avoidance temperature (for adultsacclimated to 27°C, 81°F, in late August) <strong>of</strong> 34°C (93°F). Striped bass acclimated to 5°C(41°F) in December avoided 13°C (55°F) water. Merriman (1941) reported a preferredtemperature range <strong>of</strong> 25-27°C (77-81°F) during the growing season. Areas with hightemperatures <strong>and</strong> low DO may be unsuitable for use by adult striped bass (Coutant <strong>and</strong>Benson 1988, Kornegay 1988, Bales et al. 1991). Adult striped bass become restless atDO levels approaching 3 mg/l followed by inactivity, loss <strong>of</strong> equilibrium <strong>and</strong> death(Chittenden 1971). Striped bass <strong>of</strong> all ages are reported to avoid water with oxygenconcentrations less than 3-4 mg/l (Cheek et al. 1985, Coutant 1985).9.2.2 Water Quality Protection StatusPermit issuance to individuals <strong>and</strong>/or entities requesting permission to impact surfacewaters <strong>and</strong> wetl<strong>and</strong>s is granted by state <strong>and</strong> federal regulatory agencies (DWQ, DCM,ACOE). Resource agencies (WRC, DMF, USFWS) are given the authority to requestmodification or denial <strong>of</strong> projects when the design is perceived as having adverseimpacts to fisheries <strong>and</strong> aquatic resources. Basinwide water quality management plansprepared by the DWQ also identify specific water quality concerns within an individualwatershed.136
The EMC can classify areas with special water quality such as Outst<strong>and</strong>ing ResourceWaters (ORW), <strong>and</strong> these areas are given additional consideration <strong>of</strong> impacts prior toissuing development permits. In addition, the EMC can classify areas as NutrientSensitive Waters, <strong>and</strong> the Chowan River, Neuse River <strong>and</strong> Tar-Pamlico River basinshave been designated as such. In conjunction with this designation, Nutrient SensitiveWaters Strategy (NSWS) is developed <strong>and</strong> includes a 30% reduction in nitrogen loadingfrom agriculture, no net increase in phosphorous, protection for riparian areas,stormwater run<strong>of</strong>f control, <strong>and</strong> wastewater discharge st<strong>and</strong>ards.The CRC regulations do not allow authorization <strong>of</strong> projects that can violate water qualityst<strong>and</strong>ards or adversely affect the life cycle <strong>of</strong> estuarine resources. The CRC regulatesdevelopment activities in Areas <strong>of</strong> <strong>Environment</strong>al Concern, which include coastalwetl<strong>and</strong>s. Generally, no development is allowed in coastal wetl<strong>and</strong>s except waterdependent activities such as docks. The EMC manages wetl<strong>and</strong>s through the 401/404Certification Program, under the federal Clean Water Act. This program focuses onavoiding <strong>and</strong> minimizing filling <strong>of</strong> wetl<strong>and</strong>s <strong>and</strong> streams through review <strong>of</strong> all<strong>Environment</strong>al Assessments (EAs), Coastal Area <strong>Management</strong> Act (CAMA) majorpermit applications, <strong>and</strong> ACOE permit applications to determine if the project will violatewater quality st<strong>and</strong>ards.Regulations enacted for water quality protection by the EMC <strong>and</strong> the CRC must beconsistent with the authority <strong>of</strong> the CHPP.9.2.3 Water Quality ConcernsAn issue paper is presented in Section 10.2.2 relative to water quality concerns instriped bass management areas.10.0 PRI<strong>NC</strong>IPAL ISSUES AND MANAGEMENT OPTIONS10.1 Identification <strong>of</strong> IssuesMajor issues <strong>and</strong> management options developed during the Striped Bass FMP processare summarized in this section. <strong>Management</strong> issues in the striped bass fishery havebeen solicited from the public, the Albemarle/Roanoke Advisory Committee, theCentral/Southern Advisory Committee, the Marine Fisheries Commission, the WildlifeResources Commission, Finfish, Habitat <strong>and</strong> Water Quality <strong>and</strong> Regional AdvisoryCommittees, DMF, WRC, DENR, USFWS <strong>and</strong> the scientific community.The issues are presented in a series <strong>of</strong> issue papers <strong>and</strong> each has the following formatTitleIssueBackgroundCurrent AuthorityDiscussion<strong>Management</strong> Options/ImpactsResearch Needs137
DMF/WRC RecommendationAdvisory Committee RecommendationThe issues <strong>and</strong> options are divided into three sections 10.2. Issues relative to all <strong>NC</strong>striped bass stocks, 10.3. Issues relative to the A/R stock, <strong>and</strong> 10.4. Issuesrelative to the C/S stocks.10.2 Issues Relative to the North Carolina Striped Bass Stocks1. Habitat (Section 10.2.1)Water Flow (Section 10.2.1.1)Identify <strong>and</strong> Protect Critical Habitat- Spawning <strong>and</strong> Nursery Areas(Section 10.2.1.2)Blockages <strong>of</strong> Historical Spawning Habitat (Section 10.2.1.3)Entrainment <strong>and</strong> Impingement <strong>of</strong> Eggs/Larvae (Section 10.2.1.4)2. Water Quality (Section 10.2.2)Point <strong>and</strong> Non-Point Source DischargeHypoxia EventsBluegreen Algae BloomsPfiesteriaSummer Time ConditionsContaminants3. Catch <strong>and</strong> Release Mortality in the Hook <strong>and</strong> Line Fisheries(Section 10.2.3)4. Enforcement <strong>of</strong> Creel Limits (Section 10.2.4)5. ASMA Boundary Line (Section 10.2.5)10.3 Issues Relative to the A/R Striped Bass Stock1. Stock Structure (Section 10.3.1)Biological Reference Points- F msy <strong>and</strong> SSB Targets (Section 10.3.1.1)2. Fishing Mortality (Section 10.3.2)Commercial Gill Net Discard Mortality <strong>and</strong> Bycatch (Section 10.3.2.1)3. Harvest <strong>Management</strong> (Section 10.3.3)<strong>Management</strong> <strong>of</strong> Quota <strong>and</strong> Harvest Targets (Section 10.3.3.1)Recreational Harvest- Oregon Inlet Area (Section 10.3.3.2)10.4 Issues Relative to the C/S Striped Bass Stocks1. Stock Structure (Section 10.4.1)Biological Reference Points- F msy <strong>and</strong> SSB Targets (Section 10.4.1.1)138
2. Striped bass stocking programs (Section 10.4.2)3. Fishing Mortality (Section 10.4.3)<strong>Management</strong> Options-Recreational <strong>and</strong> Commercial Harvest /Catch CurveExploitation Estimates (Section 10.4.3.1)Commercial Gill Net Discard Mortality <strong>and</strong> Bycatch (Section 10.4.3.2)10.2 Issues <strong>and</strong> <strong>Management</strong> Strategies Relative to North Carolina StripedBass Stocks10.2.1 Habitat Issues10.2.1.1 Water Flow IssuesIssueTo identify impacts to riverine <strong>and</strong> estuarine aquatic habitats, in particular those used bystriped bass, which occur as a consequence <strong>of</strong> flow modifications, <strong>and</strong> developrecommendations <strong>and</strong> accompanying strategies to eliminate or minimize impacts. Itshould be noted that this issue applies not only to striped bass, but also to all aquaticresources adapted to using North Carolina’s coastal rivers <strong>and</strong> associated estuaries asresident, spawning <strong>and</strong>/or nursery habitats.BackgroundIt is intuitive that water is the lifeblood <strong>of</strong> aquatic habitats <strong>and</strong> the organisms, whichreside in them. It is perhaps less intuitive that not only the water itself, but also thequality, amount <strong>and</strong> delivery pattern are critical as well, especially for rivers <strong>and</strong> theirdownstream estuaries. Many <strong>of</strong> the factors which affect river flow may also affect waterquality. Water quality is addressed in another issue paper, but amount <strong>and</strong> deliverypattern to coastal rivers <strong>and</strong> estuaries are addressed here.Each river system in North Carolina has a characteristic pattern <strong>of</strong> water flow, calleddischarge (measured in cubic feet per second, or cfs). The discharge is the amount <strong>of</strong>water flowing downstream past a given cross section. This amount varies seasonally asa function <strong>of</strong> inflows to the river. Inflows include rainfall or melting snow, as well asgroundwater inputs. Flows in the coastal rivers in North Carolina generally exhibithighest levels in the winter <strong>and</strong> spring months, declining thereafter to lowest levelsduring summer <strong>and</strong> fall (see Figures 10.1-10.6). Discharge from North Carolina coastalrivers is in part a function <strong>of</strong> watershed extent, with the highest mean annual dischargesemanating from the largest watersheds (Table 10.1). River discharge should not beconfused with “point-source discharge,” which refers to the flow coming from a singlesource, usually an outfall pipe, into the river (see the water quality issue paper). Of the17 major river basins wholly or partially within North Carolina, 9 <strong>of</strong> them historicallysupported striped bass populations (Pasquotank, Chowan, Roanoke, Tar-Pamlico,Neuse, White Oak, Cape Fear (including the Northeast Cape Fear), Lumber <strong>and</strong>Yadkin-Pee Dee.139
The aquatic organisms which reside in rivers <strong>and</strong> estuaries have co-evolved with thepatterns <strong>of</strong> flow in North Carolina’s coastal rivers. Resident species such as largemouthbass <strong>and</strong> other sunfishes which construct nests in shallow waters depend on warmtemperatures <strong>and</strong> stable water levels for reproductive success. Anadromous species(those which spend most <strong>of</strong> their juvenile <strong>and</strong> adult life in the ocean, but are hatched<strong>and</strong> return to spawn in inl<strong>and</strong> rivers) depend on higher attractant flows in late winter <strong>and</strong>early spring, <strong>and</strong> spawn across a range <strong>of</strong> seasonally increasing water temperatures.Those species which have buoyant (floating) eggs are dependent upon flowing watersto oxygenate the eggs <strong>and</strong> convey larvae <strong>and</strong> postlarvae to downstream nursery areas.The general sequence <strong>of</strong> anadromous spawning in North Carolina’s coastal rivers,beginning in late January or early February <strong>and</strong> continuing through early July isshortnose sturgeon, hickory shad, alewife, blueback herring, American shad, stripedbass <strong>and</strong> Atlantic sturgeon, with some temporal overlap, but different habitat use,among the latter four species. The catadromous American eel ascends coastal rivers<strong>and</strong> streams in the glass eel or elver stage in February <strong>and</strong> March, <strong>and</strong> along with thelarval <strong>and</strong> post-larval stages <strong>of</strong> many other estuarine-dependent species, depends ontidal currents <strong>and</strong> the cues received from freshwater inflows to navigate to upstreamnursery areas. All juvenile anadromous species use the river <strong>and</strong>/or downstreamtemperatures, <strong>and</strong> accumulation <strong>of</strong> water in adjacent back swamps. Reservoirsconstructed for water supply <strong>and</strong>/or recreational purposes can alter downstream flowpatterns when water is retained for those purposes <strong>and</strong> not released downstream.Finally, flood control operations by the ACOE result in reduced maximum flows, butprolonged higher discharge levels, <strong>of</strong>ten for weeks at a time (such “controlled flood”operations occur on the Roanoke, Neuse <strong>and</strong> Cape Fear Rivers which are regulated byKerr, Falls <strong>and</strong> Jordan Reservoirs respectively). Water diversions alter flows in riverchannel segments (for example, the reach <strong>of</strong> the Roanoke River bypassed by theRoanoke Rapids Dam tailrace). Withdrawals <strong>of</strong> water from the river alter the flowestuary as their early nursery habitat. Most <strong>of</strong> them leave the system in the fall <strong>and</strong>move to the Atlantic Ocean to mature, although striped bass may remain in the systemfor years, <strong>and</strong> some may be resident, moving back <strong>and</strong> forth between the river <strong>and</strong>estuary.Disruptions to the historical patterns <strong>of</strong> flow, in volume <strong>and</strong>/or timing can render habitatunsuitable for use by fish <strong>and</strong> other aquatic organisms, or can significantly alter theextent <strong>of</strong> nursery or spawning habitats. Flow regimes can be altered by a number <strong>of</strong>human activities. Rozengurt <strong>and</strong> Haydock (1993) characterized the “four insidious Ds”<strong>of</strong> watershed management as dams, diversions, dewatering <strong>and</strong> decertifications.Hydropower operations may vary discharge patterns in a highly unnatural manner, overa short time period (for example, flows on the Roanoke River increasing from 2,000 cfsto as much as 18,500 cfs within a matter <strong>of</strong> hours), causing rapid changes in depth <strong>and</strong>temporarily below the intake, or permanently if the withdrawal is consumptive (notreturned to the river) or is discharged into another distant basin (an interbasin transfer,140
2000019000January 1912 - December 1950180001700016000150001400013000Discharge (cfs)1200011000100009000800070006000500040003000200010000Jan 1 - Jan 7Jan 8 - Jan 14Jan 15 - Jan 21Jan 22 - Jan 28Jan 29 - Feb 4Feb 5 - Feb 12Feb 12 - Feb 18Feb 19 - Feb 26Feb 26 - Mar 4Mar 5 - Mar 11Mar 12 - Mar 18Mar 19 - Mar 25Mar 26 - Apr 1Apr 2 - Apr 8Apr 9 - Apr 15Apr 16 - Apr 22Apr 23 - Apr 29Apr 30 - May 6May 7 - May 13May 14 - May 20May 21 - May 27May 28 - Jun 3Jun 4 - Jun 10Jun 11 - Jun 17Jun 18 - Jun 24Jun 25 - Jul 1Jul 2 - Jul 8Jul 9 - Jul 15Jul 16 - Jul 22Jul 23 - Jul 30Jul 30 - Aug 5Aug 6 - Aug 12Aug 13 - Aug 19Aug 20 - Aug 26Aug 27 - Sep 3Sep 3 - Sep 9Sep 10 - Sep 16Sep 17 - Sep 23Sep 24 - Sep 30Oct 1 - Oct 8Oct 8 - Oct 15Oct 15 - Oct 21Oct 22 - Oct 28Oct 29 - Nov 4Nov 5 - Nov 11Nov 12 - Nov 18Nov 19 - Nov 25Nov 26 - Dec 2Dec 3 - Dec 9Dec 10 - Dec 16Dec 17 - Dec 23Dec 24 - Dec 31WeekFigure 10.1. Weekly median discharges with corresponding 25 th <strong>and</strong> 75 thpercentiles measured at the U.S. Geological Survey gagingstation on the Roanoke River at Roanoke Rapids before <strong>and</strong>after construction <strong>of</strong> John H. Kerr Dam.40003750August 1976 - September 199935003250300027502500Discharge (cfs)2250200017501500125010007505002500Jan 1 - Jan 7Jan 8 - Jan 14Jan 15 - Jan 21Jan 22 - Jan 28Jan 29 - Feb 4Feb 5 - Feb 12Feb 12 - Feb 18Feb 19 - Feb 26Feb 26 - Mar 4Mar 5 - Mar 11Mar 12 - Mar 18Mar 19 - Mar 25Mar 26 - Apr 1Apr 2 - Apr 8Apr 9 - Apr 15Apr 16 - Apr 22Apr 23 - Apr 29Apr 30 - May 6May 7 - May 13May 14 - May 20May 21 - May 27May 28 - Jun 3Jun 4 - Jun 10Jun 11 - Jun 17Jun 18 - Jun 24Jun 25 - Jul 1Jul 2 - Jul 8Jul 9 - Jul 15Jul 16 - Jul 22Jul 23 - Jul 30Jul 30 - Aug 5Aug 6 - Aug 12Aug 13 - Aug 19Aug 20 - Aug 26Aug 27 - Sep 3Sep 3 - Sep 9Sep 10 - Sep 16Sep 17 - Sep 23Sep 24 - Sep 30Oct 1 - Oct 8Oct 8 - Oct 15Oct 15 - Oct 21Oct 22 - Oct 28Oct 29 - Nov 4Nov 5 - Nov 11Nov 12 - Nov 18Nov 19 - Nov 25Nov 26 - Dec 2Dec 3 - Dec 9Dec 10 - Dec 16Dec 17 - Dec 23Dec 24 - Dec 31WeekFigure 10.2.Weekly median discharges with corresponding 25 th<strong>and</strong> 75 th percentiles measured at the U.S. GeologicalSurvey gaging station on the Tar River at Rocky141
45004250August 1927 - December 1980400037503500325030002750250022502000175015001250100075050025001700016000January 1983 - September 19991500014000130001200011000100009000800070006000500040003000200010000Jan 1 - Jan 7Jan 8 - Jan 14Jan 15 - Jan 21Jan 22 - Jan 28Jan 29 - Feb 4Feb 5 - Feb 12Feb 12 - Feb 18Feb 19 - Feb 26Feb 26 - Mar 4Mar 5 - Mar 11Mar 12 - Mar 18Mar 19 - Mar 25Mar 26 - Apr 1Apr 2 - Apr 8Apr 9 - Apr 15Apr 16 - Apr 22Apr 23 - Apr 29Apr 30 - May 6May 7 - May 13May 14 - May 20May 21 - May 27May 28 - Jun 3Jun 4 - Jun 10Jun 11 - Jun 17Jun 18 - Jun 24Jun 25 - Jul 1Jul 2 - Jul 8Jul 9 - Jul 15Jul 16 - Jul 22Jul 23 - Jul 30Jul 30 - Aug 5Aug 6 - Aug 12Aug 13 - Aug 19Aug 20 - Aug 26Aug 27 - Sep 3Sep 3 - Sep 9Sep 10 - Sep 16Sep 17 - Sep 23Sep 24 - Sep 30Oct 1 - Oct 8Oct 8 - Oct 15Oct 15 - Oct 21Oct 22 - Oct 28Oct 29 - Nov 4Nov 5 - Nov 11Nov 12 - Nov 18Nov 19 - Nov 25Nov 26 - Dec 2Dec 3 - Dec 9Dec 10 - Dec 16Dec 17 - Dec 23Dec 24 - Dec 31Jan 1 - Jan 7Jan 8 - Jan 14Jan 15 - Jan 21Jan 22 - Jan 28Jan 29 - Feb 4Feb 5 - Feb 12Feb 12 - Feb 18Feb 19 - Feb 26Feb 26 - Mar 4Mar 5 - Mar 11Mar 12 - Mar 18Mar 19 - Mar 25Mar 26 - Apr 1Apr 2 - Apr 8Apr 9 - Apr 15Apr 16 - Apr 22Apr 23 - Apr 29Apr 30 - May 6May 7 - May 13Discharge (cfs)May 14 - May 20May 21 - May 27May 28 - Jun 3Jun 4 - Jun 10Jun 11 - Jun 17Jun 18 - Jun 24Jun 25 - Jul 1Jul 2 - Jul 8Jul 9 - Jul 15Jul 16 - Jul 22Jul 23 - Jul 30Jul 30 - Aug 5Aug 6 - Aug 12Aug 13 - Aug 19Aug 20 - Aug 26Aug 27 - Sep 3Sep 3 - Sep 9Sep 10 - Sep 16Sep 17 - Sep 23Sep 24 - Sep 30Oct 1 - Oct 8Oct 8 - Oct 15Oct 15 - Oct 21Oct 22 - Oct 28Oct 29 - Nov 4Nov 5 - Nov 11Nov 12 - Nov 18Nov 19 - Nov 25Nov 26 - Dec 2Dec 3 - Dec 9Dec 10 - Dec 16Dec 17 - Dec 23Dec 24 - Dec 31WeekFigure 10.3. Weekly median discharges with corresponding 25 th <strong>and</strong> 75 thpercentiles measured at the U.S. Geological Survey gagingstation on the Neuse River near Clayton before <strong>and</strong> after theconstruction <strong>of</strong> Falls Lake Dam.Discharge (cfs)WeekFigure 10.4. Weekly median discharges with corresponding 25 th <strong>and</strong>75 th percentiles measured at the U.S. Geological Surveygaging station on the Cape Fear River near Lillingtonbefore <strong>and</strong> after the construction <strong>of</strong> B. Everett JordanDam.142
2000August 1940 - December 19991900180017001600150014001300Discharge (cfs)1200110010009008007006005004003002001000Jan 1 - Jan 7Jan 8 - Jan 14Jan 15 - Jan 21Jan 22 - Jan 28Jan 29 - Feb 4Feb 5 - Feb 12Feb 12 - Feb 18Feb 19 - Feb 26Feb 26 - Mar 4Mar 5 - Mar 11Mar 12 - Mar 18Mar 19 - Mar 25Mar 26 - Apr 1Apr 2 - Apr 8Apr 9 - Apr 15Apr 16 - Apr 22Apr 23 - Apr 29Apr 30 - May 6May 7 - May 13May 14 - May 20May 21 - May 27May 28 - Jun 3Jun 4 - Jun 10Jun 11 - Jun 17Jun 18 - Jun 24Jun 25 - Jul 1Jul 2 - Jul 8Jul 9 - Jul 15Jul 16 - Jul 22Jul 23 - Jul 30Jul 30 - Aug 5Aug 6 - Aug 12Aug 13 - Aug 19Aug 20 - Aug 26Aug 27 - Sep 3Sep 3 - Sep 9Sep 10 - Sep 16Sep 17 - Sep 23Sep 24 - Sep 30Oct 1 - Oct 8Oct 8 - Oct 15Oct 15 - Oct 21Oct 22 - Oct 28Oct 29 - Nov 4Nov 5 - Nov 11Nov 12 - Nov 18Nov 19 - Nov 25Nov 26 - Dec 2Dec 3 - Dec 9Dec 10 - Dec 16Dec 17 - Dec 23Dec 24 - Dec 31WeekFigure 10.5. Weekly median discharges with corresponding 25 th <strong>and</strong> 75 thpercentiles measured at the U.S. Geological Survey gagingstation on the Northeast Cape Fear River near Chinquapin.Discharge (cfs)23000220002100020000190001800017000160001500014000130001200011000100009000800070006000500040003000200010000Jan 1 - Jan 7Jan 8 - Jan 14Jan 15 - Jan 21Jan 22 - Jan 28Jan 29 - Feb 4Feb 5 - Feb 12Feb 12 - Feb 18Feb 19 - Feb 26Feb 26 - Mar 4Mar 5 - Mar 11Mar 12 - Mar 18Mar 19 - Mar 25Mar 26 - Apr 1Apr 2 - Apr 8Apr 9 - Apr 15Apr 16 - Apr 22Apr 23 - Apr 29Apr 30 - May 6May 7 - May 13May 14 - May 20May 21 - May 27May 28 - Jun 3Jun 4 - Jun 10Jun 11 - Jun 17Jun 18 - Jun 24Jun 25 - Jul 1Jul 2 - Jul 8Jul 9 - Jul 15Jul 16 - Jul 22Jul 23 - Jul 30Jul 30 - Aug 5Aug 6 - Aug 12Aug 13 - Aug 19Aug 20 - Aug 26Aug 27 - Sep 3Sep 3 - Sep 9October 1927 - September 2000Sep 10 - Sep 16Sep 17 - Sep 23Sep 24 - Sep 30Oct 1 - Oct 8Oct 8 - Oct 15Oct 15 - Oct 21Oct 22 - Oct 28Oct 29 - Nov 4Nov 5 - Nov 11Nov 12 - Nov 18Nov 19 - Nov 25Nov 26 - Dec 2Dec 3 - Dec 9Dec 10 - Dec 16Dec 17 - Dec 23Dec 24 - Dec 31WeekFigure 10.6. Weekly median discharges with corresponding 25 th <strong>and</strong> 75 thpercentiles measured at the U.S. Geological Survey gagingstation on the Pee Dee River near Rockingham before <strong>and</strong>after the dam construction.143
Table 10.1.Characteristics <strong>of</strong> river basins supporting anadromous striped bass populations in North Carolina (<strong>and</strong>Virginia <strong>and</strong> South Carolina)(Burgess undated; <strong>NC</strong> Division <strong>of</strong> Water Quality 1999a-b, 2000, 2001a-c,2002).River Basin(north to south)PasquotankArea(sq. mi.)3,697 <strong>NC</strong>VAStream Miles478 <strong>NC</strong>Mean AnnualFlow (cfs)September Median Flow(cfs)Chowan1,378 <strong>NC</strong>4,061 VA5,439 Tot.788 <strong>NC</strong>Roanoke3,503 <strong>NC</strong>6,273 VA9,776 Tot.2,389 <strong>NC</strong> 8,500?Tar-Pamlico 5,440 <strong>NC</strong> 2,335Neuse 6,192 <strong>NC</strong> 3,440White Oak 1,233 <strong>NC</strong> 446Cape Fear (Northeast Cape Fear) 9,322 <strong>NC</strong> 6,049Lumber3,336 <strong>NC</strong>SC2,283 <strong>NC</strong>Yadkin-Pee Dee7,213 <strong>NC</strong>7,956 SC15,169 Tot5,989 <strong>NC</strong>13,555 SC19,544 Totfor example, the City <strong>of</strong> Virginia Beach’s removal <strong>of</strong> up to 93 cfs from the Roanoke Riverat Gaston Reservoir). Another potential source <strong>of</strong> impact to river flow patterns isgroundwater withdrawal, which can effect subsurface flow to river ecosystems.Withdrawals from shallow wells which intersect groundwater supplies maintaining riverbase flows could be detrimental, especially during low-flow periods. All <strong>of</strong> thesealterations may impact the cues which striped bass <strong>and</strong> other species require tosuccessfully complete their life cycles.A number <strong>of</strong> studies have been undertaken to quantify the relationship between riverflows <strong>and</strong> striped bass recruitment (Stevens 1977, Klauda et al. 1980, Mihursky et al.1981, Uph<strong>of</strong>f 1989, Rulifson <strong>and</strong> Manooch 1990, Zincone <strong>and</strong> Rulifson 1991). Stevens(1977) reported that in the Sacramento-San Joaquin Estuary, high survival <strong>of</strong> stripedbass coincides with moderately high river flows. He reported also that an unpublished144
study by the Maryl<strong>and</strong> Department <strong>of</strong> <strong>Natural</strong> Resources determined that seine haulcatch (for 1961-1971) <strong>of</strong> juvenile striped bass in the Potomac River was highlycorrelated with mean April-May river flow. However, similar relationships were not foundfor other parts <strong>of</strong> Chesapeake Bay. Klauda et al. (1980; reported in Versar 1990)concluded that striped bass year-class success in the Hudson River was directly orindirectly influenced by some combination <strong>of</strong> freshwater flow <strong>and</strong> water temperature justprior to <strong>and</strong> during spawning. Mihursky et al. (1981) determined that strong striped bassyear classes in the Potomac River estuary were correlated with colder than averagewinters (December) which were followed by above average spring (April) freshwaterrun<strong>of</strong>f to the estuary. They concluded that “...any significant diminution <strong>of</strong> springtimefreshwater discharge to the estuary would tend to decrease the probability <strong>of</strong> substantialrecruitment success.” Uph<strong>of</strong>f (1989) found that year-class success during 1980-1985was significantly related to rainfall <strong>and</strong> river flow during the early larval stage; however,the correlations were between those variables <strong>and</strong> striped bass postlarval dailymortality. There was no significant correlation between those variables <strong>and</strong> abundance.Over the period 1955 –1987, Rulifson <strong>and</strong> Manooch (1990) found striped bassrecruitment to be best (juvenile abundance index, hereafter JAI, > 5.0) for years inwhich Roanoke River flows were low to moderate (5,000 to 11,000 cfs) <strong>and</strong> poor(JAI 5.0) most closely resembled preimpoundmentflow conditions. When Roanoke River flow patterns were analyzed toassess the days within which a recommended flow regime (maintaining river dischargebetween the historical 25% low-flow <strong>and</strong> 75% high-flow values for the period March 1-June 30) had occurred, it was determined that the years <strong>of</strong> lowest JAI values were alsothose with the fewest days in which river flows were within the recommended bounds.Striped bass egg viability also was higher when discharges were within the bounds over50% <strong>of</strong> spawning period days, but less when days within bounds averaged 27%. Theauthors noted also that river flow directly influenced 1) seasonal timing <strong>and</strong> location <strong>of</strong>spawning; 2) daily or hourly patterns in spawning activity; 3) egg transport downstream;4) larval transport <strong>and</strong> feeding; 5) location <strong>of</strong> primary nursery grounds in AlbemarleSound; <strong>and</strong> 6) concentration <strong>and</strong> distribution <strong>of</strong> zooplankton (used as food by stripedbass postlarvae <strong>and</strong> juveniles). Further analysis by Zincone <strong>and</strong> Rulifson (1991)confirmed the relationship <strong>of</strong> striped bass JAI from Albemarle Sound correlating withRoanoke River flows <strong>and</strong> contended that good JAI years corresponded with years inwhich flows were closest to pre-impoundment flows. Leahy (1992) maintained therewere problems with the analysis which rendered the conclusions invalid; however,Zincone <strong>and</strong> Rulifson (1992) satisfactorily addressed his concerns.A number <strong>of</strong> authors have addressed the issue <strong>of</strong> assessing the alteration <strong>of</strong> river flow,as well as defining approaches to maintaining appropriate flows for sustainingproduction <strong>of</strong> natural resources (Richter et al. 1996, Richter et al. 1997, P<strong>of</strong>f et al. 1997<strong>and</strong> Silk et al. 2000). P<strong>of</strong>f et al. (1997) review the natural flow regime <strong>of</strong> unaltered rivers;human alteration <strong>of</strong> flow regimes; ecological functions <strong>of</strong> the natural flow regime;ecological responses to altered flow regimes; <strong>and</strong> recent approaches to streamflow145
management. They conclude that “…it is necessary to preserve the natural hydrologiccycle by safeguarding against upstream river development <strong>and</strong> damaging l<strong>and</strong> uses thatmodify run<strong>of</strong>f <strong>and</strong> sediment supply in the watershed”(P<strong>of</strong>f et al. 1997, p. 780). Newmethods for assessing the degree to which river ecosystems have undergonehydrologic alteration attributable to human influence (Richter et al. 1996) <strong>and</strong> for settingstreamflow-based river ecosystem management targets (Richter et al. 1997) also havebeen developed, <strong>and</strong> in fact are applied to the Roanoke River in both <strong>of</strong> thesepublications. Finally, Silk et al. (2000) considers the utility <strong>of</strong> reversing the traditionalapproach to instream flow water rights. Conventional instream flow approaches protectup to a specified level <strong>of</strong> flow to be left in a stream <strong>and</strong> indirectly allocate the remainingflows for water development. Silk et al. (2000) suggest that the reverse approach,directly specifying a level <strong>of</strong> water development <strong>and</strong> protecting the remaining flow in thestream, may be beneficial as an alternative approach or in combination with thetraditional approach.The remainder <strong>of</strong> this issue paper discusses the alterations to flow which have alreadyoccurred, or may potentially occur, in each North Carolina coastal river system whichhosts striped bass, <strong>and</strong> provides recommendations for mitigating or eliminating theirimpacts.Chowan River BasinThe Chowan River Basin lies in the northeastern coastal plain <strong>of</strong> North Carolina <strong>and</strong>southeastern Virginia. It is formed at the North Carolina-Virginia border by theconfluence <strong>of</strong> the Blackwater <strong>and</strong> Nottoway Rivers, <strong>and</strong> joined by the Meherrin River inNorth Carolina. Approximately 75 percent <strong>of</strong> the watershed lies in Virginia (<strong>NC</strong>DWQ2001a). The Chowan River empties into western Albemarle Sound. See Table 10.1 forcharacteristics <strong>of</strong> the basin.Striped bass use the Chowan River <strong>and</strong> tributaries to an unknown extent. Based on thedocumented presence <strong>of</strong> striped bass eggs <strong>and</strong>/or larvae, spawning has occurred in theMeherrin River both historically (Street et al. 1975) <strong>and</strong> more recently (in April1998,Gilbert Tripp, Chowan College, unpublished data; personal communication fromJ.W. Kornegay, <strong>NC</strong> Wildlife Resources Commission). However, no comprehensivestudy <strong>of</strong> the extent or magnitude <strong>of</strong> striped bass spawning migrations or nursery use <strong>of</strong>the Chowan River <strong>and</strong> its major tributaries (Blackwater, Meherrin <strong>and</strong> Nottoway) hasever been undertaken.There are a number <strong>of</strong> dams in the Chowan River basin, including the Baskerville <strong>and</strong>Camp Pickett Dams on the Nottoway <strong>and</strong> a hydropower dam on the Meherrin River atEmporia, Virginia. The latter facility began operation around 1908 <strong>and</strong> does practicepeak power generation. At present, the degree to which flows in the Chowan River <strong>and</strong>its major tributaries are regulated is unknown.Local Water Supply <strong>Plan</strong>s were submitted to the State <strong>of</strong> North Carolina by 21 watersystems in the basin. All <strong>NC</strong> water supply systems (three countywide <strong>and</strong> one regional)in the basin currently rely exclusively on groundwater (<strong>NC</strong>DWQ 2001a,b). Surface water146
withdrawals from the Chowan River are primarily for agricultural purposes. There is onemunicipal surface water withdrawal, for the City <strong>of</strong> Norfolk water supply, which iswithdrawn from the Blackwater River in the Virginia portion <strong>of</strong> the watershed.Roanoke River BasinThe Roanoke River Basin in Virginia <strong>and</strong> North Carolina occupies an area <strong>of</strong>approximately 9,776 square miles. The Roanoke River historically transported morewater than any other river in North Carolina, with an average annual flow <strong>of</strong> about 8,500cfs (Manooch <strong>and</strong> Rulifson 1989; Figure 10.1).Flow modifications which have altered discharge patterns on the Roanoke River havebeen discussed in detail in the reports <strong>of</strong> the Roanoke River Water Flow Committee(see Manooch <strong>and</strong> Rulifson 1989; Rulifson <strong>and</strong> Manooch 1990, 1991 <strong>and</strong> 1993). Flowsin the river were altered by the construction <strong>and</strong> operation <strong>of</strong> six dams located upstream<strong>of</strong> Roanoke Rapids (RM 137) beginning in 1950 with John H. Kerr Dam. Water flowregulation by the ACOE, operator <strong>of</strong> Kerr Dam, prevents the magnitude <strong>of</strong> preimpoundmentfloods; however, the unnatural, extended flooding during postimpoundmentyears adversely affected certain wildlife species, especially wild turkey,<strong>and</strong> likely reduced the survival <strong>of</strong> young striped bass <strong>and</strong> perhaps other anadromousspecies (Manooch <strong>and</strong> Rulifson 1989). Extremely low water releases are also thought tohave negatively impacted the survival <strong>of</strong> young striped bass <strong>and</strong> other anadromousspecies.Because <strong>of</strong> the dramatic declines in egg viability, juvenile abundance, estimatedpopulation size <strong>and</strong> adult striped bass l<strong>and</strong>ings which occurred during the late 1970's<strong>and</strong> early 1980's, fishery management agencies <strong>and</strong> Congress became concerned forthe future <strong>of</strong> this nationally significant resource. While there were undoubtedly multiplecontributing factors to the observed decline <strong>of</strong> striped bass on the Roanoke River,including deteriorating water quality <strong>and</strong> heavy fishing pressure (Manooch <strong>and</strong> Rulifson1989), it was clear that “...one <strong>of</strong> the major forces influencing the aquatic environment<strong>and</strong>, therefore, striped bass stocks [was] water flow.”The Roanoke River Water Flow Committee (RRWFC) was established in 1988specifically to address the issue <strong>of</strong> flows on the lower Roanoke River. The Committeeexamined pre- <strong>and</strong> post-impoundment water flows, <strong>and</strong> concluded that there had beensignificant changes in the river’s flow regime since impoundment, <strong>and</strong> especially since1977, as a consequence <strong>of</strong> hydropower peaking activities. Other investigations by theCommittee indicated that there were significant relationships between striped bass eggviability <strong>and</strong> the percentage <strong>of</strong> days in which flows on the river were within the historiclimits <strong>of</strong> flow variability. Flows for years in which the striped bass JAI was relatively highwere also more similar to pre-impoundment flows (Manooch <strong>and</strong> Rulifson 1989). Thework <strong>of</strong> the Committee ultimately resulted in the negotiation <strong>of</strong> a new flow regime forimplementation during the striped bass spawning period (presently April 1-June 15).The new flow regime, coupled with harvest controls, has coincided with improvedjuvenile striped bass recruitment, with the JAI reaching record high levels.147
Richter et al. (1996, 1997) used new approaches, the Indicators <strong>of</strong> Hydrologic Alteration(IHA) <strong>and</strong> Range <strong>of</strong> Variability Approach (RVA) respectively, to assess the degree towhich flows on the Roanoke River have been altered, <strong>and</strong> for determining instream flowtargets. The approaches rely on analysis <strong>of</strong> changes which occur in the fivefundamental characteristics <strong>of</strong> hydrologic regimes (see P<strong>of</strong>f et al. 1997 for definitions) 1)magnitude, the amount <strong>of</strong> water moving past a fixed location per unit time; 2) frequency,how <strong>of</strong>ten a flow above a given magnitude recurs over some specified time interval; 3)duration, the period <strong>of</strong> time associated with a specific flow condition; 4) timing orpredictability, the regularity with which flows <strong>of</strong> defined magnitude occur; <strong>and</strong> 5) rate <strong>of</strong>change or flashiness, how quickly flow changes from one magnitude to another.The results <strong>of</strong> the IHA analysis for the Roanoke reflect the effects <strong>of</strong> Kerr Reservoir <strong>and</strong>Roanoke Rapids Dam on downstream flows, showing severe effects on pulsingbehavior, elimination <strong>of</strong> high-magnitude flooding <strong>and</strong> prolonged multi-day maxima(Richter et al. 1996). The average duration <strong>of</strong> pulses was much shorter in the post-damthan pre-dam periods, which the authors attributed to hydropower operations. The effecton the hydrologic regime is to create a greater frequency <strong>of</strong> high <strong>and</strong> low pulses <strong>of</strong>lesser duration <strong>and</strong> also to increase the number <strong>of</strong> hydrograph rises <strong>and</strong> falls. Themagnitude <strong>and</strong> timing <strong>of</strong> the annual minima have changed, with the post-dam periodshowing a shift to lower mid-winter annual lows. The authors attribute this change to thecapturing <strong>of</strong> winter flows for later spring <strong>and</strong> summer use. The average rate <strong>of</strong> flowincrease was reduced in comparison to the pre-dam period. This change is attributed tothe fact that flow releases seldom exceed 20,000 cfs, which corresponds to the turbinecapacity at Roanoke Rapids. In the pre-dam period, flows commonly rose more than40,000 cfs in a single day, during rainstorms. Overall, variability <strong>of</strong> flows on theRoanoke has been reduced in summer <strong>and</strong> winter monthly means, in extremely lowwater conditions, in timing <strong>of</strong> the annual highs <strong>and</strong> lows, in high <strong>and</strong> low pulsedurations, <strong>and</strong> in frequency <strong>and</strong> rate <strong>of</strong> hydrograph rises <strong>and</strong> falls. However, coefficients<strong>of</strong> variation increased for springtime monthly means <strong>and</strong> long duration (30 <strong>and</strong> 90-day),high flow magnitudes. The authors concluded that their IHA analysis should directattention to assessing the effects <strong>of</strong> dam operations on fish populations, littoral-zonebenthic fauna, <strong>and</strong> floodplain forest communities (Richter et al. 1996). They recommendthat programs to monitor response to hydrologic restoration could follow two strategies1) continue to characterize the hydrologic regime using the IHA method, in order to lookfor expected decreases in the before <strong>and</strong> after deviations in IHA groups; <strong>and</strong> 2) directlymonitor the status <strong>of</strong> the targeted biota.The results <strong>of</strong> the RVA are reported in detail in Richter et al. (1997). Based upon theRVA analysis conducted for the Roanoke River, they recommended that operationsrules for Kerr Reservoir, including the “guide” curve, be modified to accomplish fiveprimary objectives 1) restore high-magnitude flooding; 2) shift the timing <strong>of</strong> the largestannual floods back into the spring (February-April) <strong>and</strong> shift the timing <strong>of</strong> annual lowflow extremes to early autumn (September-October); 3) decrease the frequencies <strong>of</strong>high <strong>and</strong> low pulses <strong>and</strong> increase their durations; 4) decrease the frequency <strong>of</strong>hydrograph reversals (shifts between rising <strong>and</strong> falling flow levels) attributable tohydropower operations; <strong>and</strong> 5) moderate the rate at which flow release rates rise or fall148
within or between days. They noted that some <strong>of</strong> the recommendations would entailmore than merely changing the way Kerr Reservoir is operated. Downstream measureswould be necessary to accomplish flood restoration on the Roanoke. The authors notethat a monitoring regime should be established for both flows <strong>and</strong> resources which aredependent upon them, including striped bass.Currently, a new group <strong>of</strong> agency, municipal <strong>and</strong> industry representatives are working todevelop a new flow regime for the lower river which will in part be based on the results<strong>of</strong> instream flow incremental analysis (IFIM). The Fisheries Technical Work Group wasformed as a part <strong>of</strong> the relicensing process for Dominion Generation’s (formerly VirginiaElectric <strong>and</strong> Power Company) Gaston <strong>and</strong> Roanoke Rapids Dams hydropoweroperations, <strong>and</strong> is currently negotiating a new regime which includes striped bass as anevaluation species.Outside <strong>of</strong> the striped bass spawning period, flows on the river remain altered by ACOEcontrolled floods <strong>and</strong> hydropower peaking operations. Hydropower operations dewaterthe portion <strong>of</strong> the river bypassed by the tailrace <strong>and</strong> cause extreme hourly <strong>and</strong> dailyfluctuations downstream <strong>of</strong> Roanoke Rapids Dam as a consequence <strong>of</strong> peakingoperations. Flood control operations conducted by the ACOE eliminate historic highdischarges, <strong>and</strong> cause prolonged flooding <strong>of</strong> adjacent floodplain areas, frequentlyduring periods <strong>of</strong> the year which such flood events did not historically occur. All <strong>of</strong> theseflow effects also impact the quality <strong>of</strong> habitat within the downstream nursery areas.Water supply in the basin is addressed in DWQ (2001b). Surface water is currently usedto meet most water needs in the <strong>NC</strong> portion <strong>of</strong> the basin (approximately 56 percent <strong>of</strong>estimated total water use). Water dem<strong>and</strong> from public systems in the North Carolinaportion <strong>of</strong> the basin is expected to increase 55 percent by 2020. Seven <strong>of</strong> the 43systems reported that available water supply was not adequate to meet the projected2020 dem<strong>and</strong>, <strong>and</strong> seventeen other systems indicated that 2020 dem<strong>and</strong> levels willexceed 80 percent <strong>of</strong> available supply.Water supply systems in other basins are also viewing the Roanoke as a potentialsource for future water supply. The City <strong>of</strong> Virginia Beach successfully planned <strong>and</strong>implemented a withdrawal from the Roanoke at Lake Gaston. There has also beendiscussion on the part <strong>of</strong> municipalities located in the Piedmont portion <strong>of</strong> NorthCarolina regarding additional interbasin transfers from the Roanoke. Currently, there are26 registered water withdrawals in the <strong>NC</strong> portion <strong>of</strong> the Roanoke River basin. Sixteen<strong>of</strong> these are surface water withdrawals. Excluding public water systems or powergenerating facilities, the cumulative permitted withdrawal capacity is 147.8 milliongallons per day (mgd; <strong>NC</strong>DWQ 2001b).Tar-Pamlico River BasinIn the Tar River, striped bass generally spawn from the City <strong>of</strong> Rocky Mount (RM 122)downstream to Bells Bridge (RM 94); however, their upstream migration is flowdependent.Median weekly discharge for the Tar River at Rocky Mount ranges from 399149
to 950 cfs during the months <strong>of</strong> April <strong>and</strong> May <strong>and</strong> generally declines over this timeperiod (Figure 10.2).Instream flow in the Tar River below Rocky Mount is determined in part by releasesfrom Tar River Reservoir (RM 130). It is a 1,860-acre water supply reservoir for the City<strong>of</strong> Rocky Mount constructed in 1970. The minimum flow requirement for water qualityaugmentation is 80 cfs, except during drought conditions when it is reduced to 65 cfs.Although Tar River Reservoir impacts downstream flow, there is little opportunity foraugmentation during the spring for anadromous fishes given the reservoir’s limitedstorage capacity.Flow downstream <strong>of</strong> Rocky Mount is further altered by Rocky Mount Mills Dam (RM122). This is a small privately-owned hydropower facility, which is currently operated asa peaking operation, resulting in frequent changes in downstream flow. As a result, riverdepth downstream can fluctuate as much as 1 ft over a short period <strong>of</strong> time. The dam isrequired to maintain a minimum release <strong>of</strong> 85 cfs; however, this requirement is notenforced. Significantly higher flows are needed during the months <strong>of</strong> March, April, <strong>and</strong>May for striped bass spawning; however, it is unrealistic in most years due to the dam’slimited storage capacity. Nevertheless, striped bass would benefit from the elimination<strong>of</strong> peaking operations during the spring, which would result in more natural flowsdownstream <strong>of</strong> the dam. Currently, a developer has proposed to convert Rocky MountMills into apartments, <strong>and</strong> as part <strong>of</strong> the negotiations the City <strong>of</strong> Rocky Mount, the cityhas requested that the dam be operated as a run-<strong>of</strong>-the-river facility.Other factors impacting instream flow within the basin are the withdrawals <strong>of</strong> surfacewater for the purposes <strong>of</strong> municipal drinking water <strong>and</strong> agricultural use. The WRCpersonnel have observed numerous agricultural water intake pipes located in the riverduring the growing season. Unlike municipal withdrawals, such agricultural withdrawalsare largely unregulated by the DWR. Municipalities currently withdrawing water includeEnfield, Franklinton, Greenville, Louisburg, Rocky Mount <strong>and</strong> Tarboro. Each <strong>of</strong> thesemunicipalities must submit a local water supply plan every five years to the DWR.Based upon 1997 local water supply plans, mean daily water dem<strong>and</strong> from municipalwater systems with existing surface water withdrawals in the Tar-Pamlico River basin isprojected to increase 25 percent by 2010 <strong>and</strong> 37 percent by 2020 (Table 10.2).Although a portion <strong>of</strong> the municipal water withdrawn is returned to the river in the form<strong>of</strong> wastewater, there is an overall net loss. In addition, as the dem<strong>and</strong> for waterincreases, not only are these systems exp<strong>and</strong>ing, new systems are being proposed.Furthermore, a portion <strong>of</strong> the basin (Beaufort, Edgecombe, Martin, Pitt, Washington <strong>and</strong>Wilson Counties) is within the Central Coastal Plain Capacity Use Area. The CentralCoastal Plain Capacity Use Area rules, which become effective August 1, 2002, willrequire entities that withdraw water from aquifers within the use area to reducegroundwater withdrawals over a 16-year period. As a result, more municipalities willconsider surface water as a supply source. Although each system withdrawing surfacewater must individually comply with the guidelines <strong>of</strong> the DWR, the cumulative impact <strong>of</strong>these withdrawals on the spawning habitat available to striped bass, <strong>and</strong> other species,must be considered.150
Neuse River BasinWith the removal <strong>of</strong> the Quaker Neck Dam near Goldsboro (RM 140) in 1998, anadditional 74 miles <strong>of</strong> historic spawning habitat upstream to Milburnie Dam near Raleigh(RM 214) became accessible to striped bass as well as other anadromous <strong>and</strong> residentspecies. However, this habitat is only accessible during years <strong>of</strong> moderate to high flows.During years with low flow, striped bass only migrate upstream as far as Smithfield (RM188) (Herndon et al. 2000; Bowman <strong>and</strong> Hightower 2001). Bowman <strong>and</strong> Hightower(2001) concluded that adequate flow is most critical for striped bass when they migrateabove the fall line (RM 184).Milburnie Dam, a small hydropower facility, is a run-<strong>of</strong>-the-river operation, <strong>and</strong> instreamflow downstream <strong>of</strong> Milburnie Dam is determined mainly by releases from Falls Dam(RM 230). Operated by the ACOE, Wilmington District, the dam impounds Falls <strong>of</strong> theNeuse Reservoir, which is managed for downstream flood control, municipal watersupply, water quality enhancement downstream <strong>of</strong> the dam (under low-flow conditions),<strong>and</strong> recreation. Riverine fish habitat downstream <strong>of</strong> the dam is not a currentconsideration. Minimum flow guidelines for downstream water quality augmentationfrom April through October are 100 cfs measured at the base <strong>of</strong> the dam <strong>and</strong> 254 cfsmeasured at the U.S. Geological Survey gauging station near Clayton. These minimumreleases are not sufficient to allow migration <strong>of</strong> striped bass upstream <strong>of</strong> Smithfield. It isestimated that a flow greater than 500 cfs at Clayton is needed to provide striped bassaccess to spawning habitat upstream <strong>of</strong> Smithfield (WRC, unpublished data). Prior tothe construction <strong>of</strong> Falls Dam, weekly median discharge during May was greater than570 cfs measured at Clayton (Figure 10.3). Since its construction, weekly medi<strong>and</strong>ischarge in May has been generally less than 492 cfs at Clayton. Furthermore,discharge typically declines throughout the spring, but in late spring discharge c<strong>and</strong>ecrease by an order <strong>of</strong> magnitude over a few days. Some <strong>of</strong> this change may be dueto natural variability; however, much <strong>of</strong> it is due to ACOE management practices. Thecurrent ACOE step-down guidelines range from approximately 500 to 1,000 cfs eachhour for the transition from high flow releases to lower flow releases, resulting in large,abrupt changes in flow. This problem is exacerbated during low water years <strong>and</strong> c<strong>and</strong>isrupt striped bass spawning activity, especially during the late spring. The impact <strong>of</strong>these fluctuations on striped bass spawning success <strong>and</strong> the subsequent survival <strong>of</strong>eggs <strong>and</strong> larvae is unknown.The flexibility <strong>of</strong> the ACOE in releasing flows from Falls Dam is constrained by thebackwater effect <strong>of</strong> Milburnie Dam. This backwater effect causes flows in excess <strong>of</strong>4,000 cfs to flood a subdivision located between Falls Dam <strong>and</strong> Milburnie. If MilburnieDam was not present, backwater effects would not occur <strong>and</strong> the ACOE would be ableto release sustained higher flows for fishery management purposes.151
Table 10.2.Current <strong>and</strong> projected water supply <strong>and</strong> dem<strong>and</strong> data (mgd) for municipal water systems with surface water intakes within the Tar River Basinbased upon 1997 Local Water Supply <strong>Plan</strong>s submitted to the N.C. Division <strong>of</strong> Water Resources (http://dwr32.ehnr.state.nc.us:81/cgibin/foxweb.exe/c:/foxweb/lwsp971).Municipal SurfaceSurface WaterSupplyTotal WaterSupplyProjected TotalWater SupplyMean DailyDem<strong>and</strong> aProjected MeanDaily Dem<strong>and</strong> aWater System Water Source 1997 1997 2010 2020 1997 2010 2020Franklinton New City Pond/Old City Pond 0.4 b 0.4 0.4 0.4 0.6 0.7 0.7Louisburg Tar River 2.0 2.0 2.0 2.0 1.5 0.8 0.9Rocky Mount Tar River/Tar River Reservoir 29.1 c 29.1 29.1 29.1 15.5 19.2 21.1Tarboro Tar River 12.0 12.0 12.0 12.0 3.2 3.7 3.9Greenville Tar River 22.5 22.9 d 31.4 31.4 11.9 16.6 18.6Enfield Fishing Creek 7.3 7.3 7.3 7.3 0.5 0.6 0.6a Includes service area dem<strong>and</strong>s <strong>and</strong> contract sales to other water systems.b Includes 0.3 mgd from New City Pond <strong>and</strong> 0.1 mgd from Old City Pond.c Includes 16.0 mgd from Tar River <strong>and</strong> 13.1 mgd from Tar River Reservoir.d Includes 0.4 mgd <strong>of</strong> groundwater.152
Also impacting instream flow downstream <strong>of</strong> Milburnie Dam are agricultural <strong>and</strong>municipal water supply withdrawals. The cumulative amount <strong>and</strong>/or impact <strong>of</strong>agricultural withdrawals are unknown. Based upon 1997 local water supply plans, me<strong>and</strong>aily water dem<strong>and</strong> from municipal water systems with existing surface waterwithdrawals in the Neuse River basin is projected to increase 36 percent by 2010 <strong>and</strong>58 percent by 2020 (Table 10.3). Municipal water withdrawals in the basin includeDurham, Raleigh, Clayton, Smithfield, Goldsboro <strong>and</strong> Wilson. As the dem<strong>and</strong> for waterincreases, these systems are exp<strong>and</strong>ing <strong>and</strong> new systems are being proposed. Further,the Central Coastal Plain Capacity Use Area rules (effective August 1, 2002) will requireentities that withdraw water from aquifers within the use area to reduce groundwaterwithdrawals over a 16-year period. Within the Neuse River Basin, the area includesCarteret, Craven, Greene, Jones, Lenoir, Pamlico, Pitt, Wayne <strong>and</strong> Wilson Counties. Asa result, more municipalities will consider surface water as a supply source. Forexample, Kinston-Lenoir County is already preparing to withdraw water from the Neusein the near future. The cumulative impact <strong>of</strong> these withdrawals combined withinadequate releases from Falls Reservoir could limit the spawning habitat available tostriped bass, especially during years with low flow.White Oak River BasinSeveral river systems are found within the White Oak River Basin including the New<strong>and</strong> White Oak rivers. These rivers are small coastal blackwater systems that dischargedirectly into the Atlantic Ocean (Table 10.1). The New River drains through the NewRiver Inlet, whereas the White Oak River drains through Bogue Inlet. A large portion <strong>of</strong>each drainage is tidally influenced. Although discharge data for these systems aresparse, flow is unregulated. Striped bass are known to occur in these systems;however, the extent <strong>of</strong> spawning is unknown <strong>and</strong> believed to be limited. Given theirunaltered flow regimes, negotiation <strong>of</strong> appropriate instream flow regimes is not an issuein the New or White Oak rivers. Nonetheless, every effort should be made to preservethe current unregulated flow regimes.Cape Fear River BasinInstream flow in the upper Cape Fear River is in part determined by releases from B.Everett Jordan Reservoir. Located on the Haw River (RM 4), it is 202 miles from themouth <strong>of</strong> the Cape Fear River. This reservoir is operated by the ACOE for the purposes<strong>of</strong> water supply, downstream flood control, water quality augmentation downstream <strong>of</strong>the dam, recreation <strong>and</strong> fish <strong>and</strong> wildlife conservation. Minimum flow required fordownstream water quality augmentation is 600 cfs measured at Lillington. Prior to theconstruction <strong>of</strong> B. Everett Jordan Dam, weekly median discharge during May rangedfrom 1,210 to 1,750 cfs, <strong>and</strong> since its construction, weekly median discharge in May hasbeen comparable ranging from 1,090 to 1,950 cfs (Figure 10.4).Downstream <strong>of</strong> Jordan Reservoir, there are four additional dams located on the CapeFear River. Buckhorn Dam (RM 188) is a hydropower facility, owned by ProgressEnergy, which was originally constructed to provide supplement storage for a153
Table 10.3.Current <strong>and</strong> projected water supply <strong>and</strong> dem<strong>and</strong> data (mgd) for municipal water systems with surface water intakes within the Neuse River Basinbased upon 1997 Local Water Supply <strong>Plan</strong>s submitted to the N.C. Division <strong>of</strong> Water Resources (http://dwr32.ehnr.state.nc.us:81/cgibin/foxweb.exe/c:/foxweb/lwsp971).MunicipalSurfaceSurfaceWater SupplyTotal WaterSupplyProjected TotalWater SupplyMean DailyDem<strong>and</strong> aProjected MeanDaily Dem<strong>and</strong> aWater System Water Source 1997 1997 2010 2020 1997 2010 2020Orange-Alamance Corporation Lake 0.4 0.5 b 0.5 0.5 1.1 1.6 2.2Hillsborough Lake Ben Johnson 0.7 0.7 3.7 3.7 1.8 2.2 2.6Durham Flat River/Little River 37.0 c 37.0 45.5 64.5 28.3 35.0 41.1Creedmoor Lake Rogers 0.8 0.8 0.8 0.8 0.3 0.3 0.3Butner J.D. Holt Reservoir 13.8 13.8 13.8 13.8 2.4 2.8 3.0Raleigh Falls Lake 72.0 72.0 89.0 89.0 55.2 69.6 80.1Johnston Co. Neuse River 12.0 12.0 d 14.5 14.5 3.0 7.7 10.5Smithfield Neuse River 6.0 6.1 e 6.0 6.0 2.1 4.6 4.8Goldsboro Neuse River 32.0 32.0 32.0 32.0 6.2 8.7 9.3Zebulon Little River 2.0 3.0 f 4.0 4.0 0.7 0.9 1.2Wilson Toisnot Reservoir/Wiggins Mill Reservoir 7.0 g 7.0 30.0 30.0 8.0 14.7 17.3a Includes service area dem<strong>and</strong>s <strong>and</strong> contract sales to other water systems.b Includes 0.1 mgd <strong>of</strong> groundwater.c Includes 19.0 mgd from Flat River <strong>and</strong> 18.0 mgd from Little River.d Includes
Table 10.4.Current <strong>and</strong> projected water supply <strong>and</strong> dem<strong>and</strong> data (mgd) for municipal water systems with surface water intakes within the Cape Fear RiverBasin based upon 1997 Local Water Supply <strong>Plan</strong>s submitted to the N.C. Division <strong>of</strong> Water Resources (http://dwr32.ehnr.state.nc.us:81/cgibin/foxweb.exe/c:/foxweb/lwsp971).Surface Water Total Water Projected Total Mean Daily Projected MeanMunicipalSurfaceSupply Supply Water Supply Dem<strong>and</strong> a Daily Dem<strong>and</strong> aWater System Water Source 1997 1997 2010 2020 1997 2010 2020Reidsville Lake Reidsville 19.0 19.0 19.0 19.0 3.4 8.1 8.4Burlington Lake Mackintosh/Stoney Creek 48.0 b 48.0 48.0 48.0 14.5 18.2 19.6Graham Graham-Mebane Lake 12.0 12.0 12.0 12.0 7.2 8.2 9.3Pittsboro Haw River 7.6 7.6 7.6 7.6 0.7 1.0 1.2Orange Co. WSA Cane Creek/University Lake 10.4 c 10.4 20.4 20.4 9.0 11.7 13.8Apex B. Everett Jordan Reservoir 3.7 3.7 9.2 11.0 1.8 5.6 8.9Cary B. Everett Jordan Reservoir 12.3 15.8 d 18.6 21.3 12.0 11.8 14.5Chatham Co. B. Everett Jordan Reservoir 6.0 6.0 12.0 12.0 0.8 3.2 4.2High Point City Lake/Oak Hollow Lake 21.4 e 21.4 31.4 31.4 15.5 22.3 26.0Greensboro Lake Br<strong>and</strong>t 36.0 f 36.0 71.0 71.0 40.3 50.5 58.0R<strong>and</strong>leman Polecat Creek 1.5 2.5 g 3.5 3.5 1.2 1.5 1.6Ramseur S<strong>and</strong>y Creek 6.6 6.6 6.6 6.6 0.6 0.9 1.0Robbins Bear Creek 1.5 1.5 1.5 1.5 0.8 0.8 0.9Goldston-Gulf SD Deep River 0.5 0.5 0.5 0.5 0.3 0.4 0.4Siler City Rocky River Lower Reservoir 3.8 3.8 5.8 5.8 2.8 3.4 3.7Lee Co. Deep River 1.5 1.5 1.5 1.5 0.8 0.9 0.9Sanford Cape Fear River 12.6 12.6 12.6 12.6 8.2 10.3 12.5Erwin Swift Textiles Reservoir 1.5 1.5 1.5 1.5 0.6 0.8 0.9Dunn Cape Fear River 8.0 8.0 8.0 8.0 4.6 5.6 5.7Harnett Co. Cape Fear River 12.0 13.3 h 13.3 13.3 10.0 18.2 22.9Carthage Nick's Creek 0.5 0.5 0.5 0.5 0.3 0.5 0.5Moore Co. Little River 1.5 1.5 1.5 1.5 0.1 0.1 0.2Fort Bragg Little River Reservoirs 20.0 20.0 20.0 20.0 7.6 7.6 7.6Fayetteville Big Cross Creek/Cape Fear 92.0 i 92.0 92.0 92.0 27.1 47.9 52.3Riegelwood SD Cape Fear River 1.0 1.0 1.0 1.0 0.6 0.6 0.6Lower Cape Fear WSA Cape Fear River 50.0 50.0 50.0 50.0 40.7 50.7 50.7Wilmington Cape Fear River 15.0 30.0 j 35.4 35.4 12.3 19.9 22.1aIncludes service area dem<strong>and</strong>s <strong>and</strong> contract sales to other water systems.bIncludes 26.0 mgd from Lake Mackinstosh <strong>and</strong> 12.0 mgd from Stoney Creek.cIncludes 8.0 mgd from Cane Creek <strong>and</strong> 2.4 mgd from University Lake.dIncludes 3.5 mgd purchased from City <strong>of</strong> Raleigh.eIncludes 8.6 mgd from City Lake <strong>and</strong> 12.8 mgd from Oak Hollow Lake.fDoes not include regular withdrawals from Lake Townsendg Includes 1.0 mgd purchased from City <strong>of</strong> Asheboro.h Includes 1.0 mgd purchased from City <strong>of</strong> Dunn <strong>and</strong> 0.3 mgd purchased fromJohnston County.i Includes 2.- mgd from Big Cross Creek, 85.0 mgd from Cape Fear River, <strong>and</strong>5.0 mgd from Glenville Lake.j Includes 15.0 mgd purchased from Lower Cape Fear WSA.155
downstream hydro facility. However, it is now used to ensure adequate water elevation(“head”) for the cooling water intake <strong>of</strong> the Progress Energy Cape Fear Steam <strong>Plan</strong>tupstream <strong>of</strong> the dam. Lock <strong>and</strong> Dam No. 1 (RM 67), Lock <strong>and</strong> Dam No. 2 (RM 100) <strong>and</strong>Lock <strong>and</strong> Dam No. 3 (RM 123) are operated by the ACOE for the purpose <strong>of</strong> navigationupstream to Fayetteville, with a navigable depth <strong>of</strong> 8 ft at low water. Although thesedams are impediments to fish migration, they function as run-<strong>of</strong>-the-river dams <strong>and</strong>have little impact on instream flow.Within the Cape Fear River Basin, instream flow is not currently considered a majorlimiting factor to either striped bass migration or spawning success (K.W. Ashley, WRC,personal communication). Weekly median discharge measured near Lillington rangesfrom 1,090 to 4,480 cfs during April <strong>and</strong> May (Figure 10.4).Municipal water withdrawals are the largest threat to instream flow in the Cape FearRiver. Based upon 1997 local water supply plans, mean daily water dem<strong>and</strong> frommunicipal water systems with existing surface water withdrawals in the Cape Fear RiverBasin is project to increase 39 percent by 2010 <strong>and</strong> 56 percent by 2020 (Table 10.4).This does not account for any new surface water withdrawals that may be permitted.Current water allocations from Jordan Reservoir include Cary-Apex, Chatham County,Holly Springs, Morrisville, Orange County <strong>and</strong> Wake County-Research Triangle Park.Other municipalities including Fayetteville, Durham, <strong>and</strong> Greensboro have expressed aninterest in future allocations from the reservoir. Downstream <strong>of</strong> Jordan Reservoir, majorsurface water withdrawals include Sanford, Harnett County, Fort Bragg, Fayetteville, theLower Cape Fear Water <strong>and</strong> Sewer Authority, <strong>and</strong> Wilmington. The practice <strong>of</strong>interbasin transfer further complicates this issue. For example, the Town <strong>of</strong> Caryreceives water from the Jordan Reservoir (Cape Fear Basin), yet its wastewater iscurrently discharged into Crabtree <strong>and</strong> Middle creeks (Neuse River Basin). In addition tomunicipal water withdrawals, industries including textile manufacturing, electrical powergeneration, paper production, <strong>and</strong> mining also use surface water. Within the Cape FearRiver Basin these include Progress Energy (multiple facilities), International Paper,DuPont, <strong>and</strong> DAK Monomers, LLC. All surface water withdrawals, both municipal <strong>and</strong>industrial, have to individually comply with the guidelines <strong>of</strong> the DWR. However, theaccumulative impact <strong>of</strong> these water withdrawals on instream fish habitat must beconsidered as local water supply plans are developed <strong>and</strong> revised within this regime.Pee Dee River BasinCurrently, flows on the Pee Dee are highly regulated by a chain <strong>of</strong> reservoirsconstructed primarily for hydropower operations by Progress Energy (Blewett Falls,Tillery) <strong>and</strong> Alcoa Corporation (four dams upstream <strong>of</strong> Tillery). All six projects arelicensed by the Federal Energy Regulatory Commission (FERC) <strong>and</strong> their licensesexpire in 2008. Both licensees recently convened Issue Advisory Groups (IAGs) tobegin the scoping <strong>and</strong> study identification process. Representatives <strong>of</strong> the FWS <strong>and</strong> theWRC, in cooperation with South Carolina agencies, will be participating on the IAGs <strong>and</strong>will be identifying flow issues which need to be addressed by the licensees. At this time,the agencies have requested the two licensees to collaborate on the development <strong>of</strong> aflow model which will cover the river from the uppermost dam downstream to the156
Winyah Bay estuary. Flow issues have not specifically been identified at this time;however based on personal observations, present patterns <strong>and</strong> quantities <strong>of</strong> waterreleased from the system are likely unsuitable for optimal use <strong>of</strong> the striped basshabitats located downstream <strong>of</strong> the dams (Figure 10.6).Current AuthorityNone <strong>of</strong> the federal or state fishery management agencies have the authority to regulateor specify flows. Such authority rests with the North Carolina DWQ <strong>and</strong> DWR, theACOE, <strong>and</strong> individual hydropower operators, subject to license under the FERC. Atpresent, the only river for which any sort <strong>of</strong> flow agreement is in effect, other thanprescribed minimum flow releases for individual dams (mostly for water qualitypurposes), is the Roanoke River where a Memor<strong>and</strong>um <strong>of</strong> Underst<strong>and</strong>ing betweenDominion Generation, the WRC <strong>and</strong> the ACOE specifies flow targets for release fromKerr Reservoir <strong>and</strong> Roanoke Rapids Dams during the period April 1 through June 15 <strong>of</strong>each year, for the maintenance <strong>of</strong> spawning flows for ecological purposes.DiscussionThe provision <strong>of</strong> appropriate quantity <strong>and</strong> seasonal delivery <strong>of</strong> freshwater flow fromupstream to downstream in every North Carolina river basin is clearly necessary formaintaining their function as important spawning <strong>and</strong> nursery habitats for striped basspopulations. Spawning adults require adequately high flows in the spring to reachspawning habitats <strong>and</strong> successfully reproduce; eggs require sufficient flows to remainsuspended <strong>and</strong> develop; larvae <strong>and</strong> postlarvae require adequate flows for transport todownstream nursery areas; <strong>and</strong> flows are required to maintain proper conditions forestuarine nursery grounds. In some cases, river systems (White Oak, New, NortheastCape Fear) are unregulated, <strong>and</strong> vigilance will be required to insure that they remainunregulated <strong>and</strong> that current flows are maintained. In other cases, rivers are regulatedto varying degrees for other purposes (Chowan, Roanoke, Tar-Pamlico, Neuse, CapeFear, Pee Dee), <strong>and</strong> negotiations must be undertaken to restore or secure appropriateflow regimes.<strong>Management</strong> OptionsGeneric <strong>Management</strong> Options for River Basins• No Action• For rivers which are presently unregulated work with North Carolina <strong>and</strong>/or Virginia<strong>and</strong> South Carolina water resource authorities as appropriate, to securecommitments for preservation <strong>of</strong> the unaltered flow regimes.• For rivers which are presently regulated to such a degree that flow patterns departsignificantly from an unregulated condition, establish a recommended annual flowregime for striped bass spawning <strong>and</strong> nursery areas, <strong>and</strong> work with the appropriateregulatory agencies to secure commitments for preservation <strong>of</strong> such a regime.• Require North Carolina Division <strong>of</strong> Water Resources to include Division <strong>of</strong> WaterQuality, Wildlife Resources Commission, Division <strong>of</strong> Marine Fisheries <strong>and</strong> US Fish<strong>and</strong> Wildlife Service in the local water supply planning process <strong>and</strong> in future water157
allocation negotiations. Where needed, water allocation for riverine fish habitat (inparticular striped bass spawning <strong>and</strong> nursery habitat) should be obtained by thesenatural resource agencies.Specific <strong>Management</strong> Options by River BasinNeuse River• Support removal <strong>of</strong> Milburnie Dam, to provide more flexibility for flow management• Conduct IHA <strong>and</strong> RVA analysis <strong>of</strong> Neuse River flows, <strong>and</strong> submit the resultant flowregime to the ACOE for implementation.Pee Dee River• Participate (USFWS <strong>and</strong> WRC, in cooperation with SC agencies) in the re-licensing<strong>of</strong> dams, with a goal <strong>of</strong> obtaining adequate quantity <strong>and</strong> timing <strong>of</strong> flow releases for alldownstream striped bass habitats.Research Needs• Conduct a new analysis <strong>of</strong> the relationship between Juvenile Abundance Index (JAI)in Albemarle Sound <strong>and</strong> Roanoke River flow to incorporate JAI values measuredduring the past decade, since previous analyses were conducted. Examine historicalstriped bass data sets from other North Carolina rivers to determine if sufficientinformation exists to evaluate relationships between striped bass life history stages<strong>and</strong> flows.• Should there be insufficient data to evaluate relationships between striped bass lifehistory stages <strong>and</strong> flows within a given river, such data should be collected for asufficient length <strong>of</strong> time to allow determination <strong>of</strong> such relationships, if desirable.• When implementing changes to flow regimes on any North Carolina river, conductappropriate field monitoring <strong>of</strong> striped bass life stages to document any response.• Conduct needed studies to further refine the relationship between striped bass lifestages, flow <strong>and</strong> habitat quality (i.e., the relationship between flows <strong>and</strong> the location<strong>and</strong> extent <strong>of</strong> spawning <strong>and</strong> nursery habitat(s) in the Tar, Neuse, Cape Fear <strong>and</strong>Pee Dee rivers)MFC, DMF, WRC <strong>and</strong> FWS <strong>Management</strong> RecommendationEndorse the management options <strong>and</strong> research needs, excluding the No Action option.A/R <strong>and</strong> C/S Advisory Committee RecommendationEndorse in concept the management options <strong>and</strong> research needs, excluding the NoAction management option.10.2.1.2 Critical Habitat- Spawning <strong>and</strong> Nursery AreaIssueProtection <strong>of</strong> critical habitat areas <strong>and</strong> identification <strong>of</strong> spawning <strong>and</strong> nursery areahabitat.158
BackgroundProtection <strong>of</strong> the quantity <strong>and</strong> quality <strong>of</strong> striped bass habitat, particularly areasdesignated as critical are essential to the goal <strong>of</strong> this plan. Increasing human activityacross North Carolina continues to have a significant influence on habitat quantity <strong>and</strong>quality as well as associated wildlife <strong>and</strong> fisheries resources. Habitat alterations havealready significantly impacted some resident wildlife populations either directly orindirectly. Wetl<strong>and</strong>s form a unique interface between terrestrial <strong>and</strong> aquatic ecosystems,providing valuable water related functions <strong>and</strong> important habitat for a broad range <strong>of</strong> fish<strong>and</strong> wildlife species. Major conversions <strong>of</strong> coastal <strong>and</strong> freshwater wetl<strong>and</strong>s haveoccurred due to agricultural <strong>and</strong> silvicultural expansion, industrial development, <strong>and</strong>urban encroachment, including resort communities. Development impacts in wetl<strong>and</strong>sare magnified due to the loss or disruption <strong>of</strong> these unique characteristics throughalternations <strong>of</strong> quantity or quality. It is estimated that North Carolina has already lost34% <strong>of</strong> its coastal wetl<strong>and</strong>s (DCM 1999), which are critical fisheries habitat. Habitatconservation <strong>and</strong> protection is directly related to environmental quality.Current AuthorityGeneral Statutes <strong>of</strong> North CarolinaG.S. 143B-289.52 Marine Fisheries Commission- powers <strong>and</strong> dutiesG.S. 143B-279.8 Coastal Habitat Protection <strong>Plan</strong>sG.S. 113-132 <strong>Management</strong> JurisdictionG.S. 113-129 North Carolina Wildlife Commission–powers <strong>and</strong> dutiesMarine Fisheries Commission RulesNorth Carolina Fisheries Rules for Coastal Waters (15A <strong>NC</strong>AC)3I .0101 (20), (C), <strong>and</strong> (D)- DefinitionsNorth Carolina Wildlife Resources RulesNorth Carolina Fisheries Rules for Inl<strong>and</strong> Waters (15A <strong>NC</strong>AC)10C.0500 Primary Nursery AreasDiscussionThe WRC, DMF <strong>and</strong> USFWS have no direct authority to delineate <strong>and</strong>/or enforceregulatory actions except creel, size, <strong>and</strong> method <strong>of</strong> fishing taken in critical habitatareas, unless endangered species are present. The WRC can designate waters Inl<strong>and</strong>Primary Nursery Areas (IPNA), however the WRC has no additional regulatory authorityin these areas. Permits in these areas are given additional consideration <strong>of</strong> impacts byother agencies prior to issuing development permits.The DMF has the authority to designate Critical Habitat Areas, Anadromous Spawning<strong>and</strong> Nursery Areas <strong>and</strong> regulate fishing activities in these areas. DMF has conductedanadromous spawning <strong>and</strong> nursery area surveys in the Albemarle Sound area, Tar-Pamlico, Neuse, White Oak, New <strong>and</strong> Cape Fear river systems. Except for the159
Albemarle Sound area, no directed surveys have occurred since the early 1980s. Figure9.3 shows the areas in each system that has been documented to function as spawning<strong>and</strong>/or nursery areas for striped bass. Although these areas have been identified byDMF, they have not been adopted into rule, making the designations only descriptions<strong>of</strong> the areas.The 1997 Fisheries Reform Act m<strong>and</strong>ates that DENR shall coordinate the preparation <strong>of</strong>Coastal Habitat Protection <strong>Plan</strong>s (CHPP) for critical fisheries habitats. The goal <strong>of</strong> theCHPPs shall be the long-term enhancement <strong>of</strong> coastal fisheries associated with coastalhabitat. The DMF, DWQ <strong>and</strong> DCM shall prepare the CHPPs, with assistance from otherfederal <strong>and</strong> State agencies. The plans shall (1) describe <strong>and</strong> classify biological systemsin the habitats, (2) evaluate the function, value to coastal fisheries, status, <strong>and</strong> tends <strong>of</strong>the habitats, (3) identify existing <strong>and</strong> potential threats to the habitats <strong>and</strong> the impact oncoastal fishing <strong>and</strong> (4) recommend actions to protect <strong>and</strong> restore habitats. The CHPPsmanagement units are Coastal Ocean, Albemarle, Chowan, Roanoke, Tar-Pamlico,Pamlico, Neuse, Core/Bogue, New/White Oak, Cape Fear <strong>and</strong> Southern Estuaries. TheMFC, EMC <strong>and</strong> the CRC will jointly approve these plans <strong>and</strong> all regulatory action mustbe consistent with approved CHPPs. All CHPPs must be completed by December 31,2004 <strong>and</strong> must be reviewed every five years.Waters classified as special water quality by the EMC such as Outst<strong>and</strong>ing ResourceWaters (ORW) are given additional consideration <strong>of</strong> impacts by DCM prior to issuingdevelopment permits. The EMC has designated the Chowan River, Neuse River <strong>and</strong>Tar-Pamlico River basins Nutrient Sensitive Waters <strong>and</strong> had developed NutrientSensitive Waters Strategy (NSWS) for both basins. The NSWS includes a 30%reduction in nitrogen loading from agriculture, no net increase in phosphorous,protection for riparian areas, stormwater run<strong>of</strong>f control, <strong>and</strong> wastewater dischargest<strong>and</strong>ards. Substantial reductions in nutrient loading have been achieved in the ChowanRiver Basin. Adherence to the rules already put in place <strong>and</strong> proposed by the EMC, aspart <strong>of</strong> the NSWS should slow the eutrophication in the Neuse <strong>and</strong> Tar-Pamlico basins.Regulations by the CRC do not allow authorization <strong>of</strong> projects that can violate waterquality st<strong>and</strong>ards or adversely affect the life cycle <strong>of</strong> estuarine resources. The CRCregulates development activities in Areas <strong>of</strong> <strong>Environment</strong>al Concern (AEC), whichinclude coastal wetl<strong>and</strong>s. Generally, no development is allowed in coastal wetl<strong>and</strong>sexcept water dependent activities, such as docks. The EMC manages wetl<strong>and</strong>s throughthe 401/404 Certification Program, under the federal Clean Water Act. This programfocuses on avoiding <strong>and</strong> minimizing filling <strong>of</strong> wetl<strong>and</strong>s <strong>and</strong> streams through review <strong>of</strong> all<strong>Environment</strong>al Assessments (EAS), Coastal Area <strong>Management</strong> Act (CAMA), <strong>and</strong> ACOEpermit applications to determine if the project will violate water quality st<strong>and</strong>ards.Although both DWQ <strong>and</strong> DCM are authorized to protect wetl<strong>and</strong>s <strong>and</strong> submerged l<strong>and</strong>s,dredging, filling <strong>and</strong> other shoreline modifications are permitted. Over 55% <strong>of</strong> NorthCarolina’s original wetl<strong>and</strong>s have been destroyed in the past 200 years. Estuarineshoreline continues to be armored at a rate <strong>of</strong> at least 25 mi/yr (<strong>NC</strong>CF 1997).Furthermore while these programs recognize the relatively greater biological value <strong>of</strong>nursery areas <strong>and</strong> outst<strong>and</strong>ing resource waters, they fail to adequately addresscumulative impacts from piecemeal development.160
The DMF/MFC <strong>and</strong> WRC authority is provided through North Carolina General Statutes<strong>and</strong> regulations. The DMF <strong>and</strong> WRC do have policies <strong>and</strong> statutory authority to• Provide comments <strong>and</strong> recommendation on proposals requiring State <strong>and</strong> Federalauthorization in the form <strong>of</strong> permits, licenses, or funding, which have impacts onwildlife <strong>and</strong> fisheries resources.• Participate in development <strong>of</strong> Federal plans, permits, <strong>and</strong> licenses, funding foractivities impacting the State’s wetl<strong>and</strong>s <strong>and</strong> aquatic resources.• Participate in development <strong>of</strong> State plans, permits, licenses, funding <strong>and</strong> policy <strong>and</strong>activities impacting the State’s wetl<strong>and</strong>s <strong>and</strong> aquatic resources.• Provide technical guidance <strong>and</strong> assistance to government agencies, <strong>and</strong> provideinformation to the public emphasizing values <strong>of</strong> wetl<strong>and</strong>s <strong>and</strong> aquatic ecosystems,<strong>and</strong> the need for their conservation.• Encourage development <strong>and</strong> enactment <strong>of</strong> comprehensive, regional <strong>and</strong> statewideplans for conservation <strong>and</strong> management <strong>of</strong> wetl<strong>and</strong>s <strong>and</strong> aquatic ecosystems.• Cooperate with the USFWS in compliance with provisions <strong>of</strong> the Fish <strong>and</strong> WildlifeCoordination Act <strong>and</strong> other legislation.<strong>Management</strong> Options• Advocate the adoption <strong>of</strong> DMF already identified anadromous spawning <strong>and</strong> nurseryareas for striped bass into rules.• Advocate stronger enforcement <strong>of</strong> regulations protecting critical habitat in themanagement areas.• Purchase l<strong>and</strong> adjacent to critical habitat areas to ensure that these areas areprotected. This should include the acquisition <strong>of</strong> approved refuge l<strong>and</strong>s on theRoanoke River.• Continue to make recommendations on all state, federal <strong>and</strong> local permits whereapplicable.• Support implementation <strong>of</strong> habitat recommendations <strong>of</strong> the Albemarle-PamlicoEstuarine Study, the Estuarine Shoreline Protection Stakeholders Report, CoastalHabitat Protection <strong>Plan</strong>s <strong>and</strong> Critical Habitat Protection <strong>Plan</strong>s.• Maintain, restore <strong>and</strong> improve habitat to increase growth, survival <strong>and</strong> reproduction<strong>of</strong> striped bass. Monies from the Clean Water Trust Fund <strong>and</strong> others should beutilized for this.Research Needs• Re-evaluate the spawning <strong>and</strong> nursery area surveys conducted previously.Identify potential incentives to l<strong>and</strong>owners for protection <strong>of</strong> riparian buffers in themanagement area.• Develop, identify <strong>and</strong> clarify what critical habitat needs are to protect, enhance <strong>and</strong>restore habitats <strong>and</strong> water quality utilized or required by striped bass.MFC, DMF, WRC <strong>and</strong> FWS <strong>Management</strong> RecommendationSupport the management options/impacts <strong>and</strong> research needs.A/R <strong>and</strong> C/S Advisory Committee <strong>Management</strong> RecommendationSupport the management options/impacts <strong>and</strong> the research needs.161
10.2.1.3 Blockages <strong>of</strong> Historical Spawning HabitatIssueTo identify blockages to historical spawning areas <strong>and</strong> develop strategies tominimize impacts from the blockages.BackgroundA blockage is defined as any man made or natural obstruction that impedes stripedbass trying to reach historical spawning areas. Mainstem dams occur in all coastalrivers in North Carolina. The lowermost dams are located around the fall line(transitional area between the piedmont <strong>and</strong> coastal plain) in the Meherrin, Roanoke,Nottoway, Tar <strong>and</strong> Neuse rivers (Hightower, 2001). Blockages are shown in Figure 9.1<strong>and</strong> Figure 9.2.Striped bass utilized the areas above the fall line for spawning, when flows were aboveaverage during the spawning run. This is evident by the fact that striped bass weretrapped in Kerr Reservoir when the dams were closed. Kerr Reservoir lies several milesabove the fall line on the Roanoke River. Striped bass routinely reach the base <strong>of</strong> damsblocking their migration when water flows are above average.It is probable that these blockages have had detrimental impacts to striped basspopulations in the Roanoke, Tar, Neuse, <strong>and</strong> Cape Fear rivers. Striped basspopulations declined in the 1980’s in these systems. Striped bass populations havemade a dramatic come back in the Roanoke system where water releases from KerrDam were altered to provide flows more conducive to striped bass spawning. It isthought the flow releases negotiated with the ACOE <strong>and</strong> Dominion Power are one <strong>of</strong> theprimary factors in restoring the Roanoke stocks.Chowan RiverThe Blackwater <strong>and</strong> Nottoway rivers form the Chowan River just after entering NorthCarolina. There are three dams located on the Nottoway River. The lowermost dam(Baskerville Mill Dam) currently blocks migrating anadromous fish (Odom et al. 1986).The next dam upstream (Camp Pickett Dam) may be within the historical range <strong>of</strong>anadromous fish but the third dam in the series is above an impassable waterfall (Odomet al. 1986). One low water dam is present on the Blackwater River, approximately 8miles above Franklin, VA. During normal spring flows this dam does not act as animpediment to anadromous fish (Mitchell Norman, VGIF, personal communication).Emporia Dam is the first blockage in the Meherrin River, a major tributary to theChowan. A fish lift was installed in 1990 to pass American Shad, but passage has beenminimal to date, due in part to design problems (J. W. Kornegay, <strong>NC</strong>WRC, personalcommunication). A second dam further upriver (Whittles Mill Dam) is considered to bebeyond the limit <strong>of</strong> migration for anadromous fish (Odom et al. 1986).Roanoke River162
Currently, numerous large <strong>and</strong> small dams are present in the upper reaches <strong>of</strong> theRoanoke River Basin. Roanoke Rapids Dam at river mile 137.5 is the lowermost dam onthe main stem <strong>of</strong> the river. Roanoke Rapids Dam impounds the reach to Gaston Dam atriver mile 145.5. Gaston Dam impounds the reach to river mile 170, below Kerr Dam atriver mile 179.5. Kerr Dam impounds the river up the Dan River to river mile 206, <strong>and</strong> upthe Staunton River to river mile 212 (Laney et. al. 2001).Cape FearIn the Cape Fear River, the lowermost obstructions to migration are the three locks <strong>and</strong>dams located within the coastal plain. Passage was attempted through a creek on thenorth side <strong>of</strong> the river during the 1960’s but failed ostensibly from attractant flows beingsufficient to draw fish into the creek channel. The first complete obstruction to migrationis Buckhorn Dam, which is located near the fall line. Buckhorn Dam is considered to bean obstruction to migration for striped bass in the Cape Fear River.Tar RiverThe lowermost dam on the Tar River (Rocky Mount Mill Dam) is an obstruction tomigration <strong>of</strong> striped bass, American shad, hickory shad, <strong>and</strong> blueback herring (Collier<strong>and</strong> Odom 1989). Two other Tar River dams further upstream are considered to bewithin the range <strong>of</strong> anadromous fish migration, but are not currently accessible (Collier<strong>and</strong> Odom 1989).NeuseThe first blockage in the Neuse River is currently Milburnie Dam at river mile 183. Thenext obstruction is Falls <strong>of</strong> Neuse Dam at river mile 195. A substantial amount <strong>of</strong>mainstem habitat was restored in 1998 with the removal <strong>of</strong> the Quaker Neck Dam nearGoldsboro (Bowman <strong>and</strong> Hightower 2001).Yadkin-Pee DeeAlthough not a North Carolina river the Pee Dee does have an anadromous run <strong>of</strong>striped bass. The first dam blocking this run is Blewett Falls, followed by Tillery, Falls,Badin, Tuckertown <strong>and</strong> High Rock. Historically, striped bass were found above all thesedams.Current AuthorityNeither DMF or WRC has authority covering existing dams unless a hydro-electricfacility comes up for relicensing. At this point both agencies would have certain rights<strong>and</strong> privileges to comment on settlement agreements submitted to the Federal EnergyRelicensing Commission (FERC). The Clean Water Trust Fund has monies available tobuy existing dams or have them opened for fish passage, <strong>and</strong> receive input from bothagencies on where fisheries priorities exist in the state.DiscussionChowan River163
Little is known <strong>of</strong> striped bass movement, numbers, or spawning in the Chowan,Blackwater or Nottoway rivers. Anecdotal information from anglers suggests that stripedbass are utilizing the Blackwater <strong>and</strong> Nottoway rivers. Spring electr<strong>of</strong>ishing samplinghas found few striped bass present in the Meherrin River below Emporia, Virginia (ChadThomas, <strong>NC</strong>WRC, personal communication).Roanoke RiverThe impacts <strong>of</strong> fish passage above Roanoke Rapids are difficult to predict. L<strong>and</strong>lockedpopulations <strong>of</strong> striped bass have been developed in many <strong>of</strong> the upstreamimpoundments, <strong>and</strong> are currently the focus <strong>of</strong> many anglers. Managers are currentlytrying to underst<strong>and</strong> potential beneficial <strong>and</strong>/or negative impacts to reservoir fisheriesassociated with passageTar RiverThere is a small hydro-dam located at the first upstream dam (Rocky Mount Mills Dam)in the Tar River, which conducts peaking operations to produce electricity. Removal <strong>of</strong>the dam is unlikely due to the fact that the City <strong>of</strong> Rocky Mount has a water supplyintake just above the dam <strong>and</strong> the dam is listed as a state historical site. Fish ladderswould allow striped bass access to an additional 20 miles <strong>of</strong> riverine habitat beforereaching the next dam. Utilization <strong>of</strong> this habitat would only be during periods <strong>of</strong> highflow, if then.Neuse RiverRemoval <strong>of</strong> Milburnie dam would allow the ACOE some latitude to provide a stable flowregime for the Neuse <strong>and</strong> provide access to another 10-20 miles <strong>of</strong> riverine habitat forspawning. The owner <strong>of</strong> the dam has recently expressed an interest in selling the dam.The DWQ has expressed concern over removal <strong>of</strong> Milburnie Dam, due to possible loss<strong>of</strong> wetl<strong>and</strong>s associated with the dam.Cape Fear RiverThe Cape Fear River may provide the best opportunity for remediation <strong>of</strong> obstructions.The ACOE operates three locks <strong>and</strong> dams in the coastal plain <strong>of</strong> North Carolina. TheCorps is willing to relinquish control <strong>of</strong> the upper two locks <strong>and</strong> dams if a suitable entitycan be found to maintain the associated l<strong>and</strong> surrounding the area. The Corps is alsoworking on fish passage for the lower most lock <strong>and</strong> dam, <strong>and</strong> is studying the necessityfor operating the structure in a manner that would not block spawning migration. TheCity <strong>of</strong> Wilmington does have a water intake structure above this facility, which wouldpresent some problems in opening the structure permanently.Yadkin-Pee DeeThe Yadkin chain <strong>of</strong> dams will be coming up for renewal under the Federal EnergyRegulatory Commission in the near future. The possibility exists that fish passage couldbe a part <strong>of</strong> the re-licensing process.Research Needs164
Chowan RiverNottoway, Blackwater <strong>and</strong> Meherrin rivers are tributaries to the Albemarle Sound<strong>Management</strong> Area. Investigations would determine if dams in this system were havingan impact on striped bass spawning. Investigate abundance <strong>and</strong> spawning contribution<strong>of</strong> striped bass in the Blackwater, Nottoway <strong>and</strong> Meherrin rivers. Manpower <strong>and</strong> moniesneed to complete surveys are lacking at this time <strong>and</strong> work will require adding additionalVirginia agencies to the management process.Roanoke RiverInvestigate the potential for passage <strong>of</strong> striped bass above Roanoke Rapids Dam. Otheranadromous species such as American shad <strong>and</strong> possibly sturgeon would benefit fromfish passage. Passage <strong>of</strong> some undesirable species is a possibility <strong>and</strong> approximatelyone to five million dollars would be required for a passage facility.Tar RiverInvestigate the feasibility <strong>of</strong> fish passage on Rocky Mount Mill Dam <strong>and</strong> Tar RiverReservoir Dam. Passage would add an additional 20-40 miles <strong>of</strong> spawning habitat but itis not clear at this time if passage would be beneficial to striped bass or to residentreservoir species.Yadkin-Pee DeeInvestigate the feasibility <strong>of</strong> fish passage above the Yadkin chain <strong>of</strong> dams in NorthCarolina. Passage would be costly but striped bass <strong>and</strong> other anadromous speciescould be restored to their historical range.MFC, DMF, WRC <strong>and</strong> FWS <strong>Management</strong> RecommendationNeuse RiverSupport the removal <strong>of</strong> Milburnie Dam in Raleigh. Removal <strong>of</strong> this dam would openanother 20 miles <strong>of</strong> spawning habitat <strong>and</strong> allow better manipulation <strong>of</strong> flows from Falls<strong>of</strong> the Neuse Reservoir for spawning anadromous species. It would be advantageous toAmerican shad <strong>and</strong> hickory shad spawning runs, in addition to striped bass.Cape Fear RiverSupport the removal <strong>of</strong> Buckhorn Dam <strong>and</strong> Lock <strong>and</strong> Dam No.2 <strong>and</strong> No.3 <strong>and</strong> a newfish passage route around Lock <strong>and</strong> Dam No.1. Striped bass would be able to return tohistorical spawning grounds. A striped bass <strong>and</strong> other anadromous species fisherywould be able to develop upstream.A/R <strong>and</strong> C/S Advisory Committee <strong>Management</strong> RecommendationEndorse the research needs <strong>and</strong> management recommendations regarding blockage <strong>of</strong>historical spawning habitats.10.2.1.4 Entrainment <strong>and</strong> Impingement <strong>of</strong> Eggs <strong>and</strong> LarvaeIssue165
Striped bass eggs, fry <strong>and</strong> juveniles are removed from coastal rivers through waterwithdrawals.BackgroundEach day in North Carolina, millions <strong>of</strong> gallons <strong>of</strong> water are pumped from coastal riversby industrial, municipal, <strong>and</strong> agricultural water users. During the striped bass spawningseasons, striped bass eggs <strong>and</strong> fry drifting downstream with river currents are subject tobeing suctioned out <strong>of</strong> the rivers through various water pumping systems. Juvenilestriped bass that have not fully developed their swimming abilities are also susceptibleto be removed via water intakes. Removal <strong>of</strong> these eggs, fry, <strong>and</strong> juveniles represents adirect loss in striped bass reproductive success.Current AuthorityWhenever an industrial or municipal water user proposes to install new withdrawalstructures or modify existing structures, permits from the ACOE <strong>and</strong>/or the DCM arerequired. The WRC <strong>and</strong> the DMF review the permit proposals <strong>and</strong> generally requestpermit conditions to minimize “entrainment” (drawing organisms into a system throughwater suction) or “impingement” (pinning organisms against a screen by water intakepressure). Agricultural water withdrawal structures are generally exempt from permitrequirements <strong>and</strong> the fisheries agencies therefore do not have an opportunity to seekmodification <strong>of</strong> equipment or operations to minimize losses <strong>of</strong> eggs <strong>and</strong> fry. The DWRrequires water users to register (no permit is required, just registration) with that agencyif withdrawals are greater than 1 million gallons per day for agricultural users or 100,000gallons per day for other users. New regulations enacted by the US <strong>Environment</strong>alProtection Agency (EPA) will eventually require new <strong>and</strong> existing major industrial waterwithdrawal facilities to use best available technology to reduce entrainment <strong>and</strong>impingement <strong>of</strong> aquatic organisms (USEPA Section 316(b) rules).DiscussionStriped bass eggs are approximately 3.5 mm (about 1/8 th <strong>of</strong> an inch) in diameter <strong>and</strong>drift downstream with river currents. Once hatched, striped bass fry are approximately 5mm (about ¼ inch) in length <strong>and</strong> 2 mm in cross section width. Striped bass fry also driftdownstream with river currents <strong>and</strong> until several days after hatching can swim onlysporadically in an upward motion. Not until 10 days or so after hatching, at a length <strong>of</strong>10 mm (about ½ inch), can the fry swim horizontally <strong>and</strong> then only in short distances.Once grown past the fry stage, juvenile striped bass do not develop strong swimmingabilities for several weeks. In summary, striped bass eggs, fry, <strong>and</strong> juveniles are unableto avoid being entrained into most water withdrawal systems. Once entrained, eggs, fry,<strong>and</strong> juveniles may be considered completely lost from the river. Even if the withdrawnwater is returned to the river (such as is the case with industrial cooling water), stripedbass are killed by high water pressure, turbulence, abrasion, <strong>and</strong> exposure to excessivetemperatures. Some intake structures are equipped with fine-mesh screens to excludefish eggs <strong>and</strong> larvae however the screens require constant cleaning with air <strong>and</strong> waterjets to remove debris. In many instances, fish eggs <strong>and</strong> fry may not be completelyentrained into the system but might be impinged on screens by water pressure. Little isknown about the survival rates <strong>of</strong> eggs <strong>and</strong> fry that are impinged, then released from166
screen cleaning operations, but damage from pressure <strong>and</strong> abrasion seems likely. Theimportance <strong>of</strong> egg, fry, <strong>and</strong> juvenile losses through water intakes is unknown however,for those striped bass populations in which spawners are few, these losses could besignificant.Although DWR requires registration <strong>of</strong> major water withdrawals, compliance withregistration requirements is not monitored therefore the full extent <strong>of</strong> withdrawals isunknown. A partial listing <strong>of</strong> major water withdrawal points by DWR indicateswithdrawals <strong>of</strong> approximately 50-100 million gallons per day (MGD) occur from RoanokeRiver below Roanoke Rapids Lake, 271 MGD from Tar River below Rocky Mount Millsdam, 40 MGD below Falls Lake dam on the Neuse River, <strong>and</strong> 1,655 MGD from CapeFear River below Jordan Lake dam.<strong>Management</strong> Options/Impacts• Continue to give close attention to state <strong>and</strong> federal permit requests in which waterwithdrawal structures are involved in coastal rivers. Agency comments on proposedwater intakes should, where data are available, provide estimates <strong>of</strong> striped basseggs, fry, <strong>and</strong> juveniles that could potentially be lost.• Monitor the progress <strong>of</strong> USEPA’s implementation <strong>of</strong> Section 316(b) rules as theserules may apply to water withdrawal points in North Carolina’s coastal rivers.• In the absence <strong>of</strong> effective exclusion technology, require water users to curtailwithdrawals during periods in which striped bass eggs, fry, <strong>and</strong> juveniles may bepresent.Research Needs• The magnitude <strong>and</strong> seasonal timing <strong>of</strong> agricultural water withdrawals from coastalrivers is unknown. Documentation <strong>of</strong> these withdrawals should be required byDivision <strong>of</strong> Water Resources <strong>and</strong> Division <strong>of</strong> Water Quality, so that the extent <strong>of</strong>entrainment <strong>of</strong> striped bass eggs, fry, <strong>and</strong> juveniles can be estimated.• Data on the density <strong>and</strong> distribution <strong>of</strong> striped bass eggs, fry, <strong>and</strong> juveniles in coastalrivers are needed so that potential losses can be estimated.• Identify effective engineering solutions to prevent entrainment <strong>and</strong> impingement <strong>of</strong>striped bass eggs, fry, <strong>and</strong> juveniles.• Research is needed to determine the fate <strong>of</strong> striped bass eggs, fry, <strong>and</strong> juvenilesthat are impinged, then released through screen cleaning operations.MFC, DMF, WRC <strong>and</strong> FWS <strong>Management</strong> RecommendationDMF <strong>and</strong> WRC have no direct authority to regulate facilities that withdraw water fromNorth Carolina’s coastal rivers. Our management recommendations are thereforelimited to those stated in the <strong>Management</strong> Options/Impacts section <strong>of</strong> this issue paper.A/R <strong>and</strong> C/S Advisory Committee RecommendationEndorse the management options/impacts <strong>and</strong> research needs regarding loss <strong>of</strong> stripedbass eggs, larvae <strong>and</strong> fry to water intakes.167
10.2.2 Water Quality ConcernsIssueIdentification <strong>of</strong> water quality concerns in the striped bass management areas.BackgroundGeneral concerns exist about point <strong>and</strong> non-point source discharges in each <strong>of</strong> thebasins relative to the striped bass populations. Issues specific to each watershed areindicated. Basinwide water quality management plans prepared by DWQ containspecific information on the individual watersheds.Current AuthorityGeneral Statutes <strong>of</strong> North Carolina143B – 279.8 Coastal Habitat Protection <strong>Plan</strong>143B – 289.52 Marine Fisheries Commission – powers <strong>and</strong> dutiesCoastal Area <strong>Management</strong> Act (G.S. 113A-100 through 113A-128), as amended, <strong>and</strong>the Fish <strong>and</strong> Wildlife Coordination Act (48 Stat. 401, as amended; 16 U.S.C. 661 etseq.).DiscussionPoint Source DischargesThe DWQ has the responsibility <strong>of</strong> ensuring that the waste limits in the NationalPollutant Discharge Elimination System (NPDES) permits are established to protectwater quality st<strong>and</strong>ards in receiving waters. NPDES permits contain effluent limitationsthat establish the theoretical safe level <strong>of</strong> various pollutants that may be discharged intosurface waters. Maintaining adequate levels <strong>of</strong> dissolved oxygen (DO) on a year-roundbasis is a major issue in all <strong>of</strong> coastal <strong>NC</strong>. For most <strong>of</strong> the State’s waters the dissolvedoxygen st<strong>and</strong>ard is 5.0 mg/L. Streams classified, as “swamp waters” by DWQ do notretain this level <strong>of</strong> protection, <strong>and</strong> are instead assigned acceptable DO levels on a caseby-casebasis. Because many <strong>of</strong> the rivers <strong>and</strong> tributaries in coastal river basins receivedrainage from swampl<strong>and</strong>, low DO <strong>and</strong> low pH characteristics can be naturallyoccurring. This further reduces the ability <strong>of</strong> these waters to buffer negative impactsarising from seemingly low levels <strong>of</strong> point <strong>and</strong> non-point source pollution. Thecumulative effects <strong>of</strong> multiple discharges in coastal North Carolina are <strong>of</strong> concern <strong>and</strong>DWQ has concluded that the past approach <strong>of</strong> assigning acceptable DO levels mayhave resulted in the over allocation <strong>of</strong> waste assimilative capacity <strong>of</strong> receiving waters.The DWQ has identified the need to develop a better method <strong>of</strong> assessing the ability <strong>of</strong>swamp waters to assimilate oxygen-consuming waste.The largest permitted outfall (approximately 80 MGD) in the A/R management area isfrom the Weyerhaeuser Paper Company, which operates a paper mill near Plymouth.The outfall originally discharged into Welch Creek until 1988 when it was relocated tothe mainstem Roanoke River. In the 1980s, dioxin, a carcinogen byproduct <strong>of</strong> the168
chlorine paper bleaching process <strong>and</strong> discharged in Weyerhaeuser’s effluent was foundto be accumulating in the tissues <strong>of</strong> fish living in the lower Roanoke River. It was notuntil 1994 that a complete modernization <strong>of</strong> the paper mill was instituted, rendering theuse <strong>of</strong> chlorine in the bleaching process obsolete. Although dioxin levels in fish tissuesare gradually decreasing, fish consumption advisories remain in effect in the A/Rmanagement area as a result, <strong>and</strong> Welch Creek <strong>and</strong> the lower Roanoke River will retainan impaired-waters listing until the advisory is removed. Other large paper millsdischarge effluents into the upper reaches <strong>of</strong> Roanoke River near Roanoke Rapids <strong>and</strong>to the Blackwater River in Virginia, a major tributary to the Chowan River.Point discharges are also a special concern in the CSMA systems, as the managementarea receives effluent from numerous municipal wastewater treatment plants. Some <strong>of</strong>the largest <strong>of</strong> these are permitted to the cities <strong>of</strong> Raleigh, Smithfield <strong>and</strong> Kinston on theNeuse River, Rocky Mount, Tarboro <strong>and</strong> Greenville on the Tar River <strong>and</strong> Fayetteville<strong>and</strong> Wilmington on the Cape Fear River. Major industrial discharges are also presentnear the mouths <strong>of</strong> the Neuse <strong>and</strong> Cape Fear rivers.In an attempt to enhance their abilities to provided potable water to their constituents,several coastal municipalities are considering the use <strong>of</strong> membrane technologies(reverse osmosis). Membrane processes produce two streams, the permeate stream(product water) <strong>and</strong> the by-product stream (concentrated brine effluent). One <strong>of</strong> themore practiced forms <strong>of</strong> concentrate disposal is via discharge to surface waters.Problem constituents in this effluent include hydrogen sulfide, chloride, fluoride, pH,nutrients (TP <strong>and</strong> TN), ammonia, dissolved oxygen, metals (copper, iron), radionuclides(Radium 226/228), conductivity <strong>and</strong> total dissolved solids. Research conducted nearreverse osmosis plant outfalls in Florida indicates concentrate discharges typically failtoxicity tests performed on invertebrate <strong>and</strong> vertebrate organisms indigenous to thereceiving waters (Andrews 2001). There are no existing reverse osmosis plants inoperation within the United States that function in aquatic systems similar to those foundin the coastal ecoregion <strong>of</strong> North Carolina. Currently, reverse osmosis plants areproposed or have been constructed in the counties <strong>of</strong> Camden, Pasquotank, Hyde,Tyrrell, Dare <strong>and</strong> Beaufort.Non-point dischargesSedimentation resulting from erodible agricultural fields, construction <strong>and</strong> developmentsites, unstable shorelines, woody debris removal <strong>and</strong> road construction adjacent towaters in coastal North Carolina degrades water quality <strong>and</strong> threatens fisheriesresources. In addition, increasing urbanization has intensified stormwater run-<strong>of</strong>fpollution within each river basin. This is especially the case in Dare <strong>and</strong> Currituckcounties in the A/R system which have experienced population growth in excess <strong>of</strong>100% between 1970-1980, <strong>and</strong> again from 1980-1990. Similar increases have beenobserved in Brunswick (43%), Pender (42%) <strong>and</strong> New Hanover (33%) counties in theC/S systems between 1990-2000. The losses <strong>of</strong> wetl<strong>and</strong>s <strong>and</strong> riparian buffer zones,which help to filter pollutants <strong>and</strong> settle out sediments, have an adverse impact on waterquality <strong>and</strong> fisheries resources in adjacent water bodies.169
Maintenance <strong>of</strong> good water quality in spawning <strong>and</strong> nursery habitats is essential to thewell-being <strong>of</strong> striped bass stocks. High concentrations <strong>of</strong> suspended solids (500-1000mg/L -1 ) significantly reduce hatching <strong>of</strong> striped bass eggs <strong>and</strong> survival <strong>of</strong> striped basslarvae (Auld <strong>and</strong> Schubel, 1978). An increase in water turbidity can also adversely affectthe ability <strong>of</strong> striped bass larvae to capture zooplankton prey, resulting in larvalstarvation or poor condition (Breitburg, 1988). When impacts on reproductive processesare severe, year-class strength, <strong>and</strong> ultimately recruitment <strong>of</strong> individuals to the fishery,is significantly reduced. <strong>Management</strong> strategies focused on the protection <strong>and</strong>maintenance <strong>of</strong> the water quality functions <strong>of</strong> wetl<strong>and</strong>s, specifically for nonpoint sourcepollutant abatement, need to be strengthened <strong>and</strong> enforced in coastal North Carolina.DWQ has identified the need for more widespread monitoring data to better assess theimpacts <strong>of</strong> nonpoint sources <strong>of</strong> pollution on water quality.Hypoxia EventsDissolved oxygen (DO) concentrations >5 mg/L are recommended for all life historystages <strong>of</strong> striped bass. As oxygen levels drop below this st<strong>and</strong>ard, potential populationimpacts include deformities <strong>and</strong> reduced hatch <strong>of</strong> striped bass eggs (Turner <strong>and</strong> Farley1971), yolk-sac larvae mortality (Rogers et al., 1980), mortality <strong>of</strong> juvenile striped bassat or below 3.0-3.6 mg/L (Chittenden, 1971; Coutant, 1985), <strong>and</strong> avoidance <strong>of</strong> waters byall ages <strong>of</strong> striped bass when dissolved oxygen falls below 3-4 mg/L (Cheek et al.,1985; Coutant, 1985).Numerous episodes <strong>of</strong> hypoxia (low dissolved oxygen) confirm that certain waterbodiesin coastal North Carolina can become stressed to the point that striped bass growth <strong>and</strong>survival may be impacted. For instance, during the summer <strong>of</strong> 1998, <strong>and</strong> undercurrently permitted biochemical oxygen dem<strong>and</strong> (BOD) loads, continuous water qualitymonitoring stations in Roanoke River indicated that the dissolved oxygen st<strong>and</strong>ard <strong>of</strong> 5mg/L was contravened for 21 consecutive days. Proposals to bring further industrialdevelopment to the Roanoke River are <strong>of</strong> great concern because <strong>of</strong> the existing tenuousDO conditions. DWQ has stated that “The Roanoke River model has consistentlypredicted that the BOD capacity <strong>of</strong> the system is exhausted.”(Mulligan, et. al 1993, inRoanoke River Water Flow Committee Report). Given the absence <strong>of</strong> additionalassimilative capacity, it is critical to the continued management <strong>of</strong> the A/R striped bassstock that no new BOD loads be permitted in the Roanoke River. Flood control <strong>and</strong>hydropower operations contribute to hypoxic conditions in Roanoke River. Prolonged<strong>and</strong> seasonal flooding <strong>of</strong> the extensive wetl<strong>and</strong>s adjacent Roanoke River causes DOlevels in the river to plummet when high BOD swamp waters suddenly enter the river atthe end <strong>of</strong> a water control action. Recurrent hypoxic events are also well documented inPamlico <strong>and</strong> Neuse rivers as well as Pamlico Sound <strong>and</strong> are linked to algae bloomsresulting from nutrient over-enrichment.Blue-green algae bloomsNutrient loading in coastal North Carolina from both point <strong>and</strong> nonpoint sources hasbeen problematic for decades as evidenced by the recurrence <strong>of</strong> blue-green algaeblooms in the lower Chowan River <strong>and</strong> western Albemarle Sound <strong>and</strong> the Pamlico <strong>and</strong>Neuse rivers as well as Pamlico Sound. Sources <strong>of</strong> nutrients include animal operations,170
cropl<strong>and</strong>, urban stormwater, fertilizer plants <strong>and</strong> wastewater treatment plants. Somewaters, such as the Chowan <strong>and</strong> Neuse rivers, have been classified as NutrientSensitive Waters by the EMC <strong>and</strong> receive special nutrient loading protection. Inprevious analyses <strong>of</strong> nutrient over-enrichment problems in Albemarle Sound, DWQidentified Roanoke River as a significant contributing source for nitrogen <strong>and</strong>phosphorus. An overabundance <strong>of</strong> nutrients, primarily nitrogen <strong>and</strong> phosphorus, undercertain conditions can stimulate the occurrence <strong>of</strong> nuisance algae blooms. Algaeblooms, through the processes <strong>of</strong> respiration <strong>and</strong> decomposition, deplete dissolvedoxygen in the water column <strong>of</strong>ten causing fish kills. Blue-green algae blooms are moresevere (covering a wider area <strong>and</strong> <strong>of</strong> longer duration) during years with heavy winter<strong>and</strong> spring rains followed by a dry summer. One important concern associated withblue-green algae blooms appears to be disruption <strong>of</strong> the food chain for young stripedbass. Evidence suggests that blue-green algae, which are not a suitable food source forsmall aquatic animals, can disrupt the food chain by displacing normal algaepopulations.PfiesteriaCoastal rivers <strong>and</strong> estuaries continue to experience eutrophication, summerstratification <strong>and</strong> associated hypoxia, especially in the shallow, poorly-flushed reaches<strong>of</strong> the Neuse <strong>and</strong> Pamlico Rivers (<strong>NC</strong>DWQ 1998). Although the relationship betweenhypoxia <strong>and</strong> pfiesteria is poorly understood, there is little argument that these twoconditions (alone or in conjunction) are responsible for the majority <strong>of</strong> fish kills in coastalNorth Carolina. The presence <strong>of</strong> pfiesteria-like organisms was observed in conjunctionwith a number <strong>of</strong> fish kill events in the 1990s, with most <strong>of</strong> these events involving largeschools <strong>of</strong> menhaden. The onset <strong>of</strong> a pfiesteria outbreak can kill fish in a matter <strong>of</strong>minutes. The sub-acute effects <strong>of</strong> pfiesteria include skin damage <strong>and</strong> ulceration, withdocumented chronic effects including decreased reproductive capacity, poor growthrates <strong>and</strong> an increased incidence <strong>of</strong> disease.Summertime ConditionsThe optimum temperature range for striped bass shifts to lower temperatures as the fishgrow; for first year juveniles it approaches 26 o C (78.8 o F), whereas it is near 20-24 o C(68-75 o F) for age-2 fish (Coutant <strong>and</strong> Carroll, 1980; Coutant et al., 1984). As adults,optimum water temperatures drop to 20-22 o C (68-71.6 o F), with avoidance <strong>of</strong>temperatures above 25 o C (77 o F) when cooler water is available (Schaich <strong>and</strong> Coutant,1980).Periods <strong>of</strong> excessively high water temperatures have been observed in the coastalwaters <strong>of</strong> North Carolina during the summer months. Although this condition is afunction <strong>of</strong> natural environmental processes <strong>and</strong> is not considered a type <strong>of</strong>degradation, the impacts <strong>of</strong> hot water on striped bass can be significant. In August1999, DWQ reported that approximately 21,000 adult striped bass died in AlbemarleSound <strong>and</strong> portions <strong>of</strong> Croatan Sound as a result <strong>of</strong> high water temperatures. Anextended period (August 5-August 28) <strong>of</strong> hot weather resulted in water temperaturesexceeding 29.4 o C (85 o F). In Albemarle <strong>and</strong> Pamlico sounds, persistent periods <strong>of</strong> hotweather, little wind, <strong>and</strong> low precipitation result in stratification <strong>of</strong> the estuarine water171
column. Saline water, which is denser than fresh water, layers the bottom <strong>and</strong> does notreadily mix with upper freshwater layers. This results in a depletion <strong>of</strong> oxygen within thebottom layers <strong>of</strong> the water column <strong>and</strong> with little wind aeration, an eventual oxygendepletion <strong>of</strong> the entire column. Excessive nutrient inputs into all <strong>of</strong> North Carolina’sestuaries with the accompanying overgrowth <strong>of</strong> microorganisms are known toexacerbate this summertime phenomenon.ContaminantsThe persistence <strong>of</strong> dioxins, mercury <strong>and</strong> other contaminants in our river basins canhave significant <strong>and</strong> adverse impacts on aquatic <strong>and</strong> terrestrial organisms, <strong>and</strong> whenabsorbed or ingested by humans, pose serious <strong>and</strong> life threatening consequences.Dioxins are unintentionally produced in many manufacturing <strong>and</strong> incineration processes<strong>and</strong> are some <strong>of</strong> the most carcinogenic substances known to man. Burton et al. (1983)analyzed the impacts <strong>of</strong> treated bleached Kraft mill effluent on striped bass prolarvae,<strong>and</strong> concluded that at volumes approaching 8-20%, mortality after 72 hours <strong>of</strong> exposurewas significant. In addition, because dioxins are chemically stable <strong>and</strong> bioaccumulatein animal tissues, organisms higher up in the food chain tend to have greaterconcentrations <strong>of</strong> the chemical. Dioxins do not mix with water, instead binding tightlywith sediment, food particles <strong>and</strong> organic matter, leaving extremely low concentrationsdissolved in the water. Due to the slow breakdown rate <strong>of</strong> dioxins, organisms (like largefish such as bass <strong>and</strong> bowfin) exposed to continuous sources <strong>of</strong> dioxins tend to havehigher levels in their tissues than fish that are lower in the food chain. Bioaccumulation<strong>of</strong> these substances in certain sections <strong>of</strong> the A/R management area has resulted in fishconsumption advisories being posted to warn the public <strong>of</strong> the health risks posed byeating fish. Research needs in the C/S systems include an assessment <strong>of</strong> thesediments in the lower Neuse <strong>and</strong> Pamlico rivers for the presence <strong>of</strong> contaminantsresulting from Hurricane Floyd. The DWQ has monitored dioxin levels in fish tissuesfrom the Roanoke River, Chowan River <strong>and</strong> Albemarle Sound since 1989. Fishconsumption advisories for the Roanoke River <strong>and</strong> Welch Creek have been in placesince 1990 <strong>and</strong> for Albemarle Sound since 1991. The current advisory, as <strong>of</strong> March2001, covers Welch Creek; the Roanoke River from the U.S. Highway 17 bridge nearWilliamston to the mouth <strong>of</strong> the Albemarle Sound; <strong>and</strong> Albemarle Sound from Bull Bayto Harvey Point <strong>and</strong> west to mouth <strong>of</strong> the Roanoke River <strong>and</strong> the mouth <strong>of</strong> the ChowanRiver at the US Highway 17 Bridge. The advisory reads, “Catfish <strong>and</strong> carp from thesewaters may contain low levels <strong>of</strong> dioxins. Women <strong>of</strong> childbearing age <strong>and</strong> childrenshould not eat any catfish or carp from this area until further notice. All other personsshould eat no more than one meal per person per month <strong>of</strong> catfish <strong>and</strong> carp from thisarea.”Methylmercury has been identified as the most toxic <strong>and</strong> widespread contaminantaffecting aquatic ecosystems in the United States (Wiener <strong>and</strong> Krabbenh<strong>of</strong>t, 1999).Atmospheric deposition <strong>of</strong> inorganic mercury (Hg) is the primary source <strong>of</strong>contamination. Certain water bodies can be classified as mercury sensitive, in thatrelatively small inputs <strong>of</strong> total mercury can seriously contaminate fish. Known mercurysensitive systems include wetl<strong>and</strong>s, low-alkalinity lakes, <strong>and</strong> surface waters that borderareas that are prone to flooding (Wiener <strong>and</strong> Krabbenh<strong>of</strong>t, 1999). In North Carolina,172
mercury contamination is problematic, leading to consumption advisories for largemouthbass, bowfin, <strong>and</strong> chain pickerel south <strong>and</strong> east <strong>of</strong> Interstate 85. Additionally, astatewide consumption advisory exists for bowfin due to elevated mercury levels.<strong>Management</strong> Options/ImpactsThe resource agencies (WRC, DMF, <strong>and</strong> FWS) do not issue permits to individuals<strong>and</strong>/or entities requesting permission to impact surface waters <strong>and</strong> wetl<strong>and</strong>s. Permitissuance is instead granted by state <strong>and</strong> federal regulatory agencies (DWQ, DCM,ACOE). For this reason, the suggested solutions listed below cannot be implementedwithout the assistance <strong>and</strong> oversight <strong>of</strong> the regulatory agencies responsible. However,the resource agencies are given the authority to request modification or denial <strong>of</strong>projects when the design is perceived as having adverse impacts to fisheries <strong>and</strong>aquatic resources.1. Eutrophication--Limit nutrient discharges which amplify algae blooms <strong>and</strong>stimulate growth <strong>of</strong> other aquatic vegetation that can negatively affect waterquality, cause fish kills, <strong>and</strong> restrict fishing <strong>and</strong> boating activities. Developnutrient discharge limits with DWQ <strong>and</strong> local soil <strong>and</strong> water conservation districts.2. Sediment discharges--Control sediment discharges into the watershed which aredetrimental to fish populations by affecting egg <strong>and</strong> larvae survival, health <strong>and</strong>condition <strong>of</strong> adults, <strong>and</strong> quality <strong>of</strong> spawning habitats. Sedimentation from erodibleagricultural fields, urban development, unstable shorelines <strong>and</strong> road constructionis exacerbated by the loss <strong>of</strong> wetl<strong>and</strong>s <strong>and</strong> vegetated riparian zones. Developsediment discharge limits with the <strong>NC</strong> Division <strong>of</strong> L<strong>and</strong> Quality <strong>and</strong> local soil <strong>and</strong>water conservation districts.3. Oxygen dem<strong>and</strong>ing effluents--Encourage DWQ to develop an accurate oxygenbudget for waters within each coastal river basin. Require existing <strong>and</strong> futuredischargers to comply with BOD limitations such that dissolved oxygen levels inbasin waters are not compromised.4. Anthropogenic fish kills--Limit anthropogenic-caused fish kills, such as thosecaused by livestock lagoon failures <strong>and</strong> other sewage discharges which severelyreduce fish abundance <strong>and</strong> eliminate or reduce spawning stock. This should alsoinclude assessment <strong>of</strong> effluents produced as a by-product <strong>of</strong> reverse osmosisfacilities.5. Impervious surface areas--Encourage the development <strong>and</strong> implementation <strong>of</strong>adequate stormwater management plans to minimize the use <strong>of</strong> impervioussurfaces in urban <strong>and</strong> developed areas.6. Riparian zones--Protect existing vegetated riparian zones <strong>and</strong> establish newbuffers along coastal waterways.7. Wetl<strong>and</strong>s-- Protect existing wetl<strong>and</strong> habitat from loss to development, encouragerestoration <strong>of</strong> prior converted wetl<strong>and</strong>s, <strong>and</strong> advocate creation <strong>of</strong> wetl<strong>and</strong> habitatwhere appropriate.8. Spawning/nursery areas--Protect spawning <strong>and</strong> nursery areas <strong>of</strong> resident <strong>and</strong>anadromous species from development practices, which degrade habitat quality.9. Shoreline hardening--Encourage developers to maintain shoreline in its naturalstate. When shoreline stabilization cannot be avoided, promote the use <strong>of</strong>shoreline protection that provides the least impact to aquatic organisms.173
Research conducted in coastal <strong>NC</strong> rivers by the WRC has determined that riprap(rock) shorelines support greater fish diversity <strong>and</strong> higher densities <strong>of</strong> fishes thanbulkhead shorelines.10. Interbasin transfer--Maintain status quo in coastal ecosystems by discouraginginterbasin water transfers. This activity has the potential to exacerbate existingwater quality conditions.Research Needs• Membrane Water Treatment <strong>Plan</strong>ts--Evaluate the impacts/effects <strong>of</strong> reverse osmosisplants on receiving waters <strong>and</strong> aquatic resources.• Water quantity--Evaluate the effects <strong>of</strong> existing <strong>and</strong> future water withdrawals onwater quality <strong>and</strong> quantity <strong>and</strong> fisheries habitat in coastal watersheds.• Contaminants--Determine if contaminants are presence <strong>and</strong> identify those that arepotentially detrimental to various life history stages <strong>of</strong> striped bass. Specific areas <strong>of</strong>concern include the lower Neuse, Pamlico <strong>and</strong> Roanoke rivers.MFC, DMF, WRC <strong>and</strong> FWS <strong>Management</strong> Recommendation• Work in coordination with agencies such as the Division <strong>of</strong> Water Quality (DWQ),Division <strong>of</strong> Water Resources, Division <strong>of</strong> L<strong>and</strong> Quality, <strong>and</strong> <strong>Natural</strong> ResourceConservation Service to maintain, restore <strong>and</strong> improve water quality to increasegrowth, survival <strong>and</strong> reproduction <strong>of</strong> striped bass. Priority activities identified includethe establishment <strong>of</strong> buffer strips <strong>and</strong> conservation easements within each basin,<strong>and</strong> the continued refinement <strong>of</strong> best management practices on l<strong>and</strong>s used primarilyfor agriculture, silviculture <strong>and</strong> industrial <strong>and</strong> residential development.• Support implementation <strong>of</strong> recommendations <strong>of</strong> DWQ basinwide water qualitymanagement plans, particularly measures that will reduce nutrient loading, sedimentdelivery <strong>and</strong> associated turbidity in all coastal watersheds.• Support implementation <strong>of</strong> habitat <strong>and</strong> water quality recommendations <strong>of</strong> CoastalHabitat Protection plans (CHPPs), the Estuarine Shoreline Protection Stakeholdersreport (1999), <strong>and</strong> the Albemarle-Pamlico Estuarine Study (1994) which includes theComprehensive Conservation <strong>and</strong> <strong>Management</strong> <strong>Plan</strong> (CCMP).• A/R <strong>and</strong> C/S Advisory Committee <strong>Management</strong> RecommendationSupport the recommendations <strong>and</strong> research needs.10.2.3 Catch <strong>and</strong> Release Mortality in the Hook <strong>and</strong> Line FisheriesIssueA portion <strong>of</strong> striped bass caught <strong>and</strong> released in the hook <strong>and</strong> line fisheries die as aresult <strong>of</strong> injuries or physiological stress.BackgroundIn order to categorize total annual mortality (or yearly removals) <strong>of</strong> striped bass, fisherymanagers must be able to assess <strong>and</strong> estimate the magnitude <strong>of</strong> significant sources <strong>of</strong>mortality. Observations, data collections, <strong>and</strong> review <strong>of</strong> scientific literature by WRC <strong>and</strong>DMF staff indicate that the practice <strong>of</strong> catch <strong>and</strong> release striped bass fishing mayconstitute a significant source <strong>of</strong> mortality. Resource managers <strong>and</strong> users need to174
consider what levels <strong>of</strong> catch <strong>and</strong> release losses are an acceptable component <strong>of</strong> thehook <strong>and</strong> line fishery.Current AuthorityNorth Carolina Marine Fisheries Commission RulesNorth Carolina Fisheries Rules for Coastal Waters (15A <strong>NC</strong>AC)3M .0100 FINFISH, GENERAL3M .0101 Mutilated Finfish3M .0200 Striped Bass3Q .0107 Special Rules, Joint Waters3Q .0108 <strong>Management</strong> <strong>Plan</strong>s for Striped Bass in Joint Waters3Q .0109 Implementation <strong>of</strong> Striped Bass <strong>Management</strong> <strong>Plan</strong>sRecreational FishingNorth Carolina Wildlife Resources Commission RulesNorth Carolina Fisheries Rules for Inl<strong>and</strong> Waters (15A <strong>NC</strong>AC)10C .0301 Inl<strong>and</strong> Game Fishes Designated10C .0302 Manner <strong>of</strong> Taking Inl<strong>and</strong> Game Fishes10C .0305 Open Seasons Creel <strong>and</strong> Size LimitsDiscussionSince the early 1990s, conservative striped bass creel limits have been in effect duringopen harvest seasons in the Albemarle Sound <strong>and</strong> Roanoke River Striped Bass<strong>Management</strong> Areas. The 2002 recreational management measures are presented inTable 10.5. As this striped bass population has grown, an extensive catch <strong>and</strong> releasefishery has developed both within <strong>and</strong> outside <strong>of</strong> the harvest seasons. During openharvest seasons, many anglers catch <strong>and</strong> retain their daily creel limit, then finish the daywith catching <strong>and</strong> releasing, sometimes large numbers <strong>of</strong> striped bass. Anglers <strong>of</strong>tenexpress the opinion that catching <strong>and</strong> releasing large numbers <strong>of</strong> striped bass aftertaking the daily creel limit substitutes for their desire <strong>of</strong> higher creel limits or “it makesthe trip worthwhile.” Still, other anglers enjoy catching <strong>and</strong> releasing striped bassregardless <strong>of</strong> whether the harvest season is open, expressing no desire to keep anystriped bass.A proportion <strong>of</strong> striped bass caught <strong>and</strong> released in the hook <strong>and</strong> line fisheries die as aresult <strong>of</strong> injuries or physiological stress. Hooking injuries that cause damage to the gillsor puncture the esophagus are <strong>of</strong>ten fatal. Striped bass that are bleeding heavily uponcapture generally die immediately (referred to as “initial mortality”) but many stripedbass that are apparently in good condition upon release die at a later time. The physicalexertion associated with being hooked, fought, dehooked, h<strong>and</strong>led, <strong>and</strong> releasedcauses the fish’s metabolic rate to increase greatly above normal limits <strong>and</strong> as a result,large amounts <strong>of</strong> lactic acid are produced with the muscle tissues. This severe conditionknown as “lactic acidosis” <strong>of</strong>ten causes death but death occurs slowly over a period <strong>of</strong>175
Table 10.5. <strong>Management</strong> measures for 2002 hook <strong>and</strong> line fisheries.Unit Agency Creel Size Limit Season OtherRoanoke River<strong>Management</strong> AreaWRC2 fish perperson per dayAlbemarle Sound<strong>Management</strong> AreaCentral/Southern<strong>Management</strong> Area(Inl<strong>and</strong>)Central/Southern<strong>Management</strong> Area(Coastal/Joint)DMFWRCDMF2 fish perperson per day3 fish perperson per day3 fish perperson per day18 inch (TL) <strong>and</strong>no fish between22 <strong>and</strong> 27inches (TL)During openseason, maypossess onedaily creel limit<strong>of</strong> striped bassany day <strong>of</strong> theweek18 inch (TL) Spring <strong>and</strong> Fallseason openedby proclamationwith 4 days <strong>of</strong>fishing per week18 inch (TL),except April –May upstream <strong>of</strong>Grimesl<strong>and</strong>Bridge on TarRiver <strong>and</strong>upstream <strong>of</strong>Hwy. 55 BridgeLenoir Countyon the NeuseRiver- No fishbetween 22 <strong>and</strong>27 inches (TL)Open year round18 inch (TL) Open year roundApril – JuneUpstream <strong>of</strong>Hwy. 258bridge- barblesshooks onlyseveral days (referred to as “delayed mortality”). Many anglers are under the falseimpression that if a striped bass caught <strong>and</strong> released swims away, then it will survivethe encounter.Extensive research has been conducted upon catch <strong>and</strong> release mortality <strong>of</strong> stripedbass <strong>and</strong> indicates that hooking location, bait type, <strong>and</strong> water temperature are the mainfactors influencing whether a caught <strong>and</strong> released striped bass will live or die. In ananalysis <strong>of</strong> hooking mortality <strong>of</strong> 1,275 striped bass in freshwater based on published<strong>and</strong> unpublished data, Wilde et al. (2000) found that bait type <strong>and</strong> water temperaturewere both significant predictors <strong>of</strong> hooking mortality. Mortality was greater in fishcaptured on natural baits than artificial lures <strong>and</strong> increased rapidly for both bait types aswater temperatures exceeded 25°C (77°F). The predictive model developed in thisanalysis, suggested that 50% <strong>of</strong> striped bass captured on natural bait die when watertemperatures reach 27°C (80.6°F). In controlled tank studies <strong>of</strong> Roanoke River stripedbass caught <strong>and</strong> released into large holding tanks, mean mortality rates were estimatedto be 6.4%, however at water temperatures exceeding 70 o F, mortality rates ranged upto 26.7% (Nelson 1998). In Albemarle Sound studies, survival <strong>of</strong> striped bass caught<strong>and</strong> released was lowest when water temperatures were high <strong>and</strong> dissolved oxygen low(Gearhart, 2002). Similar results (less than 10% mortality in cooler waters <strong>and</strong> up to40% mortality in warm waters) have been documented in studies in estuarine stripedbass populations in Massachusetts, Maryl<strong>and</strong>, <strong>and</strong> in reservoir striped bass in Texas.176
Hooking location <strong>and</strong> its relation to bait type also play a role in catch <strong>and</strong> releasemortality. In studies on Roanoke River, hooking in the esophagus (throat) <strong>and</strong> gut wasmuch more likely using natural bait than with artificial lures. Striped bass hooked in theesophagus, gut or gills had significantly greater mortality rates than fish hooked in thejaw or mouth. In Albemarle Sound studies (Gearhart, 2002), predictors <strong>of</strong> mortalityincluded bleeding, fish length, water temperature, hook removal, <strong>and</strong> dissolved oxygen.Overall, 57.1% <strong>of</strong> deep hooked striped bass died compared to 16.7% that were hookedin the mouth or gill <strong>and</strong> 2.7% for jaw hooked fish. Fish hooks that penetrate theesophagus may penetrate the heart or liver, which lie under the esophagus, causinginternal injury <strong>and</strong> bleeding. Gills damaged by hooks bleed pr<strong>of</strong>usely <strong>and</strong> may result inmortality because they contain major arteries directly from the heart supplying bloodflow to the gills for re-oxygenation. Some studies have suggested that catch <strong>and</strong> releasemortality <strong>of</strong> striped bass may be moderated by salinity; however, additional studies areneeded to clarify this relationship (Wilde et al. 2000).A significant catch <strong>and</strong> release fishery exists in Roanoke River near Weldon during thespring months. On a year-round basis, striped bass are caught <strong>and</strong> released inAlbemarle, Currituck, Roanoke, <strong>and</strong> Croatan sounds <strong>and</strong> tributary rivers, nearlyanywhere they tend to congregate (bridges, pilings, deep water, etc.). Hook <strong>and</strong> lineharvest is allowed year-round in the C/S <strong>Management</strong> Area. The 2002 managementmeasures are shown in Table 10.5. The extent <strong>of</strong> any catch <strong>and</strong> release fisheries thatmight exist in the Tar, Pamlico, Neuse, <strong>and</strong> Cape Fear river systems is currentlybelieved to be low in intensity. Marine Recreational <strong>Fishery</strong> Statistics Survey (MRFSS)angler interviews from the C/S area from 1987 through 2001 identified few anglerstargeting striped bass however the area <strong>of</strong> coverage <strong>of</strong> the MRFSS does not extendupstream to areas where concentrated striped bass catch <strong>and</strong> release fishing mightoccur. Because data on the extent <strong>of</strong> the catch <strong>and</strong> release fishery in the CSMA iseither absent or incomplete, commitment <strong>of</strong> resources to implement creel surveys willbe necessary to fully underst<strong>and</strong> the magnitude <strong>of</strong> this issue.Both WRC <strong>and</strong> DMF estimate the numbers <strong>of</strong> striped bass caught <strong>and</strong> released duringthe open harvest seasons in Roanoke River <strong>and</strong> Albemarle Sound. Whenever fundinghas been available, WRC has conducted creel surveys after closure <strong>of</strong> the striped bassharvest season on Roanoke River. In May 2002, DMF initiated a study to estimateangling effort <strong>and</strong> numbers <strong>of</strong> striped bass caught <strong>and</strong> released in the ASMA duringperiods closed to harvest. Considering the numbers <strong>of</strong> striped bass caught <strong>and</strong> releasedduring the harvest seasons <strong>and</strong> during those instances in which post-harvest seasonnumbers have been estimated (Tables 10.6 <strong>and</strong> 10.7), WRC <strong>and</strong> DMF staffs believe thelosses from these fisheries may be substantial.177
Table 10.6.Estimated numbers <strong>of</strong> striped bass harvested <strong>and</strong> caught <strong>and</strong> released from the Roanoke RiverStriped Bass <strong>Management</strong> Area, 1991-2002.Roanoke River Striped Bass <strong>Management</strong> AreaYear Number Striped Bass HarvestedNumber caught <strong>and</strong> releasedharvestseasonNumber caught <strong>and</strong> releasedpostharvest season1991 26,934 98,148 no data1992 13,372 23,710 no data1993 14,325 56,791 no data1994 8,284 3,826 no data1995 7,471 6,892 52,6981996 8,367 15,230 148,2221997 9,364 10,748 271,3281998 23,109 87,679 102,2991999 22,479 50,161 113,3942000 38,206 93,148 no data2001 35,231 71,003 no data2002 36,422 55,775 no data<strong>Management</strong> Options/Impacts• To reduce catch <strong>and</strong> release mortality <strong>of</strong> striped bass, seasonal fishing restrictionscould be implemented to prohibit recreational harvest during warm weather. Theserestrictions are already in place in the Roanoke River/Albemarle Sound fisheries thathave spring (Roanoke River) <strong>and</strong> fall seasons (Albemarle Sound). New restrictionswould have minimal effects in the Roanoke River/Albemarle Sound <strong>Management</strong>Areas, but would affect other systems that currently have a year-round fishery.Table 10.7.Estimated numbers <strong>of</strong> striped bass harvested <strong>and</strong> caught <strong>and</strong> released from the Albemarle SoundStriped Bass <strong>Management</strong> Area, 1991-2002.Albemarle Sound <strong>Management</strong> AreaYearNumber striped bass Number caught <strong>and</strong> releasedharvestseasonpost harvest seasonNumber caught <strong>and</strong> releasedharvested1991 14,395 23,540 17,9971992 10,562 19,981 24,8441993 a 11,404 7,540 5,7011994 b 8,591 971 no data1995 7,343 no data no data1996 7,433 11,865 (Fall only) no data1997 6,901 30,771 no data1998 19,566 91,888 no data1999 16,967 40,321 no data2000 38,085 78,841 no data2001 40,127 61,417 no data2002 27,896 51,555 Not availableaSurvey conducted from January – June 1993.bSurvey conducted only during the open harvest season• To reduce catch <strong>and</strong> release mortality <strong>of</strong> striped bass, the use <strong>of</strong> natural bait (live orcut herring, shad, crab, <strong>and</strong> eels) could be restricted in specific areas or during178
specific seasons. This would be very unpopular with anglers accustomed to highstriped bass catch rates using live or cut bait.• In order to reduce h<strong>and</strong>ling time, the use <strong>of</strong> barbless hooks or circle hooks could berequired in specific areas or during specific seasons. A public education programwould be required to demonstrate the conservation benefits <strong>of</strong> using new hookconfigurations.Research Needs• Clarify relationship between salinity, dissolved oxygen, temperature <strong>and</strong> catch <strong>and</strong>release.• Mortality rates <strong>of</strong> striped bass in the Albemarle Sound <strong>and</strong> Central/Southern rivers<strong>and</strong> sounds.• Determine the seasonal magnitude <strong>of</strong> striped bass angling effort, catch, <strong>and</strong> harvestfor North Carolina rivers <strong>and</strong> coastal waters outside the Roanoke River/ AlbemarleSound <strong>Management</strong> Areas.DMF, WRC <strong>and</strong> FWS <strong>Management</strong> RecommendationSupport the management recommendations <strong>and</strong> research needs.• The numbers <strong>of</strong> striped bass caught <strong>and</strong> released on a year-round basis may besubstantial. Creel surveys will be necessary to estimate numbers <strong>of</strong> striped basscaught <strong>and</strong> released as well as directed angling effort for striped bass. Oncenumbers <strong>of</strong> striped bass caught <strong>and</strong> released are estimated, differential mortalityrates from other studies can be applied to those numbers to estimate catch <strong>and</strong>release mortality. These estimates are necessary as a part <strong>of</strong> estimating total annualfishing mortality, the management <strong>of</strong> which is imperative to the long-termperpetuation <strong>of</strong> the stock. WRC <strong>and</strong> DMF agree that catch <strong>and</strong> release fishing forstriped bass is an acceptable component <strong>of</strong> the recreational fishery however, untilthe magnitude <strong>of</strong> striped bass losses from this component is estimated, objectivepolicy decisions concerning acceptable levels <strong>of</strong> striped bass losses cannot bemade.• Observations by WRC <strong>and</strong> DMF indicate that directed angling effort for striped bassdiminishes significantly once harvest seasons are closed in both the Roanoke River<strong>and</strong> Albemarle Sound Striped Bass <strong>Management</strong> Areas. Therefore, as an interimmeasure to minimize striped bass mortality from catch <strong>and</strong> release fishing, WRC <strong>and</strong>DMF recommend that striped bass harvest seasons be considered in months(October – April) in which cool water temperatures (
A/R <strong>and</strong> C/S Advisory Committee <strong>Management</strong> RecommendationConcur <strong>and</strong> support the management recommendations <strong>and</strong> the research needs.MFC <strong>Management</strong> RecommendationSupport the management recommendations, with the following modification, specificmonths (May – September) should be identified for closure, should not be based onwater temperature (70° F).10.2.4 Enforcement <strong>of</strong> Creel Limits in the Vicinity <strong>of</strong> Inl<strong>and</strong>/Joint or CoastalBoundariesIssueDivision <strong>of</strong> Marine Fisheries (DMF) <strong>and</strong> Wildlife Resources Commission (WRC)enforcement <strong>of</strong>ficers may be faced with problems with the enforcement <strong>of</strong> striped bassrecreational creel limits at or near the jurisdictional boundaries between Inl<strong>and</strong> <strong>and</strong> Jointor Coastal Waters or at the boundaries between different striped bass managementareas due to different creel limits, size limits or legal possession limits.BackgroundSolicitation <strong>of</strong> issues concerning law enforcement was largely unproductive. Issuesbrought up included “black-marketing” <strong>of</strong> striped bass, false documentation (paper trails)on hybrid bass, <strong>and</strong> a request to investigate the striped bass possession limits in thevicinity <strong>of</strong> the boundary lines between Inl<strong>and</strong> <strong>and</strong> Joint or Coastal designated waters<strong>and</strong> the boundaries between striped bass management areas. The illegal marketing <strong>of</strong>striped bass <strong>and</strong> hybrids were discussed by the PDT <strong>and</strong> are addressed by existingrules. The different creel limits <strong>and</strong> legal possession days between the ASMA theRRMA <strong>and</strong> the regulatory size differences in the Neuse River at Pitch Kettle Creek aretwo examples where anglers could have in possession the two fish allowed by theWRC, in addition to the two or three fish allowed by the DMF. The fish conceivably werecaught legally within a short distance <strong>of</strong> each other.Current AuthorityNorth Carolina Marine Fisheries CommissionNorth Carolina Fisheries Rules for Coastal Waters (15A <strong>NC</strong>AC)3I .0120 Possession or Transportation Limits3M .0200 Striped Bass3Q .0107 Special Rules, Joint Waters3Q .0108 <strong>Management</strong> <strong>Plan</strong>s for Striped Bass in Joint WatersDiscussionRecreational anglers may possess three striped bass per person per day in Joint(except the Eastmost, Middle <strong>and</strong> Cashie rivers) <strong>and</strong> Coastal Waters year round outside<strong>of</strong> the ASMA. In the Inl<strong>and</strong> Waters <strong>of</strong> the RRMA during the open seasons, anglers maypossess two striped bass per person seven days per week. Properly licensed anglersfishing near boundaries between Inl<strong>and</strong> Waters <strong>and</strong> Joint or Coastal Waters may at180
times possess legally-caught limits <strong>of</strong> striped bass from both Inl<strong>and</strong> <strong>and</strong> Joint or CoastalWaters. Fishermen that launch their boats in Inl<strong>and</strong> Waters, run downstream to JointWaters <strong>and</strong> legally catch three fish, then return with their catch to the ramp can bechecked <strong>and</strong> found in violation <strong>of</strong> the WRC’s two fish possession limit.The Atlantic Ocean has a two fish possession limit <strong>and</strong> a minimum size limit <strong>of</strong> 28inches. The Pamlico Sound has the three fish limit <strong>and</strong> the Albemarle Sound<strong>Management</strong> has a two fish limit on days when the season is opened.These situations cause problems with enforcement <strong>and</strong> especially with prosecution <strong>of</strong>such cases. Judges are usually sympathetic to the anglers when there is any measure<strong>of</strong> doubt involved <strong>and</strong> convictions would be difficult to obtain.The MFC has two rules which dictate how Marine Patrol Officers enforce the creellimits. The first is 3M .0202 (b) (1) which sets forth the Director’s proclamation authorityto impose seasons <strong>and</strong> creel limits <strong>and</strong> states in part “Specify quantity, but shall notexceed possession <strong>of</strong> more than three fish in any one day”. This is a possession limit<strong>and</strong> does not consider where the fish were caught. You are in violation if you possessmore than three. The second rule is 3I .0120 (a) which states “It is unlawful to possessany species <strong>of</strong> fish which is subject to size or harvest restrictions, while activelyengaged in a fishing, unless all fish are in compliance with the restrictions for thewaterbody <strong>and</strong> area being fished”. The MFC considered the question <strong>and</strong> decided thatyou needed to be in possession <strong>of</strong> the appropriate limit where you are checked.The WRC enforcement <strong>of</strong>ficers follow the same policy, i.e. allow the daily possessionlimit for the body <strong>of</strong> water in which they are fishing. A legal limit could be caught ininl<strong>and</strong> waters <strong>and</strong> a legal limit could be caught in Coastal Waters, however, you wouldhave to take the first catch home before being caught in possession <strong>of</strong> the second one.So possession is the key word in WRC enforcement also.Both agencies allow a limit to be transported by boat when running to ramp or dock. Theviolation occurs when the individuals in the boat are actively engaged in a fishingoperation.<strong>Management</strong> Options1. Status quo. No change in present situation.- continued confusion in boundary areas+ no change in proclamation or rule2. Allow possession <strong>of</strong> WRC <strong>and</strong> DMF limits- would require regulation change- encourage increased l<strong>and</strong>ings+ would eliminate confusion over limits3. St<strong>and</strong>ardize possession limits between jurisdictions+ would eliminate confusion over limits181
- would still be confusion over whether the limits were additive4. WRC adopt MFC rule that possession limits apply where you are checked.+ would clarify how many fish you were allowed+ would simplify prosecution <strong>of</strong> violationsMFC, DMF <strong>and</strong> WRC <strong>Management</strong> RecommendationThe simplest solution to this confusion, if it exists, is to publicize to anglers in the vicinity<strong>of</strong> these boundaries that when you are checked by an enforcement <strong>of</strong>ficer <strong>of</strong> eitheragency, you cannot have in possession more than the creel limit for the waterbody youare in while actively engaged in fishing.In order to promote complete clarity, encourage the WRC to implement a rule similar tothe MFC Rule that states you must be in compliance with the restrictions in place at thepoint you are checked. The MFC Rule reads, “It is unlawful to possess any species <strong>of</strong>fish which is subject to size or harvest restrictions, while actively engaged in a fishing,unless all fish are in compliance with the restrictions for the waterbody <strong>and</strong> area beingfished”.A/R <strong>and</strong> C/S Advisory Committees <strong>Management</strong> RecommendationSupport the agencies recommendation.10.2.5 Albemarle Sound <strong>Management</strong> Area Boundary LineIssueReview the Albemarle Sound <strong>Management</strong> Area southern boundary line.Area DescriptionThe Albemarle Sound <strong>Management</strong> Area includesAlbemarle Sound <strong>and</strong> all its inl<strong>and</strong> <strong>and</strong> joint water tributaries, except for the Roanoke,Eastmost, Middle, <strong>and</strong> Cashie rivers. Currituck Sound <strong>and</strong> all its inl<strong>and</strong> water tributaries.Roanoke <strong>and</strong> Croatan sounds <strong>and</strong> all their inl<strong>and</strong> <strong>and</strong> joint water tributaries, includingOregon Inlet, north <strong>of</strong> a line from Roanoke Marshes Point 35° 48’ .3693 N - 75° 43’.7232 W, running 122° (M) across to the north point <strong>of</strong> Eagle Nest Bay 34° 44’ .1710 N -75° 31’ .0520 W (Figure 4.1).BackgroundIn November 1990, a memor<strong>and</strong>um <strong>of</strong> agreement between the MFC <strong>and</strong> the WRC wassigned to provide stewardship <strong>and</strong> continuity <strong>of</strong> management for the striped bassresource (copy attached). Through this agreement, the formation <strong>of</strong> two distinctmanagement zones was created the Roanoke River <strong>Management</strong> Area (RRMA) <strong>and</strong>the Albemarle Sound <strong>Management</strong> Area (ASMA). Jurisdiction for the RRMA was givento the WRC, which included the joint <strong>and</strong> inl<strong>and</strong> portions <strong>of</strong> the Roanoke, Eastmost,Middle <strong>and</strong> Cashie rivers. The ASMA was to be managed by the MFC.182
The North Carolina Striped Bass Cooperative (<strong>NC</strong>SBC) was formed in 1990, <strong>and</strong> wascomprised <strong>of</strong> the DMF, WRC <strong>and</strong> the Unites States Fish <strong>and</strong> Wildlife Service (FWS) tobegin developing the North Carolina Striped Bass <strong>Management</strong> <strong>Plan</strong>. The formation <strong>of</strong>the line from Eagle Nest Bay across to Roanoke Marshes Point, the southern boundary<strong>of</strong> the ASMA, came about as a mutual agreement between the <strong>NC</strong>SBC. Under muchscrutiny <strong>and</strong> backed by scientific evidence, the cooperative deemed it necessary toprotect the one point <strong>of</strong> ingress <strong>and</strong> egress to the Atlantic Ocean that would allow amigration corridor for the A/R stock. This boundary was established to insure theprotection <strong>of</strong> striped bass in the historically important area <strong>of</strong> the Roanoke River <strong>and</strong>Albemarle Sound <strong>and</strong> to not interfere with a multitude <strong>of</strong> different fisheries in southernareas, where striped bass were not as prevalent. It was also necessary to effectivelymanage the 98,000-pound annual commercial quota, established by the ASMFC in1990, for North Carolina. Recreational quotas for striped bass in the Albemarle<strong>Management</strong> Area did not occur until 1994, after the North Carolina Striped Bass<strong>Management</strong> <strong>Plan</strong> for the A/R stock was completed <strong>and</strong> approved by the MFC <strong>and</strong> theWRC. The 1994 recreational quota was set at 58,000 pounds to be split between theRRMA <strong>and</strong> the ASMA. Any increases that would occur after that point would come at a62.5% increase to the recreational fishery <strong>and</strong> a 37.5% increase to the commercialfishery. This would continue until there was parity between the two groups. Anyoverages that occurred in the annual total allowable catch (TAC) would be subtractedfrom the next year’s TAC. As <strong>of</strong> the year 2000, the TAC for the ASMA was 450,000pounds, with an equitable split between the recreational <strong>and</strong> commercial fisheries <strong>of</strong>225,000 pounds each. In 2003, the TAC for the ASMA was increased to 550,000pounds, with an equitable split between the fisheries (commercial <strong>and</strong> recreational). Therecreational quota is equally divided between the RRMA <strong>and</strong> the ASMA (137,500pounds for each area).In May 1992, The Report to Congress for the North Carolina Striped Bass StudyAlbemarle Sound <strong>and</strong> Roanoke River Basin was submitted by the FWS. In this report, itdetailed the specifics as to how North Carolina could rebuild its depleted striped basspopulation in the A/R system. This plan looked at water flows on the Roanoke River,water quality problems throughout the system, fishing pressures, as well as otherissues. As a result <strong>of</strong> this report, North Carolina was allowed to manage its striped bassfishery in the A/R system outside the Atlantic States Marine Fisheries Commission(ASMFC) provisions for the Atlantic Coastal Migratory Stock but under the overallguidance <strong>of</strong> the ASMFC Striped Bass <strong>Fishery</strong> <strong>Management</strong> <strong>Plan</strong>. Evidence at the timesupported the opinion that the A/R stock <strong>of</strong> striped bass did not contribute significantlyto the Atlantic Migratory Stock. However, North Carolina is not completely outside <strong>of</strong> theASMFC control. Each year, a fishing plan for the upcoming calendar year must besubmitted. The plan must include restrictions that maintain mortality within the specifiedlimits for Producer Areas, <strong>and</strong> must be accepted <strong>and</strong> approved by the ASMFC StripedBass Technical Committee <strong>and</strong> the ASMFC Striped Bass <strong>Management</strong> Board. Onlyafter these two groups have approved North Carolina’s plan, can any changes inregulations (recreational or commercial) occur.Current Authority183
North Carolina Marine Fisheries Commission RulesNorth Carolina Fisheries Rules for Coastal Waters (15A <strong>NC</strong>AC)3M .0200 Striped Bass3Q .0107 Special Rules, Joint Waters3Q .0108 <strong>Management</strong> <strong>Plan</strong>s for Striped Bass in Joint Waters3 Q .0109 Implementation <strong>of</strong> Striped Bass <strong>Management</strong> <strong>Plan</strong>s Recreational FishingDiscussionThe current southern boundary line <strong>of</strong> the ASMA provides a corridorfor the ingress <strong>and</strong> egress <strong>of</strong> striped bass from the ASMA to the Atlantic Ocean viaOregon Inlet. Recently, some commercial <strong>and</strong> recreational fishermen have requestedthat the southern boundary line be moved northward to the Croatan Sound bridge (Hwy64/264) at Manns Harbor <strong>and</strong> Roanoke Sound bridge (Hwy 64/264) at Manteo. Movingthe line northward will exp<strong>and</strong> the area regulated by CSMA restrictions, which includean 18” minimum size, commercial season <strong>and</strong> 25,000 pound TAL, <strong>and</strong> recreational 3fish year-round possession limit.Commercial quota allocations differ significantly between the ASMA <strong>and</strong> CSMA, withthe ASMA quota (225,000 pounds in 2002) based on stock abundance <strong>and</strong> mortalitytargets, <strong>and</strong> the CSMA quota <strong>of</strong> 25,000 pounds based on a percentage <strong>of</strong> historicall<strong>and</strong>ings. Since commercial l<strong>and</strong>ings are allocated to management area quotas basedon where the fish are harvested, moving the line will affect l<strong>and</strong>ing allocations by area<strong>and</strong> possibly the season length in each area. Impacts <strong>of</strong> shifting the line will likely varybetween the various fishery components, commercial <strong>and</strong> recreational <strong>and</strong> harvest <strong>and</strong>discard. The degree to which relative season lengths <strong>and</strong> possession limits will beaffected will depend on whether fishermen respond to the boundary line change bychanging their fishing practices. Shifting the line will change the allocation <strong>of</strong> l<strong>and</strong>ingsbetween management areas, <strong>and</strong> thus will also change the AR stock assessment. Tomaintain consistency <strong>and</strong> avoid bias, the assessment would have to be modified toreflect the altered l<strong>and</strong>ings allocation.It is impossible to accurately determine how a change in a management boundary willaffect fishing effort. Therefore, it is also impossible to evaluate how such a change willaffect current regulations that have evolved over time in response to effort <strong>and</strong> stockabundance. Nonetheless, the following paragraphs are our best attempt to illustrate thedirectionality <strong>of</strong> regulatory changes resulting from shifting the line.Moving the line North will result in commercial l<strong>and</strong>ings from Croatan <strong>and</strong> Roanokesounds being counted against the 25,000 pound quota available for the rest <strong>of</strong> the state.Including harvest from this area would likely result in the CSMA TAL being reachedmuch quicker, thus shortening the allowable harvest season. Shortening the allowableharvest season will likely result in increased discard losses. Further, applying theshortened season to areas such as Croatan <strong>and</strong> Roanoke Sounds where striped bassare abundant will increase discard losses even further. Removing the Croatan-Roanoke184
l<strong>and</strong>ings from the ASMA allocation results in the same TAL applying to a smaller arearepresenting presumably less overall effort, which might at first translate into longerseasons <strong>and</strong> higher catch rates. However, if the A/R stock <strong>of</strong> fish in the Croatan-Roanoke Sound areas are exploited more heavily when subjected to CSMA regulationsthan when subjected to ASMA regulations, any liberalization <strong>of</strong> ASMA regulations couldbe temporary.Shifting recreational harvest components could lead to even more severe changes inallocation, since the recreational fishery in the CSMA is regulated liberally <strong>and</strong> withoutan overall harvest limit. If striped bass in the Croatan-Roanoke Sound areas areabundant, allowing these fish to be recreationally exploited year-round under a 3 fishpossession limit could lead to greatly increased harvest in the CSMA. However, sincewe lack adequate recreational survey coverage <strong>of</strong> the CSMA <strong>and</strong> thus cannot reliablyestimate total harvest, the increased recreational harvest may not be detected.Moving the boundary line southward was not requested, but should be consideredamong the possibilities if change is pursued. As long as recreational regulations in theASMA are more restrictive than those in the CSMA, moving the line south will decreaserecreational exploitation <strong>of</strong> all stocks. Shifting the line south would not likely increasecommercial exploitation <strong>of</strong> A/R fish since the quota would remain in effect, <strong>and</strong> requiringASMA gear restrictions over a larger area would likely decrease discarding.Changing the boundary line <strong>and</strong> thus changing where catches are allocated will affectpopulation assessments. Ideally the stock assessment <strong>of</strong> the A/R stock should accountfor all harvest <strong>of</strong> the stock, regardless <strong>of</strong> harvest location. If most <strong>of</strong> the catch from theCroatan-Roanoke Sound areas is composed <strong>of</strong> A/R stock fish, then tabulating thosecatches to CSMA stocks will produce a negative bias in estimates <strong>of</strong> A/R stockabundance. The net reduction in population abundance could lead to lower ASMAquotas, which would affect the allocation to both recreational <strong>and</strong> commercial fisheries.Furthermore, if effectively liberalizing recreational regulations in the Croatan-RoanokeSound areas significantly increases recreational exploitation <strong>of</strong> the A/R stock, thenoverall exploitation for the stock will increase. The obvious response to increasedexploitation will be more restrictive management, in effect restricting ASMA fisheries inan attempt to <strong>of</strong>fset increased harvest <strong>of</strong> the A/R stock in the CSMA. Overall, it seemslikely that moving the boundary line Northward will reduce the commercial exploitation<strong>of</strong> the A/R stock (A/R fish in Croatan-Roanoke Sounds would be subjected to the25,000 pound quota) <strong>and</strong> increase the recreational exploitation (A/R fish in Croatan-Roanoke Sounds would be subjected to year-round 3 fish per day possession limit).Tag returns (n=85) from fish tagged <strong>and</strong> released in Albemarle Sound or on theRoanoke River spawning grounds have increased from areas south <strong>of</strong> the ASMAboundary line from 1986-2002. These fish have been recaptured in Pamlico Soundbehind Rodanthe, Buxton <strong>and</strong> Ocracoke; <strong>and</strong> in the Pungo, Pamlico, <strong>and</strong> Neuse Rivers.Similarly, tagged Phase II striped bass released in the Neuse <strong>and</strong> Pamlico rivers havebeen recaptured in the Albemarle Sound <strong>and</strong> Roanoke River (n=34) since at least 1996.These returns indicate that striped bass populations within North Carolina mix readily.185
Since all anecdotal <strong>and</strong> assessment information indicates that the A/R stock is muchlarger than any <strong>of</strong> the other North Carolina stocks, in all likelihood far more A/R stockfish are being captured outside the ASMA than are Neuse or Tar stock being capturedin the ASMA.Any changes to the boundary line should be made with consideration to the stockcomposition <strong>of</strong> the population <strong>of</strong> fish available in the areas the change will affect. This isespecially true if the boundary line is used to allocate catches to management units <strong>and</strong>thus to stocks. Allocating catches by some other, more direct method based on stockcomposition <strong>of</strong> the catch <strong>and</strong> not a geographic boundary is certainly preferable. Anexp<strong>and</strong>ed tagging program covering all systems <strong>and</strong> including a component to estimatereporting rates by area is one possible approach.The following conditions are required to redefine the ASMA.1) Concurrence between the members <strong>of</strong> the North Carolina Striped BassCooperative that moving the boundaries for the ASMA is for the benefit <strong>of</strong> thestock.2) Upon agreement that the ASMA boundaries should be moved, a fishing plan forthe next calendar year would have to be developed <strong>and</strong> submitted to theASMFC’s Striped Bass Technical Committee.3) Upon acceptance by the Technical Committee, the plan would go before theASMFC’s Striped Bass <strong>Management</strong> Board. Acceptance by the <strong>Management</strong>Board would then allow the proposed North Carolina fishing plan to beimplemented, effectively moving the boundary lines.<strong>Management</strong> Options• Status quo – No change in boundary line+ No management or Fishing <strong>Plan</strong> change necessary+ Current assessment results based on l<strong>and</strong>ings under this allocation; no need tochange assessment+ Believed to encompass primary areas inhabited by AR stock- Some AR stock fish move outside the boundary, % may be increasing.- The management boundary is not an impediment to stock movement• Move the ASMA southern boundary line north to Croatan Sound <strong>and</strong> RoanokeSound (Hwy 64/264) bridges.+ Fishermen desire this change- Will require major change in stock assessment, with a retrospective allocation <strong>of</strong>catches to the newly defined management area.- Commercial discard exploitation may increase- AR fish may be tabulated as CSMA stocks fish.- If more fishermen use the additional CSMA area, the season <strong>and</strong> possession limitswill need to be more restrictive.- Recreational exploitation <strong>of</strong> the AR stock would likely increase- Increasing the area <strong>of</strong> the CSMA may result in increased commercial effortpursuing the 25,000 pound CSMA quota, thus quota would probably be reachedfaster .186
• Move the ASMA southern boundary line south <strong>of</strong> the existing line from RoanokeMarshes Point/Eagle Nest Bay+ Smaller CSMA may result in fewer fishermen pursing the CSMA quota+ Reduced recreational exploitation+ May reduce commercial discard- Will require major change in stock assessment, with a retrospective allocation <strong>of</strong>catches to the newly defined management area.- May increase effort on ASMA commercial quota, potentially providing a shorterseason.- May increase proportion <strong>of</strong> CSMA stock fish tabulated as AR fish.Research Needs• Accurate information on stock mixing in the Sounds <strong>and</strong> Rivers <strong>of</strong> North Carolina isrequired to enable unbiased evaluation <strong>of</strong> stock abundance. This may be achievedthrough a comprehensive tagging program.• Accurate information on migratory patterns <strong>and</strong> movements <strong>of</strong> striped bass fromCSMA stocks. This may be achieved through a tagging program.• Accurate catch statistics, adequate biological sampling, <strong>and</strong> fishery-independentsurvey data for CSMA stocks is required to allow accurate stock assessment. Thiswill require dedicated creel surveys, exp<strong>and</strong>ed MRFSS coverage, exp<strong>and</strong>edcommercial fish house sampling, <strong>and</strong> development <strong>of</strong> an independent survey.MFC, DMF, WRC <strong>and</strong> FWS <strong>Management</strong> RecommendationsSupport Status Quo, No shift in the Boundary Line <strong>and</strong> support the research needs.The Boundary line was established to provide a migratory corridor for the Albemarle-Roanoke stock <strong>of</strong> striped bass. As currently established, the line accomplishes this goal.The line also provides a delineation point for allocating harvest to management areas,<strong>and</strong> is believed to encompass the primary areas inhabited by the Albemarle-Roanokestock. Moving the line northward would likely exacerbate the problem <strong>of</strong> stock mixing,<strong>and</strong> contribute to a significant bias in assessment calculations for the Albemarle-Roanoke, Tar River, <strong>and</strong> Neuse River stocks. Furthermore, in all likelihood such a shiftwould lead to potential increases in commercial discard <strong>and</strong> recreational harvest losses.A/R <strong>and</strong> C/S Advisory Committee <strong>Management</strong> RecommendationSupports the Status Quo management option <strong>and</strong> the research needs.10.3 Issues Relative to the A/R Striped Bass Stock10.3.1 Stock Structure10.3.1.1 Biological Reference PointsIssueEstimation <strong>of</strong> biological reference points <strong>and</strong> management targets.187
BackgroundNorth Carolina <strong>Fishery</strong> <strong>Management</strong> <strong>Plan</strong>s are required to include managementmeasures that prevent overfishing, while achieving, on a continual basis, the optimumyield for each fishery. OY is defined as the amount <strong>of</strong> fish the provides the greatestbenefit to the State, is prescribed on the basis <strong>of</strong> the maximum sustainable yield (MSY),<strong>and</strong> in the case <strong>of</strong> an overfished fishery will provide for rebuilding to a level that willproduce MSY.Life history information from catch <strong>and</strong> survey sampling is the basic input <strong>of</strong> Yield perRecruit analysis (YPR) used to estimate yield or growth based reference points such asFmax <strong>and</strong> F0.1 <strong>and</strong> evaluate growth overfishing. Exp<strong>and</strong>ing this method to includematuration at age information allows calculation <strong>of</strong> spawning potential <strong>and</strong> estimation <strong>of</strong>Spawning Potential Ratio (i.e., F XX%SPR ) references <strong>and</strong> consideration <strong>of</strong> recruitmentoverfishing. Information on average recruitment provided by the VPA enables furtherscaling <strong>of</strong> ‘per recruit’ values from the YPR analysis to potential total population values.MSY can be estimated only if estimating recruitment at various stock levels is possible.VPA estimates <strong>of</strong> recruitment <strong>and</strong> spawning stock biomass can be used to determinerecruitment from spawner abundance, through either formal stock-recruitmentrelationship models (SRR) or more ad hoc approaches such as selecting futurerecruitment from observed values over various ranges <strong>of</strong> spawner abundance. Once amethod to estimate recruitment is derived, population projection models are usedevaluate stock performance over a range <strong>of</strong> exploitation rates <strong>and</strong> thus determine therate (F msy ) that provides the maximum yield (MSY).A range <strong>of</strong> potential biological reference points for North Carolina striped bass stockswas evaluated <strong>and</strong> presented to the North Carolina Striped Bass FMP <strong>Plan</strong>Development Team on January 8, 2002. The PDT reviewed the reference points <strong>and</strong>identified a range <strong>of</strong> options for biomass <strong>and</strong> mortality rate targets <strong>and</strong> thresholds. Theanalyses are based on biological <strong>and</strong> fishery data from the Albemarle Roanoke stock,as no data are available for the other stocks.Current AuthorityGeneral Statutes <strong>of</strong> North CarolinaG.S. 113-182.1. <strong>Fishery</strong> <strong>Management</strong> <strong>Plan</strong>sReference Point EvaluationYield per Recruit (YPR)Yield per Recruit models have long been used to establish biological reference points<strong>and</strong> management benchmarks, largely due to their modest data requirements <strong>and</strong> ease<strong>of</strong> calculation. Data necessary for this analysis are weight at age, natural mortality, <strong>and</strong>selectivity at age. The reference point most <strong>of</strong>ten associated with this analysis is Fmax,defined as the fishing rate that provides the maximum yield per recruit. As further188
experience showed that fishing at Fmax could result in overfishing, a more conservativereference, F 0.1 , was developed, defined as the point at which the slope <strong>of</strong> the YPR curveis 1/10 th the slope at the origin. YPR analysis assumes a population at equilibrium, i.e.that age at entry into the fishery, weight at age, maturation at age, natural mortality, <strong>and</strong>recruitment are all constant. Providing an estimate <strong>of</strong> average recruitment at equilibriumenables scaling <strong>of</strong> per-recruit values <strong>of</strong> yield <strong>and</strong> biomass to stock-level values.Yield-per-recruit analysis used a dynamic pool model <strong>and</strong> input values from the recentassessment (Carmichael, 2001; Carmichael, 2002). Current stock conditions aresummarized in Table 10.8 for comparison to predicted equilibrium conditions under thevarious reference points. The estimated value for Fmax is below the current mortalitytarget, indicating that slight growth overfishing could occur at the current target (Table10.9). F=0.1 is slightly below Fmax <strong>and</strong> approximately equal to the natural mortalityrate, M, which is typical for most stocks. The point <strong>of</strong> stock collapse, based on the PDTrecommendation <strong>of</strong> female spawner biomass declining below 400,000 pounds, is highat Fcollapse=0.90. This high Fcollapse suggests the stock has considerable resiliency<strong>and</strong> can endure significant exploitation before SSB declines enough to significantlydegrade recruitment. Based on 1989-1999 average recruitment <strong>of</strong> 377,000 age 1 fish,yield at Fmax would be 1.0 million pounds, nearly double the 1998-2000 average catch(harvest+discard) <strong>of</strong> 505,286 pounds, <strong>and</strong> about 40% above the 2000 catch <strong>of</strong> 638,394pounds. Although the actual exploitation rate at Fmax is lower than the currentexploitation rate, the potential yield is higher due to increased stock biomass expectedTable 10.8.Current Albemarle-Roanokestriped bass stock conditions,from Carmichael, 2001.Table 10.9.Biological reference points <strong>and</strong>associated yield parameters fromYPR analysisParameter Value Reference Point Estimated valueStock Abundance Numbers 1,567,000 F0.1 0.12Female Spawner Pounds 1,094,584 Fmax 0.152000 Total Catch Pounds 638,394 Fcoll 0.901998-2000 Catch Pounds 505,286 Yield@Fmax, mlb 1 1.007SSB@Fmax, mlb Female 1 3.802Catch, 1000’s N 1 1341 Yield, SSB, <strong>and</strong> catch are based on average recruitment<strong>of</strong> 377,000 age-1 fish.from an exp<strong>and</strong>ed age structure. Spawning stock biomass at Fmax is predicted to beover 3 times the 2000 value <strong>of</strong> about 1 million pounds.Spawning Potential RatioBecause the basic YPR analysis considers only the effect <strong>of</strong> fishing mortality on yield,associated reference points technically only address growth overfishing. Moreover,there is no feedback between stock abundance <strong>and</strong> yield <strong>and</strong> recruitment, thus themodel cannot reflect density dependent factors that affect the population. The model189
can be extended by incorporating maturation or fecundity ogives as an attempt toaddress recruitment overfishing, but the previous limitation still applies. Referencepoints provided by this extension are based on the spawning potential ratio, calculatedas the proportion <strong>of</strong> the maximum spawner biomass or egg production (i.e., thatexpected with no fishing exploitation) that will be produced at each exploitation rate, <strong>and</strong>are generally presented as F xx%SPR .Although the specific %SPR necessary to prevent recruitment overfishing <strong>and</strong> sustainadequate spawner biomass is unknown unless a stock-recruitment relationship isavailable, SPR values between 20% <strong>and</strong> 40% are commonly considered, <strong>and</strong> somestocks have been sustained at considerably lower levels. Results <strong>of</strong> the SPR analysiscan be combined with a stock-recruit plot to determine if a given level <strong>of</strong> SPR wouldhave been adequate to sustain the stock given the observed recruitment history.Similarly, observed recruitment values can be used to determine the minimum SPRnecessary on average to replace the stock over the observation period. Inverting thevalue <strong>of</strong> SSB per recruit provides a value for recruits/SSB that can be used as the slope<strong>of</strong> a line on the Stock-Recruitment plot. Recruitment values above a given line representyears when recruitment was adequate to replace the parent stock, while those valuesbelow a line represent years when recruitment was not adequate to replace the parentstock. The point where a given line intersects the predicted stock recruitmentrelationship represents where the stock would stabilize under average conditions.Results <strong>of</strong> the SPR analysis based on a range <strong>of</strong> 10 - 40%SPR produced exploitationrates between F=0.14 <strong>and</strong> F=0.40 (Table 10.10). These values are safely below thepoint <strong>of</strong> collapse (F=0.9), <strong>and</strong> any value would likely produce adequate recruitment to atleast sustain current stock abundance. The age structure <strong>of</strong> the population would varyTable 10.10. Percent SPR based reference points with associated F values, % adequate recruitment from theobserved history, % <strong>of</strong> the population age 8 <strong>and</strong> older, yield per recruit, <strong>and</strong> female spawner biomass.Parameter F %SPR % adequate R %8+ pop. Yield per Rec. SSB 1 mpdsF40%SPR 0.10 40 100 24 .833 5.344F30%SPR 0.16 30 100 18 .873 3.572F20%SPR 0.22 20 95 13 .838 2.541F10%SPR 0.40 10 95 6 .687 1.200Fcoll 0.9 3.4 33 0.8 .505 0.402Frep_95-99 0.75 4.3 83 1.4 .617 .532Fmax 0.19 24 100 19 .874 3.8021. Millions <strong>of</strong> pounds, based on average recruitment <strong>of</strong> 327,000 age 1 fish.considerably over this range <strong>of</strong> exploitation rates, with the proportion <strong>of</strong> the populationcomposed <strong>of</strong> older fish (8+) declining from 24% for F40%SPR to 6% for F10%SPR.Yield is close to the maximum for F40% to F20%SPR, drops about 20% for F10%SPR,<strong>and</strong> drops over 30% at Fcollapse. Spawner biomass would not increase over currentlevels for F10%SPR, but would increase considerably for the other references190
considered. The plot <strong>of</strong> recruitment <strong>and</strong> SSB overlain with %SPR reference lines showsthat none <strong>of</strong> the %SPR values considered are likely to negatively impact recruitment(Figure 10.7). Therefore, even the apparently low 10%SPR could prevent recruitmentoverfishing.Estimation <strong>of</strong> MSYThe reference points evaluated so far are largely based on ‘per recruit’ information, <strong>and</strong>are therefore useful even when future recruitment is unknown. Estimation <strong>of</strong> maximumsustainable yield, MSY, however, requires some determination <strong>of</strong> future recruitment.This is usually accomplished through a stock-recruitment relationship, such as thatillustrated in Figure 10.7. Stock-recruitment relationships are among the hardestfisheries population characteristics to determine, <strong>of</strong>ten remaining inconclusive in spite <strong>of</strong>long data series <strong>and</strong> extensive evaluation. The true underlying relationship may bemasked or even distorted by many factors, including, but certainly not limited to,environmental variation, an inability to adequately measure recruitment, <strong>and</strong> a lack <strong>of</strong>data over an adequate range <strong>of</strong> parent stock size. Even when a relationship can bedetermined with reasonable statistical accuracy, it is a record <strong>of</strong> past performance thatmay not be representative <strong>of</strong> future conditions, especially for a stock that undergoingrapid change. All <strong>of</strong> these factors affect the stock recruitment relationship for AR stripedbass to some extent.Estimates <strong>of</strong> F msy <strong>and</strong> associated parameters were attempted, by iteratively fishing asimulated population to equilibrium over a range <strong>of</strong> exploitation rates. Stochasticity wasincorporated by allowing recruitment to vary r<strong>and</strong>omly from base values predicted by aBeverton-Holt Stock-Recruitment relationship; the magnitude <strong>of</strong> this variation was basedon the variation in observed values. Input values for selectivity, maturity, <strong>and</strong> weight atage were identical to those used in the YPR analysis; starting population abundancewas taken from the VPA (Carmichael, 2001).The PDT reviewed <strong>and</strong> discussed the parameter estimates from the MSY analysis <strong>and</strong>determined that the results were not generally reliable. Much <strong>of</strong> the concern centeredaround the stock-recruitment relationship. Although a model can be fit with reasonableprecision, the PDT did not feel it would adequately predict future conditions, largely dueto current SSB being at an observed high <strong>and</strong> expected to further increase as recentstrong year classes mature. Therefore, observations over the next few years will be atthe rightmost extreme <strong>of</strong> the plot at high spawner abundance <strong>and</strong> will exert considerableinfluence over the asymptote predicted by the relationship (Figure 10.8).Since the asymptote determines the average, long-term recruitment at high spawnerabundance, it is expected that observations from the near future will greatly influencethe estimated long term average recruitment, which will influence both MSY <strong>and</strong>191
Recruits 1 1000's N900800700600500400300STOCK-RECRUITMENT AND %SPR ALTERNATIVESRec's 2010 4030 SRRFrep,med(2%)Frep_95-99collapse01/29/200220010000 100 200 300 400 500 600 700 800SSB Female 1000's poundFigure 10.7. Stock-Recruitment plot with replacement (median <strong>of</strong> observed) %SPR<strong>and</strong> various %SPR levels.equilibrium spawner biomass. This is shown in the plot by the difference in the twopredicted relationships, one based on all years <strong>and</strong> the other based on all observationsduring the 1990’s. The PDT feels strongly that the stock needs to achieve somestability, in terms <strong>of</strong> both recruitment <strong>and</strong> spawner abundance, before a reliable <strong>and</strong>predictive stock recruitment relationship can be developed. Although there was a period<strong>of</strong> stability during the mid-1990’s, the combination <strong>of</strong> good recruitment <strong>and</strong> limitedexploitation during those years resulted in high abundance <strong>of</strong> fish approaching maturity,exhibited by the 2000 point in the plot at the far right. Another concern expressed by thePDT is that observations at middle to low abundance predate flow control on theRoanoke River, <strong>and</strong> may reflect more the adverse environmental conditions at that timethan the true stock-recruitment relationship. Given the uncertainty in the ability <strong>of</strong> thestock-recruitment relationship to predict recruitment, <strong>and</strong> concern that conditions in thenear future may be considerably different from past years, the PDT did not endorse anyestimate <strong>of</strong> MSY at this time.192
800700RecLagALLRECENTSRR's based on All years <strong>and</strong> 1990's19962000600Thous<strong>and</strong> Age 150040030020019971998100199900 200000 400000 600000 800000 1000000 1200000Female Spawner PoundsFigure 10.8. Stock-recruitment plot for striped bass <strong>and</strong> fitted Beverton-Holtstock-recruitment relationships, for all years <strong>and</strong> for the 1990’s.Spawner Biomass ThresholdThe PDT did consider the plot <strong>of</strong> stock <strong>and</strong> recruitment valuable for identifying athreshold spawner biomass. From a graphical analysis, recruitment was generally poorwhen female spawner biomass was below 200,000 pounds, <strong>and</strong> strong when biomasswas above 500,000 pounds. Since only one observation falls between these values,making it difficult to determine with precision the lower bound, <strong>and</strong> 200,000 pounds isclearly inadequate to ensure reasonable recruitment, the PDT decided to recommend aconservative threshold <strong>of</strong> 400,000 pounds.SummaryThe PDT advised that MSY could not be reliably determined for this stock at this time.They are concerned that developing an MSY estimate requires extrapolation <strong>of</strong> thestock beyond the observed record. Such an endeavor is particularly risky for a stockthat is still recovering, at least in terms <strong>of</strong> age structure, from past over exploitation.Another concern is that the time series <strong>of</strong> stock <strong>and</strong> recruitment data is still heavilyweighted toward periods <strong>of</strong> low abundance, overexploitation, <strong>and</strong> environmentaldegradation. Thus, the stock-recruitment relationship necessary to estimate MSY isespecially uncertain, <strong>and</strong> may remain variable until the stock reaches some equilibrium.Recent regulatory changes, notably increased harvest allowances, further adduncertainty <strong>and</strong> instability to the stock at this time.The PDT recommended that management benchmarks should be chosen based on alist <strong>of</strong> key criteria 1) Ability to evaluate a particular value or parameter, 2) Ability toeffectively implement <strong>and</strong> manage under a particular strategy, 3) Past managementexperience, 4) consideration <strong>of</strong> uncertainty, <strong>and</strong> 5) management program goals. Usingthese criteria as a guide, the PDT recommends that the stock be managed through193
target <strong>and</strong> threshold exploitation rates, similar to the current strategy. This approach isproven through past experience, has been effectively implemented for many years, <strong>and</strong>has resulted in the current stock recovery. This approach is clearly measurable, asestimates <strong>of</strong> exploitation rates are proven more precise <strong>and</strong> reliable than estimates <strong>of</strong>absolute abundance. This approach provides significant flexibility; selection <strong>of</strong> propertarget <strong>and</strong> threshold exploitation rates can ensure that management targets are met.The PDT recommended that, where feasible, biomass thresholds be developed tosupport the exploitation rate targets. The past history <strong>of</strong> the stock, as reported in therecent assessment, provides reasonable guidance for selecting biomass thresholds.However, since the stock is exp<strong>and</strong>ing beyond the observed history, in both biomass<strong>and</strong> age structure, extrapolation to target biomass levels is risky at best. Setting targetbiomass levels in absolute values without knowledge <strong>of</strong> the stock’s growth potential willresult values for which neither the direction nor magnitude <strong>of</strong> potential bias <strong>and</strong>uncertainty can be determined.<strong>Management</strong> Options/ImpactsBased on consideration by the PDT <strong>of</strong> the analyses summarized above <strong>and</strong> developedin Carmichael (2002), a range <strong>of</strong> management targets <strong>and</strong> thresholds were identified forconsideration. Selection <strong>of</strong> threshold limits should be based on the biologicalcharacteristics <strong>and</strong> population dynamics <strong>of</strong> the stock. Within this limitation, target levelsshould be selected on the basis <strong>of</strong> specific management goals.A. Options for the Albemarle Roanoke StockMortality Rate Alternatives1. Fcollapse = 0.95A stock collapse reference point was identified to delineate the upper bound <strong>of</strong>values that would be considered, based on the reference point evaluations <strong>and</strong>consideration <strong>of</strong> stock history. Exploiting the stock at this rate or higher is verylikely to lead to collapse through recruitment failure.+ Establishes an upper limit for threshold consideration- Adopting as threshold is not risk averse2. FthresholdAlternative1. Frep, 1995-1999 = 0.75An upper bound threshold exploitation was identified as a value that, if exceeded,would likely halt further stock growth given average observed recruitment. Thisvalue is based on the median observed recruitment/spawner biomass from 1995 to1999, years selected to represent the current conditions <strong>of</strong> recruitment <strong>and</strong>spawner abundance. Fishing at this level results in considerable foregone futureyield, declines in SSB toward the threshold, <strong>and</strong> a reduction in the abundance <strong>of</strong>older fish. Current yields could possibly be maintained, at the expense <strong>of</strong> stockabundance <strong>and</strong> biomass.+ Based on observed recruitment <strong>and</strong> exploitation194
+ Significantly distant from range <strong>of</strong> targets- Approaching this level will lead to stock decline, especially SSB- Approaching this level will not maximize yieldAlternative 2. F10%SPR = 0.40A lower bound threshold exploitation rate, identified as the exploitation rate that willmaintain the current spawner biomass given recent (1989-1999) averagerecruitment. Exploiting the stock at this level <strong>of</strong>fers little opportunity for increasedharvest over current levels.+ Would determine overfishing before SSB impacted+/- Possibly adequately distant from range <strong>of</strong> targets3. Ftarget.Alternative 1. Current Ftarget, F=0.28.The ASMFC FMP currently m<strong>and</strong>ates a producer area target F <strong>of</strong> 0.28, based onNorth Carolina’s 18” minimum size. Because states may be more restrictive thanm<strong>and</strong>ated by the FMP, any Ftarget below this level is within the current FMPlimitations. Exploiting the stock at this level could result in a slight <strong>and</strong> gradualincrease in total pounds caught as the stock age structure exp<strong>and</strong>s, <strong>and</strong> SSBcould also increase somewhat.+ Stock continues to grow at this rate+ Supported by current ASMFC FMP- Only slight increase in SSB, age structure, <strong>and</strong> yield expected- Allows some growth overfishingAlternative 2. F20%SPR = 0.22.This level <strong>of</strong> SPR is within the range <strong>of</strong> target values used for other stocks,although recent opinions are that F20% SPR should possibly be considered anupper limit <strong>of</strong> management targets. Exploiting the stock at this level could result inabout a 30% increase in total catch, a doubling <strong>of</strong> SSB, <strong>and</strong> a considerableincrease in the abundance <strong>of</strong> 8+ fish.+ Within accepted range <strong>of</strong> target % SPR+ Projected increase in yield, SSB, age structure- Allows slight growth overfishing- Below current targetAlternative 3. F30%SPR = 0.16This level is also within the range <strong>of</strong> target values used for other stocks, <strong>and</strong> israpidly replacing F20% as a preferred exploitation rate as experience is gained inusing SPR as management targets. Exploiting the stock at this level could result inabout a 50% increase in total catch <strong>and</strong> a considerable increase in both SSB <strong>and</strong>8+ abundance.+ Within accepted range <strong>of</strong> desirable % SPR+ Conserves more SSB than F20% or F=0.28+ Considerable increase in yield, SSB, <strong>and</strong> age structure195
+ Not significantly different from Fmax- Below current targetAlternative 4. Fmax = 0.15This rate maximizes yield <strong>of</strong> individual fish, thus values above it result in somelevel <strong>of</strong> growth overfishing. However, whether or not it maximizes yield <strong>of</strong> thepopulation depends on the stock-recruit relationship. Exploiting the stock at thislevel would maximize the yield at current average recruitment, providing a slightincrease over that expected at F30%SPR. It is unlikely that the difference betweenF30%SPR <strong>and</strong> Fmax could be measured through a stock assessment.+ Prevents growth overfishing – maximizes yield+ Considerable increase in yield, SSB, age structure- Below current targetBiomass Threshold AlternativesAlternative 1. Female SSB Collapse = 200,000 pounds.This alternative is considered excessively risky as a threshold, as it is likely thatrecruitment would suffer <strong>and</strong> the stock would decline rapidly if SSB declines to thislevel. The stock declined substantially, <strong>and</strong> drastic regulatory restrictions were requiredfor recovery, when biomass fell to this level in the 1980’s.- Stock collapsed when SSB fell to this level- Recruitment could be adversely impacted before stock declared overfished- Recovery from this point could require drastic measuresAlternative 2. Female SSB Threshold = 400,000 pounds.This alternative provides more protection to the stock than alternative 1, althoughconsiderable restrictions would still likely be required to rebuild if SSB falls to this level.+ Declares stock overfished before recruitment is likely impacted+ Somewhat removed from estimated point <strong>of</strong> collapse- Recovery from this point might require significant restrictionsMaximum Sustained YieldMaximum sustained yield cannot be reliably determined at this time.Optimum YieldOptimum yield is that yield projected from exploiting the stock at the target exploitationrate as determined from the most recent stock assessment. This is the approachcurrently used to manage this stock.+ Consistent with current management approach+ Allows yield to vary with stock conditions- Not a predetermined, specific value- Requires continued, potentially annual stock assessmentOverfishing <strong>and</strong> Overfished definitionsThe PDT recommends that the overfishing definition be based on the thresholdexploitation rate: Overfishing will occur when the exploitation rate exceeds the thresholdexploitation rate.196
The PDT recommends that the overfished definition be based on the biomass threshold:The stock will be overfished if biomass falls below the threshold.Research Needs• Additional stock monitoring at the current high abundance is necessary to define thestock-recruitment relationship.• The emigration rate should be evaluated in the near future, as the proportion <strong>of</strong> thestock age 8 <strong>and</strong> older increases.MFC, DMF, WRC <strong>and</strong> FWS <strong>Management</strong> RecommendationSupport the PDT management recommendations (F=0.22, SSB= 400,000 pounds) <strong>and</strong>the research needs.A/R Advisory Committee <strong>Management</strong> RecommendationSupport an F rate <strong>of</strong> 0.22 <strong>and</strong> a threshold <strong>of</strong> 400,000 pounds <strong>of</strong> SSB for the A/R stock.The Committee also supports the research needs.10.3.2 Fishing Mortality10.3.2.1 Discard Mortality <strong>of</strong> Striped Bass in the Multi-species Gill Net <strong>Fishery</strong>ASMAIssueInvestigation <strong>of</strong> bycatch <strong>and</strong> discards <strong>of</strong> striped bass (Morone saxatilis) in the multispecies,anchored gill net fishery in the Albemarle Sound <strong>Management</strong> Area (ASMA).DefinitionsAttended – Being in a vessel, in the water or on the shore immediately adjacent to thegear <strong>and</strong> immediately available to work the gear <strong>and</strong> within 100 yards <strong>of</strong> any gear in useby that person at all times. Attended does not include being in a building or structure.Gill Net – A net set vertically in the water to capture fish by entanglement by the gills inits mesh as a result <strong>of</strong> net design, construction, mesh size, webbing diameter or methodin which it is used.Bycatch – That portion <strong>of</strong> a catch taken incidentally to the targeted catch because <strong>of</strong>non-selectivity <strong>of</strong> fishing gear to either species or size differences.Discard – The portion <strong>of</strong> the catch that is not retained <strong>and</strong> includes incidental take <strong>of</strong>protected species.BackgroundStriped bass have been an economically important fish species in the Albemarle Soundsince colonial times. This species is utilized by commercial fishermen as well as beinghighly prized by recreational anglers. Striped bass stocks in the Albemarle Sound/Roanoke River declined rapidly in the late 1970s into the 1980s. Factors believed to beresponsible for the decline included overfishing, unfavorable water flow regimes on the197
Roanoke River during spawning, <strong>and</strong> poor water quality (North Carolina Striped BassStudy <strong>Management</strong> Board 1992).North Carolina’s harvest <strong>of</strong> striped bass was severely reduced in response to drasticdeclines in coastal striped bass stocks. Flow regimes on the Roanoke River have beenmodified since 1988 to duplicate more natural conditions that occurred prior to theconstruction <strong>of</strong> the Lake Gaston <strong>and</strong> Roanoke Rapids dams. Also, the harvest <strong>of</strong> stripedbass by commercial <strong>and</strong> recreational fishermen was limited severely. As a result, theA/R stock <strong>of</strong> striped bass has risen to levels that have not been seen in decades.The ASMA supports a substantial anchored gill net fishery for species such as flounder,striped mullet, white perch, river herring <strong>and</strong> shad. As a result <strong>of</strong> the recovery <strong>of</strong> the A/Rstock, the incidental bycatch <strong>of</strong> striped bass has increased. Preventive measures havebeen put into place to address this issue, which have ranged from the prohibition <strong>of</strong> theuse <strong>of</strong> certain mesh sizes, limiting <strong>of</strong> the amount <strong>of</strong> yardage that can be fished <strong>and</strong> areaclosures. A list <strong>of</strong> regulations concerning the use <strong>of</strong> gill net can be found in Appendix 3.The MFC allows the multi-species gill net fishery to be pursued but striped bass canonly be harvested as bycatch, meaning that it is not to be targeted. Fishermen musthave a catch composition consisting <strong>of</strong> at least 50% other species by weight whenharvesting striped bass. Since 1996, the DMF has worked with commercial fishermen,on a voluntary basis, to allow observers on their vessels in the ASMA while fishing gillnets. This work has been mostly focused on the flounder gill net fisheries during thesummer <strong>and</strong> early fall, when personnel have been available. Some trips have beenmade during other fisheries, but insufficient data were gathered to make an accurateestimation. In 2002, as a requirement for the permittee to fish gill nets in the PamlicoSound Gill Net Restricted Area (PSGNRA), observers were sent with fishermen toascertain interactions with sea turtles. In part <strong>of</strong> the PSGNRA, some <strong>of</strong> the effortoccurred north in the ASMA. Data was used from these trips <strong>and</strong> included in theestimates <strong>of</strong> discard for the ASMA.Current AuthorityGeneral States <strong>of</strong> North CarolinaG.S. 113-170.4 Rules as to possession, transportation, <strong>and</strong> disposition <strong>of</strong> fisheriesresourcesG.S. 113-170.5 Violations with respect to coastal fisheries resourcesG.S. 113-182 Regulation <strong>of</strong> fishing <strong>and</strong> fisheriesG.S. 113-221(e) Rules; proclamations; emergency Commission meetingsG.S. 143B-289.52 Marine Fisheries Commission – powers <strong>and</strong> authorityNorth Carolina Marine Fisheries Commission RulesNorth Carolina Fisheries Rules for Coastal Waters (15A <strong>NC</strong>AC)3H .0103 Proclamation Authority <strong>of</strong> Fisheries Director3J .0103 Gill Nets, Seines, Identification, Restrictions3Q .0107 Special Rules, Joint Waters198
3M .0202 Striped Bass Season, Size <strong>and</strong> Harvest Limit Internal Coastal WatersMethodsUnattended Gill NetsThe bycatch <strong>of</strong> striped bass in gill nets in the ASMA has been addressed as a point <strong>of</strong>compliance to the ASMFC since 1994 with an estimation <strong>of</strong> discards assessed for eachyear (<strong>NC</strong>DMF 1997, 1998, 1999, 2000, 2001). In order to calculate a gill net bycatchestimate for the ASMA, gill net effort was estimated as well as rates <strong>of</strong> bycatch <strong>and</strong>mortality. Estimates were stratified by month <strong>and</strong> season. Because observer coveragewas limited, assumptions concerning gill net effort had to be substituted whereobservations could not be made. Total number <strong>of</strong> fishing trips needed to be established,then to allocate trips into major fishery categories, <strong>and</strong> finally a st<strong>and</strong>ard measure <strong>of</strong> gillnet effort was developed. The total number <strong>of</strong> trips was obtained from the DMF TripTicket Program. Each time fish are sold to a licensed seafood dealer in North Carolina atrip ticket must be completed. Information included on each ticket includes the weight inpounds for each species sold, the gear types (i.e., trawl, gill net, pound net, etc), <strong>and</strong>the primary area fished. While the total number <strong>of</strong> gill net fishing trips was easilyobtainable, assumptions were required to determine the mesh size used in each trip.First, three trip categories were established flounder, shad, <strong>and</strong> small mesh (Table10.11). Next, predominate allowable mesh sizes were estimated for each category.Table 10.11.Number <strong>of</strong> trips by category for the anchored gill net fisheries in the Albemarle Sound<strong>Management</strong> Area.CALENDER YEARFISHERY 1994 1995 1996 1997 1998 1999 2000 2001Flounder 10,059 10,356 8,338 12,866 10,311 8,425 9,326 10,099Shad 832 1,430 1,836 1,527 2,252 2,288 2,546 2,573UnattendSm. Mesh4,010 4,721 3,853 3,423 2,671 6,317 6,351 6,996Attend Sm.Mesh1,549 740 1,161 1,258 2,466 1,974 1,726 1,530Based on observer <strong>and</strong> fishery research, the predominate mesh used in the perch,mullet <strong>and</strong> herring fisheries is 3.0 inch stretched mesh, while 5 ½ inch stretched mesh(ISM) are used in the flounder <strong>and</strong> shad fisheries. Third, assuming that size selectivity<strong>of</strong> small mesh nets would not result in substantial catches <strong>of</strong> flounder or shad, <strong>and</strong> thatflounder <strong>and</strong> shad trips could be categorized based on catch characteristics each tripwas examined for species composition <strong>and</strong> assigned to one <strong>of</strong> the three categoriesbased on the primary species l<strong>and</strong>ed. A catch that consisted <strong>of</strong> 10% or greater <strong>of</strong>flounder, <strong>and</strong> flounder l<strong>and</strong>ings greater than shad, was considered a flounder trip. Thisprocedure worked well when determining the number <strong>of</strong> flounder trips, largely becauseregulations require ‘sinking’ the nets during the flounder fishing. The 5 ½ ISM or largersink gill net is more effective in the capture <strong>of</strong> flounder than any other species, <strong>and</strong>usually other gill net types are not fished simultaneously with the flounder net, so the tripwould not be miscategorized to another type <strong>of</strong> fishery. The minimum mesh sizeallowed for flounder nets is 5 ¼ ISM, but the majority <strong>of</strong> participants sampled through199
observers used 5 ½ ISM. This is not the case when estimates <strong>of</strong> trips were made for theshad <strong>and</strong> the small mesh category in the spring. These fisheries occur simultaneously<strong>and</strong> fishermen typically employ both shad nets <strong>and</strong> small mesh nets in a single trip.Although several mesh sizes were likely used in any given trip, trips were either countedas shad or small mesh trips depending on the catch composition. Shad trips weredefined as shad l<strong>and</strong>ings greater than flounder or greater than 30 pounds <strong>of</strong> shad. A tripthat did not meet the criteria for the flounder or shad trip was considered small meshtrips.Once the number <strong>of</strong> trips for each category year <strong>and</strong> month was estimated, trips wereexp<strong>and</strong>ed into “trip days”, the yardage used per trip was estimated, <strong>and</strong> total effortst<strong>and</strong>ardized into ‘net yard days’. The amount <strong>of</strong> gear used per trip was estimated forthe flounder nets by using the average yardage observed from “at-sea” observer datacompiled by DMF staff (Table 10.12). Insufficient observer data was obtained for theTable 10.12.Observed yardage through at-sea observer sampling with commercial fishermenin the Albemarle Sound <strong>Management</strong> Area.CALENDER YEARFISHERY 1996 1997 1998 1999 2000 2001Flounder 40,000 26,480 20,345 9,000 28,000Shad 5,345 4,270 2,000Sm. Mesh * 6,120 1,360 1,200 800*Trips observed were during the unattended <strong>and</strong> attended seasons.shad <strong>and</strong> small mesh trips, so maximum yardage allowed by regulation was used forthe estimate. Although it is probably safe to assume that most fishermen are utilizing themaximum, it is not the case in every trip. Finally, effort data was further exp<strong>and</strong>ed into“yard days” by multiplying the number <strong>of</strong> “trip days” by the number <strong>of</strong> yards set per tripto come up with the final unit <strong>of</strong> effort, “net yard days”.Catch per unit <strong>of</strong> effort (CPUE) was defined as the number <strong>of</strong> striped bass per yard perday, (i.e., one yard set for one day equals one unit <strong>of</strong> effort). CPUE estimates weredeveloped for flounder nets, shad nets, <strong>and</strong> small mesh nets. The flounder net CPUEwas calculated using observer samples <strong>and</strong> <strong>Fishery</strong> Resource Grant (FRG) data (Keefe1995) for months when no observer data was available. Also, calculations <strong>of</strong> CPUEs forthe flounder nets were stratified by season, based on the availability <strong>of</strong> observer or FRGdata. The seasons were defined as November – May (FRG data) <strong>and</strong> June – October(observer data). CPUE was then calculated by dividing the number <strong>of</strong> striped basscaptured by the total yards fished. CPUE for the small mesh (3.0, 3 ¼, 3 ¾, 4.0 ISM)<strong>and</strong> shad fisheries were calculated using <strong>NC</strong>DMF’s <strong>Fishery</strong> Independent Gill Net Survey(FIGNS) data. The survey employs a floating <strong>and</strong> sinking 5 ½ ISM gill net similar infunction to gill nets used to target shad. The only significant differences are themon<strong>of</strong>ilament twine size, which is slightly larger in diameter, <strong>and</strong> the depth that the netsare fished, which is somewhat shallower than those utilized by commercial shadfishermen. The survey also employs a 3.0, 3 ½ , <strong>and</strong> 4.0 ISM gill net, similar in function200
to those utilized by commercial fishermen. The 3 ½ ISM net is not allowed to be fishedcommercially in the ASMA, but this mesh size was used for the estimation process inlieu <strong>of</strong> the 3 ¼ <strong>and</strong> 3 ¾ ISM. CPUE values were calculated using the same methodsdescribed above. In 2000 <strong>and</strong> 2001, FRG data (Rose 2000,2001) utilizing shad netswas incorporated into the calculations for CPUE for the shad fishery. For the flounderfishery, mortality rates were calculated for the seasons mentioned above using observer<strong>and</strong> FRG data. For the remaining fisheries, mortality was calculated monthly using theFIGNS data. Mortality rates from the Rose FRGs were used in calculations for the shadfishery in 2000 <strong>and</strong> 2001.Mortality rates were calculated by dividing the number <strong>of</strong> dead fish observed at the timethe net was fished by the total number captured. Estimates <strong>of</strong> delayed mortality weremade using 25%, 50%, <strong>and</strong> 75% <strong>of</strong> the encounters <strong>and</strong> combined with the initialmortality figures (Table 10.13).Table 10.13. Estimates <strong>of</strong> initial <strong>and</strong> delayed discard mortality for the unattended gill net fishery in the AlbemarleSound <strong>Management</strong> Area 1994 - 2002.1994Combined Initial <strong>and</strong> Delayed MortalityInitial Mortality 25% 50% 75%Flounder 4,133 14,666 5,620 19,943 7,107 25,219 8,593 30,492Shad 1,861 6,604 2,267 8,045 2,674 9,489 3,080 10,940Un. Sm Mesh 33,142 82,457 43,255 107,618 53,368 132,779 63,481 157,940Att.Sm Mesh 6,963 17,324 10,837 26,962 14,712 36,603 18,586 46,242TOTAL 46,099 121,051 61,979 162,568 77,861 204,090 93,740 245,6141995Combined Initial <strong>and</strong> Delayed MortalityInitial Mortality 25% 50% 75%Net Type Lb. <strong>of</strong> STB Lb. <strong>of</strong> STB No. <strong>of</strong> STB Lb. <strong>of</strong> STB No. <strong>of</strong> STB Lb. <strong>of</strong> TB No. <strong>of</strong> STB Lb. <strong>of</strong> STBFlounder 8,581 31,791 12,055 44,662 15,529 57,532 19,002 70,399Shad 12,026 44,554 14,445 53,516 16,865 62,482 19,284 71,444Un. SmMesh 124,694 143,273 170,233 195,597 215,772 247,921 261,311 300,246Att.SmMesh 22,22 2,553 3,459 3,974 4,695 5,395 5,932 6,816TOTAL 147,523 222,171 200,192 297,749 252,861 373,330 305,529 448,905201
Table 10.13. (Continued)1996Combined Initial <strong>and</strong> Delayed MortalityInitial Mortality 25% 50% 75%NET TYPE # OF STB LB OF STB # OF STB LB OF STB # OF STB LB OF STB # OF STB LB OF STBFlounder* 6575 28023 9421 40153 12268 52287 15114 64417Shad 15199 64778 17533 74726 19866 84669 22200 94616Un. Sm 18491 23502 23858 30323 29226 37146 34593 43968MeshAtt.Sm 3636 4621 5659 7193 7682 9764 9705 12335MeshTOTAL 43901 120924 56471 152395 69042 183866 81612 2153361997Combined Initial <strong>and</strong> Delayed MortalityInitial Mortality 25% 50% 75%NET TYPE # OF STB LB OF STB # OF STB LB OF STB # OF STB LB OF STB # OF STB LB OF STBFlounder* 10438 51585 13748 67943 17058 84301 20369 100664Shad 11529 56976 16097 79551 20664 102121 25232 124696Un. Sm 51908 110668 85610 182521 119311 254371 153013 326224MeshAtt.Sm 4067 8671 6330 13496 8593 18320 10856 23145MeshTOTAL 77942 227900 121785 343511 165626 459113 209470 5747291998Combined Initial <strong>and</strong> Delayed MortalityInitial Mortality 25% 50% 75%NET TYPE # OF STB LB OF STB # OF STB LB OF STB # OF STB LB OF STB # OF STB LB OF STBFlounder* 3875 15646 8003 32314 12190 49219 16348 66008Shad 18519 74775 31874 128699 45230 182627 58585 236551Un. Sm 29176 45436 43062 67061 56947 88684 70833 110309MeshAtt.Sm 7350 11446 11440 17816 15530 24185 19620 30554MeshTOTAL 58920 147303 94379 245890 129897 344715 165386 4434221999Combined Initial <strong>and</strong> Delayed MortalityInitial Mortality 25% 50% 75%NET TYPE # OF STB LB OF # OF STB LB OF # OF STB LB OF # OF LB OF STBSTBSTBSTB STBFlounder* 5156 20111 6806 26547 8457 32987 10107 39422Shad 9659 37675 18980 74032 28302 110392 37623 146749Un. Sm 41118 81257 54322 107350 67526 133444 80730 159538MeshAtt.Sm 7099 14029 11049 21835 14999 29641 18949 37447MeshTOTAL 63032 153072 91157 229764 119284 306464 147409 383156202
Table 10.13. (Continued)2000Combined Initial <strong>and</strong> Delayed MortalityInitial Mortality 25% 50% 75%NET TYPE # OF STB LB OF # OF STB LB OF # OF STB LB OF # OF LB OF STBSTBSTBSTB STBFlounder* 4665 18328 5941 23341 7216 28350 8492 33364Shad 7263 28535 9855 38719 12446 48898 15038 59082Un. Sm 42545 91134 52321 112075 62098 133018 71874 153959MeshAtt.Sm 6207 13296 9661 20695 13114 28091 16568 35490MeshTOTAL 60680 151293 77778 194830 94874 238357 111972 2818952001Combined Initial <strong>and</strong> Delayed MortalityInitial Mortality 25% 50% 75%NET TYPE # OF STB LB OF # OF STB LB OF # OF STB LB OF # OF LB OF STBSTBSTBSTB STBFlounder* 3416 15046 5070 22331 6723 29612 8377 36897Shad 4295 18918 7141 31454 9987 43989 12833 56525Un. Sm 27426 58083 35570 75330 43714 92578 51857 109823MeshAtt.Sm 5502 11652 8564 18137 11625 24620 14687 31104MeshTOTAL 40639 103699 56345 147252 72049 190799 87754 2343492002Combined Initial <strong>and</strong> Delayed MortalityInitial Mortality 25% 50% 75%NET TYPE # OF STB LB OF # OF STB LB OF # OF STB LB OF # OF LB OF STBSTBSTBSTB STBFlounder* 4994 21992 14722 64831 20331 89531 25941 114236Shad 4702 20873 8912 39562 13123 58255 17333 76944Un. Sm 46928 85790 62913 115013 78899 144237 94884 173459MeshAtt.Sm 7818 14292 12168 22245 16518 30197 20868 38149MeshTOTAL 64442 145212 98715 241651 128871 322220 159136 402788Example <strong>of</strong> procedure for estimation <strong>of</strong> dead discards from shad gill nets.2000 Encounters minus harvestTrip daysNo. STB No. harvest Adjusted number MortalityNumberdiscardMonthSTB/tripSTBpercent mortalityFebruary 770 19.5 15,015 8,842 6,173 12.6 778March 1336 7.5 10,020 9,612 408 27.6 113April 440 50 22,000 6,457 15,543 41.0 6,373Total number 7,263203
The total catch <strong>of</strong> striped bass in numbers was determined for each month bymultiplying the number <strong>of</strong> striped bass per yard, per day, by the number <strong>of</strong> gill net yarddays for each category. Fish captured in all categories when the striped basscommercial season was open accounted for harvest. Total numbers <strong>of</strong> striped bassharvested in a month were estimated by dividing the total pounds harvested in a monthby the mean weight <strong>of</strong> the fish harvested as determined from commercial striped basssamples. The number <strong>of</strong> discard mortalities was the result <strong>of</strong> the total catch minus anycommercial harvest multiplied by the mortality rate.The number <strong>of</strong> discards at age was determined from FIGNS data. Numbers <strong>of</strong> discardsby mesh size were proportioned into age groups based on the composition <strong>of</strong> ageclasses in the 3.0 <strong>and</strong> the 5 ½ ISM from the gill net survey. The numbers were thenconverted into pounds based on mean weight at age for a particular mesh size.During the development <strong>of</strong> the fishery management plan (FMP) for southern flounder,the discards <strong>of</strong> striped bass was discussed as an issue during the process. Thediscards <strong>of</strong> striped bass were discussed only as it pertained to the flounder gill netfishery. A different criteria was used for the determination <strong>of</strong> a flounder trip. For thisprocess, a trip that consisted <strong>of</strong> greater than fifty percent by weight flounder wasconsidered a flounder trip. In previous estimations, a lower percentage was used todetermine a flounder trip. The estimation <strong>of</strong> discards during the southern flounder FMPresulted in a lower number <strong>of</strong> trips in the flounder net category <strong>and</strong> thus lowered thenumber <strong>of</strong> discards. Trips that were lost from this category, due to the percentage <strong>of</strong>catch, would have fallen into one <strong>of</strong> the other two categories, increasing the number <strong>of</strong>discards for these fisheries.MethodsAttended Gill NetsDuring the late spring through early fall, an attended small mesh gill net fishery isallowed. This fishery is dominated by nets targeting striped mullet <strong>and</strong> perch. For anestimate, methods similar to those used for the unattended fishery were used. TwoFRGs, targeting striped mullet, conducted between 1997 <strong>and</strong> 1999 were compared toestablish the CPUEs for these fisheries (D<strong>and</strong>ar 1998, Williams 1997). The maximumyardage allowed was used to determine the number <strong>of</strong> striped bass per trip. One <strong>of</strong>these FRGs included initial mortality <strong>of</strong> striped bass in their project (Williams 1997).Estimates <strong>of</strong> delayed mortality were made using 25%, 50% <strong>and</strong> 75% mortality <strong>of</strong> theestimated encounters <strong>and</strong> combined with the initial mortality figures (Table 10.13).ResultsUnattended Gill NetsThrough data derived from the 1995 - 1997 FRG (Keefe 1995) <strong>and</strong> data collected fromthe at-sea observer program, CPUE values were calculated by month. It was estimatedthat during the time period <strong>of</strong> the 1995 FRG (November – May), utilizing flounder nets,the average number <strong>of</strong> striped bass encountered was approximately 3.7 fish per trip.This is using an average number <strong>of</strong> approximately 2,200 yards per operation. Data204
collected through the southern flounder FMP puts the average number <strong>of</strong> yards per tripat approximately 1,900 yards per trip (3.2 fish per trip). CPUE <strong>of</strong> striped bass from theflounder observer trips (June – October) have ranged from 0.48 (1996) fish per trip to0.98 (2000) fish per trip using the 2,200 yard average. Using an average yardage <strong>of</strong>1,900 yards, it ranged from 0.41 (1996) to 0.88 (2000). The FIGNS data was used toestimate mortality for the period the nets were fished, the other month’s mortality wasderived from the observer samples. Initial mortality for the flounder net category rangedfrom approximately 28% in the winter months <strong>and</strong> as high as approximately 66% duringthe summer. Estimations <strong>of</strong> discards for flounder nets have ranged from 4,133 fish(14,666 lb.) in 1994 to 10,438 fish (51,585 lb.) in 1997. Discards have been on a declinefor this fishery since 1997 with 3,416 fish (15,046 lb.) discarded in 2001 (Table 10.13).The 5½ ISM gill net utilized by the FIGNS was used for estimations <strong>of</strong> striped bassdiscards for the shad fishery from 1994 – 1999. A FRG investigating the interactions <strong>of</strong>migratory waterfowl with shad nets was incorporated into the estimate for 2000 <strong>and</strong>2001 (Rose 2000, 2001). Because <strong>of</strong> inadequate observer data, the maximum netyardage was used for calculating the CPUE. The average number <strong>of</strong> striped bassencountered has ranged from 6 fish per trip in 1994, with a maximum <strong>of</strong> 500 yardsallowed, to a high <strong>of</strong> 50 fish per trip in April 1999 <strong>and</strong> 2000, near the end <strong>of</strong> shadseason with an allowable 1,000 yards <strong>of</strong> gill net. From the FIGNS data, initial mortalityhas ranged from a low <strong>of</strong> 12.6% in February 2001 to a high <strong>of</strong> approximately 70% inApril 1998. Estimates <strong>of</strong> discards have ranged from 1,861 fish (6,604 lb.) in 1994 to18,519 fish (74,775 lb.) in 1998. The number <strong>of</strong> discards in the shad net fishery havebeen on the decline since 1996 with 4,295 fish (18,918 lb.) discarded in 2001 (Table10.13).For an estimation <strong>of</strong> discards in the small mesh fisheries, the 3.0 ISM gill net, utilized bythe FIGNS was used. The numbers <strong>of</strong> observations <strong>of</strong> this fishery were insufficient tocalculate a reliable estimate, so the maximum number <strong>of</strong> yards allowed was used tocalculate CPUE. The average number <strong>of</strong> striped bass encountered has ranged from 0striped bass per trip (April 1994) to 43 striped bass per trip (1995). Initial mortality hasranged from 41% in 1997 to a high <strong>of</strong> 88% in April <strong>of</strong> 1998. The number <strong>of</strong> discards insmall mesh nets has ranged from 18,491 fish (23,502 lb.) in 1996 to 124,694 fish(143,273 lb.) in 1995. The number <strong>of</strong> discards in the small mesh fishery has fluctuatedfrom year to year since 1996, but has been lower than the 1995 estimation (Table10.13).Attended Gill NetsUsing data derived from the two FRGs between 1997 <strong>and</strong> 1999 (D<strong>and</strong>ar 1998, Williams1997), the average number <strong>of</strong> striped bass encountered during the attended fishery wasapproximated 11.6 fish per trip (av. trip 800 yards). In 1994, the number <strong>of</strong> striped bassencountered was slightly higher (14.5 fish/trip), due to the 1,000 yards per operationthat was allowed. All other years since has been regulated to a maximum <strong>of</strong> 800 yards.Initial mortality from the Williams FRG was estimated to be approximately 31%.Estimates <strong>of</strong> discard ranged from a low <strong>of</strong> 2,222 fish (2,553 lb.) in 1995 to a high <strong>of</strong>7,818 fish (14,292 lb.) in 2002.205
DiscussionThrough the 1990s <strong>and</strong> into 2002 the harvest <strong>of</strong> striped bass has been managed by atotal allowable catch (TAC). Until 1998, the TAC for the commercial fishery <strong>of</strong> stripedbass was held at 98,000 lb. With the growth <strong>of</strong> the population <strong>and</strong> the static TAC,discards <strong>of</strong> striped bass increased. In October 1997, the A/R stock was declaredrecovered by the ASMFC after showing substantial growth in the population. Since1997, the TAC has increased four times to the current harvest level <strong>of</strong> 275,000 lb. forthe commercial fishery. This increase in harvest has had the effect <strong>of</strong> lowering thenumber <strong>of</strong> discards in the large mesh fisheries (flounder <strong>and</strong> shad) (Figure 10.9). More<strong>of</strong> these fish that would have been discarded in previous years are now making it tomarket. Still, the number <strong>of</strong> estimated discards combined with commercial harvest hasexceeded the TAC during each year. In years prior to the poundage increases, thepoundage <strong>of</strong> discards have been equivalent to or as much as two times the allowedharvest for that year.A majority <strong>of</strong> the discards in the gill net fishery in the ASMA have occurred in the smallmesh gill nets (Figure 10.9). During the unattended season, the fishery is comprisedprimarily <strong>of</strong> 3.0 <strong>and</strong> 3 ¼ ISM gill nets that target perch, striped mullet, <strong>and</strong> river herring.Also, in areas <strong>of</strong> the Croatan <strong>and</strong> Roanoke sounds, 3 ¾ <strong>and</strong> 4 ISM gill nets are allowedfor the targeting <strong>of</strong> trout, bluefish, hickory shad <strong>and</strong> croaker. During the attended fishery,3 through 4 ISM are allowed. Examination <strong>of</strong> data from the FIGNS for gill nets <strong>of</strong> thissize shows that approximately 18 to 22% <strong>of</strong> striped bass captured in the 3.0 <strong>and</strong> 3 ½ISM are <strong>of</strong> legal harvestable size (18” TL). Approximately 65% <strong>of</strong> fish captured in the4.0 ISM are <strong>of</strong> legal harvestable size. Most striped bass caught in the 3.0 <strong>and</strong> 3 ½ ISMare two to three years old <strong>and</strong> less than 18” in length. These fish tend to be caughtalong the gill plates where a greater chance <strong>of</strong> mortality occurs. Although the TAC forthe commercial fishery has increased, it has had little affect in lowering the number <strong>of</strong>discard mortalities in the small mesh fishery, since few fish could be legally harvested.Delayed mortality, as presented in Table 10.13, may have a significant effect on thetotal number <strong>of</strong> losses <strong>of</strong> striped bass. At this time there has been little work to quantifythe impact <strong>of</strong> mortality on striped bass that were released alive from a gill net, but die ata later time. The use <strong>of</strong> the 25%, 50%, <strong>and</strong> 75% mortality is given as a possible range inwhich this mortality may occur. It is known that from tag recaptures in the FIGNS thatfish do survive being caught in a gill net, but what percent is not known. A brief studywas performed in 1999, by DMF that held fish for 72 hours after capture. This study,which is not yet published, showed an approximate 8.3% mortality for large mesh netsin the spring <strong>and</strong> summer. Results from small mesh nets showed a 100% mortality. Theproblem with this survey was sample size. There were only 35 fish captured for thelarge mesh portion <strong>of</strong> the study, which could influence the low mortality rate. Samplesize was also a limiting factor for the small mesh portion, which only collected eight fish.206
1994 Harvest (TAC=156,800 lb) <strong>and</strong> Discard Mortality1994 Harvest <strong>and</strong> Discard Mortality in Numbers58,34012,73182,45716,7103,71233,142102,367Comm. HarvestRec. Discard (RRMA only)Shad DiscardSm Mesh Attended Discard41%6,60417,32414,666Rec. HarvestFlounder DiscardSm Mesh Unattended Discard21,646Comm. HarvestRec. Discard (RRMA only)Shad DiscardSm Mesh Attended Discard51%1,8616,9634,133Rec. HarvestFlounder DiscardSm Mesh Unattended Discard1995 Harvest (TAC=156,800 lb) <strong>and</strong> Discard Mortality1995 Harvest <strong>and</strong> Discard Mortality in Numbers14,54059,45544,554 143,27358%3,81414,80120,03779%12,0268,581124,69487,876Comm. HarvestRec. Discard (RRMA only)Shad DiscardSm Mesh Attended Discard31,7912,553Rec. HarvestFlounder DiscardSm Mesh Unattended DiscardComm. HarvestRec. Discard (RRMA only)Shad DiscardSm Mesh Attended Discard2,222Rec. HarvestFlounder DiscardSm Mesh Unattended DiscardFigure 10.9. Percent contribution, in pounds <strong>and</strong> numbers <strong>of</strong> fish, to total removals <strong>of</strong> striped bass in the anchored gill netfisheries <strong>of</strong> the Albemarle Sound <strong>Management</strong> Area, 1994-2001.207
1996 Harvest (TAC=156,800 lb) <strong>and</strong> Discard Mortality1996 Harvest <strong>and</strong> Discard Mortality in Numbers57,36336,63440%64,77823,50215,80010,46149%15,19918,49190,100Comm. HarvestRec. Discard (RRMA only)Shad DiscardSm Mesh Attended Discard28,023 4,621Rec. HarvestFlounder DiscardSm Mesh Unattended Discard19,170Comm. HarvestRec. Discard (RRMA only)Shad DiscardSm Mesh Attended Discard6,575 3,636Rec. HarvestFlounder DiscardSm Mesh Unattended Discard1997 Harvest (TAC=156,800 lb) <strong>and</strong> Discard Mortality1997 Harvest <strong>and</strong> Discard Mortality in Numbers67,50420,41456,97651,90856,71650%110,66814,84257% 11,52996,12251,5858,67121,36010,4384,067Comm. HarvestRec. Discard (RRMA <strong>and</strong> ASMA)Shad DiscardSm Mesh Attended DiscardRec. HarvestFlounder DiscardSm Mesh Unattended DiscardComm. HarvestRec. Discard (RRMA <strong>and</strong> ASMA)Shad DiscardSm Mesh Attended DiscardRec. HarvestFlounder DiscardSm Mesh Unattended DiscardFigure 10.9. Continued208
1998 Harvest (TAC=250,880 lb) <strong>and</strong> Discard Mortality1998 Harvest <strong>and</strong> Discard Mortality in Numbers41,17812,440138,25974,77533%45,43642,71241%29,176123,927Comm. HarvestRec. Discard (RRMA <strong>and</strong> ASMA)Shad DiscardSm Mesh Attended Discard11,44615,646Rec. HarvestFlounder DiscardSm Mesh Unattended Discard28,514Comm. HarvestRec. Discard (RRMA <strong>and</strong> ASMA)Shad DiscardSm Mesh Attended Discard18,5197,3503,875Rec. HarvestFlounder DiscardSm Mesh Unattended Discard1999 Harvest (TAC=275,968 lb) <strong>and</strong> Discard Mortality1999 Harvest <strong>and</strong> Discard Mortality in Numbers133,71043,15381,25739,35713,21641,11831%41%162,875Comm. HarvestRec. Discard (RRMA <strong>and</strong> ASMA)Shad DiscardSm Mesh Attended Discard37,67514,02920,111Rec. HarvestFlounder DiscardSm Mesh Unattended Discard37,390Comm. HarvestRec. Discard (RRMA <strong>and</strong> ASMA)Shad DiscardSm Mesh Attended Discard9,6597,0995,156Rec. HarvestFlounder DiscardSm Mesh Unattended DiscardFigure 10.9. Continued209
2000 Harvest (TAC=450,000 lb) <strong>and</strong> Discard Mortality2000 Harvest <strong>and</strong> Discard Mortality in Numbers235,74745,76291,13417,84842,54576,24223%30%13,2966,207Comm. Harvest214,029Rec. Discard (RRMA <strong>and</strong> ASMA)Shad DiscardSm Mesh Attended Discard28,535 18,328Rec. HarvestFlounder DiscardSm Mesh Unattended DiscardComm. Harvest 46,906Rec. Discard (RRMA <strong>and</strong> ASMA)Shad DiscardSm Mesh Attended Discard7,2634,665Rec. HarvestFlounder DiscardSm Mesh Unattended Discard2001 Harvest (TAC=450,000 lb) <strong>and</strong> Discard Mortality2001 Harvest <strong>and</strong> Discard Mortality in Numbers231,331 57,19658,08275,34016,72527,42617%11,65222%5,502220,227Comm. HarvestRec. Discard (RRMA <strong>and</strong> ASMA)Shad DiscardSm Mesh Attended Discard18,919 15,046Rec. HarvestFlounder DiscardSm Mesh Unattended Discard49,439Comm. HarvestRec. Discard (RRMA <strong>and</strong> ASMA)Shad DiscardSm Mesh Attended Discard3,4164,295Rec. HarvestFlounder DiscardSm Mesh Unattended DiscardFigure 10.9. Continued210
Limitations <strong>of</strong> DataThe use <strong>of</strong> various FRGs to estimate discard mortality <strong>of</strong> striped bass in the attendedfishery has its limitations. First, most <strong>of</strong> these studies used for estimation wereconducted in a very small area, which may not be representative <strong>of</strong> the entire ASMA.Catch rates that were experienced in one area may not be true for other areas. Anotherproblem is that these studies were conducted during a limited time period. CPUE valuesfrom one period probably are not indicative <strong>of</strong> other years. For example, the estimateddiscards <strong>of</strong> striped bass in the unattended small mesh fishery for 1995 were excessivelyhigh, but estimates during the attended fishery for that year were lower than any otheryear.<strong>Management</strong> Options1) Status Quo+ No further restrictions on gill net fishery due to interactions <strong>of</strong> target speciesstriped bass.- Current rate <strong>of</strong> discards would remain the same, unless harvest was increased.2) Restrict the amount, size, area <strong>and</strong> time period in which gill nets can be fished.+ Reduce the amount <strong>of</strong> gear in the water that could catch striped bass <strong>and</strong>reduce the bycatch mortality.Since the early 1990s, various restrictions have been implemented in the smallmesh gill net fishery in the ASMA. In the majority <strong>of</strong> the ASMA, only 3 <strong>and</strong> 3¼ inchsmall mesh gill nets are allowed. The small mesh unattended gill net fisherieshave the highest discard rates, due to a large portion <strong>of</strong> the fish being <strong>of</strong> sub-legalsize. The DMF data shows approximately 78-82% <strong>of</strong> the striped bass captured inthe small mesh fishery are less than 18 inches total length. From 1998 to 2002,unattended small mesh gill nets have accounted for 50-73% <strong>of</strong> the total estimateddiscards from all gill net fisheries.The attended small mesh gill net fishery requires that the fishermen be within 100yards <strong>of</strong> the gear at all times <strong>and</strong> immediately available to work the gear. Thesegill nets also have an amount <strong>of</strong> discard mortality <strong>of</strong> striped bass; however, theestimates are 3 to 6 times less than the unattended nets, contributing 10-13% <strong>of</strong>the total discards. Even though the TAC in the ASMA has increased four timessince 1997, it has had very little effect in lowering the discard mortality in the smallmesh nets due to few fish being <strong>of</strong> legal size.In 2000, the MFC approved the ASMA River Herring <strong>Fishery</strong> <strong>Management</strong> <strong>Plan</strong>,which established a 67,000 pound gill net TAC. Since 2000, when river herring gillnet season closes 3 inch gill nets have been removed from the water. Gill nets <strong>of</strong>3¼ inch are still allowed <strong>and</strong> limited to 800 yards. The attendance requirement forsmall mesh gill nets has been implemented between May 7-14 annually since2000.When river herring gill net season closes, remove all small mesh gill nets from thewater until attendance is required. Removal <strong>of</strong> the nets would greatly reduce theamount <strong>of</strong> discards, but would eliminate the harvest <strong>of</strong> other marketable speciesduring that time period (Table 10.14).211
When river herring gill net season closes require all small mesh nets to beattended at all times. Attendance <strong>of</strong> small mesh gill nets is documented to reducethe number <strong>of</strong> striped bass discards significantly. Requiring attendance has alsoreduced the number <strong>of</strong> trips that occur. The attendance requirement would allowmarketable species to be harvested <strong>and</strong> sold (Table 10.14).Other fisheries include up to 31 species, top 7 species: catfishes, Atlanticmenhaden, spot, striped mullet, weakfish, white peach <strong>and</strong> yellow perch.- Would result in the loss <strong>of</strong> more marketable fish.3) Remove gill nets as an allowable gear.+ Would allow current bycatch mortality to be converted to harvest for otherfisheries.- Would result in gill net fishermen having to seek alternative gears.4) First Instance Mortality – The utilization for harvest all dead, marketable stripedbass regardless <strong>of</strong> their size.+ Would eliminate the majority <strong>of</strong> discard mortality from the gill net fishery.+ Allow for a more accurate stock assessment by eliminating the uncertainty <strong>of</strong>discard mortality.+ Poundage that is lost as discard mortality could be converted into harvest.- To insure that discard mortality does not occur after the TAC is achieved, all gillnets would have to be removed from the water.5) Allow Hook-<strong>and</strong>-Line as a commercial gear.+ Would allow the commercial harvest by hook <strong>and</strong> line since 1985.+ Discard mortality would not be as significant as other types <strong>of</strong> gear.- Striped bass harvested by hook <strong>and</strong> line would not be available for other geartypes.Research Needs1) More at-sea observations made for the gill net fishery to more accurately assessthe discards from fishery.+ Allows for a more accurate account <strong>of</strong> the unmarketable bycatch <strong>and</strong> a fullerassessment <strong>of</strong> what is being caught.- Increases burden on fishermen to have extra people on board their vessels.- High cost <strong>of</strong> running a survey.2) Improvement in trip ticket data to collect gear parameters (yardage, mesh size,etc.).+ Allow gathering <strong>of</strong> information that could be used for calculations <strong>of</strong> total yardsfished in a fishery <strong>and</strong> CPUE for species.- Increases the amount <strong>of</strong> time for filling out trip tickets.- Increases work load for Trip Ticket staff.3) Further investigate the impacts <strong>of</strong> delayed mortality on striped bass captured in gillnets.+ Gives a more complete picture <strong>of</strong> the total losses to the striped bass population.- Number <strong>of</strong> delayed mortalities may impact the number <strong>of</strong> striped bass thatcould be harvested.212
MFC, DMF, WRC <strong>and</strong> FWS <strong>Management</strong> RecommendationSupport the A/R AC option with the following qualifications: 1. DMF will evaluateexisting IGNS small mesh data to determine differences between striped bass catchesin float <strong>and</strong> sink nets. 2. Observer data, current <strong>and</strong> new studies will be used to assessthe benefit <strong>of</strong> the A/R option. Should the discard reductions not be within the estimatedrange <strong>of</strong> the other options presented in Table 10.14, the DMF may implement eitherOption 2 or 3 <strong>of</strong> the table or other options that may be developed over time.A/R Advisory Committee <strong>Management</strong> RecommendationStay at status Quo (existing gill net proclamation authority), with requirement that smallmesh gill nets be sunk after river herring gill net season closes. Small mesh gill nets (3¼ inch) would be restricted to no more than 25 – 30 meshes deep <strong>and</strong> set in no lessthan 7 feet <strong>of</strong> water unless attended. These requirements would remain in effect whenattendance was not required. Also, look at area closures to gill nets.Option 2 Restrict the amount, size, area <strong>and</strong> time period in which gill nets can befishedAmount• Currently allowed• 3,000 yards <strong>of</strong> flounder net (5 ¼” or greater sunken to fish no more than 4’ frombottom)/ year round• 1,000 yards <strong>of</strong> shad net (5 ¼” or greater)/ mid - February – mid-AprilTable 10.14. Data utilized for Albemarle Sound <strong>Management</strong> Area, 2002.First Instance Mortality – Attended small mesh gillNo nets less that 5 ISM nets after river herringseasonEstimated reduction indiscard mortality (%)Remaining mortality for allanchored gill nets (# <strong>of</strong>fish)Percent contribution <strong>of</strong>remaining discards to totalpopulationEstimated number <strong>of</strong> fishsaved from discardmortalityPercentage <strong>of</strong> fish savedNo small mesh nets afterriver herring season85 1 43.8 50.49,696 1 36,191 32,4440.29 1.09 0.9954,746 28,251 31,9981.67 0.86 0.97to total populationImpact on other fisheries -1,823,828 lb/$771,934 2 1,823,828 lb/$771,934 3 -1,504,698 lb/$662,164 42002 population estimate used – 3.2 million fishTotal gill net l<strong>and</strong>ings ASMA 3,136,m278 pounds/$2,352,8381234This estimate could be up to 100%, but some mortality could remain from sub-legal fish. This is the 2002estimate for large mesh gill nets.If striped bass allocation caught prior to end <strong>of</strong> year, the impact would be greater due to loss <strong>of</strong> other speciescaught in large mesh gill nets (Example, flounder <strong>and</strong> shad).Potential to maintain catch, but when attendance is required, the number <strong>of</strong> trips decreases, thus harvest alsodecreases.Gill net river herring season closing March 1.213
• 800 yards <strong>of</strong> small mesh unattended (3 <strong>and</strong> 3 ¼”) January – early-May <strong>and</strong>December (3 ¾ <strong>and</strong> 4”) in parts <strong>of</strong> Croatan <strong>and</strong> Roanoke Sounds/ January – mid-April• 800 yards <strong>of</strong> small mesh attended (3 – 4”) May – NovemberShould the amount <strong>of</strong> webbing be reduced to minimize encounters with striped bass(all webbing, particular nets)?Size• Currently allowed• Minimum 5 ¼” sunken year-round (flounder)• Minimum 5 ¼” mid-February – mid-April (Shad)• 3 <strong>and</strong> 3 ¼” December – early-May (Small mesh unattended)/3” removed after gill netherring quota is caught• 3 ¾” <strong>and</strong> 4” in parts <strong>of</strong> Croatan <strong>and</strong> Roanoke Sounds /January – mid-April• 3 – 4” May – November (Small mesh attended)Is there a mesh size being used that is not necessary?Can the minimum <strong>of</strong> 5 ¼” be raised to lower the encounters <strong>of</strong> striped bass <strong>and</strong> stillallow the other fisheries to continue?Is there enough difference between the 3 <strong>and</strong> 3 ¼” fisheries to warrant allowing bothmesh sizes to be employed?Should the 3 ¾” <strong>and</strong> 4” be allowed in the Croatan <strong>and</strong> Roanoke Sounds?Area• Currently allowed• Gill netting allowed throughout the ASMA in joint <strong>and</strong> coastal waters with theexception <strong>of</strong>* Albemarle Sound west <strong>of</strong> a line from Black Walnut Point to mouth <strong>of</strong> KendricksCreek (Mackey’s). (closed from February - November)* No set gill nets in Roanoke, Middle, Eastmost, <strong>and</strong> Cashie Rivers. Only drift gillnets with a mesh size <strong>of</strong> 3” can be used <strong>and</strong> cannot exceed 100 yards.Are there areas in which certain gill nets should be restricted because <strong>of</strong> high encounterrates with striped bass?Examples• Use <strong>of</strong> shad nets in Northeastern portion <strong>of</strong> ASMA – high encounter rate with stripedbass, few American shad captured• Use <strong>of</strong> flounder nets in Croatan <strong>and</strong> Roanoke Sounds (late fall) particularly close toHwy 64/264 bridge in Manns Harbor – high encounter rate with striped bass214
Other areas?Time Period• Currently allowed• 5 ¼” flounder nets – year round• 5 ¼” shad nets – mid-February – mid-April• 3” <strong>and</strong> 3 ¼” small mesh unattended January – early-May, December• 3 ¾” <strong>and</strong> 4” small mesh unattended in parts <strong>of</strong> Croatan <strong>and</strong> Roanoke SoundsJanuary – mid-April• 3 –4” small mesh attended May – NovemberShould small mesh be attended for a longer period <strong>of</strong> time?Should small mesh be attended all the time?Should shad <strong>and</strong> flounder webbing be attended for part <strong>of</strong> the year or year round?Gear Configurations• Currently allowed• 3,000 yards 5 ¼” or larger sunken, to fish no more than 4’ from bottom/ year round(flounder)• 1,000 yards 5 ¼” or larger, float or sink/ mid-February – mid-April (shad)• 800 yards small mesh unattended (3” <strong>and</strong> 3 ¼” ), float or sink/ January- early May,December <strong>and</strong> 3 ¾” <strong>and</strong> 4”, float or sink/ January – mid April in parts <strong>of</strong> Croatan <strong>and</strong>Roanoke sounds• 800 yards small mesh attended(3 – 4”), float or sink/ mid-April – November• Gill nets <strong>of</strong> the above mentioned size can be hung in any manner a fishermenchooses. The st<strong>and</strong>ard hanging ratio is ½, but many fisherman hang nets on the ¼or less to bag webbing between the ties. This is thought to increase the catchability<strong>of</strong> the net.Float nets have a higher incidence <strong>of</strong> catching striped bass. Would it be feasible to fishonly sink nets? Would a sink shad net reduce the occurrence <strong>of</strong> striped bass but stillallow adequate harvest <strong>of</strong> other commercial fish?Small mesh?Does the hanging ratio <strong>of</strong> a gill net effect the number <strong>of</strong> striped bass that are captured?Should gill netters be made to hang nets on the ½?Information Paper for Potential Buyout Scenario <strong>of</strong> Gill Net <strong>Fishery</strong> in theAlbemarle Sound <strong>Management</strong> AreaIntroductionAt the request <strong>of</strong> members <strong>of</strong> the Albemarle/Roanoke Striped Bass AdvisoryCommittee, the Division <strong>of</strong> Marine Fisheries was asked to look at the potential for a215
possible “buyout” <strong>of</strong> the use <strong>of</strong> gill nets by commercial fishermen for a certain portion <strong>of</strong>the year. It was suggested that during certain months gill nets could be removed fromthe water, while compensating the commercial fishermen for monies lost during theclosed time. Compensation would be divided among the fishermen based on previousyears’ income for that time period. It has not been determined where these monieswould come from at this time.MethodsUsing the Division <strong>of</strong> Marine Fisheries Trip Ticket Program, the number <strong>of</strong> individualswere determined for each year from 1994 – 2001. These fishermen’s trips were thenbroken into three categories (flounder, shad, <strong>and</strong> small mesh) as done for estimatingdiscard mortality <strong>of</strong> striped bass (see Issue Paper Striped Bass Discard Mortality inthe Unattended <strong>and</strong> Attended Multi-species Gill Net <strong>Fishery</strong> in the AlbemarleSound <strong>Management</strong> Area). This allows examination <strong>of</strong> the potential income afisherman may make for a certain time period, utilizing a particular gill net.Ex-vessel value, the amount paid to the fisherman, was determined <strong>and</strong> fishermen werepartitioned into categories by the amount <strong>of</strong> money made (ex. $1-500, $501-1,000, etc.)for a certain time frame. Inflation was not factored into any <strong>of</strong> the values that arepresented.It became apparent during analysis <strong>of</strong> the data that the criteria for assigning trips to thethree categories may not truly represent the fisheries. The number <strong>of</strong> fishermen <strong>and</strong>value <strong>of</strong> the small mesh fishery was much lower than what was expected. Division stafflooked at this problem <strong>and</strong> assigned new values to each fishery. The original criteriacalled all trips l<strong>and</strong>ing more than 10% flounder <strong>and</strong> shad < flounder in their catch as aflounder trip. The new criteria increased to 30%. Shad trips were defined as a greatercatch <strong>of</strong> shad than flounder or greater than 30 pounds <strong>of</strong> shad. This was changed to agreater catch <strong>of</strong> shad than flounder <strong>and</strong> greater than 30 pounds <strong>of</strong> shad. All other tripsthat did not meet these criteria were called small mesh trips. The changing <strong>of</strong> the criteriamoved trips from the flounder <strong>and</strong> shad fishery into the small mesh fishery. Trips werelost from the flounder fishery to the small mesh fishery, but the number <strong>of</strong> individualsparticipating remained fairly constant. Approximately 56.1% <strong>of</strong> the shad fishermen werereallocated to the small mesh fishery using the new criteria.It is difficult to differentiate between the shad <strong>and</strong> small mesh fisheries, because inmany cases they occur at the same time. In many instances, fishermen will employ bothshad <strong>and</strong> small mesh nets at the same time, with only one trip ticket being completed atthe time the catch is sold. So in doing these calculations, the trip will only be counted inone category.Also, the trip tickets allow for more than one type <strong>of</strong> gear to be included. In some cases,fishermen will use gill nets <strong>and</strong> other forms <strong>of</strong> gear (pound nets, fyke nets, trotlines, etc.)<strong>and</strong> include them all on one trip ticket. This has the effect <strong>of</strong> inflating the actual value <strong>of</strong>the gill net fishery by including l<strong>and</strong>ings that originated from other gears.216
ResultsIt has been determined that the gill net fishermen have averaged a total <strong>of</strong> $2,764,528annually from 1994-2002 (Figure 10.10). The flounder gill net fishery has averaged$2,382,522 (86.2%) annually. The small mesh fishery has averaged $346,915 (12.5%)annually. The shad fishery has averaged $35,092 (1.3%) annually. These values werederived from the new criteria for the fisheries. Under the original criteria, the flounderfishery averaged $2,572,247 (93.1%), small mesh $97,373 (3.5%), <strong>and</strong> shad $94,907(3.4%) annually.There has been an average <strong>of</strong> 632 people involved in the gill net fishery annually (1994-2001), with a peak <strong>of</strong> 730 in 1995 to a low <strong>of</strong> 494 in 1999. Under the new criteria, anaverage <strong>of</strong> 630 (99.7%) people are involved in the flounder fishery, 571 (90.4%) in thesmall mesh fishery, <strong>and</strong> 83 (13.1%) in the shad fishery. Under the original criteria, 631(99.8%) people were involved in the flounder fishery, 532 (84.2%) in the small mesh,<strong>and</strong> 186 (29.9%) in the shad fishery.Under the original criteria, it was determined that approximately 63.4% <strong>of</strong> people fishingflounder nets made less than $2,000 annually (Figure 10.11). Approximately 90.8% <strong>of</strong>fishermen made less than $500 using small mesh nets, <strong>and</strong> 78.6% <strong>of</strong> fishermen madeless than $500 with shad nets. Under the new criteria, 65.9% <strong>of</strong> flounder fishermenmade less than $2,000, 72.1% <strong>of</strong> small mesh fishermen <strong>and</strong> 74.6% <strong>of</strong> shad fishermenmade less than $500 (Figures 10.14 – 10.16).217
Annual Gill Net L<strong>and</strong>ings Per Fishermen ($) (Anchored <strong>and</strong>Drift)Percent50454035302520151050$1-500$501-1,000$1,001-2,000$2,001-5,000$5,001-7,500$7,501-10,000Ex-Vessel Value$10,001-25,000$25,001-50,000>$50,00019941995199619971998199920002001Figure 10.10.Annual gill net l<strong>and</strong>ings value per fisherman(Anchored <strong>and</strong> Drift nets)60Percent504030201001994 (N=728)1995 (N=727)1996 (N=702)1997 (N=682)1998 (N=603)1999 (N=493)2000 (N=558)2001 (N=550)$1-500$501-1,000$1,001-2,000$2,001-5,000$5,001-7,500$7,501-10,000$10,001-25,000Ex-Vessel Value$25,001-50,000>$50,000Figure 10.11. Percent <strong>of</strong> participants by average value <strong>of</strong> annuall<strong>and</strong>ings for flounder nets using original criteria.218
Percent1009080706050403020100$1-500$501-1,000$1,001-2,000$2,001-5,000$5,001-7,500$7,501-10,000$10,001-25,000Ex-Vessel Value$25,001-50,000>$50,0001994 (N=146)1995 (N=180)1996 (N=199)1997 (N=193)1998 (N=187)1999 (N=190)2000 (N=188)2001 (N=207)Figure 10.12. Percent <strong>of</strong> participants by averagevalue <strong>of</strong> annual l<strong>and</strong>ings for shad netsusing original criteria.Percent1009080706050403020100$1-500$501-1,000$1,001-2,000$2,001-5,000$5,001-7,500$7,501-10,000$10,001-25,000Ex-Vessel Value$25,001-50,000>$50,0001994 (N=567)1995 (N=624)1996 (N=583)1997 (N=592)1998 (N=515)1999 (N=429)2000 (N=480)2001 (N=469)Figure 10.13. Percent <strong>of</strong> participants by averagevalue <strong>of</strong> annual l<strong>and</strong>ings for small meshnets using original criteria.219
Percent6050403020100$1-500$501-1,000$1,001-2,000$2,001-5,000$5,001-7,500$7,501-10,000$10,001-25,000Ex-Vessel Value$25,001-50,000>$50,0001994 (N=727)1995 (N=724)1996 (N=702)1997 (N=680)1998 (N=603)1999 (N=491)2000 (N=558)2001 (N=550)Figure 10.14. Percent <strong>of</strong> participants by average value <strong>of</strong>annual l<strong>and</strong>ings for flounder nets using newcriteria.Percent1009080706050403020100$1-500$501-1,000$1,001-2,000$2,001-5,000$5,001-7,500$7,501-10,000$10,001-25,000Ex-Vessel Value$25,001-50,000>$50,0001994 (N=45)1995 (N=51)1996 (N=72)1997 (N=74)1998 (N=116)1999 (N=91)2000 (N=107)2001 (N=110)Figure 10.15. Percent <strong>of</strong> participants by average value <strong>of</strong>annual l<strong>and</strong>ings for shad nets using new criteria.220
Percent1009080706050403020100$1-500$501-1,000$1,001-2,000$2,001-5,000$5,001-7,500$7,501-10,000$10,001-25,000Ex-Vessel Value$25,001-50,000>$50,0001994 (N=594)1995 (N=654)1996 (N=636)1997 (N=631)1998 (N=557)1999 (N=471)2000 (N=517)2001 (N=506)Figure 10.16. Percent <strong>of</strong> participants by average value<strong>of</strong> annual l<strong>and</strong>ings for small mesh netsusing new criteria.The closure <strong>of</strong> the use <strong>of</strong> gill nets for a certain length <strong>of</strong> time can have a differentialimpact depending on the time <strong>of</strong> year. The average value <strong>of</strong> the gill net fishery by monthfor the years 1994 – 2001 is presented in Table 10.15.Table 10.15.Average value to fishermen <strong>of</strong> the gill net fishery in the Albemarle SoundMonth Value Number <strong>of</strong> Fishermen Straight Average per FishermanJanuary $70,037 134 $523February $134,412 229 $586March $215,032 285 $755April $167,777 234 $718May $78,119 135 $580June $110,255 130 $851July $188,173 152 $1,238August $295,669 171 $1,732September $497,342 232 $2,140October $534,206 241 $2,215November $377,873 234 $1,612December $95,624 165 $57810.3.3 Harvest <strong>Management</strong>10.3.3.1 <strong>Management</strong> <strong>of</strong> Striped Bass Harvest Targets in the ASMA221
Issue<strong>Management</strong> <strong>of</strong> quotas <strong>and</strong> harvest targets for the ASMA <strong>and</strong> RRMA.BackgroundHarvest <strong>of</strong> striped bass in the ASMA <strong>and</strong> RRMA has been managed by fishing mortalitytargets achieved through Total Allowable Catch (TAC) restrictions since 1991. TAC’sare determined by applying target fishing mortality rates to abundance estimates fromthe annual stock assessment. Each fishery is allocated a specific portion <strong>of</strong> the TAC(Roanoke River 25%, Albemarle Sound Recreational 25%, Albemarle SoundCommercial 50%) <strong>and</strong> managed through fishery regulations such as seasons <strong>and</strong> creellimits. The ASMFC Striped Bass FMP <strong>and</strong> its Amendments, <strong>and</strong> the 1994 NorthCarolina Striped Bass FMP, specify that when fisheries are managed by TACs,overages are to be deducted from the TAC allocation for the following year. Suchprovisions are necessary to ensure that states adopt reasonable measures to preventoverages <strong>and</strong> strive to provide the most accurate <strong>and</strong> reliable point estimates <strong>of</strong> harvestpossible.Since 1994, striped bass harvest overages in the Albemarle Sound commercial <strong>and</strong>recreational fisheries have been deducted from the next year’s TAC allocations. From1994 through 2002, the estimates <strong>of</strong> striped bass harvest from the Roanoke Riverexceeded the cumulative TACs by approximately 23,000 lbs. (an average <strong>of</strong>approximately 2,600 lbs. per year) but were not repaid, because <strong>of</strong> a difference inopinion as to whether the Roanoke River harvest estimates were statistically differentfrom the TAC. The WRC, argued that as long as the statistical confidence bounds <strong>of</strong>the harvest estimate encompassed the TAC, then the harvest estimate was notstatistically different from the TAC <strong>and</strong> there was no overage to repay. The 1994Striped Bass FMP specifically stated “subtract any harvest overages from thesucceeding year’s TAC.”Provisions for Repayment <strong>of</strong> Roanoke River Quota Overages, 1994-2002Option 1. Payback through future underages or future increasesSince 1994, WRC has exceeded the harvest quota by approximately 23,000 pounds. Itis anticipated that significant harvest underages in the spring 2003 will negate anypayback obligation. Should it not, then the WRC will pay back these overages byutilizing the following options at its discretion1. Harvest overages will be paid back over several years through future TACunderages.2. Harvest overages will be paid back as allowable catches increase. The WRCproposes not to increase season length or creel limits until allowable catch hasincreased significantly. Because <strong>of</strong> potentially high catch rates <strong>and</strong> harvest in theRRMA, WRC recognizes that creel restrictions can only be relaxed if increases inTAC are great enough so that relaxation <strong>of</strong> regulations will not result inexceeding the TAC. Increases in allowable catch without adjustments in RRMA222
egulations should minimize the probability the TAC will be exceeded <strong>and</strong> alsoserve to pay back overages.Option 2. Direct Payback in 2004Require that the harvest <strong>of</strong> the Roanoke River recreational fisheries in 2004 arereduced by the sum <strong>of</strong> the 1994 – 2002 quota overages, in addition to any appropriateadjustments incurred during 2003.Option 3. No PaybackQuota overages <strong>of</strong> Roanoke River recreational fisheries from 1994 – 2002 will notrequire payback.TAC <strong>Management</strong> Options Beginning in 2004Option 1. <strong>Management</strong> through Strict TAC as in Current FMPThis option would continue the current system, which has been in place since 1994,with a TAC allocated to specific fisheries. Point estimates <strong>of</strong> the recreational harvestwill be used as indicators <strong>of</strong> actual harvest <strong>and</strong> estimate <strong>of</strong> commercial harvest willcome from trip ticket l<strong>and</strong>ings. DMF has managed the ASMA commercial <strong>and</strong>recreational fisheries by this means.Harvest overages in each fishery will be deducted from that fishery’s TAC for the nextyear. Harvest underages will not be carried over to the next year. Jurisdictions areobligated to close fisheries when it is projected that quota limits will be reached.Option 2.<strong>Management</strong> <strong>of</strong> Albemarle Fisheries TAC by Proclamation, Roanoke<strong>Fishery</strong> by Fixed RegulationsWRC <strong>Management</strong>This is the management system that has been in place for the RRMA since 2002.In the spring 2002, WRC initiated a pre-set striped bass harvest season in the RRMA toaddress angler complaints about the uncertainty <strong>of</strong> the striped bass harvest seasondates <strong>and</strong> their inability to plan fishing trips during the peak period. The pre-set harvestseason (March 1 – April 15 in the lower Roanoke River <strong>and</strong> tributaries below US Hwy.258 bridge <strong>and</strong> March 15 – April 30 in the upper river) was based on previous harvestrecords. Those records indicate that on average, the harvest will be within theestablished quota (112,500 lbs. in 2002). Because <strong>of</strong> annual differences in watertemperatures, migration dates <strong>and</strong> fishing conditions, it was assumed that harvestwould be less than the TAC in some years while harvest might exceed the TAC in otheryears. WRC’s goal was to provide a predictable season for anglers while remaining ator under the TAC on a long-term basis.To address potential overages, both chronic <strong>and</strong> acute, WRC will do the following:223
1. Use a 3-year running average <strong>of</strong> the point estimates <strong>of</strong> harvest (pounds <strong>of</strong> stripedbass) to evaluate performance <strong>of</strong> the pre-set season in the RRMA in relation tothe total allowable catch. If the 3-year running average exceeds the annual pointestimate by 10%, WRC will initiate rule changes to reduce harvest. Over thelonger term, should the annual harvests during the 5-year period exceed theannual TAC (α=0.05), additional harvest reduction rules will be initiated.2. In the event that a substantial over harvest <strong>of</strong> striped bass appears imminentwhile the harvest season is open, Inl<strong>and</strong> Fisheries staff will recommend to theWRC Executive Director to close the season by proclamation.DMF <strong>Management</strong>Quotas will be established for those fisheries managed under the DMF based onallocation <strong>of</strong> the annual TAC. Harvest monitoring will occur on each fishery <strong>and</strong> theseasons would close by proclamation. Overages will be deducted.Option 3. <strong>Management</strong> Through Harvest Targets for All FisheriesThe A/R stock <strong>of</strong> striped bass is considered recovered, <strong>and</strong> this FMP proposesmanaging for a specific fishing mortality target that is conservatively below the fishingmortality level that would result in overfishing. Such a management approach is basedon the premise that it is acceptable, <strong>and</strong> even expected, for fishing mortality to varyaround the target. Since the fishing mortality target is set reasonably below thethreshold mortality level that would lead to stock damage, it follows that values for TACthat are based on the target fishing mortality will also be reasonably below harvestlevels that would lead to stock damage. It also follows that observed harvest mayfluctuate around the TAC without posing any risks to the stock. Therefore, amanagement strategy based upon fishery-specific harvest targets determined from astock-specific TAC may be more appropriate than strict quotas, <strong>and</strong> may better addressfluctuations in abundance <strong>and</strong> yield that are expected <strong>and</strong> acceptable for a recoveredstock.The primary difference between management by harvest targets <strong>and</strong> management byTACs is that TACs are hard limits expected to be achieved precisely <strong>and</strong> that typicallyrequire deduction <strong>of</strong> overages, whereas targets are s<strong>of</strong>t limits expected to beapproximately met <strong>and</strong> do not require deductions <strong>of</strong> overages. Harvest limits should beaccompanied by bounding requirements to prevent excessive overages or changes inallocation schemes, <strong>and</strong> to ensure that jurisdictions adopt reasonable regulations. Forexample, it could be required that quota overages exceeding a percentage <strong>of</strong> theharvest limit (e.g., 10%) must be deducted, or it could be required that more restrictivemeasures be adopted if estimated harvest exceeds the harvest limit for a number <strong>of</strong>years (e.g., 3). So that there is no confusion, <strong>and</strong> in order to maintain a conservationbuffer under this option, any harvest underage for a particular year would not increasethe allowable catch for the following year nor allow relaxation <strong>of</strong> regulations. Harvestunderages would be used to <strong>of</strong>fset any overages occurring during the periods <strong>of</strong> thethree <strong>and</strong> five year running harvest estimates.224
Specific requirements:TAC AllocationRoanoke River/WRC -25% <strong>of</strong> totalAlbemarle Sound/DMF- 75%, withAlbemarle Sound recreational- 25% <strong>of</strong> totalAlbemarle Sound commercial- 50% <strong>of</strong> totalPenalties <strong>and</strong> Triggers for Chronic OveragesThe management strategy proposed here is based on the assumption that observedl<strong>and</strong>ings will fluctuate at r<strong>and</strong>om around the harvest limit, <strong>and</strong> that observed l<strong>and</strong>ingswill not significantly exceed the harvest limit. To prevent stock damage <strong>and</strong> theassociated burden on all fisheries <strong>of</strong> reduced TAC stemming from overages in a specificfishery; both short-term <strong>and</strong> long-term triggers are needed. Short-term triggers will beinvoked based on excessive overages in a single year, while long-term triggers will beinvoked if a consistent bias is observed over a number <strong>of</strong> years.Short - Term Excessive OveragesIf the point estimates <strong>of</strong> harvest for any fishery component exceeds its allocated harvesttarget by more than 20% in a single year, then the overage must be deducted from theallocation for that fishery in the next year <strong>and</strong> more restrictive measures instituted forthat fishery.Long –Term OveragesIf the point estimates <strong>of</strong> harvest for any fishery component exceed the allocated harvesttargets by 5% for three years in a row, then more restrictive measures must be adoptedfor that fishery.Long – Term Excessive OveragesIf the five year running average <strong>of</strong> the point estimates <strong>of</strong> harvest for any fisherycomponent exceeds the five year running average <strong>of</strong> that fishery’s harvest limit by 10%,then the harvest limit for that fishery over the next five years will be reduced by theamount <strong>of</strong> the overage.MFC, DMF, WRC, FWS <strong>and</strong> A/R Advisory Committee <strong>Management</strong>RecommendationSupports Option 3- No payback for overages, due to the underage in 2003 harvest inthe RRMA.MFC, DMF, WRC, <strong>and</strong> FWS <strong>Management</strong> RecommendationManage through harvest targets with the following penalties <strong>and</strong> triggers for overages:Short-term Overages: point harvest estimate exceeds the total TAC by 10% in a singleyear, overage deducted from the next year <strong>and</strong> restrictive measures implemented in theresponsible fishery (ies). Long-term Overages: Five-year running average <strong>of</strong> pointestimate exceeds the five-year running average <strong>of</strong> the total TAC harvest by 2%, the225
esponsible fishery exceeding the harvest limit will be reduced by the amount <strong>of</strong> theoverage for the next five years. Should the target F be exceeded, then restrictivemeasures will be imposed to reduce F to the target level.A/R Advisory Committee <strong>Management</strong> RecommendationSupports the agency’s recommendation on harvest targets <strong>and</strong> penalties/triggers. Inthe future, recreational TAC increases should be allocated as follows: the ASMA shouldreceive 35% <strong>of</strong> any increase <strong>and</strong> the RRMA receive 15%.10.3.3.2 Recreational Striped Bass Harvest Closure- Atlantic OceanIssueIncreased harvest <strong>of</strong> striped bass 28 inches TL <strong>and</strong> larger during the lateSpring through the summer.BackgroundThe recreational fishery around Oregon Inlet has grown significantly since the mid-1990s. This fishery not only targets the Atlantic Migratory Stock during the fall <strong>and</strong>winter but also the A/R stock during the late spring through the summer. This hasresulted in a directed fishery essentially year round.The line <strong>of</strong> demarcation between the Atlantic Ocean <strong>and</strong> the ASMA is thecenterline <strong>of</strong> the Bonner Bridge <strong>and</strong> east <strong>of</strong> this line is open to harvest year round. Thedaily allowed harvest limit east <strong>of</strong> this line is 2 fish per person <strong>and</strong> a 28 inch TLminimum size limit.Since 1996, one hundred tags have been returned from the Oregon Inlet area.These fish were tagged on the spawning grounds in Roanoke River or in the ASMA.The time period mid-April through September has accounted for 51 (51%) <strong>of</strong> thereturns. The majority <strong>of</strong> these returns (n=28) are from fish tagged on the spawninggrounds, with a growing number exceeding 28 inches TL when tagged <strong>and</strong> released.The DMF is not only concerned with the increased harvest <strong>of</strong> these large fish but alsothe mortality <strong>of</strong> sub-legal fish as a result <strong>of</strong> high water temperatures during the summermonths. Data collected from the MRFSS survey in 2002 for the time period May-October for the ocean showed ~59,000 pounds <strong>of</strong> striped bass harvested.Current AuthorityNorth Carolina Marine Fisheries Commission RulesNorth Carolina Fisheries Rules for Coastal Waters (15A <strong>NC</strong>AC)3M.0204 Season, Size <strong>and</strong> Harvest Limit Atlantic OceanDiscussionAs the A/R striped bass year classes have continued to increase, so has the availability<strong>of</strong> fish 28 inches TL <strong>and</strong> larger in the population. Since 1996, the percentage <strong>of</strong> striped226
ass 28 inches <strong>and</strong> larger tagged on the spawning grounds has increased annually(Table 5.5). However, the percentage is still just over 1.2% <strong>of</strong> the total number taggedsince 1996. Even though the number <strong>of</strong> fish 28 inches <strong>and</strong> larger have increased, theystill only represent a small percentage <strong>of</strong> the total population. Fish <strong>of</strong> this size areconsidered prime spawners <strong>and</strong> should be provided protection.<strong>Management</strong> OptionsOption 1 Status Quo (allow the fishery to continue as is)- Will provide no protection for these large fish- Directed fishery will continue with hook <strong>and</strong> release mortality <strong>of</strong> sub-legal fish+ Allow for economic gain to charter <strong>and</strong> guide servicesOption 2 Close the Atlantic Ocean to the harvest <strong>of</strong> striped bass from the time theASMA recreational season closes in the spring until October 1 <strong>of</strong> eachyear.+ Will provide protection <strong>of</strong> 28 in. <strong>and</strong> larger striped bass+ Reduce the hook <strong>and</strong> release mortality <strong>of</strong> sub-legal fish due to no directedfishery+ Closure will coincide with adjacent waters (ASMA)- Result in economic loss to charter <strong>and</strong> guide servicesDMF, WRC, FWS <strong>and</strong> C/S Advisory Committee <strong>Management</strong> RecommendationSupport Option 2: Close the Atlantic Ocean to recreational striped bass harvest fromwhen the ASMA closes in the spring until October 1.MFC <strong>and</strong> A/R Advisory Committee <strong>Management</strong> RecommendationSupport remaining at Status Quo.10.4 Issues Relative to the C/S Striped Bass Stocks10.4.1 Stock Structure10.4.1.1 Biological Reference PointsIssueEstimation <strong>of</strong> biological reference points <strong>and</strong> management targets.BackgroundNorth Carolina <strong>Fishery</strong> <strong>Management</strong> <strong>Plan</strong>s are required to include managementmeasures that prevent overfishing, while achieving, on a continual basis, the optimumyield for each fishery. The OY is defined as the amount <strong>of</strong> fish that provides the greatestbenefit to the State, is prescribed on the basis <strong>of</strong> the maximum sustainable yield (MSY),<strong>and</strong> in the case <strong>of</strong> an overfished fishery will provide for rebuilding to a level that willproduce MSY.227
Life history information from catch <strong>and</strong> survey sampling is the basic input <strong>of</strong> Yield perRecruit analysis (YPR) used to estimate yield or growth based reference points such asF max <strong>and</strong> F 0.1 <strong>and</strong> evaluate growth overfishing. Exp<strong>and</strong>ing this method to includematuration at age information allows calculation <strong>of</strong> spawning potential <strong>and</strong> estimation <strong>of</strong>Spawning Potential Ratio (i.e., F XX%SPR ) references <strong>and</strong> consideration <strong>of</strong> recruitmentoverfishing. Information on average recruitment provided by the VPA enables furtherscaling <strong>of</strong> ‘per recruit’ values from the YPR analysis to potential total population values.MSY can be estimated only if estimating recruitment at various stock levels is possible.VPA estimates <strong>of</strong> recruitment <strong>and</strong> spawning stock biomass can be used to determinerecruitment from spawner abundance, through either formal stock-recruitmentrelationship models (SRR) or more ad hoc approaches such as selecting futurerecruitment from observed values over various ranges <strong>of</strong> spawner abundance. Once amethod to estimate recruitment is derived, population projection models are usedevaluate stock performance over a range <strong>of</strong> exploitation rates <strong>and</strong> thus determine therate (F msy ) that provides the maximum yield (MSY).A range <strong>of</strong> potential biological reference points for North Carolina striped bass stockswas evaluated <strong>and</strong> presented to the North Carolina Striped Bass FMP <strong>Plan</strong>Development Team on January 8, 2002. The PDT reviewed the reference points <strong>and</strong>identified a range <strong>of</strong> options for biomass <strong>and</strong> mortality rate targets <strong>and</strong> thresholds. Theanalyses are based on biological <strong>and</strong> fishery data from the Albemarle Roanoke stock,as no data are available for the other stocks.Current AuthorityGeneral Statutes <strong>of</strong> North CarolinaG.S. 113-182.1. <strong>Fishery</strong> <strong>Management</strong> <strong>Plan</strong>sReference Point EvaluationYield per Recruit (YPR)Yield per Recruit models have long been used to establish biological reference points<strong>and</strong> management benchmarks, largely due to their modest data requirements <strong>and</strong> ease<strong>of</strong> calculation. Data necessary for this analysis are weight at age, natural mortality, <strong>and</strong>selectivity at age. The reference point most <strong>of</strong>ten associated with this analysis is Fmax,defined as the fishing rate that provides the maximum yield per recruit. As furtherexperience showed that fishing at Fmax could result in overfishing, a more conservativereference, F 0.1 , was developed, defined as the point at which the slope <strong>of</strong> the YPR curveis 1/10 th the slope at the origin. YPR analysis assumes a population at equilibrium, i.e.that age at entry into the fishery, weight at age, maturation at age, natural mortality, <strong>and</strong>recruitment are all constant. Providing an estimate <strong>of</strong> average recruitment at equilibriumenables scaling <strong>of</strong> per-recruit values <strong>of</strong> yield <strong>and</strong> biomass to stock-level values.Yield-per-recruit analysis used a dynamic pool model <strong>and</strong> input values from the recentassessment (Carmichael, 2002). Current stock conditions are summarized in Table228
10.16 for comparison to predicted equilibrium conditions under the various referencepoints. The estimated value for Fmax is below the current mortality target, indicatingthat slight growth overfishing could occur at the current target (Table 10.17). F 0.1 isslightly below F max <strong>and</strong> approximately equal to the natural mortality rate, M, which istypical for most stocks. The point <strong>of</strong> stock collapse, based on the PDT recommendation<strong>of</strong> female spawner biomass declining below 400,000 pounds, is high at Fcollapse=0.90.This high Fcollapse suggests the stock has considerable resiliency <strong>and</strong> can enduresignificant exploitation before SSB declines enough to significantly degrade recruitment.Based on 1989-1999 average recruitment <strong>of</strong> 377,000 age 1 fish, yield at Fmax would be1.0 million pounds, nearly double the 1998-2000 average catch (harvest+discard) <strong>of</strong>505,286 pounds, <strong>and</strong> about 40% above the 2000 catch <strong>of</strong> 638,394 pounds. Althoughthe actual exploitation rate at F max is lower than the current exploitation rate, thepotential yield is higher due to increased stock biomass expected from an exp<strong>and</strong>edage structure. Spawning stock biomass at F max is predicted to be over 3 times the 2000value <strong>of</strong> about 1 million pounds.Spawning Potential RatioBecause the basic YPR analysis considers only the effect <strong>of</strong> fishing mortality on yield,associated reference points technically only address growth overfishing. Moreover,there is no feedback between stock abundance <strong>and</strong> yield <strong>and</strong> recruitment, thus themodel cannot reflect density dependent factors that might affect the population. TheTable 10.16.Current Albemarle-Roanoke striped bassstock conditions, from Carmichael, 2002.Table 10.17.Biological reference points <strong>and</strong> associatedyield parameters from YPR analysis.Parameter Value Reference Point Estimated valueStock Abundance Numbers 1,567,000 F0.1 0.12Female Spawner Pounds 1,094,584 Fmax 0.152000 Total Catch Pounds 638,394 Fcoll 0.901998-2000 Catch Pounds 505,286 Yield@Fmax, mlb 1 1.0071998-2000 Catch Numbers 161,089 SSB@Fmax, mlb Female 1 3.802catch, 1000’s N 1 1341 Yield, SSB, <strong>and</strong> catch are based on averagerecruitment <strong>of</strong> 377,000 age-1 fish.model can be extended by incorporating maturation or fecundity ogives as an attempt toaddress recruitment overfishing, but the previous limitation still applies. Referencepoints provided by this extension are based on the spawning potential ratio, calculatedas the proportion <strong>of</strong> the maximum spawner biomass or egg production (i.e., thatexpected with no fishing exploitation) that will be produced at each exploitation rate, <strong>and</strong>are generally presented as F xx%SPR .Although the specific %SPR necessary to prevent recruitment overfishing <strong>and</strong> sustainadequate spawner biomass is unknown unless a stock-recruitment relationship isavailable, SPR values between 20% <strong>and</strong> 40% are commonly considered, <strong>and</strong> somestocks have been sustained at considerably lower levels. Results <strong>of</strong> the SPR analysiscan be combined with a stock-recruit plot to determine if a given level <strong>of</strong> SPR would229
have been adequate to sustain the stock given the observed recruitment history.Similarly, observed recruitment values can be used to determine the minimum SPRnecessary on average to replace the stock over the observation period. Inverting thevalue <strong>of</strong> SSB per recruit provides a value for recruits/SSB that can be used as the slope<strong>of</strong> a line on the Stock-Recruitment plot. Recruitment values above a given line representyears when recruitment was adequate to replace the parent stock, while those valuesbelow a line represent years when recruitment was not adequate to replace the parentstock. The point where a given line intersects the predicted stock recruitmentrelationship is represents where the stock would stabilize under average conditions.Results <strong>of</strong> the SPR analysis based on a range <strong>of</strong> 10 - 40%SPR produced exploitationrates between F=0.14 <strong>and</strong> F=0.40 (Table 10.18). These values are safely below thepoint <strong>of</strong> collapse (F=0.9), <strong>and</strong> any value would likely produce adequate recruitment to atleast sustain current stock abundance. The age structure <strong>of</strong> the population would varyconsiderably over this range <strong>of</strong> exploitation rates, with the proportion <strong>of</strong> the populationcomposed <strong>of</strong> older fish (8+) declining from 24% for F40%SPR to 6% for F10%SPR.Yield is close to the maximum for F40% to F20%SPR, drops about 20% for F10%SPR,<strong>and</strong> drops over 30% at Fcollapse. Spawner biomass would not increase over currentlevels for F10% SPR, but would increase considerably for the other referencesconsidered. The plot <strong>of</strong> recruitment <strong>and</strong> SSB overlain with %SPR reference lines showsthat none <strong>of</strong> the %SPR values considered are likely to negatively impact recruitment(Figure 10.17). Therefore, even the apparently low 10% SPR could prevent recruitmentoverfishing.Table 10.18.Percent SPR based reference points with associated F values, % adequate recruitment from theobserved history, % <strong>of</strong> the population age 8 <strong>and</strong> older, yield per recruit, <strong>and</strong> female spawnerbiomass.Parameter F %SPR % adequate R %8+ pop. Yield per Rec. SSB 1 mpdsF40%SPR 0.10 40 100 24 .833 5.344F30%SPR 0.16 30 100 18 .873 3.572F20%SPR 0.22 20 95 13 .838 2.541F10%SPR 0.40 10 95 6 .687 1.200Fcoll 0.9 3.4 33 0.8 .505 0.402Frep_95-99 0.75 4.3 83 1.4 .617 .532Fmax .19 24 100 19 .874 3.8021 Millions <strong>of</strong> pounds, based on average recruitment <strong>of</strong> 327,000 age 1 fish.230
Recruits 1 1000's N900800700600500400300STOCK-RECRUITMENT AND %SPR ALTERNATIVESRec's10204030Frep,med(2%)SRRcollapseFrep_95-9901/29/200220010000 100 200 300 400 500 600 700 800SSB Female 1000's poundFigure 10.17. Stock-Recruitment plot with replacement (median <strong>of</strong> observed) %SPR<strong>and</strong> various %SPR levels.231
Estimation <strong>of</strong> MSYThe reference points evaluated so far are largely based on ‘per recruit’ information, <strong>and</strong>are therefore useful even when future recruitment is unknown. Estimation <strong>of</strong> maximumsustainable yield, MSY, however, requires some determination <strong>of</strong> future recruitment.This is usually accomplished through a stock-recruitment relationship, such as thatillustrated in Figure 10.18. Stock-recruitment relationships are among the hardestfisheries population characteristics to determine, <strong>of</strong>ten remaining inconclusive in spite <strong>of</strong>long data series <strong>and</strong> extensive evaluation. The true underlying relationship may be800700RecLagALLRECENTSRR's based on All years <strong>and</strong> 1990's19962000600Thous<strong>and</strong> Age 150040030020019971998100199900 200000 400000 600000 800000 1000000 1200000Female Spawner PoundsFigure 10.18.Stock-recruitment plot for striped bass <strong>and</strong>fitted Beverton-Holt stock-recruitmentrelationships, for all years <strong>and</strong> for the 1990’s.masked or even distorted by many factors, including, but certainly not limited to,environmental variation, an inability to adequately measure recruitment, <strong>and</strong> a lack <strong>of</strong>data over an adequate range <strong>of</strong> parent stock size. Even when a relationship can bedetermined with reasonable statistical accuracy, it is a record <strong>of</strong> past performance thatmay not be representative <strong>of</strong> future conditions, especially for a stock that undergoingrapid change. All <strong>of</strong> these factors affect the stock recruitment relationship for AR stripedbass to some extent.Estimates <strong>of</strong> F msy <strong>and</strong> associated parameters were attempted, by iteratively fishing asimulated population to equilibrium over a range <strong>of</strong> exploitation rates. Stochasticity wasincorporated by allowing recruitment to vary r<strong>and</strong>omly from base values predicted by aBeverton-Holt Stock-Recruitment relationship; the magnitude <strong>of</strong> this variation was basedon the variation in observed values. Input values for selectivity, maturity, <strong>and</strong> weight atage were identical to those used in the YPR analysis; starting population abundancewas taken from the VPA (Carmichael, 2001).232
The PDT reviewed <strong>and</strong> discussed the parameter estimates from the MSY analysis <strong>and</strong>determined that the results were not generally reliable. Much <strong>of</strong> the concern centeredaround the stock-recruitment relationship. Although a model can be fit with reasonableprecision, the PDT did not feel it would adequately predict future conditions, largely dueto current SSB being at an observed high <strong>and</strong> expected to further increase as recentstrong year classes mature. Therefore, observations over the next few years will be atthe rightmost extreme <strong>of</strong> the plot at high spawner abundance <strong>and</strong> will exert considerableinfluence over the asymptote predicted by the relationship (Figure 10.18). Since theasymptote determines the average, long-term recruitment at high spawner abundance,it is expected that observations from the near future will greatly influence the estimatedlong term average recruitment, which will influence both MSY <strong>and</strong> equilibrium spawnerbiomass. This is shown in the plot by the difference in the two predicted relationships,one based on all years <strong>and</strong> the other based on all observations during the 1990’s. ThePDT feels strongly that the stock needs to achieve some stability, in terms <strong>of</strong> bothrecruitment <strong>and</strong> spawner abundance, before a reliable <strong>and</strong> predictive stock recruitmentrelationship can be developed. Although there was a period <strong>of</strong> stability during the mid-1990’s, the combination <strong>of</strong> good recruitment <strong>and</strong> limited exploitation during those yearsresulted in high abundance <strong>of</strong> fish approaching maturity, exhibited by the 2000 point inthe plot at the far right. Another concern expressed by the PDT is that observations atmiddle to low abundance predate flow control on the Roanoke River, <strong>and</strong> may reflectmore the adverse environmental conditions at that time than the true stock-recruitmentrelationship. Given the uncertainty in the ability <strong>of</strong> the stock-recruitment relationship topredict recruitment, <strong>and</strong> concern that conditions in the near future may be considerablydifferent from past years, the PDT did not endorse any estimate <strong>of</strong> MSY at this time.Spawner Biomass ThresholdThe PDT did consider the plot <strong>of</strong> stock <strong>and</strong> recruitment valuable for identifying athreshold spawner biomass. From a graphical analysis, recruitment was generally poorwhen female spawner biomass was below 200,000 pounds, <strong>and</strong> strong when biomasswas above 500,000 pounds. Since only one observation falls between these values,making it difficult to determine with precision the lower bound, <strong>and</strong> 200,000 pounds isclearly inadequate to ensure reasonable recruitment, the PDT decided to recommend aconservative threshold <strong>of</strong> 400,000 pounds.SummaryThe PDT advised that MSY could not be reliably determined for this stock at this time.They are concerned that developing an MSY estimate requires extrapolation <strong>of</strong> thestock beyond the observed record. Such an endeavor is particularly risky for a stockthat is still recovering, at least in terms <strong>of</strong> age structure, from past over exploitation.Another concern is that the time series <strong>of</strong> stock <strong>and</strong> recruitment data is still heavilyweighted toward periods <strong>of</strong> low abundance, overexploitation, <strong>and</strong> environmentaldegradation. Thus, the stock-recruitment relationship necessary to estimate MSY isespecially uncertain, <strong>and</strong> may remain variable until the stock reaches some equilibrium.Recent regulatory changes, notably increased harvest allowances, further adduncertainty <strong>and</strong> instability to the stock at this time.233
The PDT recommended that management benchmarks should be chosen based on alist <strong>of</strong> key criteria 1) Ability to evaluate a particular value or parameter, 2) Ability toeffectively implement <strong>and</strong> manage under a particular strategy, 3) Past managementexperience, 4) consideration <strong>of</strong> uncertainty, <strong>and</strong> 5) management program goals. Usingthese criteria as a guide, the PDT recommends that the stock be managed throughtarget <strong>and</strong> threshold exploitation rates, similar to the current strategy. This approach isproven through past experience, has been effectively implemented for many years, <strong>and</strong>has resulted in the current stock recovery. This approach is clearly measurable, asestimates <strong>of</strong> exploitation rates are proven more precise <strong>and</strong> reliable than estimates <strong>of</strong>absolute abundance. This approach provides significant flexibility; selection <strong>of</strong> propertarget <strong>and</strong> threshold exploitation rates can ensure that management targets are met.The PDT recommended that, where feasible, biomass thresholds be developed tosupport the exploitation rate targets. The past history <strong>of</strong> the stock, as reported in therecent assessment, provides reasonable guidance for selecting biomass thresholds.However, since the stock is exp<strong>and</strong>ing beyond the observed history, in both biomass<strong>and</strong> age structure, extrapolation to target biomass levels is risky at best. Setting targetbiomass levels in absolute values without knowledge <strong>of</strong> the stock’s growth potential willresult values for which neither the direction nor magnitude <strong>of</strong> potential bias <strong>and</strong>uncertainty can be determined.CSMAThe PDT recommended that CSMA stocks be managed through the same exploitationrate target <strong>and</strong> threshold as selected for the Albemarle-Roanoke stock. Appropriateexploitation levels are largely the result <strong>of</strong> life history parameters that are fairlyconsistent for the species regardless <strong>of</strong> the individual stock. For example, naturalmortality, inherent growth rates, <strong>and</strong> maturity are unlikely to significantly differ betweenfish from the various North Carolina systems. Furthermore, estimating exploitation ratesis feasible from short-term datasets <strong>and</strong> non-catch based approaches such as taggingprograms, whereas longer series <strong>and</strong> more complete data are necessary to estimateabundance <strong>and</strong> biomass.<strong>Management</strong> Options/ImpactsBased on consideration by the PDT <strong>of</strong> the analyses summarized above <strong>and</strong> developedin Carmichael (2002), a range <strong>of</strong> management targets <strong>and</strong> thresholds were identified forconsideration. Selection <strong>of</strong> threshold limits should be based on the biologicalcharacteristics <strong>and</strong> population dynamics <strong>of</strong> the stock. Within this limitation, target levelsshould be selected on the basis <strong>of</strong> specific management goals.Maximum Sustained YieldMaximum sustained yield cannot be reliably determined at this time.Optimum YieldOptimum yield is that yield projected from exploiting the stock at the target exploitationrate as determined from the most recent stock assessment. This is the approachcurrently used to manage this stock.234
+ Consistent with current management approach+ Allows yield to vary with stock conditions- Not a predetermined, specific value- Requires continued, potentially annual stock assessmentOverfishing <strong>and</strong> Overfished definitionsThe PDT recommends that the overfishing definition be based on the thresholdexploitation rate: Overfishing will occur when the exploitation rate exceeds the thresholdexploitation rate.The PDT recommends that the overfished definition be based on the biomass threshold:The stock will be overfished if biomass falls below the threshold.A. Options for the CSMAThe PDT recommends that the other North Carolina stocks be managed under thesame exploitation rate targets <strong>and</strong> thresholds as selected for the Albemarle-Roanokestock.+ Establishes reference exploitation values for other stocks.- Values not explicitly based on stock-specific information.- Data are not available to evaluate exploitation for other stocks.The PDT advises that no biomass thresholds or targets are available for the otherstocks, due to a lack <strong>of</strong> data. The FMP should contain recommendations for collection<strong>of</strong> adequate data so that biomass thresholds <strong>and</strong> targets can be developed.Research NeedsData should be collected for the CSMA striped bass stocks that will enabledetermination <strong>of</strong> stock status <strong>and</strong> estimation <strong>of</strong> biomass thresholds <strong>and</strong> targets.MFC, DMF, WRC <strong>and</strong> FWS <strong>Management</strong> RecommendationSupport the PDT recommendations, F=0.22 <strong>and</strong> 400,000 lb. SSB <strong>and</strong> the researchneeds.C/S Advisory Committee <strong>Management</strong> RecommendationThe Committee recommends an F rate <strong>of</strong> 0.22 for the C/S region.10.4.2 Striped Bass Stocking in Coastal River SystemsIssueStocking striped bass in <strong>NC</strong> coastal rivers.BackgroundHistoricalEnhancing striped bass resources in <strong>NC</strong> through stocking programs was initiated morethan 120 years ago. North Carolina established the Department <strong>of</strong> Agriculture by an Act235
<strong>of</strong> the General Assembly (March 12, 1877) <strong>and</strong> the Act required the Board <strong>of</strong>Agriculture, Immigration <strong>and</strong> Statistic “at once to provide for stocking all available waters<strong>of</strong> the State with the most approved breeds <strong>of</strong> fishes”. During the late 1870s, hatcherieswere established in the vicinity <strong>of</strong> New Bern, primarily for American shad production <strong>and</strong>Avoca (confluence <strong>of</strong> Roanoke <strong>and</strong> Chowan rivers) for striped bass production (Rulifson<strong>and</strong> Laney 1999).Because the striped bass was an important food source, the US Fish Commission wascommitted to “arresting its alarming decrease” (Worth 1884). In 1884, a striped basshatchery was established on the Roanoke River (spawning grounds) at Weldon <strong>and</strong>was the only one in the nation until the 1960s <strong>and</strong> operated almost continuously, first bythe Federal fisheries agencies <strong>and</strong> then by the North Carolina Wildlife ResourcesCommission (Harrell et al. 1990). The US Fish <strong>and</strong> Wildlife Service (FWS) Edenton FishHatchery was also involved in striped bass production using Roanoke River fish <strong>and</strong>served as a major source to other federal <strong>and</strong> state hatcheries, as well as overseasrequests. The Roanoke River striped bass population served as the original strain forculture beginning in 1884, <strong>and</strong> for many years eggs, fry <strong>and</strong> fingerlings <strong>of</strong> RoanokeRiver origin were stocked in watersheds throughout the eastern seaboard, along theGulf <strong>of</strong> Mexico <strong>and</strong> in Russia. These fish were used for stock enhancement <strong>and</strong> stockrestoration programs. As a result <strong>of</strong> this 100+ year-old practice <strong>of</strong> cross-stocking(stocking <strong>of</strong> non-natal fish) introgression <strong>of</strong> non-endemic genetic strains to many stripedbass populations has occurred. The effects <strong>of</strong> this long-st<strong>and</strong>ing practice remainundocumented <strong>and</strong> unquantified (Rulifson <strong>and</strong> Laney 1999).Division <strong>of</strong> Marine FisheriesThe Division <strong>of</strong> Marine Fisheries (DMF) Phase II (5-8 inches total length) striped bassstocking <strong>and</strong> tagging program began in 1980, as a result <strong>of</strong> a co-operative agreementwith the FWS. Striped bass were hatched <strong>and</strong> reared to Phase II sizes <strong>and</strong> stocked inthe Albemarle Sound area, Pamlico River, Neuse River <strong>and</strong> Cape Fear River. Thisprogram was developed in an effort to augment striped bass populations during lowpopulation levels. The major objectives <strong>of</strong> the program were (1) to determine the effects<strong>of</strong> stocking on the striped bass fisheries in coastal North Carolina, <strong>and</strong> (2) to determineif stocked fish would contribute to the spawning populations. A portion <strong>of</strong> the Phase IIfish stocked in each coastal system were tagged to estimate distribution, migration,utilization by the different fisheries, mortality <strong>and</strong> the contribution to the spawningstocks. DMF decided early in the program not to use Phase I (1-2 inches TL) fishbecause <strong>of</strong> the possibility <strong>of</strong> obscuring the results <strong>of</strong> the annual juvenile abundanceindex (JAI) surveys. Phase II fish were grown in the hatcheries tagged <strong>and</strong> stocked inDecember <strong>and</strong> January, well after the JAI surveys were completed.Phase II fish were supplied by the FWS Edenton <strong>and</strong> McKinney Lake National FishHatcheries in <strong>NC</strong>, with supplemental fish produced in South Carolina, Georgia, Alabama<strong>and</strong> Texas. However, the Edenton Hatchery has been the primary producer. Brood fishfrom Roanoke River (Weldon <strong>and</strong> Dan River), Monks Corner, SC <strong>and</strong> Weldon/MonksCorner crosses were artificially spawned <strong>and</strong> larvae reared at the hatcheries. ThePhase II fish are harvested from the hatchery ponds in the late fall to early winter,236
inventoried at the hatchery, a portion tagged <strong>and</strong> all released within approximately fivedays <strong>of</strong> harvest.Phase II fish have been released in the Cape Fear, Neuse <strong>and</strong> Tar-Pamlico rivers on arotating basis. The Albemarle Sound area was first stocked in 1981, then annually from1983-1996. All <strong>of</strong> these stockings have occurred in the natural striped bass nurseryareas (Street et al. 1975, Marshall 1976, Sholar 1977, Hawkins 1980, Dilday <strong>and</strong>Winslow 2002).From 1981 through 1996, over 700,000 Phase II fish were stocked in the AlbemarleSound area, nearly 54,000 <strong>of</strong> these were tagged (Table 10.19). From 1990-1996, allstriped bass released in the Albemarle Sound area were tagged, so that they would notbe confused with naturally spawned fish captured in later surveys. During the early tomid 1990s, strict harvest restrictions <strong>and</strong> management <strong>of</strong> river flows on Roanoke Riverresulted in restoration <strong>of</strong> the Albemarle Sound stock <strong>and</strong> stocking in this system wasdiscontinued in 1996. The Cape Fear River was stocked only during 1980, 1984 <strong>and</strong>1989, due to the low number <strong>of</strong> prior tag returns <strong>and</strong> because <strong>of</strong> the complicationsposed by the large numbers <strong>of</strong> hybrids present in the system (escaped from JordanReservoir). Phase II stocking continues on a rotating basis in the Tar-Pamlico <strong>and</strong>Neuse systems. Portions <strong>of</strong> the stocked fish continue to be tagged (externally) <strong>and</strong>since 1998 all fish are oxytetracycline (OTC) marked prior to release.This Phase II stocking program has likely helped sustain striped bass populations in theTar-Pamlico <strong>and</strong> Neuse rivers during periods <strong>of</strong> low abundance, but cannot be used torestore populations to self-sustaining levels if heavy fishing pressure <strong>and</strong>, ordegradation <strong>of</strong> habitat occurs.Wildlife Resources CommissionIn 1993, the North Carolina Wildlife Resources Commission (WRC) began stockingPhase I striped bass in coastal river systems (Table 10.19). During 1998-2000, theWRC also stocked some Phase II fish in the Cape Fear River <strong>and</strong> the Northeast CapeFear River (Table 10.19). Phase I fish were reared at the WRC Fish Hatchery at Watha,<strong>NC</strong> <strong>and</strong> the FWS Edenton National Fish Hatchery. Prior to 1998, these stocked Phase Ifish did not receive any type <strong>of</strong> tag or marking. Since 1998, all fish stocked by the WRChave been OTC marked.The WRC <strong>and</strong> the DMF have been stocking Phase I <strong>and</strong> Phase II striped bass in theTar <strong>and</strong> Neuse drainage’s in an attempt to increase numbers <strong>of</strong> spawning adults. Duringmost <strong>of</strong> these years, striped bass fingerlings <strong>of</strong> Roanoke River population parentagehave been stocked. Patrick <strong>and</strong> Stellwag (2001) identified six distinct lineages orgenotypes among striped bass from the Roanoke, Tar <strong>and</strong> Neuse rivers. Lineages I-IIIwere abundant among all three populations, <strong>and</strong> represented 96% <strong>of</strong> the samples.Genotypic frequencies were similar between the Tar <strong>and</strong> Roanoke rivers populations,but were significantly different (P< 0.05) from the Neuse population. The researchersconcluded that stocking practices could potentially affect the natural genotypic237
Table 10.19.Phase I (1-2 inches total length) <strong>and</strong> Phase II (5-8 inches total length) striped bass stockings in coastal North Carolina. Phase I fish werereleased by the North Carolina Wildlife Resources Commission <strong>and</strong> Phase II by the North Carolina Division <strong>of</strong> Marine Fisheries. A portion <strong>of</strong> thePhase II fish was tagged with external tags prior to release. All fish stocked from 1998 to present were also OTC marked.Phase II Phase ISystem stocked Year stocked Total number stocked Number tagged Number <strong>of</strong> tag returns Percent tag returns Number stockedAlbemarle Sound area 1981 87,181 10,000 1,817 18.21983 106,675 2,500 719 28.81983 67,433 2,493 276 11.01984 236,242 6,445 575 8.91986 45,200 1,110 38 3.41986 118,345 4,999 453 9.11987 15,435 2,500 214 8.61988 5,000 5,000 94 1.91989 3,289 1,400 22 1.61990 2,000 2,000 62 3.11991 2,994 2,994 320 10.61992 2,465 2,465 84 3.31993 2,180 2,180 23 1.01994 2,481 2,481 2 0.11996 2,498 2,498 12 0.51996 2,490 2,490 2 0.08Total 701,908 53,554 4,713 8.8Pamlico-Tar River 1983 76,674 2,500 500 20.01984 26,000 1,000 28 2.81987 17,993 2,500 39 1.61991 30,801 1,993 78 3.91993 118,600 2,204 39 1.81994 183,254 2,320 22 0.9 127,6351995 100,0001996 140,972 2,497 50 2.0 39,4501997 24,031 4,865 110 2.3 28,0221998 230,606Pamlico-Tar River 1999 17,954 2,750 117 4.2 100,0002000 188,8392001 37,000 3,000 7 0.2 171,0002002 39,1102003 242,631Total 676,279 25,629 997 3.9 1,267,293238
Table 10.19. (Continued)Phase II Phase ISystem stocked Year stocked Total number stocked Number tagged Number <strong>of</strong> tag returns Percent tag returns Number stockedNeuse River 1982 47,648 2,100 230 11.01986 39,769 2,199 60 2.81988 71,092 2,500 22 0.91990 61,877 2,992 84 2.81992 116,820 2,527 137 5.41993 48,0001994 79,933 2,212 6 0.3 103,0571995 99,1761996 100,760 4,998 120 2.4 100,0001997 100,0001998 83,195 2,500 69 2.8 207,7301999 100,0002000 108,000 2,900 29 1.0 121,9932001 103,0002002 147,654 2,960 0 --2003 100,000Total 856,748 27,888 757 2.7 1,082,956Cape Fear River 1980 14,874 2,900 17 0.61984 56,437 1,395 6 0.41989 77,242 1,300 23 1.81994 100,7331995 100,0001998 30,479 (
Table 10.19. (Continued)Phase II Phase ISystem stocked Year stocked Total number stocked Number tagged Number <strong>of</strong> tag returns Percent tag returns Number stockedNortheast Cape FearRiver1999 10,327 (OTC marked-WRC)2000 15,635 (OTC marked-WRC)2001 94,0832002 50,0002003 105,015Total 25,962 249,098240
distribution in these populations, <strong>and</strong> suggested that broodstock sampling should betaken from each population for aquaculture production, rather than from Roanoke Riverstrains, especially from stocking the Neuse River population. The WRC is now in theprocess <strong>of</strong> estimating the percent contribution <strong>of</strong> stocked fish to the striped bassspawning stocks in the Tar <strong>and</strong> Neuse rivers.DiscussionDivision <strong>of</strong> Marine FisheriesThe DMF Phase II stocking program is part <strong>of</strong> the <strong>NC</strong> Striped Bass MonitoringProject funded under a federal-aid grant from the USFWS. This type grant is 75%federal <strong>and</strong> 25% state match. Currently, the federal share is $9,000 <strong>and</strong> $3,000state match for this portion <strong>of</strong> the project. A production goal <strong>of</strong> 100,000 Phase IIfish is set annually for stocking. The grant funds received by DMF do not includethe production costs that the hatcheries expend to produce <strong>and</strong> raise these fish toPhase I or Phase II size. Stock enhancement programs for striped bass costapproximately 20 cents each for Phase I fish <strong>and</strong> one dollar each for Phase II fish(Elliott Atstupenas, Edenton National Fish Hatchery, USFWS, personalcommunication).Based on tag returns, these stocking programs have contributed to therecreational <strong>and</strong> commercial fisheries in the various systems, as well as to thespawning populations. Stocked fish have been captured on the spawning groundsin the Roanoke, Tar, <strong>and</strong> the Neuse rivers. Continued stocking may help sustainthe striped bass populations in the Tar-Pamlico <strong>and</strong> Neuse rivers. When juvenilesurveys start again in these river systems, stocking should cease or all stockedfish should be marked, so that natural production can be assessed.The stocking program has been well received by the public. Due to budgetproblems several years ago, the stocking program was to be dropped. There wasconsiderable outcry from citizens along the Pamlico River <strong>and</strong> even a petitionsubmitted dem<strong>and</strong>ing that the striped bass stocking program continue.Wildlife Resources CommissionThe objective <strong>of</strong> WRC for stocking striped bass into coastal rivers is to increasespawning stock abundance <strong>and</strong> promote self-sustaining population levels appropriatefor habitats <strong>and</strong> ecosystems. This objective will be pursued as long as managementagencies take positive actions to reduce mortality rates so that stocking enhancespopulation abundance. Stocking <strong>of</strong> striped bass in coastal rivers is prioritized in relationto stocking requests for inl<strong>and</strong> reservoirs where no natural reproduction exists.The WRC began collecting adult striped bass otolith samples from the Tar <strong>and</strong> Neuserivers in 2002. These otoliths will be analyzed for OTC marks to determine thepercentage <strong>of</strong> stocked fish in the sampled population for that year. Additional otolithswill be removed from striped bass in 2003 <strong>and</strong> 2004. <strong>Management</strong> decisions concerning241
the desirability <strong>of</strong> stocking Phase I striped bass in coastal rivers will be made based onthe percentage <strong>of</strong> stocked striped bass in the population.Currently, there is a Cooperative Agreement between the USFWS, DMF <strong>and</strong> WRCwhich schedules through <strong>and</strong> Annual Work <strong>Plan</strong> the production goals, number to betagged <strong>and</strong> total number stocked.<strong>Management</strong> OptionsStatus Quo+ Continue the striped bass stocking program as is (all fish OTC marked,portion with external tags), with a production goal <strong>of</strong> 100,000 fish peryear for Phase I <strong>and</strong> Phase II.+ Stocked fish may contribute to the spawning stock.+ Public visibility for improving the striped bass population.- Numbers <strong>of</strong> fish will not be adequate to increase population size.Increase the number <strong>of</strong> fish produced/released+ Will increase the number <strong>of</strong> individuals in the striped bass population.+ Stocked fish may contribute to the spawning population.+ Public visibility for improving the striped bass population.+ Increase number <strong>of</strong> tagged (external) fish- provides more data onmigration, movement, growth, known age fish, time at large, etc.- Cost <strong>of</strong> production/program would increase.- Increase cost <strong>of</strong> reward program.Decrease the number <strong>of</strong> fish produced/released+ Reduce the overall cost <strong>of</strong> the program.- Would provide no increase to the existing population size or spawningstock.- Reduce/eliminate externally marked fish- lose data on migration,movement, growth, known age fish, time at large, etc.Eliminate the stocking programs+/- Maintain self-sustaining population through controlled harvest.- Lose <strong>of</strong> data from tagged fish.Research NeedsSurvey stocked systems to determine percentage <strong>of</strong> wild versus stocked fish.MFC <strong>and</strong> DMF <strong>Management</strong> RecommendationSupport continuing the Phase II striped bass stocking program (all fish OTCmarked, portion marked with external tags), with two systems in the C/S<strong>Management</strong> Area (Tar-Pamlico, Neuse <strong>and</strong> Cape Fear rivers) being stockedannually, with a goal <strong>of</strong> 100,000 fish per system. DMF supports the researchneeds.242
WRC <strong>Management</strong> RecommendationSupport continuing the Phase I striped bass stocking program (all fish OTCmarked), with a goal <strong>of</strong> 100,000 fish per year, per system in the C/S <strong>Management</strong>Area (Tar, Neuse, <strong>and</strong> Cape Fear/Northeast Cape Fear rivers) annually. WRCsupports the research needs.A/R Advisory Committee <strong>Management</strong> RecommendationDefer to the Central/Southern CommitteeC/S Advisory Committee <strong>Management</strong> RecommendationSupport continuing the striped bass stocking program (all fish OTC marked,portion with external tags), with a production goal <strong>of</strong> 100,000 fish per year forPhase II <strong>and</strong> Phase I in the Pamlico, Neuse, <strong>and</strong> Cape Fear rivers annually. TheCommittee supports the research needs as presented.10.4.3 Fishing Mortality10.4.3.1 Catch Curve Exploitation Estimates <strong>and</strong> <strong>Management</strong> Options for NeuseRiver <strong>and</strong> Tar River Striped Bass StocksIssueEstimation <strong>of</strong> survival <strong>and</strong> exploitation rates for the Central <strong>and</strong> Southern North Carolinastocks <strong>of</strong> striped bass through catch curve analysis.BackgroundSurveys conducted by the WRC on the spawning grounds <strong>of</strong> the Tar <strong>and</strong> Neuse riversare the only sources <strong>of</strong> quantifiable information on striped bass abundance in thesesystems. Age, length, <strong>and</strong> catch information collected through the surveys provide atime series <strong>of</strong> fishery independent abundance at age that can be used to estimate totalmortality through catch curve analysis. Survey catch rates are also evaluated as anindicator <strong>of</strong> recruitment strength <strong>and</strong> compared with stocking rates to determine ifobserved cohort abundance is related to stocking rates.Catch curve analysis is a simple analytical technique used since the early 1900s forestimating total mortality from catch or survey abundance at age data. Plots <strong>of</strong> catchversus age typically produce a convex curve, with the peak <strong>of</strong> the curve correspondingto the age <strong>of</strong> “full recruitment” -- all fish older than this age are fully vulnerable to thefishing gear. The increasing left limb, between the origin <strong>and</strong> the peak, representsincreasing vulnerability with increasing size <strong>and</strong> age. The declining right limb, beyondthe peak, represents declining abundance with increasing age <strong>and</strong> is due to mortality,both fishing (F) <strong>and</strong> natural (M). To estimate total mortality from a catch curve, observedcatches at age are transformed using the natural logarithm <strong>and</strong> the slope <strong>and</strong> y-intercept <strong>of</strong> a line through the observed points <strong>of</strong> the declining limb are estimatedthrough linear regression. Total mortality (F+M =Z), is estimated by the slope parameter<strong>of</strong> the fitted line.243
Catch curves can be applied to annual data, catches across ages within a year, or tocohort data, catches across years <strong>of</strong> fish born in some year. Annual catch curvesassume that recruitment is constant from year to year, fishing <strong>and</strong> natural mortality areconstant, <strong>and</strong> vulnerability is constant above a given age. Cohort catch curves do notrequire that recruitment be constant, but the need to track a cohort over time can greatlyreduce the amount <strong>of</strong> information available, especially when the time series <strong>of</strong> catchdata is low or the life span <strong>of</strong> the species is long. Therefore, catch curves applied tocohorts may provide more robust estimates <strong>of</strong> mortality.Current AuthorityGeneral Statutes <strong>of</strong> North CarolinaG.S. 113-182.1. <strong>Fishery</strong> <strong>Management</strong> <strong>Plan</strong>sMethodsSurveysAdult striped bass were collected during the spawning season using boat-mountedelectr<strong>of</strong>ishing gear annually from the Tar River since 1996 <strong>and</strong> from the Neuse Riversince 1994. Weekly sampling was conducted from late March through mid-May.Electr<strong>of</strong>ishing time was recorded, <strong>and</strong> striped bass abundance was indexed using catchper unit effort (CPUE), expressed as fish per hour. Total length (mm) was measured foreach striped bass collected, <strong>and</strong> sex was determined by applying directional pressureon the fish’s abdomen <strong>and</strong> observing the release <strong>of</strong> eggs or milt. Scales were removedfrom the left side between the lateral line <strong>and</strong> the dorsal fins from at least 10 fish fromeach 25-mm length group for each sex. Annuli were counted at 33X magnification usinga micr<strong>of</strong>iche reader. The total number <strong>of</strong> fish collected in each age group by sex wasestimated by exp<strong>and</strong>ing the sub-sample <strong>of</strong> fish aged to the entire sample <strong>of</strong> fishcollected using an age-length key.Neuse River Sample DesignSampling in the Neuse River was conducted from Raleigh (Milburnie Dam) downstreamto Kinston, approximately 128 river miles. Prior to the removal <strong>of</strong> Quaker Neck Damnear Goldsboro in 1998, sample stations were located near Goldsboro (upstream <strong>and</strong>downstream <strong>of</strong> Quaker Neck Dam), Seven Springs, <strong>and</strong> Kinston. Since 1998, stationsdownstream <strong>of</strong> Goldsboro have been ab<strong>and</strong>oned, <strong>and</strong> sampling has exp<strong>and</strong>edupstream to include stations at Goldsboro (upstream <strong>and</strong> downstream <strong>of</strong> the QuakerNeck Dam site), Richardson’s Bridge, Smithfield, Wilsons Mills, Clayton, Raleigh (PooleRoad), <strong>and</strong> Raleigh (Milburnie Dam). A minimum <strong>of</strong> three 15-minute electr<strong>of</strong>ishingsamples was conducted within each station weekly depending on river flow (Table10.20).Tar River Sample DesignSampling in the Tar River was conducted from Rocky Mount downstream to Tarboro,approximately 40 river miles. This area was divided into three stations, which were244
Table 10.20.Total electr<strong>of</strong>ishing time in hours with number <strong>of</strong> sample days in parenthesis for striped bass by sample station <strong>and</strong> yearin the Neuse River, 1994-2002.Sample yearSample Station 1994 1995 1996 1997 1998 1999 2000 2001 2002Raleigh (Milburnie Dam) 0.7 (1) 0.3 (1) 1.0 (2) 2.0 (2)Raleigh (Poole Road) 1.0 (1)Clayton 0.8 (1)Wilsons Mills 2.3 (3) 2.3 (3) 2.0 (2)Smithfield 2.8 (2) 4.5 (5) 3.3 (5) 4.0 (4)Richardson’s Bridge 2.3 (2) 1.3 (1) 1.5 (1) 1.0 (1)Goldsboro (upstream Quaker NeckDam) 4.5 (6) 5.3 (7) 4.3 (6) 3.7 (5) 5.3 (7) 5.3 (7) 6.0 (7)Goldsboro (downstream Quaker NeckDam) 7.3 (5) 4.9 (2) 5.8 (6) 7.0 (7) 6.0 (6) 4.8 (5) 5.0 (7) 4.5 (7) 4.8 (5)Seven Springs 2.7 (1) 4.5 (6) 4.5 (6) 3.0 (4)Kinston 2.4 (3) 4.5 (6) 4.5 (6) 3.0 (4)Total a 7.3 (5) 10.0 (6) 19.3 (12) 21.3 (13) 17.0 (11) 13.9 (11) 20.4 (17) 17.7 (15) 19.8 (14)a Because multiple stations were sampled in one day, the total number <strong>of</strong> sample days may not equal the sum <strong>of</strong> sample days by station.245
Table 10.21. Total electr<strong>of</strong>ishing time in hours with number <strong>of</strong> sample days in parenthesis for striped bass by sample station <strong>and</strong> year in the Tar River, 1996-2002.Sample yearSample Station 1996 1997 1998 1999 2000 2001 2002Station 1(Battle Park in Rocky Mount to BourneFarms access area) 3.6 (4) 8 (5) 5.5 (3) 3.2 (3) 3 (2) 4 (3) 2.8 (2)Station 2(Bourne Farms access area to <strong>NC</strong>WRCaccess area at Tarboro) 5.9 (4) 10.3 (6) 13.2 (6) 6.7 (3) 4.6 (3) 0.9 (1) 4.5 (3)Station 3(<strong>NC</strong>WRC access area at Tarboro to City<strong>of</strong> Tarboro access area 12.6 (4) 10.5 (7) 8.6 (7) 1.6 (2) 3.9 (4) 2 (1) 4 (2)Total a 22.1 (8) 28.8 (16) 27.3 (13) 11.5 (8) 11.5 (9) 6.9 (5) 11.3 (7)a Because multiple stations were sampled in one day, the total number <strong>of</strong> sample days may not equal the sum <strong>of</strong> sample days by station.246
each sampled weekly. Station 1 began at Battle Park in Rocky Mount <strong>and</strong> ended at theBourne Farms access area <strong>of</strong>f U.S. 64 Business. Station 2 began at the Bourne Farmsaccess area <strong>and</strong> ended at the WRC access area on N.C. 33 in Tarboro. Station 3began at the WRC access area at N.C. 33 <strong>and</strong> ended at the City <strong>of</strong> Tarboro accessarea <strong>of</strong>f U.S. 64. Sampling consisted <strong>of</strong> 30-minute segments <strong>of</strong> electr<strong>of</strong>ishing alternatedwith 30 minutes <strong>of</strong> drifting in each <strong>of</strong> the stations, with a minimum <strong>of</strong> 2 hours <strong>of</strong>electr<strong>of</strong>ishing conducted in each station (Table 10.21). Electr<strong>of</strong>ishing <strong>and</strong> drifting startpoints were alternated each trip to allow a systematic coverage <strong>of</strong> each station duringthe spawning season.Catch Curve AnalysisCatch curves are constructed from survey catch at age for the Neuse River <strong>and</strong> TarRiver spawning ground surveys (Tables 10.22 <strong>and</strong> 10.23). Age-length keys are notavailable from the Tar River survey, so annual Neuse River age-length keys are used toassign ages to Tar River survey data. The analysis is based on catch <strong>of</strong> males toreduce variability due to differential migration by sex that might distort the age <strong>of</strong> fullrecruitment. Both annual <strong>and</strong> cohort catch curves are analyzed. Since the Neuse <strong>and</strong>Tar rivers are stocked with striped bass in alternate years it is unlikely that recruitment isconstant in these systems, <strong>and</strong> therefore cohort catch curves may be most appropriate.There are no significant regulatory changes expected to result in violation <strong>of</strong> theconstant mortality over time assumption required <strong>of</strong> both annual <strong>and</strong> cohort catchcurves.Table 10.22.Neuse River spawning ground survey catch at age, total catch, effort in hours fished, <strong>and</strong> CPUE incatch per hour.YEARAge 1994 1995 1996 1997 1998 1999 2000 20012 21 2 25 27 54 5 79 83 3 147 45 41 47 154 72 644 34 8 77 16 35 46 77 275 20 22 10 24 23 19 9 296 13 4 6 4 12 12 4 37 4 2 2 5 18 1 29 1Total 92 183 167 114 175 242 242 131Effort (H) 7.35 10.98 19.30 21.26 16.98 13.77 20.24 17.52CPUE 12.52 16.66 8.65 5.36 10.31 17.58 11.96 7.48247
Table 12.23.Tar River spawning ground survey catch at age, totalcatch, effort in hours fished, <strong>and</strong> CPUE in catch per hour.YEARAge 1996 1997 1998 1999 2000 20012 277 69 21 71 243 537 579 207 113 844 146 186 82 135 545 76 52 17 20 726 5 9 6 5 57 1 1 1 4Total 1042 896 334 348 239Effort (H) 27.41 28.77 27.36 11.53 11.51 11.33CPUE 0.00 36.21 32.74 28.96 30.24 21.09Catches are divided by annual survey effort in hours fished to calculate catch-per-uniteffort(CPUE), thereby st<strong>and</strong>ardizing catch by annual effort to account for varyingsurvey effort over time. Total mortality is calculated over a range <strong>of</strong> ages, from the age<strong>of</strong> full recruitment to the survey (determined for each year as the age having thegreatest catch in that year, <strong>and</strong> typically occurring at age 3) through age 7. If catches atage do not extend to age 7, then the maximum age observed in the catch is used. Thusin most years 5 ages contribute to the estimate <strong>of</strong> mortality, but in some years as few asthree ages contribute. Total mortality is estimated for each system by taking an average<strong>of</strong> the annual mortality estimates. Only years or cohorts having at least threeobservations contributing to the estimated morality for that year or cohort are included inthe average. The first cohort included in the average for the cohort catch curves is thatwith observed catch at age 3.A cohort catch curve analysis based on the Roanoke River survey is included tocompare catch curve mortality estimates <strong>and</strong> catch-age assessment mortalityestimates. The spawning ground survey conducted on the Roanoke River is similar tothose conducted on the Tar <strong>and</strong> Neuse Rivers. A quantitative catch-age assessment <strong>of</strong>stock status is also available from the Albemarle-Roanoke stock, <strong>and</strong> serves as theprimary measure <strong>of</strong> the stock for evaluating management <strong>and</strong> establishing harvestrestrictions. To assess the overall reliability <strong>of</strong> catch curve analyses applied to spawningground survey CPUE, an analysis similar to those used to evaluate the Neuse <strong>and</strong> TarRiver stocks was applied to the Roanoke River CPUE data. Mortality estimates from thecatch curve analysis are compared to the catch-age assessment mortality estimates byaveraging cohort catch curve mortality estimates across ages 3 to 7 by year for 1991-1996 to generate average annual mortality rates. Annual catch curves are notdeveloped for this comparison since available estimates indicate the constantrecruitment assumption is violated.Stocking - Recruitment AnalysisCatches are summed by cohort for total CPUE <strong>and</strong> CPUE for ages 2 <strong>and</strong> 3 toinvestigate relative recruitment trends <strong>and</strong> evaluate correlation with known stockingrates. The sum <strong>of</strong> total CPUE is likely biased because survey CPUE <strong>of</strong> fish > 18"248
(approximately age 3) is affected by fishery harvest, unlike the sum <strong>of</strong> ages 2 <strong>and</strong> 3CPUE which largely represent fish that have not recruited to the fishery <strong>and</strong> maytherefore be a reliable indicator <strong>of</strong> relative cohort strength. Recruitment is alsoevaluated from the estimated y-intercept from the catch curve analysis. This parameterrepresents the expected catch <strong>of</strong> a cohort at age-0, <strong>and</strong> may provide a relative measure<strong>of</strong> initial cohort abundance. The analysis is based on stocking rates for Phase-I fishonly. Phase II stocking has only occurred in recent years; thus these fish have notrecruited to the surveys. Relative recruitment parameters are compared to stockingrates to determine if there is any relation between apparent cohort strength <strong>and</strong> thenumber <strong>of</strong> fish stocked. If stocking contributes to a cohort, <strong>and</strong> the recruitmentmeasures are representative <strong>of</strong> actual recruitment strength, then the stocking rate <strong>and</strong>recruitment measures should be positively correlated. Evaluating recruitment isimportant due to the annual catch curve assumption <strong>of</strong> constant recruitment. Further,detection <strong>of</strong> strong cohorts corresponding to stocking events may be consideredevidence that the surveys do capture abundance information.ResultsCatch Curve AnalysisNeuse RiverFive cohorts from 1991 to 1995 can be analyzed from the Neuse survey based onobserved catches between age 3 <strong>and</strong> age 6 or older. Estimates are feasible for threeothers the 1991 cohort, although the youngest age observed in the catch is age 4 <strong>and</strong>thus the estimate may be biased; <strong>and</strong> the 1996 <strong>and</strong> 1997 cohorts, estimates for whichare considered preliminary because catches for older ages are not yet observed (the1996 cohort represents the age 5 catch in 2001 <strong>and</strong> the 1997 cohort represents the age4 catch in 2001). Estimated slope parameters, the measure <strong>of</strong> total mortality (Z), rangefrom 0.65 – 1.49 <strong>and</strong> average 0.99 for 1991-1995. The 1990 <strong>and</strong> 1996-1997 cohorts arenot used in calculating the average since the observed catch record is incomplete forthese cohorts. Subtracting natural mortality (M) from the average Z provides anestimate <strong>of</strong> average fishing mortality (F) <strong>of</strong> F=0.84 (Table 10.24). Confidence intervalsin some years are quite broad, due to both high SE <strong>of</strong> the estimated slope <strong>and</strong> smallnumbers <strong>of</strong> observations. No confidence interval can be developed for the 1997 cohortestimates since only two observations are available for regression, leaving no degrees<strong>of</strong> freedom. Total mortality has averaged around 1, with a slight increase indicated inTable 10.24.Estimated slope (total mortality, Z), y-intercept, F, SE <strong>of</strong> Z, <strong>and</strong> 90% confidenceinterval around Z for Neuse River cohort catch curves for 1990-1997 cohorts.YearSlopeZ Intercept SE (Z)Fishingmortality90% Con.Int. lower90% Con.Int. upper1990 1.04 5.55 0.89 0.20 0.58 1.501991 0.65 2.37 0.50 0.09 0.39 0.911992 0.89 5.02 0.74 0.10 0.66 1.131993 0.76 3.32 0.61 0.33 -0.01 1.521994 1.17 5.67 1.02 0.45 -1.64 3.981995 1.49 6.97 1.34 0.31 -0.45 3.421996 0.96 5.24 0.81 0.07 0.51 1.401997 1.08 5.65 0.93 NA NA NAMean 91-95 0.99 0.84249
1994 <strong>and</strong> 1995 (Figure 10.19). A plot <strong>of</strong> estimated cohort decline over time for allcohorts shows that the lines for 1994 <strong>and</strong> 1995 have slightly steeper slopes than thosefor the other years, suggesting higher mortality for those cohorts (Figure 10.20).Plotting observed <strong>and</strong> predicted catch values as in Figure 10.21 shows how well thelinear catch curve model ‘fits’ the observed CPUE values. Deviations from a linearZCohort Total Mortality Estimates, Neuse River3.002.50Z Lw r90 Upr902.001.501.000.500.00-0.501989 1990 1991 1992 1993 1994 1995 1996 1997 1998-1.00-1.50-2.00CohortFigure 10.19. Total mortality (Z) estimated by cohort catch curve,1990-1997 cohorts in Neuse River.LnCatch3.002.001.000.00-1.00-2.00-3.00-4.00-5.00-6.00Neuse River Male by Cohort1990 1991 1992 1993 1994 1995 19963 4 5 6 7 8AgeFigure 10.20. Comparison <strong>of</strong> mortality estimates for Neuse RiverCohorts. Open symbols represent 1994 <strong>and</strong> 1995cohorts, which appear 250to have slightly higher mortality.
ln(CPUE)43210-1-2-3-419902 3 4 5 6 7 8OBS L<strong>NC</strong>PUE AGEln(CPUE)4.003.002.001.000.00-1.00-2.00-3.00-4.00-5.00OBS19942 3 4 5 6 7 8L<strong>NC</strong>PUE AGEln(CPUE)1.510.50-0.5-1-1.5-2-2.5-3-3.519912 3 4 5 6 7 8OBS L<strong>NC</strong>PUE AGEln(CPUE)5.004.003.002.001.000.00-1.00-2.00-3.00-4.00-5.00-6.00OBS19952 3 4 5 6 7 8L<strong>NC</strong>PUE AGE4.003.0019924.003.0019962.002.00ln(CPUE)1.000.00-1.002 3 4 5 6 7 8ln(CPUE)1.000.00-1.002 3 4 5 6 7 8-2.00-2.00-3.00-3.00OBSL<strong>NC</strong>PUEAGEOBSL<strong>NC</strong>PUEAGE3.002.0019933.002.0019971.001.00ln(CPUE)0.00-1.002 3 4 5 6 7 8ln(CPUE)0.00-1.002 3 4 5 6 7 8-2.00-2.00-3.00-3.00-4.00-4.00OBSL<strong>NC</strong>PUEAGEOBSL<strong>NC</strong>PUEAGEFigure 10.21. Observed <strong>and</strong> Estimated CPUE, Neuse River Cohort Catch Curves.251
decline, which may indicate changes in exploitation over time, are apparent in severalyears with 1993 the most pronounced. The convex pattern emerging from the olderages <strong>of</strong> the 1993 <strong>and</strong> 1994 cohorts may indicate increased mortality in 2000 <strong>and</strong> later.Variability in the peak <strong>of</strong> observed catch shows how the age <strong>of</strong> recruitment variesbetween ages 3 <strong>and</strong> 4.Annual catch curves give similar results, with Z averaging slightly lower at 0.88 for1994-2001 (Table 10.25, Figure 10.22). There is some indication <strong>of</strong> increasing mortalityin 2000 <strong>and</strong> 2001. Plots <strong>of</strong> natural logarithm transformed CPUE show only minordeviation from a linear decline in CPUE, which suggests that recruitment has been fairlyconstant over time (Figure 10.23). It is not readily apparent that the constantrecruitment assumption required <strong>of</strong> annual catch curves is violated, even though fishwere stocked in alternate years in the Neuse River.Tar River Catch Curve AnalysisThree cohorts, 1993 to 1995, can be analyzed from the Tar River survey based onobserved catches between the age 4 <strong>and</strong> age 6. Estimates are available for the 1992<strong>and</strong> 1996 cohorts, although they are based on potentially incomplete information <strong>and</strong>are therefore less reliable. Nonetheless these estimates are included to exp<strong>and</strong> the timeseries <strong>of</strong> mortality estimates for comparison, but are not included in the average.Estimated slope parameters for the 1993 to 1995 cohorts, the measure <strong>of</strong> total mortality(Z), range from 0.93 to 1.30, <strong>and</strong> average 1.17 for (Table 10.26). Subtracting naturalmortality (M=0.15) from the average Z provides an estimate <strong>of</strong> average fishing mortalityF) <strong>of</strong> F=1.02. Confidence intervals in some years are broad, due to both fewobservations (i.e., few ages between recruitment <strong>and</strong> maximum observed) <strong>and</strong> highst<strong>and</strong>ard errors. Estimates <strong>of</strong> total mortality do not exhibit much trend (Figure 10.24).Plots <strong>of</strong> observed <strong>and</strong> predicted values show virtually no deviation from linear trends,<strong>and</strong> therefore provide no indication that mortality has changed over time (Figure 10.25).Annual catch curves give similar results, with Z averaging slightly higher for 1997- 2001at 1.30 (Table 10.27, Figure 10.26). Mortality trends slightly downward over time,although the broad confidence intervals for the last few years indicate that the trend isnot significant. Plots <strong>of</strong> observed <strong>and</strong> predicted CPUE show only slight deviations fromlinear trends (Figure 10.27), with the exception <strong>of</strong> 2001 which shows very little decline inabundance over ages 3 - 5. Based on the strong linear decline in abundance based ontransformed CPUE, there is little indication <strong>of</strong> variation in recruitment for the Tar River<strong>and</strong> little evidence that either the constant recruitment assumption or the constantmortality assumption are violated.Comparison <strong>of</strong> Catch Curve <strong>and</strong> VPA Mortality Estimates for the Roanoke RiverCohort catch curves are applied to both male <strong>and</strong> female CPUE from the RoanokeRiver. Estimates <strong>of</strong> fishing mortality by cohort were binned by year <strong>and</strong> age, thenaveraged across years to allow valid comparison with the annual estimates from the252
catch-age analysis. Catch curve estimates tend to smooth out some <strong>of</strong> the annualvariation indicated by the VPA mortality estimates, especially in the early years <strong>of</strong> thetime series (Figure 10.28). Since catch curve analyses assume constant mortality, suchTable 10.25.Estimated slope (Z), fishing mortality, SE, <strong>and</strong> 90% confidence interval for Neuse River Annualcatch curve.YEAR Slope Z Intercept SE (Z)Fishingmortality90% Con. Int.Lower90% Con. Int.Upper1994 0.48 3.44 0.03 0.33 0.30 0.661995 0.98 4.90 0.51 0.83 -0.50 2.461996 0.94 4.66 0.28 0.79 0.13 1.751997 0.74 3.01 0.17 0.59 0.34 1.151998 0.60 2.82 0.14 0.45 0.31 0.891999 0.82 4.66 0.07 0.67 0.65 0.992000 1.38 6.59 0.18 1.23 0.86 1.912001 0.91 4.22 0.32 0.76 -0.03 1.85mean 0.86 4.29 0.71Neuse River, Annual Z3.00Z Lwr90 Upr902.502.001.50Z1.000.500.00-0.50-1.001993 1994 1995 1996 1997 1998 1999 2000 2001 2002YEARFigure 10.22.Estimated Z <strong>and</strong> 90% Confidence Interval, Neuse RiverAnnual Catch Curve, 1994-2001.253
31994 Annual2.5OBS21.5PRED10.50-0.5 0 2 4 6 8 10-1-1.5-2-2.5AGELN(CPUE)LN(CPUE)LN(CPUE)43210-11995 Annual-20-32 4 6 8AGE4321-2-31996 Annual00-12 4 6 8AGEOBSPREDOBSPRED21997 Annual1.5OBS1PRED0.50-0.5-1-1.5-2-2.5 0 2 4 6 8-3AGELN(CPUE)LN(CPUE)LN(CPUE)LN(CPUE)LN(CPUE)21.510.5-1-1.5-2-2.51998 Annual0-0.5 0 2 4 6 8 103.532.521.5-1-1.5AGE1999 Annual10.50-0.5 0 2 4 6 8 105432-3-4-5AGE2000 Annual10-1 0 2 4 6 8 10-2321AGE2001 Annual00 2 4 6 8 10-1-2-3AGEOBSPREDOBSPREDOBSPREDOBSPREDFigure 10.23.Observed <strong>and</strong> Estimated CPUE, Annual Neuse River catch curves.254
Table 10.26.Estimated mortality <strong>and</strong> confidence intervals for Tar River striped bass from cohort catch curves.Year Slope Z Intercept SE (Z) Fishing mortality90% Con. Int.Lower90% Con. Int.Upper1992 1.70 9.36 0.02 1.55 1.61 1.801993 0.93 5.28 0.33 0.78 -1.12 2.991994 1.28 6.86 0.10 1.13 1.04 1.531995 1.30 7.05 0.10 1.15 1.02 1.581996 0.52 4.48 0.23 0.37 -0.93 1.97Mean 1.17 6.40 0.18 1.023.53.02.5Tar Cohort CatchCZLWR90UPR90Z2.01.51.00.50.01992 1993 1994 1995 1996CohortFigure 10.24. Tar River cohort catch curve estimated total mortality <strong>and</strong>confidence interval.255
Est LN(catch)Est LN(catch)31992OBS 19922PRED 1992100 1 2 3 4 5 6 7-1-2-3Age21993OBS 19931.5PRED 199310.500-0.51 2 3 4 5 6 7 8-1-1.5AgeEst LN(catch)Est LN(catch)4.01994OBS 19943.0PRED 19942.01.00.00-1.01 2 3 4 5 6 7 8-2.0-3.0Age4.01995OBS 1995PRED 19953.02.01.00.00-1.01 2 3 4 5 6 7 8-2.0-3.0AgeFigure 10.25.Observed <strong>and</strong> estimated In (catch), Tar River cohort catch curves.Table 10.27.Estimated mortality <strong>and</strong> associated confidence intervals for Tar River striped bass from annualcatch curves.Year lope Z Intercept E (Z)Fishingmortality90% Con. Int.Lower90% Con. Int.Upper1997 1.59 8.05 0.19 1.44 1.16 2.031998 1.57 8.11 0.13 1.42 1.27 1.871999 1.33 7.06 0.08 1.18 1.14 1.512000 1.19 6.85 0.27 1.04 0.40 1.982001 0.82 4.83 0.44 0.67 -0.46 2.10Average 1.30 6.98 0.22 1.15256
2.5Annual Catch Curve Z <strong>and</strong> 90% CI2.01.51.0Z0.50.0-0.5-1.0ZLWR90UPR901997 1998 1999 2000 2001CohortFigure 10.26. Tar River annual catch curve estimated total mortality <strong>and</strong> 90%confidence intervals.6.04.01997ObsEst5.004.003.002000ObsEstln(catch)2.00.0-2.02 3 4 5 6 7ln(catch)2.001.000.00-1.002 3 4 5 6 7-4.0Age-2.00Ageln(catch)6.04.02.00.0-2.0-4.01998ObsEst2 3 4 5 6 7Ageln(catch)3.503.002.502.001.501.000.500.00-0.50-1.00-1.502001ObsEst2 3 4 5 6 7Ageln(catch)5.04.03.02.01.00.0-1.0-2.0-3.01999ObsEst2 3 4 5 6 7AgeFigure 10.27. Observed <strong>and</strong> Estimated In (catch) from Tar River annual catch curves.257
Comparison <strong>of</strong> VPA <strong>and</strong> Catch Curve F estimates, RoanokeFishing Mortality0.80.70.60.50.40.30.20.10VPA 3-7maleCCFemaleCCRecruits1991 1992 1993 1994 1995 1996 1997 1998 1999 2000 2001Year8007006005004003002001000Recruitment, thous<strong>and</strong>Figure 10.28. Annual recruitment <strong>and</strong> mortality estimates for male <strong>and</strong> femaleCPUE catch curves <strong>and</strong> VPA for the Roanoke River.a pattern is expected during periods like the early 1990’s when mortality was variable.According to the VPA, mortality dropped in the mid-1990’s, but this change is notimmediately apparent in the catch curve results. However, as mortality stabilizes in thelate 1990’s , catch curve estimates <strong>and</strong> VPA estimates start to converge.Stocking-Recruitment AnalysisNeuse RiverSeveral measures are explored for evaluating relative recruitment strength <strong>of</strong> NeuseRiver cohorts summed CPUE by cohort, summed CPUE <strong>of</strong> ages 2 <strong>and</strong> 3 by cohort, <strong>and</strong>the catch curve estimate <strong>of</strong> the y intercept (Table 10.28). Several recruitment measuresare positively correlated with stocking rates (Table 10.29), with the exception <strong>of</strong> the Y-intercept value. The highest two values <strong>of</strong> summed CPUE for ages 2 <strong>and</strong> 3 occur in thetwo years when stocking exceeded 100,000 fish (Figure 10.29). The y-interceptestimated from the cohort catch curves is negatively correlated with the number <strong>of</strong> fishstocked, although much <strong>of</strong> this relationship is driven by the very high intercept in 1995when no fish were stocked (Figure 10.30). However, the strong positive correlationbetween the y-intercept <strong>and</strong> total mortality may be an indication that the absolute value<strong>of</strong> the y-intercept is driven more by exploitation than relative abundance, <strong>and</strong> may notbe a robust indicator <strong>of</strong> recruitment. The lack <strong>of</strong> correlation between total mortality (Z)<strong>and</strong> stocking rates indicates that stocking is not an effective tool for managing mortality.258
Table 10.29.Correlation analysis <strong>of</strong> stocking rate <strong>and</strong> recruitment measures for the Neuse River.YEARNumberStockedCPUEsum all agesCPUEage 2-3CPUEage 2 exp(int) ZYEAR 1.00Number Stocked 0.05 1.00CPUE sum all ages -0.69 0.76 1.00CPUE age 2-3 0.29 0.82 0.93 1.00CPUE age 2 -0.17 0.80 1.00 0.73 1.00exp(int) 0.44 -0.24 -0.21 -0.13 -0.31 1.00Z 0.47 0.02 -0.26 -0.08 -0.34 0.93 1.0020Total 2 <strong>and</strong> 3 Catch vs number stockedCPUE, 2+315105R 2 = 0.633300 50000 100000 150000Number StockedFigure 10.29. Neuse River number stocked vs sum <strong>of</strong> catch per unit effortat age 2 <strong>and</strong> 3.Tar RiverSeveral measures are explored for evaluating relative recruitment strength <strong>of</strong> Tar Rivercohorts summed CPUE by cohort, summed CPUE <strong>of</strong> ages 2 <strong>and</strong> 3 by cohort, <strong>and</strong> thecatch curve estimate <strong>of</strong> the y intercept (Table 10.30). Stocking rates in the Tar River arecorrelated with measures <strong>of</strong> recruitment based on the catch per unit effort for age 2 <strong>and</strong>age 2 + age 3 fish (Table 10.31). Unlike the Neuse River, where correlation’s weresimilar for the various CPUE sums investigated, in the Tar River the correlation betweenstocking intensity <strong>and</strong> the sum <strong>of</strong> total CPUE is actually negative. This most likelyreflects an artifact <strong>of</strong> small sample size, as only three cohorts could be analyzed by totalsum CPUE.259
1200Stocked vs Y intexp (yint)10008006004002000R 2 = 0.05770 50000 100000 150000Number StockedFigure 10.30. Neuse River number stocked vs estimated y-interceptTable 10.30.Stocking rates <strong>of</strong> Phase II striped bass <strong>and</strong> measures <strong>of</strong> cohort abundance forthe Tar River.YearNumber Total CPUEStocked SumAge 2CPUE sumAges 2-3CPUE Sumexp(int) Total Mortality (Z)1991 30,8011992 0.0 11,624 1.701993 118,600 195 0.931994 186,254 28.4 957 1.281995 140,972 40.1 9.6 30.8 1,148 1.301996 0 38.6 2.5 20.5 88 0.521997 24,031 1.8 11.6 86 0.721998 0 6.0 13.41999 17,954 8.32000 02001 37,000260
Table 10.31. Correlation <strong>of</strong> stocking rates <strong>and</strong> recruitment measures for the Tar River.YEARNumberStocked SUMCPUE CPUE_2 CPUE 2+3 exp(int) ZYEAR 1.00Number Stocked -0.42 1.00SUMCPUE 0.80 -0.60 1.00CPUE_2 0.04 0.63 1.00 1.00CPUE 2+3 -0.91 0.84 1.00 0.73 1.00exp(int) -0.68 -0.40 -0.23 1.00 0.89 1.00Z -0.75 0.25 -0.37 0.94 0.74 0.77 1.00Although total mortality (Z) is more strongly correlated with stocking intensity in the TarRiver than it was in the Neuse River, the relationship is weak <strong>and</strong> provides littleevidence that stocking is an effective tool for controlling mortality. Similar to resultsfrom the Neuse River, it appears that CPUE is generally higher when stocking ratesexceed 100,000 (Figure 10.31).1200Stocked vs Y intexp (yint)10008006004002000R 2 = 0.05770 50000 100000 150000Number StockedFigure 10.31. Neuse River number stocked vs estimated y-interceptDiscussionThe objective <strong>of</strong> this analysis is to evaluate mortality rates for the Neuse River <strong>and</strong> TarRiver striped bass stocks, to provide guidance in developing managementrecommendations for the CSMA. Two aspects <strong>of</strong> a population are primarily considered261
when evaluating stock status 1) the rate <strong>of</strong> mortality, used to evaluate fishing intensity<strong>and</strong> determine whether or not “overfishing” is occurring or has occurred in the past, <strong>and</strong>2) the abundance <strong>of</strong> the population, used to evaluate the impacts <strong>of</strong> past fishingintensity on the population <strong>and</strong> determine whether or not the stock is “overfished” or hasbeen “overfished” in the past. The two terms are similar, but reference different stockaspects, with the present tense “overfishing” referring to the removal rate <strong>and</strong> the pasttense “overfished” referring to stock abundance in either biomass or numbers. Overfishingis typically defined as occurring when the current rate <strong>of</strong> removals exceeds somethreshold level that is determined from life history characteristics <strong>of</strong> the population <strong>and</strong>analysis <strong>of</strong> population dynamics. Overfished is typically defined as occurring when theabundance <strong>of</strong> the population falls below some threshold level that can only bedetermined through some knowledge <strong>of</strong> desirable abundance or biomass levels.Evaluating “overfished” is more difficult than evaluating “overfishing”, because it isconsiderably more difficult to determine stock abundance <strong>and</strong> develop threshold levelsin terms <strong>of</strong> absolute abundance than to determine mortality rates <strong>and</strong> develop thresholdexploitation levels.Neuse RiverResults <strong>of</strong> the catch curve analysis suggest that total mortality is excessive for theNeuse River stock <strong>of</strong> striped bass. Cohort catch curve estimates <strong>of</strong> total mortalityaverage Z=0.99, resulting in an estimate <strong>of</strong> average fishing mortality <strong>of</strong> F=0.84. Annualcatch curves indicate only slightly lower mortality levels (Z=0.86, F=0.71). Estimatedmortality is significantly higher than the proposed threshold mortality rate(F10%SPR=0.40) based on life history characteristics <strong>of</strong> striped bass in general,therefore overfishing is currently occurring. There is no apparent trend in mortality overtime, suggesting that current management measures may be adequate to prevent stockcollapse. However, current measures are not preventing overfishing <strong>and</strong> are notexpected to provide any stock improvement. As only relative abundance estimates areavailable, it is not known whether the stock is overfished. However, the prolongedoverfishing indicated by the catch curve analysis <strong>and</strong> the truncated age structure <strong>of</strong> thestock suggest the Neuse River striped bass stock is also overfished.Total mortality must be reduced substantially to stop overfishing <strong>of</strong> Neuse River stripedbass. Current fishing mortality (average from cohort catch curves, F=0.84) is estimatedat more than twice the overfishing threshold (F10% SPR = 0.40). Converting frominstantaneous to annual exploitation rates, the current removal rate <strong>of</strong> 53% must bereduced by 42% to reach the threshold. Mortality will have to be reduced even further,by 61%, to reach target levels (Table 10.32).Tar RiverEstimates <strong>of</strong> total mortality for the Tar River striped bass stock indicate that mortality isexcessive. Cohort catch curve estimates <strong>of</strong> total mortality average Z=1.17, resulting inan estimate <strong>of</strong> fishing mortality <strong>of</strong> F=1.02. Annual catch curve estimates are slightlyhigher, with total mortality averaging Z=1.30 <strong>and</strong> fishing mortality averaging F=1.15.These mortality estimates are significantly higher than the proposed threshold mortality262
Table 10.32.Summary <strong>of</strong> current exploitation <strong>and</strong> the degree <strong>of</strong> exploitation relative to target <strong>and</strong> thresholdvalues, as both instantaneous rates <strong>and</strong> annual percentage removals, <strong>and</strong> reductions inexploitation necessary to achieve threshold <strong>and</strong> target exploitation levels for the Neuse River <strong>and</strong>Tar River.NEUSE Reference F Relative FAnnual %Removal (A)Relative AReduction% <strong>of</strong> (A)Faverage 0.84 53%Fthreshold 0.4 2.10 31% 1.73 42%Ftarget 0.25 3.36 21% 2.59 61%TAR REFERE<strong>NC</strong>E F Relative FAnnual %Removal (A)Relative AReduction% <strong>of</strong> (A)Faverage 1.02 60%Fthreshold 0.4 2.55 31% 1.95 49%Ftarget 0.25 4.08 21% 2.92 66%Faverage is average <strong>of</strong> cohort based catch curve fishing mortality estimates.Ftarget <strong>and</strong> Fthreshold based on Advisory Panel recommendationsrate (F10%SPR=0.40) based on life history characteristics striped bass in general,therefore overfishing is currently occurring. As only relative abundance estimates areavailable, it is not known whether the stock is overfished. However, the prolongedoverfishing indicated by the catch curve analysis <strong>and</strong> the truncated age structure <strong>of</strong> thestock suggest the Tar River striped bass stock is also overfished. Although the TarRiver analysis is only based fewer years <strong>of</strong> survey data than the Neuse River analysis,the available data fit the catch curve models quite well, based on the strong linear trendin log transformed CPUE that is evident in both cohort <strong>and</strong> annual catches, consistencyin the estimated slope parameters which can be considered evidence <strong>of</strong> consistentrecruitment, <strong>and</strong> relatively small st<strong>and</strong>ard errors in both slope <strong>and</strong> intercept parametersfor most years.Total mortality must be reduced substantially to stop overfishing <strong>of</strong> Tar River stripedbass. Current fishing mortality (average from cohort catch curves, F= 1.02) is estimatedat more than two times the overfishing threshold (F10% = 0.40). Converting frominstantaneous to annual exploitation rates, the current removal rate <strong>of</strong> 60% must bereduced by 49% to reach the threshold. Mortality will have to be reduced even further,by 66%, to reach target levels (Table 10.32).Roanoke River Catch Curve – VPA ComparisonCatch curves applied to survey CPUE compare favorably with catch-age assessmentresults for the Roanoke River. Deviations between mortality estimates provided by thetwo approaches are most apparent during times when the catch curve assumption <strong>of</strong>constant mortality is violated. When mortality is fluctuating without trend, as it did duringthe early 1990’s for the AR stock, catch curve estimates tend to reflect the averagemortality over time.263
When mortality drops markedly, as it did in the mid-1990’s for the AR stock, cohortcatch curves exhibit a lag <strong>and</strong> do not reflect the change for several more years. This isto be expected; cohorts which experienced the higher mortality, even if only for a fewyears, will continue to reflect the impact <strong>of</strong> that higher mortality over time. Only cohortshaving a majority <strong>of</strong> ages that experience reduced mortality will tend to reflect lowermortality rates overall. Thus, it is not until mortality rates stabilize for a number <strong>of</strong> years,as in the late 1990’s, that the constant mortality assumption is met <strong>and</strong> catch curveanalysis reflect reduced mortality. Overall, the catch curve mortality results do notappear biased, <strong>and</strong> do reflect the general magnitude <strong>of</strong> the mortality that each cohortexperienced over its lifetime.Stocking-RecruitmentSome measures <strong>of</strong> cohort abundance or recruitment are correlated with stocking rates.We initially postulated that CPUE for age 2 or ages 2 <strong>and</strong> 3 would show the strongestcorrelation with stocking <strong>and</strong> that any relationship with the total CPUE would be maskedby mortality over time. For the Neuse River total CPUE was only slightly less correlatedwith stocking rates than the CPUE <strong>of</strong> younger ages, <strong>and</strong> in the Tar River the correlationwas negative. In general, drawing a strong conclusion from the Tar River data ishampered by low sample size.Years in which stocking rates exceed 100,000 Phase II fish result in cohorts havinggreater abundance than in those years when stocking rates are lower or stocking doesnot occur. Because no measures are available <strong>of</strong> the relative abundance <strong>of</strong> stocked <strong>and</strong>wild fish, there is no way to determine whether such relationships are simply due tochance, <strong>and</strong> no way to prove that stocking is actually enhancing natural recruitment. Forexample, stocking may have simply coincided with strong natural recruitment.Cohort mortality rates are not correlated with stocking rates, thus there is no evidencethat stocking is an effective management tool for controlling mortality for individualcohorts. Rather, stocking likely contributes to higher overall catches for stocked cohorts.Of course, this could in turn reduce the mortality <strong>of</strong> weak cohorts, so stocking may bepreventing complete stock collapse during years <strong>of</strong> poor recruitment in these systems. Ifthis is the case, stocking may be creating costly put-<strong>and</strong>-take fisheries.<strong>Management</strong> OptionsMortality estimates for the Tar <strong>and</strong> Neuse Rivers are very similar, thus the PDTrecommends continuing to manage these stocks under the same guidelines. The twostocks are currently treated as a single management unit in the FMP. Creating moremanagement boundaries will increase confusion regarding regulations <strong>and</strong> addunnecessary complexity to the management program that will likely reduce the overalleffectiveness <strong>of</strong> <strong>and</strong> support for any measures that are developed. Therefore, themanagement alternatives developed are considered applicable to the entire Central-Southern management unit. Regulations may vary between Inl<strong>and</strong> <strong>and</strong> Marinejurisdictions.264
Current regulations for the ASMA are given where applicable for comparison.Regulations in the ASMA are considerably less restrictive now as compared to the late1980s <strong>and</strong> mid 1990s when the stock was depressed, <strong>and</strong> are consistent withmaintaining a sustainable harvest from a recovered stock. Therefore, ASMA regulationsmay not be adequately restrictive to halt the overfishing that is occurring in the Tar River<strong>and</strong> Neuse River stocks. Commercial regulations in the ASMA are fairly specific,reflecting modifications over time intended to limit discard losses by reducinginteractions between commercial gears <strong>and</strong> striped bass <strong>and</strong> to promote a non-directedfishery. Therefore, ASMA commercial regulations may not be compatible with the stock<strong>and</strong> fishery conditions in the CSMA.Recreational <strong>Fishery</strong>MoratoriumThis measure would prohibit any harvest or possession <strong>of</strong> striped bass in the CentralSouthern <strong>Management</strong> Unit. Short-term harvest moratoriums were used to effectivelyrecover striped bass along the Atlantic Coast. Because complete harvest <strong>and</strong> effort dataare unavailable, there is no way to quantitatively evaluate the impacts <strong>of</strong> a moratorium<strong>and</strong> elimination <strong>of</strong> the fishery, even temporarily. Guidelines would be needed for reopeningthe fishery, however the lack <strong>of</strong> any quantitative information on stockabundance will make any criteria purely subjective. Eliminating the fishery wouldremove the potential for collecting catch related stock information (catch rates, l<strong>and</strong>ings,age <strong>and</strong> length information).+ Maximum recovery <strong>and</strong> rebuilding potential+ Ease <strong>of</strong> enforcement- Elimination <strong>of</strong> fishery- Uncertainty in reopening criteria- Uncertainty in stock status <strong>and</strong> need for such severe action- Loss <strong>of</strong> potential data sourcePossession LimitPossession limits are used to restrict harvest <strong>of</strong> many fisheries. Hook <strong>and</strong> linerecreational catch rate data for the CSMA are extremely limited; geographic coverage <strong>of</strong>the MRFSS does not extend beyond the lower reaches <strong>of</strong> the Tar <strong>and</strong> Neuse Rivers<strong>and</strong> few samples from the areas that are covered include observations <strong>of</strong> striped bass.Quantifying possession limits is not possible at this time <strong>and</strong> must therefore be judgedsubjectively. The current restriction for this management unit is 3 fish per day. Based onthe limited MRFSS data for 1987-2002 (with 2002 not finalized through all waves), 63%<strong>of</strong> anglers harvest one fish or less, 27% l<strong>and</strong> two fish, 2% l<strong>and</strong> three fish, <strong>and</strong> 8% l<strong>and</strong>four or more fish.Striped bass may also be harvested by RCGL license holders in the CSMA. Preliminary2002 RCGL survey data show a mean catch per trip <strong>of</strong> 1.2 striped bass for large meshgill nets in the CSMA (the primary RCGL gear that harvests striped bass)265
Options1. No change (3 fish limit)+ No management changes necessary.- No protection for the stocks, overfishing continues.- Over half <strong>of</strong> anglers catch one fish or less.2. Reduce the possession limit to one or two fish.+ May provide some stock protection. 10% <strong>of</strong> anglers l<strong>and</strong> three or more, 37%l<strong>and</strong> two or more.- Overall effectiveness is unknown since total removals are unknown.- Increased discard loss.- May reduce angler satisfaction.3. Establish the same limits as used in the ASMA.+ Ease <strong>of</strong> implementation <strong>and</strong> enforcement.+ Reduced confusion by eliminating statewide variation.+ Offers considerable stock protection.Regulations appropriate for a recovered stock may be inadequate for anoverexploited stock.Impacts cannot be quantified due to a lack <strong>of</strong> effort <strong>and</strong> catch rateinformation.Size LimitSize limits can be effective tools for recovering stocks by limiting overall catch rates,<strong>and</strong> they can also be used to protect spawning fish if developed in accordance with sizeat maturity. The current size limit in coastal waters is 18”. Inl<strong>and</strong> waters have an 18”minimum, <strong>and</strong> a slot limit prohibiting possession <strong>of</strong> fish between 22” <strong>and</strong> 27” in the Tar<strong>and</strong> Neuse Rivers from April 1 – through May 31 (Similar to the Roanoke River). Thecombined effects <strong>of</strong> the slot limit, possession limits, <strong>and</strong> seasonal restrictions on theRoanoke River result in the majority <strong>of</strong> the harvest being composed <strong>of</strong> smaller, malefish. Age at maturity studies from the Roanoke River indicate 50% <strong>of</strong> females aremature at age 3 <strong>and</strong> 93% are mature at age 4. Size at age for female Neuse Riverstriped bass is about 20” at age 3 <strong>and</strong> 22” at age 4. A 22” size limit would be necessaryto let most female fish spawn once before vulnerable to harvest.Options1. No change+ No management changes necessary+ Consistency with other striped bass regulations- Allows harvest <strong>of</strong> females before they reach spawning age- Provides no additional stock protection2. Increase restriction to 20”+ Could provide some catch reduction+ Allows approximately 50% <strong>of</strong> females to reach maturity before harvest- Inconsistency with ASMA regulations.- Results cannot be quantitatively analyzed3. Increase restriction to 22”+ Could provide catch reduction266
+ Allows most (93%) <strong>of</strong> females to reach maturity before harvest- Inconsistency with Albemarle-Roanoke regulations- Results cannot be quantitatively analyzed4. Establish same limits as in the ASMA+ Consistency <strong>and</strong> ease <strong>of</strong> implementation+ May provide some catch reduction- Actual impacts on Neuse <strong>and</strong> Tar stocks cannot be quantified- May not be adequate given that AR stock is declared recovered <strong>and</strong> CSMAstocks are experiencing overfishing5. Establish a slot possession limit consistent with WRC regulationsProhibition <strong>of</strong> possession, 22”- 27”+ Consistency in regulations+ Protection <strong>of</strong> a portion <strong>of</strong> the spawning stock- Effects not reliably quantified- May increase pressure on 18-22” fish6. Reduce the minimum size- Will reduce values <strong>of</strong> threshold <strong>and</strong> targets- Increased exploitation before maturity- Strong likelihood <strong>of</strong> increased harvest <strong>and</strong> exploitationQuotaQuotas are used to manage the Albemarle-Roanoke striped bass stock <strong>and</strong> severalother fisheries in the state. Quotas are effective when accurate <strong>and</strong> timely l<strong>and</strong>ingsstatistics are available, <strong>and</strong> should only be developed when accurate information onstock status, including overall abundance, is also available. Such information is notavailable for the C/S stocks. Moreover, quotas impose considerable dem<strong>and</strong>s onmanagement <strong>and</strong> monitoring, require real-time catch tabulation for all fisherycomponents <strong>and</strong> regular stock assessments for quota specification, <strong>and</strong> <strong>of</strong>ten lead toconsiderable discard <strong>and</strong> waste problems.Options1. No Change (Do not implement a quota)+ Does not require costly, real-time monitoring+ Does not require annual stock status estimates- No overall catch limitation imposed2. Implement a Quota+ Definite restriction on catch+ Is a proven <strong>and</strong> effective management measure (if bycatch is controlled)+ May be perceived as equitable in light <strong>of</strong> current commercial quota- Appropriate quota level cannot be determined- Catch rates are not available for quota monitoringSeasonSeasonal restrictions are an effective tool for limiting harvest <strong>and</strong> sometimes effort, <strong>and</strong>may allow lower size limits or higher possession limits during times when possession isallowed. Enforcement is <strong>of</strong>ten a concern during the initial closure, but compliance tends267
to increase over time if regulations are consistent. Differences in seasons between theAR stock <strong>and</strong> the rest <strong>of</strong> the state may now create some confusion <strong>and</strong> may be anenforcement burden. Analyzing appropriate seasons <strong>and</strong> evaluating catch reductionsassociated with seasons for the Neuse <strong>and</strong> Tar stocks are not possible at this time dueto a lack <strong>of</strong> adequate catch statistics. Limited MRFSS <strong>and</strong> preliminary RCGL surveydata, combined with anecdotal knowledge, may allow determination <strong>of</strong> appropriateseasonal closures.Seasons can impose a discard mortality cost, although in theory closures could bedeveloped to address seasonal differences in discard mortality rates. Application <strong>of</strong> theclosure must consider not only seasonal discard mortality but also the relative popularity<strong>of</strong> the species being regulated. For example, a closure during periods <strong>of</strong> high watertemperatures could reduce discard losses if effort declines as a result <strong>of</strong> the closure.Conversely, the closure could increase discard losses if the species being restricted isnot a primary target <strong>and</strong> the closure has no effect on effort. Discard losses may be bestminimized if seasonal closures for non-target species coincide with periods <strong>of</strong> greatestdiscard survival.1. No change.+ No management changes necessary+ No enforcement burden- No catch limitation.- Other measures (size, bag limits) will need to be more strict2. Impose a seasonal restriction equivalent to that in the ASMA+ Consistency <strong>and</strong> ease <strong>of</strong> implementation+ Reduced confusion+ Likely to provide considerable catch reduction- Impacts on Neuse <strong>and</strong> Tar stocks <strong>and</strong> fisheries cannot be quantified- May not be adequate given that AR stock is considered recovered3. Impose specific CSMA seasonal restriction+ May provide stock protection if adequately determined+ May provide CSMA specific management option+ Could be developed to reduce discard losses during periods <strong>of</strong> high mortality(but only if fishing effort decreases during the closure)- Inadequate information available to determine specific timing <strong>and</strong> closure length4. Enact a total closure – No open season.+ Will reduce exploitation- Likely to increase discard lossesHarvest TargetsRecreational fisheries in the CSMA are managed by seasons, possession limits, <strong>and</strong>size limits. The lack <strong>of</strong> information on stock abundance precludes development <strong>of</strong>harvest limits from fishing mortality targets. The recreational regulations in the CSMAremain at status quo in 2004. A recreational creel survey will be conducted throughoutthe CSMA during 2004. Upon completion <strong>of</strong> the survey, data will be analyzed <strong>and</strong>restrictive measures implemented on the fishery as needed.268
Commercial <strong>Fishery</strong>The commercial fishery in the CSMA is managed through a 25,000 lb. quota. A seasonis imposed which is only opened when the AR management unit is open to commercialharvest <strong>and</strong> closes once the quota allocation is reached. During the harvest seasonpossession is limited to five fish per vessel per day. In spite <strong>of</strong> the low quota <strong>and</strong>restrictive trip limits, over 30% <strong>of</strong> gill net trips l<strong>and</strong> catches composed primarily (definedas over 50%) <strong>of</strong> striped bass. Most l<strong>and</strong>ings are taken by large mesh (>5”) gillnet duringwinter. Discards <strong>of</strong> striped bass during fisheries for other species, such as flounder,shad, <strong>and</strong> mullet likely exceed the l<strong>and</strong>ed harvest.MoratoriumA moratorium would prohibit possession <strong>of</strong> striped bass by commercial fishermen in theCSMA. Given the limited quota <strong>and</strong> low possession limit currently in effect, amoratorium will not likely change fishing practices, <strong>and</strong> since prohibiting possession willnot prevent capture, this alternative will increase discarding <strong>and</strong> loss.+ Will prevent harvest.- Increased discard losses will consume much <strong>of</strong> the savings in catch.- Disruption <strong>of</strong> the remaining market.- Catch related data collection lost.- St<strong>and</strong>ards for reopening difficult to establish.QuotaThe current quota is 25,000 pounds.Options1. Status quo- monitor the harvest <strong>and</strong> close the fishery when quota reached,deduct overages from the next years quota allocation.+ No changes necessary.+ Discards not increased.- No additional protection to the stock.2. Decrease the quota.+ Harvest restricted.+ Simplicity.- Discards will increase.- Disruption <strong>of</strong> remaining market.Possession LimitThe current possession limit is five fish per day.Options1. Status quo.+ No change necessary.+ Extends the season.- Fishermen may desire a directed fishery.- No l<strong>and</strong>ings reduction since fishery is quota managed.- Creates discard if catch rates exceed five fish.269
2. Decrease the possession limit+ Further extend the season+ Strengthens bycatch only fishery- Increased discarding- No l<strong>and</strong>ings reduction since fishery is quota managed3. Increase the possession limit+ Would allow greater harvest per trip (increased value)+ Reduced discard losses during the open season.+ Provides a shorter season, which may reduce discard losses if strict gearrestrictions are imposed during closed season.- Provides a shorter season, which may increase discard losses during longerclosed periods if no other changes (e.g. gear modifications) made.- Potential for increased targeting- No total l<strong>and</strong>ings reductionSize LimitThe current size limit <strong>of</strong> 18” is the same as the ASMA size limit.Options1. No change+ No management changes necessary+ Consistency with other striped bass regulations- Allows harvest <strong>of</strong> females before they reach spawning age- Provides no additional stock protection- Increases discards2. Increase minimum restriction to 20”+ Could provide some catch reduction.(Fish house sampling indicates that 2% <strong>of</strong>l<strong>and</strong>ings are ≤ 20”)+ Allows approximately 50% <strong>of</strong> females to reach maturity before harvest- Benefits to the population can only be qualitatively evaluated.3. Increase minimum restriction to 22”+ Could provide catch reduction ( Fish house sampling indicates that 34% <strong>of</strong>l<strong>and</strong>ings are ≤ 22”)+ Allows most (93%) <strong>of</strong> females to reach maturity before harvest- Benefits to the population can only be qualitatively evaluated.4. Enact a protected slot similar to inl<strong>and</strong> recreational areasProhibition <strong>of</strong> possession, 22” – 27”+ Increased protection <strong>of</strong> spawning stock- Could increase discard losses, depending on gear selectivity5. Reduce the size limit- Will lower values <strong>of</strong> target <strong>and</strong> threshold- Possible increased exploitation <strong>of</strong> immature fishBycatch Only Specifications270
Additional management measures could be imposed that restrict directed harvest. Forexample, striped bass could be limited to a specific fraction (e.g., 25%, 50%) <strong>of</strong> the totalcatch, typically by weight.Options1. Status Quo. Do not restrict the proportion <strong>of</strong> the catch that is striped bass+ Ease <strong>of</strong> enforcement+ Flexibility for fishermen- Potential for directed harvest2. Enact catch proportion restriction+ Prohibits directed harvest- Easy to ‘work around’ given the small possession limit (five fish; fishermen wouldeasily possess enough “bait” or other species to cover the striped bassl<strong>and</strong>ings)- May not effectively stop directed harvest- Enforcement burden- Reduces flexibility3. Specifically prohibit directed harvest <strong>of</strong> striped bass+ Would prohibit directed fishery- Nearly impossible to effectively enforce- Nearly impossible to draft into a ruleGear RestrictionsMany gear restrictions are used in the ASMA to manage the commercial quota <strong>and</strong> limitdiscard losses (e.g., see Table below). These measures have evolved over time inASMA Yardage RestrictionsTypical ASMA Yardage RestrictionsCategory Flounder Large Mesh (SHAD) Small meshDesc. 5 ¼” <strong>and</strong> above 1 5 ¼” <strong>and</strong> above 2 3 – 3 ¼ “ 3Yardage Limit 3000 1,000 8001. Flounder –must be tied down- not to exceed vertical height <strong>of</strong> 48 inches2. Large mesh (Shad nets)- - seasonal only mid-February – 15 April3. Small mesh Eastern sound seasonal allowance <strong>of</strong> 3 ¾ <strong>and</strong> 4 inchresponse to the specific fisheries, conditions, <strong>and</strong> fishing practices <strong>of</strong> that area, <strong>and</strong> arenot likely directly applicable to the CSMA, although some measures such as tie downrestrictions may have more wide-spread applicability. Impacts <strong>of</strong> such measures, oneither the fisheries or the population, are difficult to evaluate because there is little onwatersampling <strong>of</strong> gill net fisheries in the CSMA <strong>and</strong> DMF monitoring program nets arenot fished or constructed identical to commercial fishery nets.271
Central-Southern <strong>Management</strong> Area- Observed yardageAreaMeshCategory Description WinterSpring &SummerPamlico Large >30%Fldr, >5% shad/stb, >=5” mesh 1314 1423Pamlico Small 3 – 4 ½”, shallow 1262 820Rivers Large >30%Fldr, >5% shad/stb, >=5” mesh 952 1121Rivers Small 3 – 4 ½”, shallow 440 540Options1. Status quo. No changes to gillnet restrictions+ Ease <strong>of</strong> implementation+ No disruption <strong>of</strong> existing fisheries+ No disruption <strong>of</strong> fishing practices+ No costs from gear modifications- Continued overharvest- Continued discard losses2. Implement gillnet restrictions in accordance with ASMA requirements.+ Ease <strong>of</strong> implementation+ May provide some bycatch reductions+ Reduces importance <strong>of</strong> boundary lines- Measures appropriate in ASMA may not be appropriate in CSMA- Enforcement burden- Increased regulatory confusion; ASMA rules change <strong>of</strong>ten- Sampling indicates yardage used does not differ much from ASMA requirements3. Restrict allowable gillnet yardage.+ Would reduce total effort in some cases+ Would reduce harvest <strong>and</strong> discard losses- May disrupt other fisheries- Appropriate measures difficult to quantify due to lack <strong>of</strong> on-water observer data4. Restrict use <strong>of</strong> 4 – 4 ½ “ gill net meshMesh <strong>of</strong> this size is not allowed in the ASMA because it is very effective atcatching striped bass. However, this mesh is widely used in the Pamlico Soundfor a variety <strong>of</strong> fisheries. There is little information available to use in judging theimpacts <strong>of</strong> restricting this size mesh in the CSMA.+ Reduced interactions with striped bass- Overall impacts to Central-Southern fisheries is unknown.- Current net attendance rules may have already provide a discard reduction- Unforeseen circumstances (i.e., switching to other size mesh) could creatediscard problems in other fisheries or with protected <strong>and</strong> endangered species5. Increase net attendance requirements.Currently gillnets with mesh less than 5” must be attended at all times in theupriver sections <strong>of</strong> the Tar (Pamlico) River <strong>and</strong> Neuse rivers, <strong>and</strong> when within200 yards <strong>of</strong> the shoreline in the downriver sections. (15A <strong>NC</strong>AC 03J.0103.g).+ Increasing the attendance requirements may reduce overall effort272
- Additional burden on fishing operations- Most <strong>of</strong> the areas in the Tar <strong>and</strong> Neuse Rivers already require attendance- Difficult to evaluate discard reductions achieved from attendance requirements,especially without adequate information on current discard rates.6. Require net ‘tie-downs’Flounder nets in the ASMA must be ‘tied down’, i.e. held to within the bottom 48”<strong>of</strong> the water column, to reduce interactions with striped bass. Tie-downrequirements could be developed for certain times <strong>of</strong> the year (e.g., when closedto striped bass harvest), <strong>and</strong> for certain areas <strong>of</strong> the CSMA (e.g., portions <strong>of</strong> therivers)+ May reduce striped bass interactions <strong>and</strong> thus reduce bycatch- Likely to increase sea turtle interactions <strong>and</strong> especially deaths if required in theSound.- Likely to increase red drum interactions <strong>and</strong> bycatch losses- May be infeasible in some areas due to tide intensityResearch NeedsQuantitative assessment <strong>of</strong> Tar <strong>and</strong> Neuse River striped bass populations.Significant additional data are required to enable a thorough assessment <strong>of</strong> CSMAstocks. Information currently available includes commercial l<strong>and</strong>ings <strong>and</strong> associatedbiological characteristics, age structured surveys <strong>of</strong> Tar <strong>and</strong> Neuse spawningpopulations, limited migration <strong>and</strong> movement information from tag recoveries <strong>of</strong> stockedfish, <strong>and</strong> limited stock mixing from ASMA tagging programs <strong>and</strong> tagged stocked fish inthe Tar <strong>and</strong> Neuse Rivers.1. Data Needs And Potential Sources1. Complete l<strong>and</strong>ings statistics for recreational fisheries (Creel Survey)2. Biological characteristics <strong>of</strong> recreational fisheries (length, weight, age, sex(Creel Samples)3. Discard estimates from recreational fisheries (Creel Survey)4 Biological characteristics <strong>of</strong> recreational discard (Angler logs orIndependent survey)5. Biological characteristics <strong>of</strong> commercial catch , including length, age,weight, <strong>and</strong> sex (increased sampling, age structure collection)6. Discard estimates from commercial fisheries (Trip level observercoverage)7. Exp<strong>and</strong>ed survey coverage, including juvenile abundance <strong>and</strong> populationabundance in the Sounds <strong>and</strong> lower Rivers (New or exp<strong>and</strong>ed surveys)8. Increased external tagging <strong>of</strong> stocked fish (Additional tagging effort)9. Comprehensive tagging <strong>of</strong> wild fish, including estimation <strong>of</strong> reporting rates(New Program)10. Life history information maturity; fecundity; size <strong>and</strong> weight at age; egg<strong>and</strong> larval survival (Short term research projects; Federal aid/Universities)2. Thorough Analysis Of Stocking Programs273
To evaluate if stocked fish are contributing to the catch, establish percentcontribution, <strong>and</strong> determine optimal stocking rates for both Phase I <strong>and</strong> II fish. Thiswill become crucial if juvenile surveys are initiated.3. Comprehensive Tagging ProgramA tagging program provides a quick measure <strong>of</strong> exploitation, relative catch ratesby fishery components, migration <strong>and</strong> movement information, <strong>and</strong> will exp<strong>and</strong>knowledge <strong>of</strong> the stock composition <strong>of</strong> fisheries in both ASMA <strong>and</strong> CSMA. Also asource <strong>of</strong> samples for various biological studies <strong>and</strong> for catch characterization.4. Observer Coverage Of Commercial FisheriesCommercial discard is a potentially important but largely unobserved source <strong>of</strong>stock removals. Sampling <strong>and</strong> observation <strong>of</strong> commercial fishing trips on-the-wateris the most reliable source <strong>of</strong> trip <strong>and</strong> gear characteristics, discard rates, <strong>and</strong> catchrate information.MFC, DMF, WRC, FWS <strong>and</strong> C/S Advisory Committee <strong>Management</strong>RecommendationRecreational <strong>Fishery</strong> <strong>Management</strong> MeasuresAdequate information to evaluate specific recreational measures are lacking in theCSMA. Regulations should remain at status quo for 2004. A one year creel survey isbeing developed by DMF <strong>and</strong> WRC for the Tar-Pamlico <strong>and</strong> Neuse systems. Thissurvey will collect data on the recreational striped bass fisheries in these waters. TheWRC will be conducting a creel survey in the Cape Fear system in 2004. Aftercompletion <strong>of</strong> the creel surveys the data will be analyzed <strong>and</strong> appropriate regulationsimplemented as needed for the stocks.Commercial <strong>Fishery</strong> <strong>Management</strong> MeasuresCommercial fishery gill net restrictions have been enacted over the last several years,as a result <strong>of</strong> the Red Drum FMP <strong>and</strong> endangered species interactions. Large areas <strong>of</strong>Pamlico Sound are closed to gillnetting from August 15 – December 15, <strong>and</strong> other areashave strict permitting <strong>and</strong> gear restrictions. Attendance is required <strong>of</strong> gill nets within theupper rivers <strong>and</strong> within 200 yards <strong>of</strong> shore in lower river portions.Comprehensive DMF gill net sampling within Pamlico Sound indicate extremely lowcatch rates <strong>of</strong> striped bass. Therefore, it is unlikely that gill net fisheries in the Sound areresponsible for significant bycatch losses, <strong>and</strong> management efforts should instead focuson reducing striped bass interactions in the rivers. With the exception <strong>of</strong> the allowance<strong>of</strong> 4 –4 ½ inch mesh, many <strong>of</strong> the gill net restrictions imposed in Albemarle Sound arealready required in the rivers <strong>of</strong> the CSMA.Commercial <strong>Fishery</strong> <strong>Management</strong> Measures see Section 10.4.3.2 Discard Mortality<strong>of</strong> Striped Bass from Set Gill Nets in the CSMA.274
10.4.3.2 Discard Mortality <strong>of</strong> Striped Bass from Set Gill Nets in theCentral/Southern <strong>Management</strong> Area (CSMA)IssueInvestigation <strong>of</strong> discards <strong>of</strong> striped bass in the multi-species, set gill net fishery in theCentral Southern <strong>Management</strong> Area (CSMA).DefinitionsA variety <strong>of</strong> terms have been used in the literature related to wastagein fisheries. The term "bycatch" has been used in scientific <strong>and</strong> popular literature formore than half a century <strong>and</strong> has been subject to a variety <strong>of</strong> definitions, some <strong>of</strong> whichare overlapping or contradictory. It can best be used as a generic term, applying to thatpart <strong>of</strong> the catch made up <strong>of</strong> non-target species or species assemblages (Alverson et al.1994).Target Catch-The catch <strong>of</strong> a species or species assemblage which is primarily soughtin a fishery, such as shrimp, flounders, etc.Incidental Catch-Retained catch <strong>of</strong> non-targeted species.Discarded Catch-That portion <strong>of</strong> the catch returned to the sea as a result <strong>of</strong> economic,legal, or personal considerations.Bycatch-Discarded catch plus incidental catch.Attended-Being in a vessel, in the water or on the shore immediately adjacent to thegear <strong>and</strong> immediately available to work the gear <strong>and</strong> within 100 yards <strong>of</strong> any gear in useby that person at all times. Attended does not include being in a building or structureBackgroundGill Net FisheriesThe estuarine gill net fishery <strong>of</strong> North Carolina is a year round multi-species fisherywhere netting used <strong>and</strong> species targeted varies by area <strong>and</strong> season. Species commonlycaught by the gill net fishery include American shad, Atlantic croaker, southern flounder,red drum, spot, spotted seatrout, striped bass, striped mullet <strong>and</strong> weakfish.A gill net is defined as a net set vertically in the water to capture fish by entanglementby the gills in its mesh as a result <strong>of</strong> net design, construction, mesh size, webbingdiameter or method in which it is used. Three primary types <strong>of</strong> gill net deployment existin the North Carolina estuarine gill net fishery set, runaround, <strong>and</strong> drift nets. Runaroundnets, also referred to as drop nets or strike nets, are <strong>of</strong>ten fished in one <strong>of</strong> two ways. Forthe first method, the net is attached to a point on shore <strong>and</strong> deployed parallel to shorewith the terminal end <strong>of</strong> the net attached to the shore when the net is fully deployed.After the net has been set to block in a section <strong>of</strong> the shoreline, the boat is taken insidethe blocked area, the fishermen rap on the boat with wooden poles or similarimplements such that the resident fish leave the shallow shoreline <strong>and</strong> return to deeper275
waters. Fish encounter the net as they flee the shoreline. The net is retrieved afterseveral passes have been made within the blocked area. For the second method, thenet is set to encircle a school <strong>of</strong> fish (<strong>NC</strong>DMF 1997). The runaround gillnet fisherytypically targets striped mullet <strong>and</strong> operates year round with most <strong>of</strong> the effort occurringduring the fall from September through November. Vessels are usually open skiffsranging from 15 to 25 feet in length with one or two-man crews. (<strong>NC</strong>DMF 2002). Driftnets are similar to the drop net but do not have enough weight attached to the lead lineto remain stationary. The nets drift with the current. Drift nets are primarily used for shad<strong>and</strong> herring during spawning runs. Fishermen are actively tending their nets in both <strong>of</strong>these methods <strong>and</strong> bycatch may be readily returned to the water.The last method, set nets, is the gill net fishery addressed in this issue paper. Set netsare deployed, anchored or staked, <strong>and</strong> left from a few hours up to a few days dependingon severity <strong>of</strong> the weather <strong>and</strong> water temperature. Most sets are overnight. Set nets canbe further divided into float <strong>and</strong> sink net categories. Float nets fish the entire height <strong>of</strong>the water column, while sink nets fish a fixed distance <strong>of</strong>f the bottom <strong>and</strong> do not extendto the upper portion <strong>of</strong> the water column. Large mesh nets (5.0 inch <strong>and</strong> greater) are setprimarily for flounder or shad, while small mesh (less than 5 inch) are directed towardsciaenids, striped mullet, bluefish, <strong>and</strong> a variety <strong>of</strong> other species.A large mesh fishery operates from April (February in the rivers) through December inseveral areas shallow water next to the barrier isl<strong>and</strong>s in Pamlico <strong>and</strong> Core sounds,deep water Pamlico Sound, <strong>and</strong> the rivers <strong>of</strong> Pamlico, Pungo, Bay <strong>and</strong> Neuse bothshallow <strong>and</strong> deep. Fishing depths are typically less than six feet for the shallow fishery<strong>and</strong> greater than ten feet for the deep water. Vessels are usually open skiffs rangingfrom 15 to 25 feet in length. Each fisherman sets 500 to 5000 yards <strong>of</strong> large mesh (5 1/4to 7 inch) gillnet, which are soaked overnight <strong>and</strong> retrieved by h<strong>and</strong> or with the aid <strong>of</strong> netreels. Tie-downs may or may not be used, depending on the area <strong>and</strong> tidal conditions.The smaller operations generally occur in the shallow water fisheries <strong>and</strong> in the rivers.A shallow water small mesh “set” gillnet fishery operates along the Outer Banks withmost <strong>of</strong> the effort occurring from October through early December. Nets are anchoredovernight, similar to the large mesh fishery for flounder that occurs in the same area.Vessels are usually open skiffs ranging from 15 to 25 feet in length with one or two-mancrews. Each fishing operation sets 500 to 2000 yards <strong>of</strong> small mesh (3 to 4 1/2-inchstretched mesh) gillnets, which are retrieved by h<strong>and</strong>. Sets are composed <strong>of</strong> many shortlengths <strong>of</strong> gillnet with most constructed <strong>of</strong> 0.5 mm twine or smaller. Tie-downs are notused in this fishery, but net depths range from 6 to 11 feet with sets occurring in depthsless than three feet. This combination <strong>of</strong> water depth <strong>and</strong> net depth provides the samebag effect as the tie-down in the deep water large mesh fishery. Target species includestriped mullet, spotted seatrout, weakfish, <strong>and</strong> bluefish. A similar small mesh fisheryexists in the rivers <strong>and</strong> in the upper reaches <strong>of</strong> rivers the <strong>and</strong> targets white perch <strong>and</strong>catfish.Using 2000 <strong>and</strong> 2001 as a basis, Tables 10.33 <strong>and</strong> 10.34 gives the average annualpounds <strong>and</strong> dollar value <strong>of</strong> l<strong>and</strong>ed target species, broken out by large <strong>and</strong> small mesh276
for the Sound <strong>and</strong> the river fisheries. For all species combined, the Pamlico Sound setgill net fishery averaged 1.4 million pounds with a dockside value <strong>of</strong> $1.9 million. Therivers set gill net fishery average 0.5 million pounds <strong>and</strong> $0.9 million. Table 10.35 givesthe number <strong>of</strong> participants in these fisheries (defined as a unique individual who had atleast 10 trips annually).CSMA Striped Bass <strong>Management</strong>Since 1994, when the North Carolina Striped Bass <strong>Management</strong> <strong>Plan</strong> was approved,the Central/Southern <strong>Management</strong> Area has operated on a 25,000 pound TAC. Thefishery has operated as a low harvest level fishery, using set seasons with a 18 inchsize limit restrictions <strong>and</strong> daily l<strong>and</strong>ing limits. The daily limit has ranged from 3 to 20 fish<strong>and</strong> at times could comprise no more than 25% <strong>of</strong> the trip harvest. The striped bassfishery is divided into a spring <strong>and</strong> fall season. During the open season fishermen arerestricted to daily l<strong>and</strong>ing limits <strong>and</strong> minimum size limits. Finfish dealers are required toobtain a striped bass permit, with a Central/Southern validation, report l<strong>and</strong>ings daily toDMF, <strong>and</strong> affix a sale tag to the striped bass when purchased from the fishermen. Thecurrent measures (Table 10.36) have been in place since 1997. Striped bass is atargeted catch in the CSMA. Even with the five fish per operation daily limit, over 30% <strong>of</strong>the gill net trips during the open season were composed primarily <strong>of</strong> striped bass(defined as over 50% <strong>of</strong> the trip ticket)Other management measures have also restricted the take <strong>of</strong> striped bass in theCSMA. The WRC initially (1996) allowed the use <strong>of</strong> a special device license forattended set gill nets in a number <strong>of</strong> inl<strong>and</strong> waters. In 2000 this was no longer permittedin the northern <strong>and</strong> central coastal Districts (Districts 1 & 2) <strong>and</strong> was implemented in allthe coastal areas in 2001 (Districts 3 & 4). Federal rule (50 CFR Part 223.206 ) states“No person may fish with gillnet fishing gear which has a stretched mesh size largerthan 4 1/4 inches, annually from September1 through December 15, in the inshorewaters <strong>of</strong> Pamlico Sound, North Carolina, <strong>and</strong> all contiguous tidal waters bounded onthe north by 35°46.3’ N. lat., on the south by 35°00’ N. lat., <strong>and</strong> on the west by 76°30’W.long.” This closed a major deep water flounder fishery. A Pamlico Sound GillnetRestricted Area permit is issued to fishermen by DMF, under a federal Section 10endangered species permit, that allows for the shallow water Outer Banks <strong>and</strong> mainl<strong>and</strong>Hyde County bays flounder fisheries to continue with gear limits, weekly reporting <strong>and</strong>observer coverage Gill net attendance requirements for small mesh (
Table 10.33.Pamlico Sound set gill net l<strong>and</strong>ings, average for 2000 & 2001, by mesh size for main target species.Large Mesh Small MeshSummer Winter All Summer Winter All Species TotalSpecies Pounds Dollars Pounds Dollars Pounds Dollars Pounds Dollars Pounds Dollars Pounds Dollars Pounds DollarsBait, Menhaden 66 7 618 638 6,204 645 90,983 9,259 334,691 33,881 425,674 43,140 431,877 43,785column % 0.0 0.0 5.2 0.4 1.2 0.1 11.5 2.2 49.5 13.9 29.0 6.6 21.9 3.2Bluefish 11,804 3,234 504 138 12,308 3,371 223,766 57,697 20,120 5,633 243,886 63,330 256,193 66,701column % 3.0 0.6 0.4 0.1 2.4 0.5 28.3 14.0 3.0 2.3 16.6 9.6 13.0 4.8Croaker 4,406 1,174 76 21 4,482 1,194 13,283 3,519 31,214 9,228 44,497 12,747 48,978 13,942column % 1.1 0.2 0.1 0.0 0.9 0.2 1.7 0.9 4.6 3.8 3.0 1.9 2.5 1.0Drum, Red 13,532 15,087 4,944 5,505 18,475 20,592 40,981 45,156 26,168 29,040 67,149 74,197 85,624 94,788column % 3.5 2.6 4.2 3.9 3.6 2.8 5.2 10.9 3.9 11.9 4.6 11.3 4.3 6.9Flounders 317,327 540,208 61,409 106,027 378,736 646,234 39,537 67,110 6,032 10,240 45,569 77,350 424,305 723,584column % 81.6 93.0 51.9 74.5 74.6 89.4 5.0 16.2 0.9 4.2 3.1 11.8 21.5 52.4Hickory Shad 7 2 7,043 1,749 7,049 1,751 982 252 39,253 9,846 40,235 10,098 47,284 11,849column % 0.0 0.0 5.9 1.2 1.4 0.2 0.1 0.1 5.8 4.0 2.7 1.5 2.4 0.9Mackerel, Spanish 415 313 10 8 425 321 119,736 92,250 396 311 120,132 92,561 120,557 92,882column % 0.1 0.1 0.0 0.0 0.1 0.0 15.1 22.3 0.1 0.1 8.2 14.1 6.1 6.7Mullet, Jumping 1,679 788 1,299 604 2,978 1,392 70,816 32,629 46,059 25,539 116,875 58,167 119,852 59,560column % 0.4 0.1 1.1 0.4 0.6 0.2 9.0 7.9 6.8 10.5 8.0 8.9 6.1 4.3Perch, White 124 81 429 242 553 323 947 511 3,419 2,109 4,365 2,620 4,918 2,943column % 0.0 0.0 0.4 0.2 0.1 0.0 0.1 0.1 0.5 0.9 0.3 0.4 0.2 0.2Perch, Yellow 1 1 . . 1 1 5 5 181 176 186 181 187 182column % 0.0 0.0 . . 0.0 0.0 0.0 0.0 0.0 0.1 0.0 0.0 0.0 0.0Shad, American 474 311 10,447 6,852 10,921 7,163 46 29 765 487 810 516 11,731 7,679column % 0.1 0.1 8.8 4.8 2.2 1.0 0.0 0.0 0.1 0.2 0.1 0.1 0.6 0.6Trout, Grey 4,388 2,528 3,080 1,752 7,468 4,280 35,707 20,699 65,474 38,190 101,181 58,889 108,649 63,169column % 1.1 0.4 2.6 1.2 1.5 0.6 4.5 5.0 9.7 15.7 6.9 9.0 5.5 4.6Trout, Spotted 2,354 2,954 3,765 4,778 6,120 7,732 7,544 9,584 37,873 48,302 45,416 57,886 51,536 65,618column % 0.6 0.5 3.2 3.4 1.2 1.1 1.0 2.3 5.6 19.9 3.1 8.8 2.6 4.8Spot 3,568 1,478 271 112 3,839 1,590 37,271 15,437 7,250 3,005 44,521 18,442 48,360 20,032column % 0.9 0.3 0.2 0.1 0.8 0.2 4.7 3.7 1.1 1.2 3.0 2.8 2.4 1.5Striped Bass 95 118 8,216 10,065 8,310 10,183 15 17 138 159 153 175 8,463 10,358column % 0.0 0.0 6.9 7.1 1.6 1.4 0.0 0.0 0.0 0.1 0.0 0.0 0.4 0.8Striped Bass, Discard 1,263 6,157 7,420 14,083 13,589 27,672 35,09255 Additional Sp. 28,691 12,406 16,310 3,803 39,482 16,212 109,412 59,269 57,175 27,141 166,590 86,411 206,076 102,623column % 7.4 2.1 13.8 2.7 7.8 2.2 13.8 14.3 8.5 11.2 11.4 13.2 10.4 7.4Area Total 388,931 580,690 118,421 142,294 507,351 722,984 791,031 413,423 676,208 243,287 1,467,239 656,710 1,974,590 1,379,695278
Table 10.34.Rivers (Pamlico, Pungo, Bay <strong>and</strong> Neuse) set gill net l<strong>and</strong>ings, average for 2000 & 2001, by mesh size for main target species.Large MeshSmall MeshSummer Winter All Summer Winter All Species TotalSpecies Pounds Dollars Pounds Dollars Pounds Dollars Pounds Dollars Pounds Dollars Pounds Dollars Pounds DollarsBait, Menhaden 1,035 114 2,162 220 3,197 333 13,998 1,414 59,426 6,030 73,424 7,444 76,620 7,777column % 0.4 0.0 2.0 0.2 0.9 0.1 5.7 1.1 19.8 3.8 13.4 2.6 8.6 1.0Bluefish 1,055 281 53 14 1,108 295 6,273 1,585 78 19 6,351 1,604 7,459 1,899column % 0.4 0.1 0.0 0.0 0.3 0.1 2.6 1.2 0.0 0.0 1.2 0.6 0.8 0.2Croaker 3,898 982 115 33 4,013 1,015 2,802 699 35 10 2,837 708 6,850 1,723column % 1.6 0.3 0.1 0.0 1.2 0.2 1.1 0.5 0.0 0.0 0.5 0.2 0.8 0.2Drum, Red 6,630 7,398 3,132 3,450 9,762 10,848 2,409 2,669 3,841 4,250 6,250 6,919 16,012 17,767column % 2.8 2.0 2.9 3.1 2.8 2.3 1.0 2.0 1.3 2.7 1.1 2.4 1.8 2.3Flounders 208,421 344,778 36,024 59,062 244,445 403,841 11,161 18,408 3,937 6,442 15,099 24,850 259,543 428,691column % 87.9 95.1 33.1 53.8 70.6 85.5 4.5 13.9 1.3 4.1 2.8 8.5 29.1 56.2Hickory Shad 8 2 7,760 2,044 7,768 2,045 300 73 21,588 5,979 21,888 6,053 29,656 8,098column % 0.0 0.0 7.1 1.9 2.2 0.4 0.1 0.1 7.2 3.8 4.0 2.1 3.3 1.1Mackerel, Spanish 439 335 4 3 443 337 34,896 27,085 4 3 34,900 27,088 35,343 27,425column % 0.2 0.1 0.0 0.0 0.1 0.1 14.2 20.4 0.0 0.0 6.4 9.3 4.0 3.6Mullet, Jumping 1,554 625 4,330 1,749 5,884 2,374 145,803 65,756 132,025 56,131 277,828 121,887 283,712 124,261column % 0.7 0.2 4.0 1.6 1.7 0.5 59.4 49.5 44.0 35.5 50.9 41.9 31.8 16.3Perch, White 68 37 1,458 817 1,526 854 2,400 1,374 9,578 5,807 11,979 7,181 13,504 8,034column % 0.0 0.0 1.3 0.7 0.4 0.2 0.1 1.0 3.2 3.7 2.2 2.5 1.5 1.1Perch, Yellow 25 26 390 393 414 419 597 616 1,152 1,169 1,748 1,785 2,163 2,204column % 0.0 0.0 0.4 0.4 0.1 0.1 0.2 0.5 0.4 0.7 0.3 0.6 0.2 0.3Shad, American 623 421 22,665 15,519 23,288 15,940 32 22 433 268 465 290 23,753 16,230column % 0.3 0.1 20.8 14.1 6.7 3.4 0.0 0.0 0.1 0.2 0.1 0.1 2.7 2.1Trout, Grey 2,220 1,199 1,047 548 3,267 1,748 1,687 928 2,747 1,453 4,434 2,380 7,702 4,128column % 0.9 0.3 1.0 0.5 0.9 0.4 0.7 0.7 0.9 0.9 0.8 0.8 0.9 0.5Trout, Spotted 2,269 2,904 1,905 2,337 4,174 5,241 3,430 4,344 54,590 66,854 58,020 71,198 62,194 76,439column % 1.0 0.8 1.7 2.1 1.2 1.1 1.4 3.3 18.2 42.3 10.6 24.5 7.0 10.0Spot 1,046 436 170 70 1,215 505 10,992 4,554 751 314 11,743 4,868 12,959 5,373column % 0.4 0.1 0.2 0.1 0.4 0.1 4.5 3.4 0.3 0.2 2.2 1.7 1.5 0.7Striped Bass 9 10 17,702 20,662 17,711 20,672 . . 327 385 327 385 18,038 21,058column % 0.0 0.0 16.2 18.8 5.1 4.4 . . 0.1 0.2 0.1 0.1 2.0 2.8Striped Bass, 41,871 6,387 48,258 7,734 3,286 11,020 59,278Discard22 Additional Sp. 7,822 2,873 10,076 2,859 17,900 5,734 8,834 3,295 9,857 2,783 18,690 6,079 36,590 11,813column % 3.3 0.8 9.2 2.6 5.2 1.2 3.6 2.5 3.3 1.8 3.4 2.1 4.1 1.5Area Total 237,122 362,421 108,993 109,780 346,115 472,201 245,614 132,822 300,369 157,897 545,983 290,719 892,098 762,920279
Table 10.35. Number <strong>of</strong> set gill net fishermen who had at least 10 trips annually, average years 2000 & 2001.<strong>Fishery</strong> Season Number <strong>of</strong> FishermenPam Sd Large Winter 49Spring /Summer. 146Non-duplicative Total 182Pam Sd Small Winter 101Spring /Summer 151Non-duplicative Total 188Pamlico Sound All Non-duplicative Total 274Rivers Large Winter 70Spring /Summer 112Non-duplicative Total 151Rivers Small Winter 54Spring /Summer 48Non-duplicative Total 92Rivers All Non-duplicative Total 203were first instituted in Pamlico <strong>and</strong> Neuse rivers by proclamation in 1995. Exp<strong>and</strong>edattendance requirements are now in rule from the red drum FMP for the state (15A<strong>NC</strong>AC 03J.0103). Year round attendance is required in the upper portions <strong>of</strong> the rivers<strong>and</strong> within 200 yards <strong>of</strong> shore in the lower rivers. From May 1 through October 31 smallmesh nets must be attended in all primary <strong>and</strong> permanent secondary nursery areas, notrawl areas, <strong>and</strong> in a largearea along Outer <strong>and</strong> Core Banks. This measure has reduced the amount <strong>of</strong> smallmesh effort in these areas.Current AuthorityGeneral Statutes <strong>of</strong> North CarolinaG.S. 113-170.4 Rules as to possession, transportation, <strong>and</strong> disposition <strong>of</strong> fisheriesresourcesG.S. 113-170.5 Violations with respect to coastal fisheries resourcesG.S. 113-182 Regulation <strong>of</strong> fishing <strong>and</strong> fisheriesG.S. 113-221(e) Rules; proclamations; emergency Commission meetingsG.S. 143B-289.52 Marine Fisheries Commission – powers <strong>and</strong> authorityNorth Carolina Marine Fisheries Commission RulesNorth Carolina Fisheries Rules for Coastal Waters (15A <strong>NC</strong>AC)3H .0103 Proclamation Authority <strong>of</strong> Fisheries Director3J .0103 Gill Nets, Seines, Identification, Restrictions3Q .0107 Special Rules, Joint Waters3M .0202 Striped Bass Season, Size <strong>and</strong> Harvest Limit Internal Coastal Waters280
Table 10.36. Striped bass commercial season in CSMA, 2001 & 2002.L<strong>and</strong>ings from Permit Quota MonitoringYear/Season Proclamation AreasOpenedDateOpenedDateClosedTotalDaysCreelLimitOtherRestrictionPamlicoSoundWesternPamlicoSoundTributariesCarteretCountyCapeFearTotal2001Spring FF-01-01 Cape FearRiver01-08-01 04-30-01 113 10/day Dealer permit<strong>and</strong> tagsrequiredFF-23-01Carteret,Craven, Bft,Pamlicocounties;Pamlico,Pungo <strong>and</strong>White Oakrivers, Jones<strong>and</strong> Westbays,PamlicoSound02-12-01 03-02-01(FF-27-01)03-14-01(FF-29-01)19315/dayDealer permit<strong>and</strong> tagsrequired8,637 11,966 7 129 20,739Fall FF-56-01 Carteret,Craven,Beauft,Pamlicocounties;Pamlico,Pungo <strong>and</strong>White Oakrivers12-04-01 12-14-01(FF-71-01)11 5/day Dealer permit<strong>and</strong> tagsrequired(184) 3,911 83 - 3,9942001 TOTAL (8,821) 15,877 90 129 24,733281
Table 10.36. (Continued)Year/SeasonProclamationAreasOpenedDateOpenedDateClosedTotalDaysCreelLimitOtherRestrictionPamlicoSoundWesternPamlicoSoundTributariesCarteretCountyCapeFearTotal2002Spring FF-76-01 Cape FearRiver01-07-01 04-30-01 114 10/day Dealerpermit <strong>and</strong>tagsrequiredFF-16-02Carteret,Craven, Bft,Pamlicocounties;Pamlico,Pungo <strong>and</strong>White Oakrivers, Jones<strong>and</strong> Westbays,PamlicoSound02-25-02 03-16-02(FF-23-02)20 5/day DealerPermit <strong>and</strong>TagsRequired8,301 9,295 1,937 156 19,689Fall FF-49-02 Carteret,Craven,Beauft,Pamlicocounties;Pamlico,Pungo <strong>and</strong>White Oakrivers12-02-02 12-13-02(FF-60-02)12 5/day Dealerpermit <strong>and</strong>tagsrequired2002TOTAL(60) 1,998 7,452(Oceanfish)- 9,5108,361 11,293 9,389 156 29,199282
MethodsDiscard (dead) Estimate for CSMAAn estimate <strong>of</strong> the discarded catch for a gear may be computed by estimating the "totalcatch" (quantity taken that reaches the deck <strong>of</strong> the fishing vessel) <strong>and</strong> subtracting from itthe “l<strong>and</strong>ed catch” (that which is brought ashore). The discarded catch may then bemultiplied by a mortality estimate (percent that are dead at the time <strong>of</strong> harvest) to givean estimate <strong>of</strong> the quantity <strong>of</strong> dead discard. Since the DMF does not have acomprehensive onboard observer program, the total catch must be estimated. Thefollowing table shows the matrix <strong>of</strong> Division data that were used to calculate a discard(dead) estimate for the set net gill net fishery in Pamlico Sound <strong>and</strong> the Pamlico, Pungo,Bay, <strong>and</strong> Neuse rivers Similar data for other areas in the CSMA are not available.Data sources used for the discard estimate <strong>of</strong> striped bass in set gill nets.Var Trips Harvest<strong>of</strong> stripedbassSourceAreaMeshCaveatTripTicketTripTicketPamlico Sound(code 34), Rivers(29,3,33,52)’Large based on>30% fldr, or >5%shad or rock on theticket, elsemesh=smallYardsfishedaverageFishHouseSamplesSoak time(hours)averageFishHouseSamples0500 to052799=Sound,0528 to 053530=RiversFrom interview withfishermen, large >=5inch <strong>and</strong> small = 5 in. in the deep strata (gt6 feet) set parallel to shore, <strong>and</strong>also shallow sets in months 10 &11. Small CPUE based on netmesh sets 3.0 to 4.5 in. in theshallow strataMortalityestimate(percentdead attime fished)DMFSurveysSame as
ResultsA summary <strong>of</strong> the average gill net yardage, soak time <strong>and</strong> number <strong>of</strong> trips is given inTable 10.37. For the four different fishery components the small mesh netsranged in yardage from 440 to 820, in number <strong>of</strong> trips from 858 to 3,489, <strong>and</strong> in soaktime from 12.0 to 23.7 hours. The large mesh nets ranged in yardage from 952 to 1,423,in number <strong>of</strong> trips from 886 to 3,632, <strong>and</strong> in soak time from 17.1 to 24.2 hours. Thediscard (dead) estimate was 94,370 pounds (Table 10.33). While this estimate is basedon the best available data, it is only intended to provide a starting point for discussion.The estimate should not be taken as absolute due to a number <strong>of</strong> limitations in theTable 10.37. Set gill net parameters <strong>and</strong> number <strong>of</strong> commercial trips, average years 2000 & 2001.<strong>Fishery</strong> Season Mean YardsMean SoakHours TripsPam Sd Large Winter 1,314 24.4 886Spring/Summer 1,423 20.8 3,632Pam Sd Small Winter 1,262 23.7 2,315Spring/Summer 820 15.4 3,489Rivers Large Winter 952 17.1 1,492Spring/Summer 1,121 24.1 2,951Rivers Small Winter 440 12.0 959Spring/Summer 540 12.0 858Total or Overall Mean 984 18.7 16,582fishing techniques between the Division IGN survey <strong>and</strong> the commercial fishery. Themost appropriate subset <strong>of</strong> IGN data was used to mirror commercial practices but thesenets are float nets <strong>and</strong> fish more <strong>of</strong> the water column than the tied-down commercialnets. Thus, the IGN catch rate <strong>of</strong> striped bass will be higher. Better estimates will onlybe possible with observer coverage for all components <strong>of</strong> the fishery.The size distribution <strong>of</strong> the striped bass taken in the IGN survey are shown in Figures10.32 <strong>and</strong> 10.33. The distribution indicates the size range that is available for harvest.Also shown is the l<strong>and</strong>ed catch size distribution for comparison. The commercial fisheryis harvesting striped bass mainly in the 18” to 25” total length range.DiscussionIn November 1991 the North Carolina Marine Fisheries Commission adopted a policydirecting the DMF to establish the goal <strong>of</strong> reducing bycatch to the absolute minimum<strong>and</strong> incorporate that goal into its actions. The general reasons for a species to bediscarded can be categorized as follows (1) physical-biological interaction, (2)economic, (3) legal, <strong>and</strong> (4) personal value considerations. In the case for NorthCarolina striped bass, the commercial discard is due primarily to the currentmanagement measures in place (legal). In looking at ways to reduce discard there are284
Percent4035302520151050Pamlico SoundIndependent gill net samples n=101Fish house samples n=14810121416283032343638401820222426Total length (inches)Figure 10.32. Pamlico Sound striped bass length distribution from independent gill netsampling <strong>and</strong> from samples <strong>of</strong> the commercial harvest.403530RiversIndependent gill net samples n=261Fish house samples n=147Percent25201510508101228303234363814161820222426Total length (inches)Figure 10.33. Striped bass length distribution from independent gill net sampling<strong>and</strong> from sampling <strong>of</strong> the commercial harvest in the rivers.285
just three basic ways to accomplish it (Alverson et al. 1994)• Catch fewer number <strong>of</strong> the individuals/species.• Reduce the mortality <strong>of</strong> the individuals/species being discarded.• Use a greater spectrum <strong>of</strong> the species or sizes <strong>of</strong> species normally caught <strong>and</strong>discarded.Gear restrictions (mesh sizes, yardage limits, <strong>and</strong> attendance) <strong>and</strong> area (includingdistance set from shore) <strong>and</strong> season closures have been used to limit discard losses ina number <strong>of</strong> North Carolina fisheries. Other regulation based solutions such as effortreduction <strong>and</strong> incentive/disincentive programs have not been initiated.<strong>Management</strong> Options1. Status quo. No changes to gillnet restrictions+ Ease <strong>of</strong> implementation+ No disruption <strong>of</strong> existing fisheries+ No disruption <strong>of</strong> fishing practices+ No costs from gear modifications- Continued overharvest- Continued discard losses2. Restrict allowable gillnet yardage.+ Would reduce total effort in some cases+ Would reduce harvest <strong>and</strong> discard losses- \ May disrupt other fisheries- Appropriate measures difficult to quantify due to lack <strong>of</strong> on-water observer data3. Restrict use <strong>of</strong> 4 – 4 ½” gill net meshThis mesh is widely used in the Pamlico Sound for a variety <strong>of</strong> fisheries. There islittle information available to use in judging the impacts <strong>of</strong> restricting this size meshin the CSMA.+ Reduced interactions with striped bass- Overall impacts to Central-Southern fisheries is unknown.- Current net attendance rules already provides a discard reduction- Unforeseen circumstances (i.e., switching to other size mesh) could creatediscard problems in other fisheries or with protected <strong>and</strong> endangered species4. Increase net attendance requirements.Currently gillnets with mesh less than 5” must be attended at all times in theupriver sections <strong>of</strong> the Pamlico, Pungo, Neuse, <strong>and</strong> Trent rivers, <strong>and</strong> when within200 yards <strong>of</strong> the shoreline in the down river sections. (15A <strong>NC</strong>AC 03J.0103.g).+ Increasing the attendance requirements may reduce overall effort- Additional burden on fishing operations- Most <strong>of</strong> the areas in the Tar <strong>and</strong> Neuse Rivers already require attendance- Difficult to evaluate discard reductions achieved from attendance requirements,especially without adequate information on current discard rates.5. Require net ‘tie-downs’286
Tie-down requirements could be developed for certain times <strong>of</strong> the year (e.g.,when closed to striped bass harvest), <strong>and</strong> for certain areas <strong>of</strong> the CSMA (e.g.,portions <strong>of</strong> the rivers)+ May reduce striped bass interactions <strong>and</strong> thus reduce bycatch- Likely to increase sea turtle interactions <strong>and</strong> especially deaths if required in theSound.- May be infeasible in some areas due to tide intensity6. Remove gill nets as an allowable gear+ Would allow current bycatch mortality to be converted to harvest for otherfisheries- Would result in gill net fishermen having to seek alternative gearsResearch Needs1. More at-sea observations made for the gill net fishery to more accurately assessthe discards from fishery.+ Allows for a more accurate account <strong>of</strong> the unmarketable bycatch <strong>and</strong> a fullerassessment <strong>of</strong> what is being caught- Increases burden on fishermen to have extra people on board their vessels- High cost <strong>of</strong> running a survey2. Improvement <strong>of</strong> trip ticket data to collect gear parameters (yardage, mesh size,etc.).+ Allow gathering <strong>of</strong> information that could be used for calculations <strong>of</strong> total yardsfished in a fishery <strong>and</strong> CPUE for species- Increases the amount <strong>of</strong> time for filling out trip tickets- Increases work load for Trip Ticket staff3. Further investigate the impacts <strong>of</strong> delayed mortality on striped bass captured in gillnets.+ Gives a more complete picture <strong>of</strong> the total losses to the striped basspopulation- Number <strong>of</strong> delayed mortalities may impact the number <strong>of</strong> striped bassthat could be harvestedDMF, WRC, <strong>and</strong> FWS <strong>Management</strong> RecommendationThe only preferred additional management measure is to require ‘tie downs’ to reducestriped bass bycatch. The DMF is currently evaluating the effectiveness <strong>of</strong> various tiedown configurations at reducing striped bass bycatch. Proposed action1. Rivers Increase the commercial possession limit to 10 fish per day percommercial fishing operation holder in the rivers during the open striped bassseason. Require that gill nets in the shad <strong>and</strong> flounder fisheries operating in thePamlico, Pungo <strong>and</strong> Neuse river areas (west <strong>of</strong> 76° 30’ W long.) be tied downafter the striped bass quota is reached <strong>and</strong> the season closed.Pamlico Sound The commercial possession limit would remain at five fish in thePamlico Sound. Striped bass will be limited to 50% by weight <strong>of</strong> the total catch,not to exceed five fish per day per fishing operation. Gill nets with a mesh length287
<strong>of</strong> 6 inches (stretched mesh) <strong>and</strong> greater would be prohibited during the stripedbass season.This option is intended to shorten the “directed” striped bass harvest season <strong>and</strong>impose the tie down provisions to reduce striped bass bycatch after the seasoncloses. This option will be most effective if the tie down provisions essentiallyeliminate striped bass interactions. Requiring the 50% weight provisions <strong>and</strong>prohibiting large mesh gill nets in Pamlico Sound will eliminate the directedfishery.2. In the remaining portions <strong>of</strong> the CSMA continue the commercialstriped bass seasons, opening <strong>and</strong> closing through proclamation <strong>and</strong> operatingunder the TAC. This option is intended to allow bycatch <strong>of</strong> striped bass from gillnet fisheries. As data are collected, more restrictive measures will beimplemented as needed.MFC <strong>Management</strong> RecommendationSupport the agencies recommendation with the following modification to 2. As data arecollected, measures may be implemented as needed,C/S Advisory Committee <strong>Management</strong> RecommendationThe following motions were approved for the CSMA commercial fishery:Pamlico Sound, Pamlico <strong>and</strong> Neuse SystemsJanuary 1 to April 15 (shad season) allow a 10 fish striped bass commercial possessionlimit until the quota is reached, once the quota is reached then require large mesh setnets to be tied down till 15 April. (Passed 5 to 4)Require large mesh set nets to be tied down from April 15 to December 31 (for areasthat will not conflict with sea turtles). (Passed 5 to 4). Prohibit the use <strong>of</strong> gill nets with amesh 6 ISM <strong>and</strong> larger in Pamlico Sound during the open striped bass season.Support management <strong>of</strong> remaining portions <strong>of</strong> the CSMA at Status Quo.Endorsed the three research needs stated in regards to commercial discards.EVALUATION OF CSMA STRIPED BASS DISCARD REDUCTION OPTIONSMAY 12, 2003Optimum Yield (OY)As noted in the stock status section <strong>of</strong> the draft FMP, “Optimum yield is defined as thatyield provided by exploiting the stock at the target exploitation rate.” In the CSMA, OYcan not be estimated numerically as an annual poundage figure (e.g.Total AllowableCatch = 550,00 pounds) as is done in the ASMA. A quantitative stock assessment forthe CSMA was not possible due “to the lack <strong>of</strong> accurate data on l<strong>and</strong>ings <strong>and</strong> discardingfrom the recreational fishery, discarding from the commercial fishery, <strong>and</strong> length <strong>and</strong>288
age composition <strong>of</strong> the catch.” Instead a simple catch curve analysis was used toestimate fishing mortality rates (F) for the Tar/Pamlico <strong>and</strong> Neuse rivers (a 53% annualremoval rate in the Neuse <strong>and</strong> a 60% rate in the Tar/Pamlico). By comparing theseestimated annual rates to the designated target <strong>and</strong> threshold exploitation levels, it wasdetermined that fishing mortality should be reduced by 61% in the Neuse <strong>and</strong> 66% inthe Tar/Pamlico to prevent overfishing.Since accurate data on the various fishery components (recreational harvest,recreational discard, <strong>and</strong> commercial discard) are not known, then the contribution <strong>of</strong>these components to the overfishing problem is also unknown <strong>and</strong> subject tospeculation. In the same manner, the potential reduction in F from the variousmanagement options is not quantifiable because in most cases there is not aquantifiable value to use as a starting point. For example the amount the 4 to 4.5 inchmesh gill nets contribute to the striped bass discard quantity is not known, much lesswhat portion the commercial discard makes up <strong>of</strong> the overall take <strong>of</strong> striped bass(another unknown quantity).Data NeedsAs stated many times to the Advisory Committee <strong>and</strong> as noted in the CSMA CatchCurve Analysis Issue Paper quantitative assessments <strong>of</strong> Tar <strong>and</strong> Neuse River stripedbass populations are needed. However, “significant additional data are required toenable a thorough assessment <strong>of</strong> CSMA stocks. Information currently available includescommercial l<strong>and</strong>ings <strong>and</strong> associated biological characteristics, age structured surveys<strong>of</strong> Tar <strong>and</strong> Neuse spawning populations, limited migration <strong>and</strong> movement informationfrom tag recoveries <strong>of</strong> stocked fish, <strong>and</strong> limited stock mixing from ASMA taggingprograms <strong>and</strong> tagged stocked fish in the Tar <strong>and</strong> Neuse Rivers.DATA NEEDS <strong>and</strong> POTENTIAL SOURCES1. Complete l<strong>and</strong>ings statistics for recreational fisheries (Creel Survey)2. Biological characteristics <strong>of</strong> recreational fisheries (length, weight, age, sex)(Creel Samples)3. Discard estimates for recreational fisheries harvest <strong>and</strong> catch (Creel Survey)4. Biological characteristics <strong>of</strong> recreational discard (Angler logs or Independentsurvey)5. Biological characteristics <strong>of</strong> commercial catch, including length, age, weight, sex(increased sampling, age structure collection)6. Discard estimates from commercial fisheries (Trip level observer coverage)7. Exp<strong>and</strong>ed survey coverage, including juvenile abundance <strong>and</strong> populationabundance in the Sounds <strong>and</strong> lower Rivers (New or exp<strong>and</strong>ed surveys)8. Increased external tagging <strong>of</strong> stocked fish (Additional tagging effort)9. Comprehensive tagging <strong>of</strong> wild fish, including estimation <strong>of</strong> reporting rates (NewProgram)10. Life history information maturity; fecundity; size <strong>and</strong> weight at age; egg <strong>and</strong> larvalsurvival (Short term research projects; Federal aid/Universities)”.289
Consensus <strong>Management</strong>While data are lacking <strong>and</strong> DMF is not able to provide quantitative evaluations <strong>of</strong> many<strong>of</strong> the management options, this does not negate the use <strong>of</strong> a management approachwhich is based on instituting first h<strong>and</strong> experience <strong>and</strong> common sense measures thatmost individuals would agree would produce reductions in F. These “consensus based”measures would be put in place <strong>and</strong> data collection programs implemented that in timewould be able to produce the data needed to measure the anticipated improvement inF. A starting point may be provided based on the information at h<strong>and</strong> <strong>and</strong> using some <strong>of</strong>the simplifying assumptions for relating exploitations, current l<strong>and</strong>ings, <strong>and</strong> currentregulations. The example given in the stock status section helps to illustrate this “If afishery is regulated with a 10 fish possession limit <strong>and</strong> it is assumed that most trips l<strong>and</strong>at that limit, the possession limit would need to be reduced to 5 fish to achieve a 50%reduction. If instead it is assumed that most trips only l<strong>and</strong> 6 fish, then achieving the50% reduction would require reducing the possession limit to 3 fish.”Table 10.38 gives a qualitative evaluation <strong>of</strong> the discard management options <strong>and</strong>provides the rationale used for the evaluation.The goal <strong>of</strong> the FMP process is to develop plans that ensure the long-term viability <strong>of</strong>the State's commercially <strong>and</strong> recreationally significant species or fisheries. The FMPmanagement measures should prevent overfishing, while achieving, on a continuingbasis, the optimal yield from each fishery. The degree to which the Commissionapproved CSMA measures for striped bass will achieve this, will only be determinedupon the successful implementation <strong>of</strong> new data collection programs.Table 10.38. Striped Bass Discard from Set Gill Nets <strong>Management</strong> Options EvaluationMeasureFishingMortalityReductionPotentialGear YardageEstablish ayardage limit onlarge mesh nets-In the SouthernFlounder FMPDMF recommends3000 yds perperson(closed seasonpartial November<strong>and</strong> December).-CSMA ACsuggested 2500ydsGear MeshCSMA suggest prohibituse <strong>of</strong> nets <strong>of</strong> stretchmesh size 4 to 5.5 inthe rivers.This should not includedrop or drift nets.GearAttendanceStatus QuoGear Tie DownRequire large meshnets to be tied downin the RiversYear round, whenquota met orselected months.See Figures 1-3If increasepossession to 10fish, quota reachedfaster <strong>and</strong> tie downsin effect sooner thanat 5 fish levelGear Areas/Seasons-Prohibit largemesh nets in theRivers duringJanuary throughMarch or-Prohibit the use<strong>of</strong> large mesh netswithin 200 yards<strong>of</strong> shore duringJanuary throughMarch in theRivers.None Minimal None Substantial SubstantialGear YardageGear MeshGearAttendanceGear Tie DownGear Areas/Seasons290
Table 10.38. (Cotinued)RationalOtherPros(or Cons)LimitationsGear Yardage-Places a cap onwhat could befished in therivers, eventhough thesuggested limitsare greater thanthe averageyardage now set (See Table 4 inCommercialDiscard IssuePaper, )-Might benefitother stocks likeflounder-if increasenumber <strong>of</strong>possession fishthen caps settingmore net to targetstriped bass-Does not reduceeffort or harvest toany extent-May disrupt otherfisheriesGear Mesh-Current netattendance measuresaddress the 3 to 5”mesh discard in therivers where it is mostprevalent, <strong>and</strong> thushas already provided asignificant reduction indiscard. Fishermen nolonger set so effort <strong>and</strong>thus striped bassinteraction reduced.Would significantlyreduce the hickoryshad fishery, whichwould reduce F for thatfishery.Rivers only because anumber <strong>of</strong>economically importantsound fisheries usethis size webbing(Spanish, bluefish, <strong>and</strong>speckled trout). Ifsimilar fisheries inrivers then they will beimpacted.These mesh sizes dotake some legal sizedstriped bass -seeTable 2.GearAttendanceCurrent netattendancemeasures arein the mostappropriateareas <strong>and</strong>seasons toaddress thebulk <strong>of</strong> thesmall meshdiscards.No additionalburden onfishermenGear Tie Down-DMF conducting astudy to quantifypossible reduction,ASMA has shownthis measure to beeffective.-Can only be done inthe Rivers because<strong>of</strong> potentialinteraction with seaturtles in the Sound-Some upper riverfishermen alreadyuse tie downs-If year round willeliminate the shadfishery, See table 3.-May increase gearinteraction with otherspecies-May be a problem ifimplemented in tidalareas or problemswith grasses-Causes changes toexisting gear; extratime <strong>and</strong> effort onfishermenGear Areas/Seasons-With no netseliminates discardfrom large meshnets during thistime frame-With a shorerestriction, lessensinteraction withstriped bass.Spring fisherywould becomemore <strong>of</strong> a“bycatch” fishery-Would eliminatethe spring shadfishery in theRivers See Table3-Does not addressflounder netdiscards duringthe remainder <strong>of</strong>the yearTable 10.39.Striped bass average total length (TL) by stretch mesh size, Albemarle SoundIndependent Gill Net program, 2000 <strong>and</strong> 2001 combined.Stretch MeshMean TL(Inches)Minimum(Inches)Maximum(Inches)2.5 inch 11.9 07 213.0 inch 14.7 10 223.5 inch 16.5 10 234.0 inch 17.3 12 234.5 inch 18.3 10 225.0 inch 19.5 15 245.5 inch 20.8 15 296.0 inch 22.6 17 276.5 inch 23.5 17 27291
Table 10.40. Commercial l<strong>and</strong>ings <strong>and</strong> value <strong>of</strong> American shad in North Carolina, 1972-2002.L<strong>and</strong>ingsState TotalYear Atlantic Ocean Albemarle Sound Area Cape Fear River Neuse River Pamlico River Pamlico Sound Other Areas Lb. $1972 -- 130,399 66,968 81,715 92,799 92,069 4,534 468,484 111,6091973 -- 80,770 32,120 69,526 30,300 105,237 3,047 321,000 85,4911974 -- 116,502 20,219 61,091 32,167 132,926 5,928 368,833 105,6681975 -- 87,063 22,949 27,764 34,157 69,307 0 241,240 82,8151976 1,547 78,301 7,288 34,161 32,150 13,743 0 167,190 65,2271977 -- 79,594 16,106 6,144 13,432 3,171 2,575 121,022 54,7641978 5,000 158,908 32,999 31,726 40,908 124,243 8,233 402,017 144,9861979 25,064 85,158 52,104 31,611 10,971 69,486 3,676 278,070 121,6621980 3,943 68,695 45,486 11,615 6,430 44,564 18,473 199,206 88,1121981 107,415 66,732 52,911 15,549 9,761 97,106 2,026 351,500 189,7931982 63,979 118,794 78,184 18,129 5,080 122,898 4,788 411,852 183,4831983 3,788 216,058 65,728 45,378 53,794 58,324 2,809 445,879 187,3601984 13,511 227,308 69,040 70,305 108,410 85,177 10,552 584,843 241,0091985 3,159 148,555 17,788 56,620 40,675 52,607 10,235 329,639 152,5471986 63,085 120,367 37,048 70,880 18,138 49,357 14,919 373,794 228,8191987 41,162 149,923 14,003 47,117 22,640 50,168 2,633 327,646 215,1151988 50,088 128,061 5,266 15,110 46,607 33,485 4,433 283,050 171,9621989 38,548 208,807 12,719 13,452 17,012 27,158 5,700 323,396 214,8961990 37,064 214,954 26,519 11,543 6,520 14,803 2,147 313,550 170,1611991 19,217 209,900 30,040 2,860 2,568 9,827 2,095 276,507 221,8801992 23,956 131,499 44,250 13,808 14,231 8,546 2,872 239,162 194,6291993 28,122 73,631 62,278 8,538 3,033 3,102 86 278,790 149,7391994 33,895 49,713 10,871 7,216 4,039 4,944 297 110,975 95,7031995** 102,984 60,953 11,180 15,311 9,573 5,232 634 205,867 188,5411996** 58,167 65,953 26,818 24,439 8,672 9,115 5,969 199,133 171,6251997** 98,312 63,736 15,584 17,154 8,985 12,126 3,633 219,530 149,2031998** 118,017 168,444 11,144 11,715 11,698 5,008 1,533 327,559 233,7611999** 32,970 70,071 6,804 7,719 6,920 6,054 1,083 131,621 108,1422000** 110,907 129,584 11,098 9,220 14,671 15,814 6,593 297,887 212,9292001** 11,839 95,005 12,583 10,674 6,417 9,788 4,779 151,085 108,5362002** 8,377 175,103 19,185 40,176 14,973 13,902 2,942 274,658**Closed season April 15-January 1292
Information paper on the gill net tie down study in the Central/Southern<strong>Management</strong> AreaMay 12, 2003IssueComparison <strong>of</strong> striped bass captured in gill nets with tie downs <strong>and</strong> without tie downs.Project Objectives(1) To determine differences in catch rates <strong>of</strong> project target species between gill netswith <strong>and</strong> without tie downs(2) To determine the difference in catch rates <strong>of</strong> project target species between netswith different tie down heightsBackgroundThe gill net fishery <strong>of</strong> North Carolina is a multi-species fishery that operates year aroundaccording to the seasonality <strong>of</strong> commercially marketable species. This fishery variesconsiderably by area regarding the type <strong>of</strong> netting used <strong>and</strong> species targeted. In theriver systems a large mesh float gill net fishery occurs in the early spring (February <strong>and</strong>March) for American shad (Alosa sapidissima). This coincides with other anadromousruns for species such as striped bass.Striped bass in the Central/Southern <strong>Management</strong> Area (CSMA) are managed by a sizelimit, a commercial quota (25,000 pounds), <strong>and</strong> recreational creel limits. The draft <strong>NC</strong>Estuarine Striped Bass FMP has determined that the CSMA stocks are overfished. Amanagement measure employed in the Albemarle Sound <strong>Management</strong> Area (ASMA) isthe requirement for 4-foot tie downs in certain gill net fisheries. The impact <strong>of</strong> a tie downrequirement in the rivers <strong>of</strong> the CSMA need to be quantified, as well as to determine themost effective tie down height.Study SiteThe study started on February 14, 2003 <strong>and</strong> is ongoing with nets set at locations in thePamlico, Pungo, <strong>and</strong> Neuse rivers (Figure 10.34). Sampling areas are selected wherethe project target species, shad <strong>and</strong> striped bass, are commonly caught by gill nets.Sampling locations are changed as needed to reflect seasonal/area fishing practices<strong>and</strong> to capture both project target species. Selections <strong>of</strong> fishing days were based on fishabundance <strong>and</strong> sampling conditions. Samples are obtained in a manner to closelyresemble commercial fishing practices.Description <strong>of</strong> Tie Down & Float Gill NetsTarget species <strong>of</strong> the study are commonly caught by gill nets set parallel to the shore.Four control <strong>and</strong> four test nets <strong>of</strong> varying tie down heights were set (Table 10.41). Tiedown heights <strong>of</strong> 2’, 2.5’, 3’, <strong>and</strong> 4’ were tested on each sampling day. Each float netwithout a tie down is 100 yds. long by 12 ft deep. Each sink net with a tie down is 100293
Pamlico RiverFigure 10.34. Sampling locations for the tie down gill net study from February 14 – April 30,2003.294
Neuse RiverFigure 10.34.(Continued)295
Pungo RiverFigure 10.34. (Continued)296
Table 10.41.Gill net configurations for the tie down study.Net #Net typeStretchmeshsize(in)Net length(yds)Net height(ft)Mesh depthTwinediameter(mm)1 Control-float 5 1/2 100 12.0 30 0.332 Control-float 5 1/2 100 12.0 30 0.333 Control-float 5 1/2 100 12.0 30 0.334 Control-float 5 1/2 100 12.0 30 0.335Tie downsink5 1/2 100 2.0 20 0.336Tie downsink5 1/2 100 2.5 20 0.337Tie downsink5 1/2 100 3.0 20 0.338Tie downsink5 1/2 100 4.0 20 0.33yds by 8 ft deep. All nets were constructed <strong>of</strong> number 104 (0.33 mm) diametermon<strong>of</strong>ilament webbing hung on a 1 to 2 ratio <strong>and</strong> are a 5 1/2-inch stretched mesh. Eachnet is inspected for damage upon retrieval. Damage to each net is maintained below10% <strong>of</strong> the total surface area. On each set, nets are placed to minimize differences inphysical influences such as bottom contours, distance from channels, etc. Nets are setin the afternoon <strong>and</strong> checked in the morning with a target soak time <strong>of</strong> 18 to 24 hourswhich is consistent with commercial practices.Processing <strong>of</strong> Field SamplesThe total number <strong>of</strong> each target species, including damaged individuals, was counted.Lengths <strong>of</strong> undamaged specimens were measured to the nearest millimeter (FL) <strong>and</strong>(alive <strong>and</strong> dead) were recorded. A group weight was recorded to the nearest 0.1 kg foreach target species. All other marketable species were sorted to species, counted,measured to the nearest mm (FL or TL), weighed as a species group, <strong>and</strong> alive versusdead condition <strong>of</strong> fish are recorded. Species such as menhaden, carp, suckers werecounted <strong>and</strong> a grouped weight recorded. <strong>Environment</strong>al conditions such as temperature(°C), salinity (ppt), dissolved oxygen (mg/L), wind direction, <strong>and</strong> wind velocity wererecorded upon retrieval <strong>of</strong> the nets on each sampling trip.Preliminary resultsHybrid striped bass are considered striped bass according to the North CarolinaFisheries Rules for Coastal Waters (15A <strong>NC</strong>AC 3M .0201) <strong>and</strong> for analysis purposescombined in the total striped bass catches from this study (Table 10.42). From February14, 2003, 29 trips were completed <strong>and</strong> sampling is still ongoing. The gill nets were setfrom 20-1,500 yards from shore in the three river systems, with the majority <strong>of</strong> the tripsin the Pamlico River (n=24). Other finfish species besides striped bass capturedincluded American shad, hickory shad, white catfish, menhaden, southern flounder,speckled trout, longnose gar, bowfin, carp, white catfish, brown bullhead catfish, gizzardshad, silver redhorse, <strong>and</strong> creek chubsucker.297
Table 10.42.Total catch (kgs) <strong>and</strong> total number <strong>of</strong> striped bass captured in each trip <strong>of</strong> the gill net tie down studyfrom Feb. 14-Apr. 30, 2003.Tie downsControlsRiver system/Date#stripedbassTotal# catch inA. tie downsshad (lbs.)#stripedbass# Total catchA. in controlsshad (lbs.)Distancefrom shore(yds.) Latitude Longitude14-Feb-Pamlico 0 3 51.46 0 5 180.21 780 3527.77 7655.8818-Feb-Pamlico 2 9 121.80 0 14 382.92 1,500 3527.51 7656.3819-Feb-Pamlico 1 18 141.45 0 21 439.85 1,500 3527.51 7656.3820-Feb-Pamlico 0 1 79.95 0 8 300.01 1,500 3527.51 7656.3821-Feb-Pamlico 0 2 66.24 0 13 368.92 1,500 3527.51 7656.3825-Feb-Pamlico 0 0 48.18 0 8 158.58 400 3529.60 7659.6426-Feb-Pamlico 6 0 44.36 3 15 245.35 400 3529.60 7659.6427-Feb-Pamlico 1 5 33.49 1 8 157.44 400 3529.60 7659.6404-Mar- Pamlico 2 1 59.38 0 11 208.00 780 3527.77 7655.8805-Mar-Pamlico 0 3 38.64 2 13 184.14 780 3527.77 7655.8806-Mar-Pamlico 0 0 24.39 1 26 210.45 780 3527.77 7655.8807-Mar-Pamlico 0 3 42.60 4 18 240.17 780 3527.77 7655.8812-Mar-Neuse 0 0 36.87 0 11 126.50 600 3503.38 7659.2813-Mar-Neuse 0 0 30.21 0 2 75.41 600 3503.38 7659.2818-Mar-Pungo 4 0 74.31 13 0 427.70 20 3533.25 7627.7519-Mar-Pungo 0 0 93.21 2 0 391.72 20 3533.25 7627.7520-Mar-Pungo 0 0 188.24 0 0 647.23 20 3533.25 7627.7525-Mar-Pamlico 0 0 31.22 1 13 187.60 400 3530.81 7700.9026-Mar-Pamlico 0 5 33.78 0 16 154.75 400 3530.81 7700.9027-Mar-Pamlico 1 0 34.51 0 13 150.65 400 3530.81 7700.9028-Mar-Pamlico 0 0 21.72 1 7 120.44 400 3530.81 7700.9001-Apr-Pamlico 0 0 73.71 1 11 243.43 150 3531.46 7701.6502-Apr-Pamlico 0 0 64.61 1 12 183.30 150 3531.46 7701.6503-Apr-Pamlico 0 0 56.82 0 13 208.31 150 3531.46 7701.6504-Apr-Pamlico 0 0 54.97 0 13 183.39 - 3531.46 7701.6515-Apr-Pamlico 0 0 6.59 0 10 99.14 600 3527.48 7654.9016-Apr-Pamlico 0 0 20.24 0 6 90.01 600 3527.48 7654.9017-Apr-Pamlico 0 0 8.03 0 2 65.95 - 3527.48 7654.9030-Apr-Pamlico 0 0 56.49 0 4 267.16 700 3528.22 7657.03Total 17 50 1,637.49 30 287 6,698.72Total catches <strong>of</strong> all species combined were four times higher in the control nets with thecatch per trip ranging from 65.95-647.23 lbs./trip <strong>and</strong> average 230.99 lbs./trip The tiedown nets caught between 6.59-188.24 lbs./trip with an average <strong>of</strong> 56.45 lbs./trip.A total <strong>of</strong> 17 striped bass was captured in tie down gill nets <strong>and</strong> 30 in the control gillnets. Although almost half the number <strong>of</strong> striped bass were captured in the tie downnets as compared to the control gill nets, the numbers are still too low to quantify areduction in capture <strong>of</strong> striped bass from gear modifications using tie downs.Differences between the catch rate <strong>and</strong> tie down height cannot be estimated at this timedue to the low numbers captured overall. The number <strong>of</strong> American shad were greatlyreduced in the tie down nets (Table 10.42). A total <strong>of</strong> 50 American shad was captured inall trips in the tie down nets while 287 were captured in the control gill nets.Preliminarily, these findings suggest tie down gill nets could negatively impact the shad298
fishery in the river systems.11.0 RECOMMENDED MANAGEMENT PROGRAM AND RESEARCH NEEDS11.1 Goals <strong>and</strong> ObjectivesThe goal <strong>of</strong> the North Carolina Estuarine Striped Bass <strong>Fishery</strong> <strong>Management</strong> <strong>Plan</strong>(FMP) is to manage estuarine striped bass populations through science baseddecision-making processes that conserve adequate spawning stock <strong>and</strong> protect theintegrity <strong>of</strong> critical habitats. The plan will consider biological, social, <strong>and</strong> economicfactors in management <strong>of</strong> the fisheries. The plan will be adaptive, involving regularreviews <strong>and</strong> responding to new information regarding any aspect <strong>of</strong> the plan.To achieve these goals the following objectives must be met:1. Identify <strong>and</strong> describe population attributes necessary to sustain long-term stockviability.2. Protect, restore <strong>and</strong> enhance spawning <strong>and</strong> nursery area habitat <strong>and</strong>environmental quality to increase growth, survival <strong>and</strong> reproduction <strong>of</strong> stripedbass.3. Manage the fishery in a manner to sustain long-term stock viability, traditionalharvest <strong>and</strong> prevent overfishing.4. Initiate, enhance <strong>and</strong>/or continue programs to collect <strong>and</strong> analyze biological,social, economic, fishery, essential habitat <strong>and</strong> environmental data needed toeffectively monitor <strong>and</strong> manage the striped bass fishery.5. Develop an information program to educate the public <strong>and</strong> elevate awareness<strong>of</strong> the causes <strong>and</strong> nature <strong>of</strong> problems in the striped bass stocks, habitat <strong>and</strong>fisheries, <strong>and</strong> explain the rationale for management efforts to solve theseproblems.6. Develop regulations that provide adequate resource protection, optimize yieldfrom the fishery, <strong>and</strong> consider the needs <strong>of</strong> all user groups.7. Promote practices that minimize bycatch <strong>and</strong> discard mortality in recreational <strong>and</strong>commercial fisheries.11.2 Optimum YieldThe FRA m<strong>and</strong>ates that fishery stocks be managed to produce Optimum Yield(OY). The following information is presented to illustrate how the available informationon the two management units can be used to define OY. Specific values are subject tochange pending review <strong>and</strong> final approval <strong>of</strong> the FMP.11.2.1 Optimum Yield for the Albemarle-Roanoke Stock (Albemarle Sound<strong>Management</strong> Area, ASMA)Optimum yield is defined as that yield provided by exploiting the stock at the targetexploitation rate as determined from the most recent stock assessment.299
This definition <strong>of</strong> OY is in accordance with current management procedures. Thestock is currently managed with a Total Allowable Catch (TAC) that is analogous to OY.The TAC for 2003 was conservatively established at 550,000 pounds based on a targetreference point <strong>of</strong> F= 0.25. The target reference point recommended by the Albemarle-Roanoke Advisory Committee is F= 0.22.Establishing OY as a static value rather than a specific fixed value allows yield to varywith stock conditions. If growth <strong>and</strong> recruitment are favorable <strong>and</strong> the stock is highlyproductive, OY may increase over time. Conversely, if growth <strong>and</strong> recruitment decline,OY may decrease over time. Such an approach is <strong>of</strong>ten desirable when considering astock such as this for which reliable <strong>and</strong> acceptable estimates <strong>of</strong> absolute stockabundance at maximum productivity are not available. The A/R stock has recoveredfrom past overfishing, in that it is not overfished <strong>and</strong> overfishing is not occurring.However, although stock abundance appears near optimal levels, much <strong>of</strong> thepopulation remains at relatively low ages, while spawning stock biomass continues toincrease <strong>and</strong> the age structure <strong>of</strong> the population continues to exp<strong>and</strong>.Because OY is defined relative to stock abundance, stock status must be routinelyevaluated. The stock is currently assessed <strong>and</strong> quotas established annually, althoughassessment frequency could be decreased to every 2 nd <strong>and</strong> 3 rd year without undue risknow that the stock is considered recovered. . Reducing the frequency <strong>of</strong> assessments<strong>and</strong> quota evaluations could provide several benefits: (1) reduced time dem<strong>and</strong>s onanalytical personnel <strong>and</strong> quota evaluations could enable additional work on otherstriped bass stocks, (2) increasing the time between assessments allows for betterevaluation <strong>of</strong> management changes, (3) establishing quotas for several years at a timereduces year to year variability in management actions.11.2.2 Optimum Yield for the Pamlico-Tar River <strong>and</strong> Neuse River Stocks (Central-Southern <strong>Management</strong> Area, CSMA)Optimum yield (OY) is defined as the yield achieved by exploiting the stock at the targetexploitation rate.The OY as defined for the CSMA differs slightly from OY for the ASMA in that a valuefor OY is not predetermined. The lack <strong>of</strong> accurate data on l<strong>and</strong>ings <strong>and</strong> discarding fromthe recreational fishery, discarding from the commercial fishery <strong>and</strong> length <strong>and</strong> agecomposition <strong>of</strong> the catch prevents development <strong>of</strong> a quantitative assessment <strong>of</strong> stockabundance. Therefore, no projections <strong>of</strong> stock abundance <strong>and</strong> total catch rates areavailable for the CSMA <strong>and</strong> OY cannot be estimated numerically in advance.Until data for a complete assessment <strong>of</strong> these stocks are available, the only recourse isto manage based on exploitation rates. Such a restriction is not a major impediment, asmany stocks are managed successfully by controlling exploitation rates. One obviousexample is striped bass in the ASMA, but others include striped bass <strong>of</strong> the Atlanticmigratory stock, summer flounder, weakfish, king <strong>and</strong> Spanish mackerels <strong>and</strong> red drum.When managing by exploitation rate, regulatory changes are developed by making a300
simplifying assumption that l<strong>and</strong>ings are proportional to exploitation (This is true to theextent that population abundance <strong>and</strong> availability to the fisheries do not vary from yearto year). For example, if a 50% reduction in exploitation is necessary, regulations areadopted that will provide a 50% reduction in l<strong>and</strong>ings. If no information on l<strong>and</strong>ings isavailable, further assumptions must be made as to the relationship between currentl<strong>and</strong>ings <strong>and</strong> current regulations. Continuing the same example for a 50% reduction inexploitation, if a fishery is regulated with a 10 fish possession limit <strong>and</strong> it is assumedthat most trips l<strong>and</strong> at that limit, the possession limit would need to be reduced to fivefish. If instead it is assumed that most trips only l<strong>and</strong> six fish, then achieving that 50%reduction would require reducing the possession limit to three fish.11.3 StrategiesThe strategies listed below outline the need for additional data in order to improve theability to assess the status <strong>of</strong> the striped bass stocks. These actions have to beaccomplished in order to meet the goals <strong>and</strong> objectives <strong>of</strong> the FMP. All new work <strong>and</strong>expansion <strong>of</strong> programs will require additional personnel, equipment <strong>and</strong> operatingfunds.11.3.1 North Carolina Coastal Stocks11.3.1.1 Water Flow Issues (Section 10.2.1.1)IssueTo identify impacts to aquatic habitats, which occur as a consequence <strong>of</strong>flow modifications, <strong>and</strong> develop strategies to eliminate or minimize impacts.<strong>Management</strong> Recommendations/Proposed ActionFor rivers which are presently unregulated work with North Carolina <strong>and</strong>/or Virginia <strong>and</strong>South Carolina water resource authorities as appropriate, to secure commitments forpreservation <strong>of</strong> the unaltered flow regimes.For rivers which are presently regulated to such a degree that flow patterns departsignificantly from an unregulated condition, establish a recommended annual flowregime for striped bass spawning <strong>and</strong> nursery areas, <strong>and</strong> work with the appropriateregulatory agencies to secure commitments for preservation <strong>of</strong> such a regime.Require North Carolina Division <strong>of</strong> Water Resources to include Division <strong>of</strong> WaterQuality, Wildlife Resources Commission, Division <strong>of</strong> Marine Fisheries <strong>and</strong> US Fish <strong>and</strong>Wildlife Service in the local water supply planning process <strong>and</strong> in future water allocationnegotiations. Where needed, water allocation for riverine fish habitat (in particularstriped bass spawning <strong>and</strong> nursery habitat) should be obtained by these naturalresource agencies.Specific <strong>Management</strong> Recommendations by River Basin301
Neuse RiverSupport removal <strong>of</strong> Milburnie Dam, to provide more flexibility for flow management.Conduct IHA <strong>and</strong> RVA analysis <strong>of</strong> Neuse River flows, <strong>and</strong> submit the resultant flowregime to the USACOE for implementation.Pee Dee RiverParticipate (USFWS <strong>and</strong> <strong>NC</strong>WRC, in cooperation with SC agencies) in the relicensing<strong>of</strong> dams, with a goal <strong>of</strong> obtaining adequate quantity <strong>and</strong> timing <strong>of</strong> flow releases for alldownstream striped bass habitats.11.3.1.2 Critical Habitat- Spawning <strong>and</strong> Nursery Areas (Section 10.2.1.2)IssueProtection <strong>of</strong> critical habitat areas <strong>and</strong> identification <strong>of</strong> spawning <strong>and</strong>nursery area habitat.<strong>Management</strong> Recommendations/Proposed ActionAdvocate the adoption <strong>of</strong> DMF already identified anadromous spawning <strong>and</strong> nurseryareas for striped bass into rules.Advocate stronger enforcement <strong>of</strong> regulations protecting critical habitat in themanagement areas.Purchase l<strong>and</strong> adjacent to critical habitat areas to ensure that these areas areprotected. This should include the acquisition <strong>of</strong> approved refuge l<strong>and</strong>s on the RoanokeRiver.Continue to make recommendations on all state, federal <strong>and</strong> local permits whereapplicable.Support implementation <strong>of</strong> habitat recommendations <strong>of</strong> the Albemarle-PamlicoEstuarine Study, the Estuarine Shoreline Protection Stakeholders Report, CoastalHabitat Protection <strong>Plan</strong>s <strong>and</strong> Critical Habitat Protection <strong>Plan</strong>s.Maintain, restore <strong>and</strong> improve habitat to increase growth, survival <strong>and</strong> reproduction <strong>of</strong>striped bass. Monies from the Clean Water Trust Fund <strong>and</strong> others should be utilized forthis.11.3.1.3 Blockages <strong>of</strong> Historical Habitat (Section 10.2.1.3)IssueTo identify blockages to historical spawning areas <strong>and</strong> develop strategies tominimize impacts from the blockages.<strong>Management</strong> Recommendations/Proposed Action302
Neuse RiverSupport the removal <strong>of</strong> Milburnie Dam in Raleigh. Removal <strong>of</strong> this dam would openanother 20 miles <strong>of</strong> spawning habitat <strong>and</strong> allow better manipulation <strong>of</strong> flows from Falls<strong>of</strong> the Neuse Reservoir for spawning anadromous species. It would be advantageous toAmerican shad <strong>and</strong> hickory shad spawning runs, in addition to striped bass.Cape Fear RiverSupport the removal <strong>of</strong> Buckhorn Dam <strong>and</strong> Lock <strong>and</strong> Dam #2 <strong>and</strong> #3 <strong>and</strong> a new fishpassage route around Lock <strong>and</strong> Dam #1. Striped bass would be able to return tohistorical spawning grounds. A striped bass <strong>and</strong> other anadromous species fisherywould be able to develop upstream.11.3.1.4 Entrainment <strong>and</strong> Impingement <strong>of</strong> Eggs <strong>and</strong> Larvae (Section 10.2.1.4)IssueStriped bass eggs, fry <strong>and</strong> juveniles are removed from coastal rivers throughwater withdrawals.<strong>Management</strong> Recommendations/Proposed ActionDMF <strong>and</strong> WRC have no direct authority to regulate facilities that withdraw water fromcoastal rivers.Continue to give close attention to state <strong>and</strong> federal permit requests in which waterwithdrawal structures are involved in coastal rivers. Agency comments on proposedwater intakes should, where data are available, provide estimates <strong>of</strong> striped bass eggs,fry, <strong>and</strong> juveniles that could potentially be lost.Monitor the progress <strong>of</strong> USEPA’s implementation <strong>of</strong> Section 316(b) rules as these rulesmay apply to water withdrawal points in North Carolina’s coastal rivers.In the absence <strong>of</strong> effective exclusion technology, require water users to curtailwithdrawals during periods in which striped bass eggs, fry, <strong>and</strong> juveniles may bepresent.11.3.1.5 Water Quality Concerns (Section 10.2.2)IssueIdentification <strong>of</strong> water quality concerns in the striped bass managementareas.<strong>Management</strong> Recommendations/Proposed ActionWork in coordination with agencies such as the Division <strong>of</strong> Water Quality, Division <strong>of</strong>Water Resources, Division <strong>of</strong> L<strong>and</strong> Quality, <strong>and</strong> <strong>Natural</strong> Resource Conservation Serviceto maintain, restore <strong>and</strong> improve water quality to increase growth, survival <strong>and</strong>303
eproduction <strong>of</strong> striped bass. Priority activities identified include the establishment <strong>of</strong>buffer strips <strong>and</strong> conservation easements within each basin, <strong>and</strong> the continuedrefinement <strong>of</strong> best management practices on l<strong>and</strong>s used primarily for agriculture,silviculture <strong>and</strong> industrial <strong>and</strong> residential development.Support implementation <strong>of</strong> recommendations <strong>of</strong> DWQ basinwide water qualitymanagement plans, particularly measures that will reduce nutrient loading, sedimentdelivery <strong>and</strong> associated turbidity in all coastal watersheds.Support implementation <strong>of</strong> habitat <strong>and</strong> water quality recommendations <strong>of</strong> CoastalHabitat Protection plans (CHPPs), the Estuarine Shoreline Protection Stakeholdersreport (1999), <strong>and</strong> the Albemarle-Pamlico Estuarine Study (1994) which includes theComprehensive Conservation <strong>and</strong> <strong>Management</strong> <strong>Plan</strong> (CCMP).11.3.2 <strong>Management</strong> Strategies11.3.2.1 Catch <strong>and</strong> Release Mortality in Hook <strong>and</strong> Line Fisheries (Section 10.2.3)IssueA portion <strong>of</strong> striped bass caught <strong>and</strong> released in the hook <strong>and</strong> line fisheries die as aresult <strong>of</strong> injuries or physiological stress.<strong>Management</strong> Recommendations/Proposed ActionAgencies <strong>and</strong> C/S AC support status quo until the creel surveys are complete inthe CSMA.)1. The numbers <strong>of</strong> striped bass caught <strong>and</strong> released on a year-round basis may besubstantial. Creel surveys will be necessary to estimate numbers <strong>of</strong> striped basscaught <strong>and</strong> released as well as directed angling effort for striped bass. Once numbers <strong>of</strong>striped bass caught <strong>and</strong> released are estimated, differential mortality rates from otherstudies can be applied to those numbers to estimate catch <strong>and</strong> release mortality. Theseestimates are necessary as a part <strong>of</strong> estimating total annual fishing mortality, themanagement <strong>of</strong> which is imperative to the long-term perpetuation <strong>of</strong> the stock. WRC<strong>and</strong> DMF agree that catch <strong>and</strong> release fishing for striped bass is an acceptablecomponent <strong>of</strong> the recreational fishery however, until the magnitude <strong>of</strong> striped basslosses from this component is estimated, objective policy decisions concerningacceptable levels <strong>of</strong> striped bass losses cannot be made.2. Observations by WRC <strong>and</strong> DMF indicate that directed angling effort for striped bassdiminishes significantly once harvest seasons are closed in both the Roanoke River <strong>and</strong>Albemarle Sound Striped Bass <strong>Management</strong> Areas. Therefore, as an interim measureto minimize striped bass mortality from catch <strong>and</strong> release fishing, WRC <strong>and</strong> DMFrecommend that striped bass harvest seasons be considered in months (October –April) in which cool water temperatures (
techniques, hook configurations, bait <strong>and</strong> lure use, <strong>and</strong> h<strong>and</strong>ling <strong>of</strong> striped bass.Continued research on identifying the correct sizes <strong>and</strong> configurations <strong>of</strong> circle hooks isneeded to develop effective methods <strong>of</strong> reducing deep hooking <strong>of</strong> striped bass in thenatural bait component <strong>of</strong> the fishery.11.3.2.2 Enforcement <strong>of</strong> Creel Limits in the Vicinity <strong>of</strong> Inl<strong>and</strong>/Joint or CoastalBoundaries (Section 10.2.4)IssueDivision <strong>of</strong> Marine Fisheries (DMF) <strong>and</strong> Wildlife Resources Commission(WRC) enforcement <strong>of</strong>ficers may be faced with problems with the enforcement <strong>of</strong>striped bass recreational creel limits at or near the jurisdictional boundaries betweenInl<strong>and</strong> <strong>and</strong> Joint or Coastal Waters or at the boundaries between different striped bassmanagement areas due to different creel limits, size limits or legal possession limits.<strong>Management</strong> Recommendations/Proposed ActionThe simplest solution to this confusion, if it exists, is to publicize to anglers in thevicinity <strong>of</strong> these boundaries that when you are checked by an enforcement <strong>of</strong>ficer <strong>of</strong>either agency, you cannot have in possession more than the creel limit for thewaterbody you are in while actively engaged in fishing.In order to promote complete clarity; encourage the WRC to implement a rulesimilar to the MFC Rule that states you must be in compliance with the restrictions inplace at the point you are checked. The MFC Rule reads, “It is unlawful to possess anyspecies <strong>of</strong> fish which is subject to size or harvest restrictions, while actively engaged ina fishing operation, unless all fish are in compliance with the restrictions for thewaterbody <strong>and</strong> area being fished”.11.3.2.3 Albemarle Sound <strong>Management</strong> Area Boundary Line (Section 10.2.5)IssueReview the Albemarle Sound <strong>Management</strong> Area southern boundary line.<strong>Management</strong> Recommendations/Proposed ActionSupport Status Quo, No shift in the Boundary Line <strong>and</strong> support the researchneeds. The Boundary line was established to provide a migratory corridor for theAlbemarle-Roanoke stock <strong>of</strong> striped bass. As currently established, the lineaccomplishes this goal. The line also provides a delineation point for allocating harvestto management areas, <strong>and</strong> is believed to encompass the primary areas inhabited by theAlbemarle-Roanoke stock. Moving the line northward would likely exacerbate theproblem <strong>of</strong> stock mixing, <strong>and</strong> contribute to a significant bias in assessment calculationsfor the Albemarle-Roanoke, Tar River, <strong>and</strong> Neuse River stocks. Furthermore, in alllikelihood such a shift would lead to potential increases in commercial discard <strong>and</strong>recreational harvest losses.305
11.3.3 Albemarle/Roanoke Striped Bass Stock11.3.3.1 Biological Reference Points (Section 10.3.1.1)IssueEstimation <strong>of</strong> biological reference points <strong>and</strong> management targets.<strong>Management</strong> Recommendations/Proposed ActionOverfishing <strong>and</strong> Overfished definitionsThe DMF <strong>and</strong> WRC recommend that the overfishing definition be based on thethreshold exploitation rate: Overfishing will occur when the exploitation rate exceeds thethreshold exploitation rate.The DMF <strong>and</strong> WRC recommend that the overfished definition be based on the biomassthreshold: The stock will be overfished if biomass falls below the threshold.<strong>Management</strong> RecommendationSupport a F rate <strong>of</strong> 0.22 <strong>and</strong> a threshold <strong>of</strong> 400,000 pounds <strong>of</strong> SSB for the A/R stock.11.3.3.2 Discard Mortality <strong>of</strong> Striped Bass in the Multi-species Gill Net <strong>Fishery</strong>-ASMA Section 10.3.2.1)IssueInvestigation <strong>of</strong> bycatch <strong>and</strong> discards <strong>of</strong> striped bass in the multi-species, anchored gillnet fishery in the Albemarle Sound <strong>Management</strong> Area (ASMA).<strong>Management</strong> Recommendations/Proposed ActionMaintain status quo, existing gill net proclamation authority, with requirement that smallmesh gill nets be sunk after river herring gill net season closes. Small mesh gill nets (3¼ inch) would be restricted to no more than 25 – 30 meshes deep <strong>and</strong> set in no lessthan 7 feet <strong>of</strong> water unless attended. These requirements would remain in effect whenattendance was not required. Also, consider area closures to gill netting.The following qualifications will also apply: 1. DMF will evaluate existing IGNS smallmesh data to determine differences between striped bass catches in float <strong>and</strong> sink gillnets. 2. Observer data, current <strong>and</strong> new will be collected <strong>and</strong> analyzed to assess thebenefits. Should the discard reductions not be within the estimated range <strong>of</strong> the otheroptions in Table 10.14, then DMF may implement other options <strong>of</strong> the FMP, or optionsthat may be developed over time.11.3.3.3 <strong>Management</strong> <strong>of</strong> Quotas <strong>and</strong> Harvest Targets in the ASMA (Section10.3.3.1)306
Issue<strong>Management</strong> <strong>of</strong> quotas <strong>and</strong> harvest targets for the ASMA <strong>and</strong> RRMA.<strong>Management</strong> Recommendations/Proposed ActionSupports no payback for overages in RRMA due to underage in 2003.Supports TAC allocation: 25% Roanoke River/WRC recreational, 25% AlbemarleSound/DMF recreational <strong>and</strong> 50% Albemarle Sound/DMF commercial.Penalties/Triggers for Overages: Short-term Overage: point harvest estimate exceedsthe total TAC by 10% in a single year, overage deducted from the next year <strong>and</strong>restrictive measures implemented in the responsible fishery (ies). Long-term Overages:five year running average <strong>of</strong> point estimate exceeds the five year running average <strong>of</strong> thetotal TAC harvest by 2%, the responsible fishery exceeding the harvest limit will bereduced by the amount <strong>of</strong> the overage for the next five years. Should the target F beexceeded, then restrictive measures will be imposed to reduce F to the target level.11.3.3.4 Recreational Striped Bass Harvest Closure Atlantic Ocean (Section10.3.3.2)IssueIncreased harvest <strong>of</strong> striped bass 28 inches TL <strong>and</strong> larger during the latespring through the summer.<strong>Management</strong> RecommendationSupport Status Quo- continue to allow harvest year round.11.3.4 Central/Southern Striped Bass11.3.4.1 Biological Reference Points (Section 10.4.1.1)IssueEstimation <strong>of</strong> biological reference points <strong>and</strong> management targets.<strong>Management</strong> Recommendations/Proposed ActionThe DMF, WRC <strong>and</strong> FWS recommends that the CSMA stocks be managed under thesame exploitation rate targets <strong>and</strong> thresholds ( F=0.22, SSB= 400,000 pounds) asselected for the Albemarle-Roanoke stock. The DMF <strong>and</strong> WRC advises that no biomassthresholds or targets are available for the other stocks, due to a lack <strong>of</strong> data. Datacollection needs for biomass targets <strong>and</strong> threshold levels can be developed as listed inthe research needs.11.3.4.2 Striped Bass Stocking in Coastal River Systems (Section 10.4.2)307
IssueStocking striped bass in <strong>NC</strong> coastal rivers.<strong>Management</strong> Recommendations/Proposed ActionSupport continuing the Phase II striped bass stocking program (all fish OTCmarked, portion marked with external tags), with two systems in the C/S<strong>Management</strong> Area (Tar-Pamlico, Neuse <strong>and</strong> Cape Fear rivers) being stockedannually, with a goal <strong>of</strong> 100,000 fish per system. DMF supports the researchneeds.Support continuing the Phase I striped bass stocking program (all fish OTCmarked), with a goal <strong>of</strong> 100,000 fish per year, per system in the C/S <strong>Management</strong>Area (Tar, Neuse, <strong>and</strong> Cape Fear/Northeast Cape Fear rivers) annually. WRCsupports the research needs.11.3.4.3 Catch Curve Estimates/<strong>Management</strong> Options for Neuse River <strong>and</strong> Tar-Pamlico River Striped Bass Stocks (Section 10.4.3.1)IssueEstimation <strong>of</strong> survival <strong>and</strong> exploitation rates for the Central<strong>and</strong> Southern North Carolina stocks <strong>of</strong> striped bass through catch curve analysis.<strong>Management</strong> Recommendations/Proposed ActionRecreational <strong>Fishery</strong> <strong>Management</strong> MeasuresAdequate information to evaluate specific recreational measures is lacking in theCSMA. Regulations should remain at status quo for 2004. A one year creel survey isbeing developed by DMF <strong>and</strong> WRC for the Tar-Pamlico <strong>and</strong> Neuse systems. The WRCin 2004 will be conducting a creel survey in the Cape Fear system. These surveys willcollect data on the recreational striped bass fisheries in these waters. After completion<strong>of</strong> the creel survey the data will be analyzed <strong>and</strong> appropriate regulations implementedas needed for the stocks.Commercial <strong>Fishery</strong> <strong>Management</strong> MeasuresCommercial fishery gill net restrictions have been enacted over the last several years,as a result <strong>of</strong> the Red Drum FMP <strong>and</strong> endangered species interactions. Large areas <strong>of</strong>Pamlico Sound are closed to gill netting from August 15 – December 15, <strong>and</strong> otherareas have strict permitting <strong>and</strong> gear restrictions. Attendance is required <strong>of</strong> gill netswithin the upper rivers <strong>and</strong> within 200 yards <strong>of</strong> shore in lower river portions.Comprehensive DMF gill net sampling within Pamlico Sound indicates extremely lowcatch rates <strong>of</strong> striped bass. Therefore, it is unlikely that gill net fisheries in the Sound areresponsible for significant bycatch losses, <strong>and</strong> management efforts should instead focuson reducing striped bass interactions in the rivers. With the exception <strong>of</strong> the allowance<strong>of</strong> 4 –4 ½ inch mesh, many <strong>of</strong> the gill net restrictions imposed in Albemarle Sound are308
already required in the rivers <strong>of</strong> the CSMA.Commercial <strong>Fishery</strong> <strong>Management</strong> Measures- see Section 11.3.4.411.3.4.4 Discard Mortality <strong>of</strong> Striped Bass from Set Gill Nets in theCentral/Southern <strong>Management</strong> Area (CSMA) (Section 10.4.3.2)IssueInvestigation <strong>of</strong> discards <strong>of</strong> striped bass in the multi-species, set gill net fishery in theCentral Southern <strong>Management</strong> Area (CSMA).<strong>Management</strong> Recommendations/Proposed ActionThe only preferred additional management measure is to require ‘tie downs’ toreduce striped bass bycatch. The DMF is currently evaluating the effectiveness <strong>of</strong>various tie down configurations at reducing striped bass bycatch. Two alternatives weredeveloped:Rivers: Increase the commercial possession limit to 10 fish per day per commercialfishing operation in the rivers during the open striped bass season. Require that gill netsin the shad <strong>and</strong> flounder fisheries operating in the Pamlico, Pungo <strong>and</strong> Neuse riverareas (west <strong>of</strong> 76° 30’W long.) be tied down after the striped bass quota is reached <strong>and</strong>the season closed.Pamlico Sound: The commercial possession limit would remain at five fish in thePamlico Sound. Striped bass will be limited to 50% by weight <strong>of</strong> the total catch, not toexceed five fish per day per commercial fishing operation. Gill nets with a mesh length<strong>of</strong> 6 inches (stretched mesh) <strong>and</strong> greater would be prohibited during the striped bassseason.This option is intended to shorten the “directed” striped bass harvest season <strong>and</strong>impose the tie down provisions to reduce striped bass bycatch after the season closes.This option will be most effective if the tie down provisions essentially eliminate stripedbass interactions. Requiring the 50% weight provisions <strong>and</strong> prohibiting large mesh gillnets in Pamlico Sound will eliminate the directed fishery.In the remaining portions <strong>of</strong> the CSMA continue the commercial striped bass seasons,opening <strong>and</strong> closing through proclamation <strong>and</strong> operating under the TAC. This option isintended to allow bycatch <strong>of</strong> striped bass from gill net fisheries. As data are collected,more restrictive measures may be implemented as needed.11.4 Research Needs SummaryThe following research needs were compiled from those listed in the issue papers inSection 10. Proper management <strong>of</strong> the striped bass resources is dependent upon most309
<strong>of</strong> these research needs being met. The MFC, DMF, WRC <strong>and</strong> both AC’s support all <strong>of</strong>the research needs.11.4.1 <strong>NC</strong> Coastal Striped Bass StocksWater FlowExamine historical striped bass data sets from <strong>NC</strong> rivers to determine if sufficientinformation exists to evaluate relationships between striped bass life history stages <strong>and</strong>water flows.Should there be insufficient data to evaluate relationships between striped bass lifehistory stages <strong>and</strong> flow within a given river, such data should be collected for a sufficientlength <strong>of</strong> time to allow determination <strong>of</strong> such relationships.When implementing changes to flow regimes on any <strong>NC</strong> river, agencies must conductappropriate field monitoring <strong>of</strong> striped bass life stages to document any response.Critical HabitatRe-evaluate the spawning <strong>and</strong> nursery area surveys conducted previously ( Tar-Pamlico, Neuse, Cape Fear, etc.).Identify potential incentives to l<strong>and</strong>owners for protection <strong>of</strong> riparian buffers in themanagement areas.Develop, identify <strong>and</strong> clarify what critical habitat needs are to protect, enhance <strong>and</strong>restore habitats <strong>and</strong> water quality utilized or required by striped bass.Entrainment <strong>and</strong> ImpingementThe magnitude <strong>and</strong> seasonal timing <strong>of</strong> agricultural water withdrawals from coastal riversis unknown. The Division <strong>of</strong> Water Resources <strong>and</strong> the Division <strong>of</strong> Water Quality shouldrequire documentation <strong>of</strong> all withdrawals, so that the extent <strong>of</strong> entrainment <strong>of</strong> stripedbass eggs, fry <strong>and</strong> juveniles can be estimated.Data on the density <strong>and</strong> distribution <strong>of</strong> striped bass eggs, fry <strong>and</strong> juveniles in coastalrivers are needed so that potential losses can be estimated.Identify effective engineering solutions to prevent entrainment <strong>and</strong> impingement <strong>of</strong>striped bass eggs, fry <strong>and</strong> juveniles.Research is needed to determine the fate <strong>of</strong> striped bass eggs, fry <strong>and</strong> juveniles thatare impinged, then released through screen cleaning operations.Water QualityMembrane Water Treatment <strong>Plan</strong>ts: Evaluate the impacts/effects <strong>of</strong> reverse osmosis310
plants on receiving waters <strong>and</strong> aquatic resources.Water Quantity: Evaluate the effects <strong>of</strong> existing <strong>and</strong> future water withdrawals on waterquality <strong>and</strong> quantity <strong>and</strong> fisheries habitat in coastal watersheds.Contaminants: Determine if contaminants are presence <strong>and</strong> identify those that arepotentially detrimental to various life history stages <strong>of</strong> striped bass. Specific areas <strong>of</strong>concern include the lower Neuse, Pamlico <strong>and</strong> Roanoke rivers.Catch <strong>and</strong> Release Mortality- Hook <strong>and</strong> Line FisheriesClarify relationships between salinity, dissolved oxygen, temperature <strong>and</strong> catch <strong>and</strong>release mortality rates <strong>of</strong> striped bass in the Albemarle Sound <strong>Management</strong> Area(ASMA) <strong>and</strong> the Central/Southern <strong>Management</strong> Area.Determine the seasonal magnitude <strong>of</strong> striped bass angling effort, catch <strong>and</strong> harvest for<strong>NC</strong> rivers <strong>and</strong> coastal waters outside the Roanoke River/ASMA.SocioeconomicCollect comprehensive socioeconomic data in the commercial fishery that will allow forestimates by species based on gear usage <strong>and</strong> water body.Collect data on recreational fishermen who use commercial gear <strong>and</strong> target stripedbass.Collect comprehensive socioeconomic data, including catch statistics <strong>and</strong> anglerdemographics in a single data collection effort <strong>of</strong> recreational fishermen who targetstriped bass in all water bodies where striped bass are routinely harvest.Collect l<strong>and</strong>ings data from recreational fishermen who target striped bass in the areas <strong>of</strong>the Tar-Pamlico, Neuse, Trent <strong>and</strong> Cape Fear rivers not already covered by MRFSS.Conduct a socioeconomic survey <strong>of</strong> “for hire” guides, particularly in the ASMA, as theyaccount for an increasingly significant number <strong>of</strong> recreational trips for striped bass.Tagging ProgramComprehensive tagging program.Increased external tagging <strong>of</strong> stocked Phase II striped bass (additional tagging effort).Comprehensive tagging program <strong>of</strong> wild fish, including estimation <strong>of</strong> reporting rates.Thorough evaluation <strong>and</strong> analysis <strong>of</strong> stocking programs.Albemarle Sound <strong>Management</strong> Area Boundary LineAccurate information on stock mixing in the sounds <strong>and</strong> rivers <strong>of</strong> <strong>NC</strong> is required toenable unbiased evaluation <strong>of</strong> stock abundance. This may be achieved through a311
comprehensive tagging program.Accurate information on migratory patterns <strong>and</strong> movements <strong>of</strong> striped bass from theCSMA stocks needs to be determined. This may be achieved through a taggingprogram.Accurate catch statistics, adequate biological sampling, <strong>and</strong> fishery-independent surveydata for CSMA stock are required to allow accurate stock assessment. This will requirededicated creel surveys, exp<strong>and</strong>ed MRFSS coverage, exp<strong>and</strong>ed commercial fish housesampling <strong>and</strong> development <strong>of</strong> an independent survey.11.4.2 A/R Striped Bass StockWater FlowConduct a new analysis <strong>of</strong> the relationship between the Juvenile Abundance Index (JAI)in Albemarle Sound <strong>and</strong> Roanoke River flow to incorporate JAI values measured duringthe past decade, since previous analyses were conducted.BlockagesChowan River system: Nottoway, Blackwater <strong>and</strong> Meherrin rivers are tributaries to theASMA. Investigations would determine if dams in this system are having an impact onstriped bass spawning. Investigate abundance <strong>and</strong> spawning contribution <strong>of</strong> stripedbass in the Blackwater, Nottoway <strong>and</strong> Meherrin rivers. Manpower <strong>and</strong> monies neededto complete surveys are lacking at this time <strong>and</strong> work will require adding additionalVirginia agencies to the management process.Roanoke River: Investigate the potential for passage <strong>of</strong> striped bass above RoanokeRapids Dam. Other anadromous species such as American shad <strong>and</strong> possibly sturgeonwould benefit from fish passage. Passage <strong>of</strong> some undesirable species is a possibility<strong>and</strong> approximately 1 to 5 million dollars would be required for a passage facility.Discard Mortality in the Multi-Species Gill Net <strong>Fishery</strong>More at seas observations for the gill net fishery are needed to more accurately assessdiscards from the fishery.Improvements should be made in the trip ticket data to collect gear parameters(yardage, mesh size, etc.).Need to further investigate the impacts <strong>of</strong> delayed mortality on striped bass captured ingill nets.Biological Reference PointsAdditional stock monitoring at the current high abundance is necessary to define thestock-recruitment relationship.312
The emigration rate should be evaluated in the near future, as the proportion <strong>of</strong> thestock age 8 <strong>and</strong> older increases.Data should be collected for striped bass stocks outside the Albemarle /Roanokesystem that will enable determination <strong>of</strong> stock status <strong>and</strong> estimation <strong>of</strong> biomassthresholds <strong>and</strong> targets.11.4.2 C/S Striped Bass StocksWater Flow1. Conduct needed studies to further refine the relationship between life stages,flow <strong>and</strong> habitat quality (i.e., the relationship between flows <strong>and</strong> the location <strong>and</strong>extent <strong>of</strong> spawning <strong>and</strong> nursery habitat(s) in the Tar, Neuse, Cape Fear <strong>and</strong> PeeDee rivers).2. Conduct sediment contamination study as a result <strong>of</strong> Hurricane Floyd.BlockagesTar River: Investigate the feasibility <strong>of</strong> fish passage on Rocky Mount Mill Dam <strong>and</strong> TarRiver Reservoir Dam. Passage would add an additional 20 – 40 miles <strong>of</strong> spawninghabitats, but it is not clear at this time if passage would be beneficial to striped bass orto resident reservoir species.Yadkin-Pee Dee Rivers: Investigate the feasibility <strong>of</strong> fish passage above the Yadkinchain <strong>of</strong> dams in <strong>NC</strong>. Passage would be costly but striped bass <strong>and</strong> other anadromousspecies could be restored to their historical range.Biological Reference PointsData should be collected for striped bass stocks in the CSMA that will enabledetermination <strong>of</strong> stock status <strong>and</strong> estimation <strong>of</strong> biomass thresholds <strong>and</strong> targets.Striped Bass Stocking in Coastal River SystemsSurvey stocked systems to determine percentage <strong>of</strong> wild versus stocked fish.Life History InformationDetermine maturity, fecundity, size <strong>and</strong> weight at age. Determine egg <strong>and</strong> larval survivalrates.Exp<strong>and</strong>ed survey coverage, including juvenile abundance <strong>and</strong> population abundance inthe sounds <strong>and</strong> lower rivers.Predator prey relationshipRecreational DataQuantitative assessment <strong>of</strong> Tar <strong>and</strong> Neuse River striped bass populations.313
Complete l<strong>and</strong>ings statistics for recreational fisheries (creel survey).Biological characteristics <strong>of</strong> recreational fisheries (length, weight, age <strong>and</strong> sex) (creelsamples).Discard estimates from recreational fisheries (Creel Survey).Biological characteristics <strong>of</strong> recreational discard (Angler’s log or independent survey).Improve accuracy <strong>of</strong> striped bass discard estimates.Commercial DataBiological characteristics <strong>of</strong> commercial catch. Including length, age, weight <strong>and</strong> sex(increased sampling, age structure collection).Discard Mortality from Set Gill Nets in the CSMAMore at-sea observations made for the gill net fishery are needed to more accuratelyassess the discards from the fishery.Improvements should be made in trip ticket data to collect gear parameters (yardage,mesh size, etc.).Need to further investigate the impacts <strong>of</strong> delayed mortality on striped bass captured ingill nets.Improve the accuracy <strong>of</strong> striped bass discard estimates.11.5 Review CycleAs provided in the Fisheries Reform Act <strong>of</strong> 1997, the Striped Bass <strong>Fishery</strong> <strong>Management</strong><strong>Plan</strong> will be reviewed <strong>and</strong> revised at least every five years with the support <strong>of</strong> advisors.314
12.0 LITERATURE CITEDAlbrecht, A.B. 1964. Some observations on factors associated with survival <strong>of</strong> stripedbass eggs <strong>and</strong> larvae. California Fish <strong>and</strong> Game 50:100-113.Alverson, D.L., M.H. Freeberg, J.G. Pope <strong>and</strong> S.A. Murawski. 1994. A globalassessment <strong>of</strong> fisheries bycatch <strong>and</strong> discards. FAO Fisheries Technical Paper. No.339.Andrews, L.A. 2001. Concentrate disposal. American membrane technologyassociation. 2001 Annual symposium. 10p.Atlantic States Marine Fisheries Commission (ASMFC). 1990. Source document for thesupplement to the striped bass FMP - Amendment #4. ASMFC, Fisheries<strong>Management</strong> Report No. 16. Versar, Inc., Columbia, MD.Atlantic States Marine Fisheries Commission (ASMFC). 1995. Amendment #5 to theinterstate fishery management plan for Atlantic striped bass. ASMFC, Washington,DC. Fisheries <strong>Management</strong> Report No. 34.Atlantic States Marine Fisheries Commission (ASMFC). 2003. Amendment # 6 to theinterstate fishery management plan for Atlantic striped bass. ASMFC, Washington,DC. Fisheries <strong>Management</strong> Report No. 41.Auld, A.H. <strong>and</strong> J. R. Schubel. 1978. Effects <strong>of</strong> suspended sediments on fish eggs <strong>and</strong>larvae: a laboratory assessment. Estuarine <strong>and</strong> Coastal Marine Science. 6:153-164.Avise, J.C. <strong>and</strong> Van Den Avyle, M.J. 1984. Genetic analysis <strong>of</strong> reproduction <strong>of</strong> hybridwhite bass x striped bass in the Savannah River. Trans. Am. Fish. Soc. 113 (5):563-570.Bain, M.D. <strong>and</strong> J.L. Bain. 1982. Habitat suitability index models: coastal stocks <strong>of</strong>striped bass. U.S. Fish <strong>and</strong> Wildlife Service, Office <strong>of</strong> Biological Services.FWS/OBS 82/10.1. Washington DC. 29 pp.Baker, W.D. 1968. A reconnaissance <strong>of</strong> anadromous fish runs into the inl<strong>and</strong> fishingwaters <strong>of</strong> North Carolina. Completion Report, Project AFS-3. N.C. WildlifeResources Commission. 33 pp.Bales, J.D., A.G. Strickl<strong>and</strong> <strong>and</strong> R.G. Garret. 1991. Flows in the lower Roanoke River,continuously monitored water quality in Albemarle Sound, <strong>and</strong> hydrodynamics <strong>of</strong>Albemarle Sound, North Carolina. Interim report to the North Carolina Striped BassStudy <strong>Management</strong> Board, Project No. 91-5. U.S. Geological Survey, Raleigh, <strong>NC</strong>.Barkuloo, J.M. 1967. Florida striped bass, Roccus saxatilis (Walbaum). Florida Game<strong>and</strong> Fresh Water Fish Commission, Tallahassee. Federal Aid Project No. F-10-R.24 pp.Barkuloo, J.M. 1970. Taxonomic status <strong>and</strong> reproduction <strong>of</strong> striped bass (Moronesaxatilis) in Florida. U.S. Bureau <strong>of</strong> Sport Fisheries <strong>and</strong> Wildlife, Technical Paper44. 16 pp.315
Bason, W.H. 1971. Ecology <strong>and</strong> early life history <strong>of</strong> striped bass, Morone saxatilis, in theDelaware Estuary. Ichthyology Association Bulletin 4. 122 pp.Bayless, J.D. 1968. Striped bass hatching <strong>and</strong> hybridization experiments. Proc. AnnualConf. Southeast. Assoc. Game Fish. Comm. 21:233-244.Bayless, J.D. 1972. Artificial propagation <strong>and</strong> hybridization <strong>of</strong> striped bass, Moronesaxatilis (Walbaum). S.C. Wildlife <strong>and</strong> Marine Resources Department. 135 pp.Benton, J.C. 1992. Atlantic migratory striped bass adult monitoring program - NorthCarolina <strong>and</strong> Virginia <strong>of</strong>fshore mixed stocks, 1988-1992. U.S. Fish <strong>and</strong> WildlifeService, South Atlantic Fisheries Coordination Office, Morehead City, <strong>NC</strong>.Unpublished manuscript.Bigelow, H.B. <strong>and</strong> W.C. Schroeder. 1953. Fishes <strong>of</strong> the Gulf <strong>of</strong> Maine. U.S. Fish <strong>and</strong>Wildlife Service. Fisheries Bulletin 53.Bogdanov, A.S., S.I. Doroshev <strong>and</strong> A.F. Karpevich. 1967. Experimental transfer <strong>of</strong>Salmo gairdneri (Richardson) <strong>and</strong> Roccus saxatilis (Walbaum) from the U.S.A. foracclimatization in bodies <strong>of</strong> water <strong>of</strong> the U.S.S.R. Vopr. Ikhtiol. 42:185-187.Borawa, J. C. 1983. Sport fishery harvest determination <strong>of</strong> the lower Neuse River basinarea. <strong>NC</strong> Wildlife resources Commission, Federal Aid in fish Restoration, Project F-22-5, Final report, Raleigh.Boreman, J. <strong>and</strong> R.R. Lewis. 1987. Atlantic coastal migration <strong>of</strong> striped bass. Am. Fish.Soc. Symposium 1:331-339.Bowman, S., <strong>and</strong> J. E. Hightower. 2001. American shad <strong>and</strong> striped bass spawningmigration <strong>and</strong> habitat selection in the Neuse River, North Carolina. Final report tothe North Carolina Marine Fisheries Commission. North Carolina Cooperative Fish<strong>and</strong> Wildlife Research Unit, <strong>NC</strong>SU, Raleigh, <strong>NC</strong>.Boynton, W.R., E.M. Setzler, K.V. Wood, H.H. Zion <strong>and</strong> M. Homer. 1977. Final report onPotomac River fisheries study: ichthyoplankton <strong>and</strong> juvenile investigations.University <strong>of</strong> Maryl<strong>and</strong>, CEES, Chesapeake Biological Laboratory Reference No.77-169.Breitburg, D.L. 1988. Effects <strong>of</strong> turbidity on prey consumption by striped bass larvae.Trans. Am. Fish. Soc. 11:72-110.Burgess, C. Undated. Discover North Carolina’s river basins. <strong>NC</strong> <strong>Dept</strong>. Enviro. <strong>and</strong> Nat.Res., Office <strong>of</strong> <strong>Environment</strong>al Education, Raleigh. 12 pp.Burns, F. 1887. Rockfish in South Carolina. Bulletin <strong>of</strong> the U.S. Fish Commission(1886)6:124-215.Burton, D. T., L. W. Hall, Jr., R. J. Klauda <strong>and</strong> S. L. Magrey. 1983. Effects <strong>of</strong> treatedbleached kraft mill effluent on eggs <strong>and</strong> prolarvae <strong>of</strong> striped bass, (Moronesaxatilis). Water Resources Bulletin. 19:869-879.Calhoun, A.J., C.A. Woodhull <strong>and</strong> W.C. Johnson. 1950. Striped bass reproduction in the316
Sacramento River system in 1948. California Fish <strong>and</strong> Game 36:135-145.Carlson, F.T. <strong>and</strong> J.A. McCann. 1968. Hudson River fisheries investigations 1965-1968.Evaluations <strong>of</strong> a proposed pump storage project at Cornwall, New York, in relationto fish in the Hudson River. Pp. 320-372 In G.P. Howells <strong>and</strong> G.J. Lauer, eds.Proceedings <strong>of</strong> the Second Symposium on Hudson River Ecology,. ConsolidatedEdison Co., New York.Carlson, F.T. <strong>and</strong> J.A. McCann. 1969. Report on the biological findings <strong>of</strong> the HudsonRiver fisheries investigations, 1965-1968. Hudson River Policy Committee, NewYork State Conservation Department. 50 pp.Carmichael, J.T. 1995. Effects <strong>of</strong> flow <strong>and</strong> temperature on spawning <strong>and</strong> migrationbehavior <strong>of</strong> Albemarle Sound-Roanoke River striped bass. Master’s thesis. NorthCarolina State University, Raleigh. Carmichael, J. T. 2001. Stock status <strong>of</strong>Albemarle Sound-Roanoke River striped bass. <strong>NC</strong> Div. Mar. Fish., Morehead City,<strong>NC</strong>.Carmichael, J. T. 2002. Stock status <strong>of</strong> Albemarle Sound-Roanoke River striped bass.<strong>NC</strong> Div. Mar. Fish., Morehead City, <strong>NC</strong>.Carmichael, J. T., S. L. Haeseker, <strong>and</strong> J. E. Hightower. 1998. Spawning migration <strong>of</strong>telemetered striped bass in the Roanoke River, North Carolina. Transactions <strong>of</strong> theAm. Fish. Soc., 127:286-297.Chadwick, H.K. 1974. Entrainment <strong>and</strong> thermal effects on a mysid shrimp <strong>and</strong> stripedbass in the Sacramento-San Joaquin Delta. In L.D. Jensen, ed. Second workshopon entrainment <strong>and</strong> intake screening. Publication 74-049-5. Electric PowerResources Institute. Palo Alto, CA. pp. 23-30.Chadwick, H.K., D.E. Stevens <strong>and</strong> L.W. Miller. 1977. Some factors regulating thestriped bass population in the Sacramento-San Joaquin Estuary, California. In W.Van Winkle, ed. Proceedings <strong>of</strong> the conference on assessing the effects <strong>of</strong> powerplant-inducedmortality on fish populations, Gatlinburg, Tennessee, May 3-6, 1977.Pergamon Press. Elmsford, NY. pp. 18-35.Chapoton, R.B. <strong>and</strong> J.E. Sykes. 1961. Atlantic Coast migration <strong>of</strong> large striped bass asevidenced by fisheries <strong>and</strong> tagging. Trans. Am. Fish. Soc. 90:13-20.Cheek, T.E., M.J. Van Den Avyle <strong>and</strong> C.C. Coutant. 1985. Influences <strong>of</strong> water quality ondistribution <strong>of</strong> striped bass in a Tennessee River impoundment. Transactions <strong>of</strong> theAmerican Fisheries Society 114:67-76.Chestnut, A.F. <strong>and</strong> H.S. Davis. 1975. Synopsis <strong>of</strong> marine fisheries <strong>of</strong> North Carolina.Part 1. Univ. <strong>NC</strong> Sea grant Prog., Pub. No. U<strong>NC</strong>-SG-75-12, 425p.Chittenden, M.E., Jr. 1971. Effects <strong>of</strong> h<strong>and</strong>ling <strong>and</strong> salinity on oxygen requirements <strong>of</strong>striped bass, Morone saxatilis. Journal <strong>of</strong> <strong>Fishery</strong> Resources Board <strong>of</strong> Canada28:1823-1830.Clark, J.R. 1968. Seasonal movements <strong>of</strong> striped bass contingents <strong>of</strong> Long Isl<strong>and</strong>317
Sound <strong>and</strong> the New York Bight. Transactions <strong>of</strong> the American Fisheries Society97:320-343.Collier, R.S. <strong>and</strong> M.C. Odom. 1989. Obstructions to anadromous fish migration. Reportto Albemarle-Pamlico Estuarine Study, Project No. 88-12. U.S. Fish <strong>and</strong> WildlifeService. Raleigh, <strong>NC</strong>. 28 pp. + appendix.Cooper, J.E., R.A. Rulifson, J.J. Isely <strong>and</strong> S.E. Winslow. 1998. Food habits <strong>and</strong> growth<strong>of</strong> juvenile striped bass, Morone saxatilis, in Albemarle Sound, North Carolina.Estuaries. Vol. 21, No. 2, 307-317 p.Copel<strong>and</strong>, B.J., R.G. Hodson, S.R. Riggs <strong>and</strong> J.E. Easley, Jr. 1983. The ecology <strong>of</strong>Albemarle Sound, North Carolina: an estuarine pr<strong>of</strong>ile. U.S. Fish <strong>and</strong> WildlifeService, Division <strong>of</strong> Biological Services, Washington, D.C. FWS/OBS-83-01. 68 pp.Coutant, C.C. 1985. Striped bass temperature <strong>and</strong> dissolved oxygen: a speculativehypothesis for environmental risk. Transactions <strong>of</strong> the American Fisheries Society114:31-61.Coutant, C.C. <strong>and</strong> D.L. Benson. 1988. Linking estuarine water quality <strong>and</strong> impacts onliving resources: shrinking striped bass habitat in Chesapeake Bay <strong>and</strong> AlbemarleSound. U.S. <strong>Environment</strong>al Protection Agency, Office <strong>of</strong> Marine <strong>and</strong> EstuarineProtection, Washington, D.C. EPA Report 503/3-88-001. 39 pp.Coutant, C.C. <strong>and</strong> D.S. Carroll. 1980. Temperatures occupied by ten ultrasonic taggedstriped bass in freshwater lakes. Trans. Am. Fish. Soc. 109:195-202.Coutant, C.C., K.L. Zachman, D.K. Cox <strong>and</strong> B.L. Pearman. 1984. Temperatureselection by juvenile striped bass in laboratory <strong>and</strong> field. Trans. Am. Fish. Soc.109:195-202.Coutant, C.C., <strong>and</strong> R.J. Kedl. 1975. Survival <strong>of</strong> larval striped bass exposed to fluidinduced<strong>and</strong> thermal stresses in a simulated condenser tube. Publication 637. OakRidge National Laboratory, <strong>Environment</strong>al Science Division. 37 pp.Crayon, Porte. 1857. North Carolina illustrated-the fisheries. Harper's New MonthlyMagazine 14:439-440.Crochet, D.W., D.E. Allen <strong>and</strong> M.L. Hornberger. 1976. Commercial anadromous fisheryWaccamaw <strong>and</strong> Pee Dee Rivers. South Carolina Wildlife <strong>and</strong> Marine ResourcesDepartment, Division <strong>of</strong> Game <strong>and</strong> Freshwater Fish, Columbia, SC. Job CompletionReport 1 October 1973-30 December 1976. 113 pp.D<strong>and</strong>ar, R. 1998. Gill net selectivity for mullet related to fishing depth. North CarolinaSea Grant, <strong>Fishery</strong> Resource Grant, 97FEG-41. 48p.Darroch, J. N. 1961. The two-sample capture-recapture census when tagging <strong>and</strong>sampling are stratified. Biometrika 48:241-260.Davis, W.S. <strong>and</strong> J.E. Sykes. 1960. Commercial harvest <strong>and</strong> catch composition <strong>of</strong>striped bass in Albemarle Sound, North Carolina. National Marine FisheriesService, Atlantic Estuarine Fisheries Center. Beaufort, <strong>NC</strong>. 44 p.318
Dawson, M.A., E. Gould, F.P. Thurberg <strong>and</strong> A. Calabrese. 1977. Physiological response<strong>of</strong> juvenile striped bass, Morone saxatilis, to low levels <strong>of</strong> cadmium <strong>and</strong> mercury.Chesapeake Science 18(4):353-359.Diaby, S. 2000. An economic analysis <strong>of</strong> commercial fisheries in the Albemarle Sound<strong>Management</strong> Area, North Carolina. <strong>NC</strong> <strong>Dept</strong>. <strong>of</strong> Enviro. <strong>and</strong> Nat. Res., Div. Mar.Fish.Dickson, A.W. 1958. The status <strong>of</strong> striped bass (Roccus saxatalis)(Walbaum) in NorthCarolina waters. Proc. Annual Conf. Southeast. Assoc. Game Fish. Comm.11:264-268.Dilday, J.L. <strong>and</strong> S. E. Winslow. 2002. North Carolina striped bass monitoring. Comp.Rep. Proj. F-56, Seg. 4-8, <strong>NC</strong> <strong>Dept</strong>. Enviro. And Nat. Res., Div. Mar. Fish., 52p.Dorazio, R.M., K.A. Hattala, C.B., McCollough <strong>and</strong> J.E. Skjevel<strong>and</strong>. 1994. Tag recoveryestimates <strong>of</strong> migration <strong>of</strong> striped bass from spawning areas <strong>of</strong> the ChesapeakeBay. Transaction <strong>of</strong> the American Fisheries Society, 123:950-963.Dorazio, R.M. <strong>and</strong> P.J. Rago. 1991. Population dynamics <strong>of</strong> striped bass in theRoanoke River/Albemarle Sound Estuary: 1. Rates <strong>of</strong> total mortality <strong>and</strong>exploitation estimated from W.W. Hassler's tag recovery data. Interim report to theNorth Carolina Striped Bass Study <strong>Management</strong> Board, Project No. 91-7. U.S. Fish<strong>and</strong> Wildlife Service, National Fisheries Research Center. Leetown-Kearneysville,West Virginia.Doroshev, S.I. 1970. Biological features <strong>of</strong> the eggs, larvae, <strong>and</strong> young <strong>of</strong> the stripedbass [Roccus saxatilis (Walbaum)] in connection with the problem <strong>of</strong> itsacclimatization in the USSR. Journal <strong>of</strong> Ichthyology 10:235-248.Dovel, W.L. 1971. Fish eggs <strong>and</strong> larvae <strong>of</strong> the upper Chesapeake Bay. Special ReportNo. 4. University <strong>of</strong> Maryl<strong>and</strong>. 71 pp.Earll, R.E. 1887. North Carolina <strong>and</strong> its fisheries. Pages 475-497 [In] G.B. Goode, [ed.]Section II. The fisheries industries <strong>of</strong> the United States. US Commission <strong>of</strong> Fish<strong>and</strong> Fisheries, Washington, DC.Eldridge, M.B., J.A. Whipple, D. Eng, M.J. Bowers <strong>and</strong> B.M. Jarvis. 1981. Effects <strong>of</strong>food <strong>and</strong> feeding factors on laboratory-reared striped bass larvae. Transactions <strong>of</strong>the American Fisheries Society 110:111-120.Farley, T.C. 1966. Striped bass, Roccus saxatilis, spawning in the Sacramento-SanJoaquin River system, during 1963 <strong>and</strong> 1964. In J.L. Turner <strong>and</strong> D.W. Kelly,compilers. Ecological studies <strong>of</strong> the Sacramento-San Joaquin estuary. Part II.Fishes <strong>of</strong> the delta. California Department <strong>of</strong> Fish <strong>and</strong> Game <strong>Fishery</strong> Bulletin136:28-43.Fay, C.W., R.J. Neves <strong>and</strong> G.B. Pardue. 1983. Species pr<strong>of</strong>iles: life histories <strong>and</strong>environmental requirements <strong>of</strong> coastal fishes <strong>and</strong> invertebrates (Mid-Atlantic)--striped bass. U.S. Fish <strong>and</strong> Wildlife Service Biological Service Program319
FWS/OBS-82/11.8. U.S. Army Corps <strong>of</strong> Engineers, TR EL-82-4. 36 pp.Fischer, C.A. 1980. Anadromous fisheries research program. Cape Fear River system,Phase II. Completion Report, Project AFCS-15. N.C. Department <strong>of</strong> <strong>Natural</strong>Resources <strong>and</strong> Community Development, Division <strong>of</strong> Marine Fisheries. 65 pp.Fish, F.F. 1959. Report <strong>of</strong> the Steering Committee for Roanoke River studies, 1955-1958. U.S. Public Health Service. Raleigh <strong>NC</strong>.Forshage, A., W. Harvey, K. Kulzer, <strong>and</strong> L. Fries. 1986. <strong>Natural</strong> reproduction <strong>of</strong> whitebass x striped bass hybrids in a Texas reservoir. Proceeding Ann. Conf. <strong>of</strong> SEAssoc. <strong>of</strong> Fish <strong>and</strong> Wildlife Agencies 40: 9-14.Funderburk, S.L., S.J. Jordan, J.A. Mihursky <strong>and</strong> D. Riley (eds.). 1991. Habitatrequirements for Chesapeake Bay living resources. Second edition. ChesapeakeBay Estuary Program, U.S. Fish <strong>and</strong> Wildlife Service, Annapolis, MD.Gearhart, J.C. 2002. Interstate fisheries management program implementation for NorthCarolina: Study II: documentation <strong>and</strong> reduction <strong>of</strong> bycatch in North Carolinafisheries: Job 1. Hooking mortality <strong>of</strong> striped bass (Morone saxatilis) in AlbemarleSound, North Carolina. Job 4. Large mesh gill net discard mortality in RoanokeSound, Core Sound <strong>and</strong> Neuse River. <strong>NC</strong> <strong>Dept</strong>. Enviro. <strong>and</strong> Nat. Res., Div. Mar.Fish., Comp. Rep. NA87FG0367/1-3.Gregg, S.A. 1968. The fisheries <strong>of</strong> North Carolina. Master's Thesis, University <strong>of</strong> NorthCarolina, Chapel Hill.Guier, C.R., A.W. Mullis, J.W. Kornegay, S.G. Keefe, H.B. Johnson <strong>and</strong> M.K. Street.1980. Biological assessment <strong>of</strong> Albemarle Sound-Roanoke River striped bass.N.C. Wildlife Resources Commission <strong>and</strong> N.C. Division <strong>of</strong> Marine Fisheries.Raleigh. 16 pp.Haeseker, S.L., J.T. Carmichael <strong>and</strong> J.E. Hightower. 1996. Summer distribution <strong>and</strong>condition <strong>of</strong> striped bass within Albemarle Sound, North Carolina. Transactions <strong>of</strong>the American Fisheries Society, 125: 690-704.Hall, L.W., Jr., D.T. Burton, W.C. Graves <strong>and</strong> S.L. Margrey. 1984. Avoidance responses<strong>of</strong> estuarine fish exposed to heated dechlorinated power plant effluents.<strong>Environment</strong>al Science Technology 18(07):561-565.Harrell, R. M. <strong>and</strong> D. W. Webster. 1997. An overview <strong>of</strong> striped bass <strong>and</strong> hybrid stripedMorone culture, in: Striped Bass <strong>and</strong> Morone Culture (R. M. Harrell, ed.). ElsevierSci. Pub. Co., Amsterdam, pp. 1-10.Harrell, R.M. <strong>and</strong> J.D. Bayless. 1982. Effects <strong>of</strong> suboptimal dissolved oxygenconcentrations on developing striped bass embryos. Proc. Annual Conf.Southeast. Assoc. Fish. Wildl. Agencies 35:508-514.Harrell, R. M., J.H. Kerby, <strong>and</strong> R. V. Minton (eds.). 1990. Culture <strong>and</strong> propagation <strong>of</strong>striped bass <strong>and</strong> its hybrids. Striped Bass Committee, Southern Division,American Fisheries Society, Bethesda, Maryl<strong>and</strong>.320
Harrell, R. M., S. L. Xu, <strong>and</strong> B. Ely. 1993. Evidence <strong>of</strong> introgressive hybridization inChesapeake Bay Morone. Molecular Marine Biology <strong>and</strong> Biotechnology 2 (5):291-299.Harriss, R.C. Jr., B.L. Burns, H.B. Johnson, <strong>and</strong> R.A. Rulifson. 1985. An investigation <strong>of</strong>size, age, <strong>and</strong> sex <strong>of</strong> North Carolina striped bass. Completion Report, Project AFS-18.N.C. Department <strong>of</strong> <strong>Natural</strong> Resources <strong>and</strong> Community Development, Division <strong>of</strong>Marine Fisheries. Morehead City, <strong>NC</strong>. 136 p.Harriss, R.C., Jr. <strong>and</strong> B.L. Burns. 1983. An investigation <strong>of</strong> size, age, <strong>and</strong> sex <strong>of</strong> NorthCarolina striped bass. Annual Progress Report, Project AFC-18-2. N.C.Department <strong>of</strong> <strong>Natural</strong> Resources <strong>and</strong> Community Development, Division <strong>of</strong>Marine Fisheries, Morehead City, <strong>NC</strong>.Harriss, R.C., Jr., B.L. Burns <strong>and</strong> R.A. Rulifson. 1984. An investigation <strong>of</strong> size, age, <strong>and</strong>sex <strong>of</strong> North Carolina striped bass. Annual Progress Report, Project AFC-18-3.N.C. Department <strong>of</strong> <strong>Natural</strong> Resources <strong>and</strong> Community Development, Division <strong>of</strong>Marine Fisheries, Morehead City, <strong>NC</strong>.Harriss, R.C., Jr., B.L. Burns, H.B. Johnson <strong>and</strong> R.A. Rulifson. 1985. An investigation <strong>of</strong>size, age <strong>and</strong> sex <strong>of</strong> North Carolina striped bass. Compl. Rep., Proj. AFC-18. <strong>NC</strong><strong>Dept</strong>. Nat. Resour. And Community Develop., Div. Mar. Fish., 207p.Hassler, W.W. 1984. The Status <strong>and</strong> Abundance <strong>of</strong> Striped Bass, Morone saxatilis, inthe Roanoke River <strong>and</strong> Albemarle Sound, North Carolina, 1977-1981. NorthCarolina Division <strong>of</strong> Marine Fisheries. Completion Report for Project AFS-14.<strong>NC</strong>DMF Pub. No. 131.Hassler, W.W. <strong>and</strong> N. Maraveyias. 1988. The status, abundance, <strong>and</strong> exploitation <strong>of</strong>striped bass in the Roanoke River <strong>and</strong> Albemarle Sound, North Carolina, 1987.Department <strong>of</strong> Zoology, N.C. State University. Raleigh, <strong>NC</strong>. 33 p.Hassler, W. W. <strong>and</strong> S. D. Taylor. 1984. The status, abundance, <strong>and</strong> exploitation <strong>of</strong>striped bass in the Roanoke River <strong>and</strong> Albemarle Sound, North Carolina, 1982,1983. <strong>NC</strong> <strong>Dept</strong>. Nat. Res. And Comm. Dev., Div. Mar. Fish., Comp. Rep. ProjectAFC-19. <strong>NC</strong>DMF Pub. No. 136.Hassler, W.W. <strong>and</strong> S.D. Taylor. 1986. The status, abundance, <strong>and</strong> exploitation <strong>of</strong>striped bass in the Roanoke River <strong>and</strong> Albemarle Sound, North Carolina, 1985.Department <strong>of</strong> Zoology, N.C. State University. Raleigh, <strong>NC</strong>. 68 p.Hassler, W.W. <strong>and</strong> S.D. Taylor. 1988. The status, abundance, <strong>and</strong> exploitation <strong>of</strong>striped bass in the Roanoke River <strong>and</strong> Albemarle Sound, North Carolina, 1986.Department <strong>of</strong> Zoology, N.C. State University. Raleigh, <strong>NC</strong>. 50 p.Hassler, W.W., N.L. Hill <strong>and</strong> J.T. Brown. 1981. The status <strong>and</strong> abundance <strong>of</strong> stripedbass, Morone saxatilis, in the Roanoke River <strong>and</strong> Albemarle Sound, NorthCarolina, 1956-1980. Report to the North Carolina Department <strong>of</strong> <strong>Natural</strong>Resources <strong>and</strong> Community Development, Division <strong>of</strong> Marine Fisheries. Spec.Sci. Rep. 38.321
Hawkins, J.H. 1979. Anadromous fisheries research program - Neuse River. ProgressReport, Project AFCS-13-2. N.C. Department <strong>of</strong> <strong>Natural</strong> Resources <strong>and</strong>Community Development, Division <strong>of</strong> Marine Fisheries. 103 pp.Hawkins, J.H. 1980. Investigations <strong>of</strong> anadromous fishes <strong>of</strong> the Neuse River, NorthCarolina. Special Scientific Report No. 34. N.C. Department <strong>of</strong> <strong>Natural</strong> Resources<strong>and</strong> Community Development, Division <strong>of</strong> Marine Fisheries. 111 pp.Hawkins, J.H. 1981. Anadromous fisheries research program-Tar-Pamlico River.Attachment to Compl. Rep. For Proj. AFCS-13. <strong>NC</strong> <strong>Dept</strong>. Nat. Resour. AndCommunity Develop., Div. Mar. Fish., 26p.Heinle, D.R., D.A. Flemer <strong>and</strong> J.P. Ustach. 1975. Contribution <strong>of</strong> tidal marshl<strong>and</strong>s tomid-Atlantic food chains. Pp. 309-320 In M. Wiley, ed. Estuarine Processes. Vol.II. Circulation, sediments <strong>and</strong> transfer <strong>of</strong> material in the estuary. Academic Press,New York.Henry, L.T. 1987. Albemarle Sound gill net study. Compl. Rep., Proj. AFS-23, <strong>NC</strong> <strong>Dept</strong>.Nat. Resour. <strong>and</strong> Community Develop., Div Mar. Fish., 63p.Henry, L.T., H.C. Hardy <strong>and</strong> S.D. Taylor. 1991. <strong>Fishery</strong> independent gill net surveys forAlbemarle Sound striped bass: A characterization <strong>of</strong> the Albemarle/Roanokepopulation. Interim report to the North Carolina Striped Bass Study <strong>Management</strong>Board, Project No. 91-1. North Carolina Department <strong>of</strong> <strong>Environment</strong>, Health, <strong>and</strong><strong>Natural</strong> Resources, Division <strong>of</strong> Marine Fisheries. Morehead City, <strong>NC</strong>.Henry, L.T. <strong>and</strong> P.S. Phalen. 1994. Albemarle Sound creel survey. Compl. Rep. Proj. F-40. <strong>NC</strong> <strong>Dept</strong>. Enviro., Health <strong>and</strong> Nat. Resour., Div. Mar. Fish., 21p.Henry, L.T., S.D. Taylor <strong>and</strong> S.E. Winslow. 1992. North Carolina striped bass.Completion Report for Project AFS-26. North Carolina Department <strong>of</strong><strong>Environment</strong>, Health, <strong>and</strong> <strong>Natural</strong> Resources, Division <strong>of</strong> Marine Fisheries.Morehead City, <strong>NC</strong>.Herndon, T.M., Jr., B.E. Hammers, <strong>and</strong> C.T. Waters. 2000. Striped bass spawning stocksurvey for Neuse River, 1998-1999. North Carolina Wildlife ResourcesCommission, Raleigh.Hewitt, D.A. <strong>and</strong> J.E. Hightower. 2002. Use <strong>of</strong> fishwheels for sampling anadromousfishes in southeastern coastal rivers. Final report to US Fish <strong>and</strong> Wildlife Service<strong>and</strong> Dominion Generation. North Carolina Cooperative Fish <strong>and</strong> WildlifeResearch Unit, <strong>NC</strong> State University, Raleigh.Hightower, J.E. 2001. Prioritizing habitat restoration efforts for anadromous fish in NorthCarolina. . U.S. Geological Survey, Biological Resources Division, North CarolinaCooperative Fish <strong>and</strong> Wildlife Research Unit, Department <strong>of</strong> Zoology, <strong>NC</strong> StateUniversity, Raleigh. 12 pp. + figures.Hill, J., J.W. Evans <strong>and</strong> M.J. Van Den Avyle. 1989. Species pr<strong>of</strong>iles: Life histories <strong>and</strong>environmental requirements <strong>of</strong> coastal fishes <strong>and</strong> invertebrates (South Atlantic) --Striped Bass. Biological Report 82(11.118), U.S. Department <strong>of</strong> the Interior, Fish322
<strong>and</strong> Wildlife Service, Washington, DC. 35 pp.Holl<strong>and</strong>, B.F. <strong>and</strong> G.F. Yelverton. 1973. Distribution <strong>and</strong> biological studies <strong>of</strong>anadromous fishes <strong>of</strong>fshore North Carolina. N.C. Department <strong>of</strong> <strong>Natural</strong> <strong>and</strong>Economic Resources, Division <strong>of</strong> Commercial <strong>and</strong> Sport Fisheries. MoreheadCity, <strong>NC</strong>. 156 p.Hollis, E.H. 1967. Investigation <strong>of</strong> striped bass in Maryl<strong>and</strong>. Maryl<strong>and</strong> Department <strong>of</strong>Game <strong>and</strong> Inl<strong>and</strong> Fisheries, Report No. MD F-003-R-12. 96 pp.Humphries, E.T. 1966. Spawning grounds <strong>of</strong> the striped bass in the Tar River, NorthCarolina. Master's Thesis, East Carolina College. 50 pp.Jenkins, R.E. <strong>and</strong> N.M. Burkhead. 1993. Freshwater fishes <strong>of</strong> Virginia. AmericanFisheries Society, Bethesda, MD. 1079 pp.Johnson, H.B., B.F. Holl<strong>and</strong>, Jr. <strong>and</strong> S.G. Keefe. 1977. Anadromous FisheriesResearch Program, Northern Coastal Area. Completion Report, Project AFCS-11, N.C. Department <strong>of</strong> <strong>Natural</strong> <strong>and</strong> Economic Resources, Division <strong>of</strong> MarineFisheries. Morehead City, <strong>NC</strong>. 97+41+7 p.Johnson, H.B., S.E. Winslow, D.W. Crocker, B.F. Holl<strong>and</strong>, Jr., J.W. Gillikin, D.L. Taylor(North Carolina), J.G. Loesch, W.H. Kriete, Jr., J.G. Travelstead, E.J. Foell <strong>and</strong>M.A. Hennigar (Virginia). 1981. Biology <strong>and</strong> management <strong>of</strong> mid-Atlanticanadromous fishes under extended jurisdiction. <strong>NC</strong> <strong>Dept</strong>. Nat. Resour. AndCommunity Develop., Div. Mar. Fish. And Virginia Inst. Mar. Sci.; Spec. Sci. rep.No. 36, 204 p.Johnson, J. C. <strong>and</strong> M. K. Orbach. 1996. Effort management in North Carolina fisheries:a total systems approach. Fisheries research reports to the Fisheries MoratoriumSteering Committee, North Carolina Sea Grant College Program, U<strong>NC</strong>-SC-96-08, Institute for Coastal <strong>and</strong> Marine Resources, East Carolina University,Technical Report 96-07.Keefe, S.G. 1995. Evaluate larger-mesh gill net catch <strong>of</strong> flounders <strong>and</strong> reduced bycatch<strong>of</strong> striped bass. North Carolina Sea Grant, <strong>Fishery</strong> Resource Grant, 96FEG-89.11p.Kernehan, R.J., M.R. Headrick <strong>and</strong> R.E. Smith. 1981. Early life history <strong>of</strong> striped bass inthe Chesapeake <strong>and</strong> Delaware Canal <strong>and</strong> vicinity. Transactions <strong>of</strong> the AmericanFisheries Society 110:137-150.Kerr, J.E. 1953. Studies on fish preservation at the Contra Costa Steam <strong>Plan</strong>t <strong>of</strong> thePacific Gas <strong>and</strong> Electric Company. California Department <strong>of</strong> Fish <strong>and</strong> Game FishBulletin 92. 66 pp.Klauda, R.J., W.P. Dey, T.B. H<strong>of</strong>f, <strong>and</strong> J.B. McLaren. 1980. Biology <strong>of</strong> Hudson Riverjuvenile striped bass. Fifth Annual Recreational Fisheries Symposium, March1980. Boston, MA, Sport Fishing Institute.Kornegay, J.W. 1988. Preliminary assessment <strong>of</strong> summer habitat conditions from323
striped bass in Albemarle Sound. N.C. Wildlife Resources Commission, Division<strong>of</strong> Boating <strong>and</strong> Inl<strong>and</strong> Fisheries, Raleigh, <strong>NC</strong>. Final Report, Federal Aid in FishRestoration Project f-22. 14 pp.Kornegay, J.W. <strong>and</strong> E.T. Humphries. 1975. Spawning <strong>of</strong> the striped bass in the TarRiver, North Carolina. Proceedings <strong>of</strong> the 29 th Annual Conference, SoutheasternAssociation <strong>of</strong> Game <strong>and</strong> Fish Commissioners. pp. 317-325.Kornegay, J.W. <strong>and</strong> T. W. Jones. 1995. A report on the Roanoke River fish kills, 25July-2 August 1995. North Carolina Wildlife Resources Commission, Division <strong>of</strong>Boating <strong>and</strong> Inl<strong>and</strong> Fisheries, Raleigh.Krouse, J.S. 1968. Effects <strong>of</strong> dissolved oxygen, temperature, <strong>and</strong> salinity on survival <strong>of</strong>young striped bass, Roccus saxatilis (Walbaum). M.S. Thesis, North CarolinaState University, Raleigh. 100 pp.Lal, K., R. Lasker <strong>and</strong> A. Kuljis. 1977. Acclimation <strong>and</strong> rearing <strong>of</strong> striped bass larvae insea water. California Fish <strong>and</strong> Game 63:210-218.Laney, R.W. 1984. Great Coharie Creek Flood Control Project Fish <strong>and</strong> WildlifeCoordination Act Report. U.S. Fish <strong>and</strong> Wildlife Service, Ecological Services,Raleigh, <strong>NC</strong>.Laney, R.W., J.W. Kornegay, J.E. Hightower, J.E. Ellis, D.J. Newcomb, P. Brownell,S.E. Winslow <strong>and</strong> D. Wilson. 2001. Roanoke River diadromous fish restorationplan. US Department <strong>of</strong> the Interior, Fish <strong>and</strong> Wildlife Service, EcologicalServices Field Office <strong>and</strong> South Atlantic Fisheries Coordination Office, Raleigh,<strong>NC</strong>.Leahy, T.M., III. 1992. Comments on “Instream flow <strong>and</strong> striped bass recruitment in thelower Roanoke River, North Carolina” by L.H. Zincone, Jr. <strong>and</strong> R.A. Rulifson.Rivers 3(2): 106-113.Leary, W.J. 1915. The fisheries <strong>of</strong> eastern North Carolina. The North Carolina Booklet14:173-191.Lefler, H.T. 1967. A new voyage to Carolina by John Lawson. The University <strong>of</strong> NorthCarolina Press, Chapel Hill, <strong>NC</strong>.Lewis, R.M. 1962. Sexual maturity as determined from ovum diameters in striped bassfrom North Carolina. Transactions <strong>of</strong> the American Fisheries Society 91:279-282.Lewis, R.M. <strong>and</strong> R.R. Bonner, Jr. 1966. Fecundity <strong>of</strong> the striped bass, Roccus saxatilis(Walbaum). Transactions American Fisheries Society 91:279-282.M. A. Mallin, M. H. Posey, T. E. Lankford, M. R. McIver, S. H. Ensign, T. D. Alphin, M.S. Williams, M. L. Moser, <strong>and</strong> J. F. Merrit. 2001. <strong>Environment</strong>al assessment <strong>of</strong>the lower Cape Fear River system. CMS Report No. 01-01, October, 140 p.Manooch, C.S.,III. 1973. Food habits <strong>of</strong> yearling <strong>and</strong> adult striped bass, Moronesaxatilis (Walbaum), from Albemarle Sound, North Carolina. ChesapeakeScience 14:73-86.324
Manooch, C.S., III <strong>and</strong> R.A. Rulifson (eds.). 1989. Roanoke River water flow committeereport: A recommended water flow regime for the Roanoke River, North Carolina,to benefit anadromous striped bass <strong>and</strong> other below-dam resources <strong>and</strong> users.NOAA Technical Memor<strong>and</strong>um NMFS-SEFC-216:1-224.Mansueti, R.J. 1958. Eggs, larvae, <strong>and</strong> young <strong>of</strong> the striped bass, Roccus saxatilis.Chesapeake Biological Laboratory Contribution 112. 35 pp.Mansueti, R.J. 1961. Age, growth, <strong>and</strong> movements <strong>of</strong> the striped bass, Roccus saxatilis,taken in size selectivity fishing gear in Maryl<strong>and</strong>. Chesapeake Science 2:9-36.Mansueti, R.J. 1962. Effects <strong>of</strong> civilization on striped bass <strong>and</strong> other estuarine biota inChesapeake Bay <strong>and</strong> tributaries. In Proceedings <strong>of</strong> the Gulf <strong>and</strong> CaribbeanFisheries Institute, 14th Annual Session. pp. 110-136.Mansueti, R.J. <strong>and</strong> E.H. Hollis. 1963. Striped bass in Maryl<strong>and</strong> tidewater. University <strong>of</strong>Maryl<strong>and</strong> <strong>Natural</strong> Resources Institute, Education Service 61. 28 pp.Markle, D.F. <strong>and</strong> G.C. Grant. 1970. The summer food habits <strong>of</strong> young-<strong>of</strong>-the-yearstriped bass in three Virginia rivers. Chesapeake Science 5:3-45.Marshall, M.D. 1976. Anadromous Fisheries Research Program - Tar River, PamlicoRiver <strong>and</strong> Northern Pamlico Sound. Completion Report, Project AFCS-10. N.C.Department <strong>of</strong> <strong>Natural</strong> <strong>and</strong> Economic Resources, Division <strong>of</strong> Marine Fisheries.90 pp.Marshall, M.D. 1977. Anadromous Fisheries Research Program - Neuse River. AnnualReport, Project AFCS-13-1. N.C. Department <strong>of</strong> <strong>Natural</strong> <strong>and</strong> EconomicResources, Division <strong>of</strong> Marine Fisheries. 81 pp.May, O.D., Jr. <strong>and</strong> J.C. Fuller, Jr. 1965. A study on striped bass egg production in theCongaree <strong>and</strong> Wateree Rivers. Proc Annual Conf. Southeast. Assoc. Game FishComm. 16:285-301.McCoy, E.G. 1959. Quantitative sampling <strong>of</strong> striped bass, Roccus saxatilis (Walbaum)eggs in the Roanoke River, North Carolina. M.S. thesis, N.C. State University.Raleigh, <strong>NC</strong>. 136 p.McIlwain, T.D. 1980. Striped bass in coastal waters, South Atlantic <strong>and</strong> Gulf. Pp. 37-43In H. Clepper, ed. Marine Recreational Fisheries. Vol. 5. Proc. <strong>of</strong> the Fifth AnnualMarine Recreational Fisheries Symposium, Boston, MA.Mehrle, P.M., L. Clevel<strong>and</strong> <strong>and</strong> D.R. Buckler. 1987. Chronic toxicity <strong>of</strong> an environmentalcontaminant mixture to young or larval striped bass. Water Air Soil Pollution35:107-118.Meldrim, J.W. <strong>and</strong> J.J. Gift. 1971. Temperature preference, avoidance, <strong>and</strong> shockexperiments with estuarine fishes. Ichthyology Association Bulletin 7. 75 pp.Menhinick, E.F. 1991. The freshwater fishes <strong>of</strong> North Carolina. North Carolina WildlifeResources Commission, Raleigh, <strong>NC</strong>. 227 pp.Merriman, D. 1941. Studies on the striped bass (Roccus saxatilis) <strong>of</strong> the Atlantic Coast.325
U.S. Fish <strong>and</strong> Wildlife Service, Fish. Bull. 50(35): 1-77.Mihursky, J.A., W.R. Boynton, E.M. Setzler-Hamilton, <strong>and</strong> K.V. Wood. 1981. Freshwaterinfluences on striped bass population dynamics. Pp. 149-167 in R.D. Cross <strong>and</strong>D.L. Williams (eds.). Proceedings <strong>of</strong> the National Symposium on FreshwaterInflow to Estuaries. Volume I. US Department <strong>of</strong> the Interior, Fish <strong>and</strong> Wildlifeservice, Washington, DC. Report FWS/OBS-81/04:1-525.Mihursky, J.A., W.R. Boynton, E.M. Setzler, K.V. Wood, H.H. Zion, E.W. Gordon, L.Tucker, P. Pulles, <strong>and</strong> J. Leo. 1976. Final report on Potomac Estuary fisheriesstudy: Ichthyoplankton <strong>and</strong> juvenile investigations. University <strong>of</strong> Maryl<strong>and</strong> Center<strong>of</strong> <strong>Environment</strong>al Estuary Studies, <strong>Natural</strong> Resources Institute Reference No. 76-12-CBL. 241 pp.Monroe, R.J. 1991. Reconciliation <strong>of</strong> the striped bass juvenile abundance indices by<strong>NC</strong>SU <strong>and</strong> N.C. Division <strong>of</strong> Marine Fisheries for years 1982-1987. In: NOAATechnical Memor<strong>and</strong>um NMFS-SEFC-291.Morgan, R.P., II, <strong>and</strong> V.J. Rasin, Jr. 1973. Effects <strong>of</strong> salinity <strong>and</strong> temperature on thedevelopment <strong>of</strong> eggs <strong>and</strong> larvae <strong>of</strong> striped bass <strong>and</strong> white perch. ChesapeakeBay Institute <strong>of</strong> <strong>Natural</strong> Resources Reference No. 73-110. 21 pp.Morgan, R.P., II, V.J. Rasin, Jr. <strong>and</strong> R.L. Copp. 1981. Temperature <strong>and</strong> salinity effectson development <strong>of</strong> striped bass eggs <strong>and</strong> larvae. Transactions <strong>of</strong> the AmericanFisheries Society 110:95-99.Moser, M.L. <strong>and</strong> S.W. Ross. 1993. Distribution <strong>and</strong> movements <strong>of</strong> shortnose sturgeon(Acipenser brevirostrum) <strong>and</strong> other anadromous fishes <strong>of</strong> the lower Cape FearRiver, North Carolina. Final Report to the U.S. Army Corps <strong>of</strong> Engineers,Wilmington District. N.C. Cooperative Fish <strong>and</strong> Wildlife Research Unit, N.C. StateUniversity, Raleigh. 156 pp.Mulligan, J., C. Metz, D. Holsinger, R. Swanek, D. Safrit, J. Sauber, N. Bedwell <strong>and</strong> S.Gillaspie. 1993. Water quality <strong>of</strong> the lower Roanoke River basin, pp. 37-59. InRulifson, R.A. <strong>and</strong> C.S. Manooch, III (eds.). 1993. Roanoke River Water FlowCommittee Report for 1991-1993. Albemarle-Pamlico Estuarine Study, Raleigh,<strong>NC</strong>, Project No. APES 93-18.Mullis, A.W. <strong>and</strong> C.R. Guier. 1982. Sport fishery harvest <strong>and</strong> effort on Albemarle Sound,North Carolina. Proc. Annual Conf. Southeast. Assoc. Fish Wildl. Agencies36:224-240.Murawski, W.S. 1969. The distribution <strong>of</strong> striped bass, Roccus saxatilis, eggs <strong>and</strong>larvae in the lower Delaware River. N.J. Department <strong>of</strong> Conservation <strong>and</strong>Economic Development, Division <strong>of</strong> Fish <strong>and</strong> Game, Nacote Creek ResearchStation. Misc. Report 1M. 39 pp.<strong>NC</strong> Division <strong>of</strong> Coastal <strong>Management</strong>. 1999. DCM wetl<strong>and</strong> mapping in coastal NorthCarolina. <strong>NC</strong> <strong>Dept</strong>. Enviro. <strong>and</strong> Nat. Res., Raleigh. 33p.<strong>NC</strong> Division <strong>of</strong> Marine Fisheries. 1997. Assessment <strong>of</strong> North Carolina commercial326
finfisheries. <strong>NC</strong> <strong>Dept</strong>. Enviro., Health <strong>and</strong> Nat. Resour., Compl. Report 2-IJ-51,354 p.<strong>NC</strong> Division <strong>of</strong> Marine Fisheries. 2002. Application for individual take permit under theEndangered Species Act <strong>of</strong> 1973. 33p.<strong>NC</strong> Division <strong>of</strong> Water Quality. 1996. Roanoke River basinwide water qualitymanagement plan. <strong>NC</strong> <strong>Dept</strong>. Enviro. <strong>and</strong> Nat. Res., Div. Water Quality, WaterQuality Sec., Raleigh. 280 pages.<strong>NC</strong> Division <strong>of</strong> Water Quality. 1997. Chowan River basinwide water qualitymanagement plan. <strong>NC</strong> <strong>Dept</strong>. Enviro. <strong>and</strong> Nat. Res., Div. Water Quality, WaterQuality Sec., Raleigh. 276 pages.<strong>NC</strong> Division <strong>of</strong> Water Quality. 1997. Pasquotank River basinwide water qualitymanagement plan. . <strong>NC</strong> <strong>Dept</strong>. Enviro. <strong>and</strong> Nat. Res., Div. Water Quality, WaterQuality Sec., Raleigh. 294 pages.<strong>NC</strong> Division <strong>of</strong> Water Quality. 1998. North Carolina Division <strong>of</strong> Water Quality annualreport <strong>of</strong> fish kill events 1998. N. C. Department <strong>of</strong> <strong>Environment</strong>, Health, <strong>and</strong><strong>Natural</strong> Resources, Raleigh. 24 pages.<strong>NC</strong> Division <strong>of</strong> Water Quality. 1999a. Neuse River basinwide water quality plan. <strong>NC</strong><strong>Dept</strong>. Enviro. <strong>and</strong> Nat. Res., Div. Water Quality, Water Quality Sec., Raleigh. 214pp.+ append.<strong>NC</strong> Division <strong>of</strong> Water Quality. 1999b. Tar-Pamlico River basinwide water quality plan.<strong>NC</strong> <strong>Dept</strong>. Enviro. <strong>and</strong> Nat. Res., Div. Water Quality, Water Quality Sec., Raleigh.165 pp.+ append.<strong>NC</strong> Division <strong>of</strong> Water Quality. 2000. Cape Fear River basinwide water quality plan. <strong>NC</strong><strong>Dept</strong>. Enviro. <strong>and</strong> Nat. Res., Div. Water Quality, Water Quality Sec., Raleigh. 274pp. + append.<strong>NC</strong> Division <strong>of</strong> Water Quality. 2001a. Basinwide assessment report-Chowan Riverbasin. <strong>NC</strong> <strong>Dept</strong>. Enviro. <strong>and</strong> Nat. Res., Div. Water Quality, Enviro. Sci. Branch,Raleigh.<strong>NC</strong> Division <strong>of</strong> Water Quality. 2001b. Draft Chowan River basinwide water quality plan.<strong>NC</strong> <strong>Dept</strong>. Enviro. <strong>and</strong> Nat. Res., Div. Water Quality, Water Quality Sec., Raleigh.118 pp. + append.<strong>NC</strong> Division <strong>of</strong> Water Quality. 2001c. Roanoke River basinwide water quality plan. <strong>NC</strong><strong>Dept</strong>. Enviro. <strong>and</strong> Nat. Res., Div. Water Quality, Water Quality Sec., Raleigh. 181pp. + append.Nelson, K.L. 1991. Striped Bass 1990: Age composition <strong>and</strong> sport harvest from theRoanoke River (1988-1990). In: NOAA Technical Memor<strong>and</strong>um NMFS-SEFC-291.Nelson, K.L. 1998. Catch-<strong>and</strong>-release mortality <strong>of</strong> striped bass in the Roanoke River,North Carolina. North American Journal <strong>of</strong> Fisheries <strong>Management</strong>. 18(1):25-30.327
Nelson, K.L. <strong>and</strong> A.W. Mullis. 1990. Age composition, (1988), <strong>and</strong> sport harvest, (1988-1989), <strong>of</strong> striped bass from the Roanoke River. In: NOAA TechnicalMemor<strong>and</strong>um NMFS-SEFC-256.Nelson, K.L. <strong>and</strong> J.W. Kornegay. 1991. Roanoke River striped bass spawning stockassessment. Report to the North Carolina Striped Bass Study <strong>Management</strong>Board, Project No. 91-10. North Carolina Wildlife Resources Commission.Raleigh, <strong>NC</strong>.Nichols, P.R. <strong>and</strong> R.P. Cheek. 1966. Tagging summary <strong>of</strong> American shad, Alosasapidissima (Wilson) <strong>and</strong> striped bass, Morone saxatilis (Walbaum). Bureau <strong>of</strong>Commercial Fisheries, Biological Laboratory, Beaufort, <strong>NC</strong>, 1950-65. US Fish<strong>and</strong> Wildlife Service, SSR No. 539, 8p.North Carolina Coastal Federation. 1997. State <strong>of</strong> the coast report 15(4). 19p.North Carolina Department <strong>of</strong> conservation <strong>and</strong> Development. 1947. Rules <strong>and</strong>regulations relative to the commercial fisheries <strong>of</strong> North Carolina, 1947.North Carolina Department <strong>of</strong> Conservation <strong>and</strong> Development 1955. Laws <strong>and</strong>Subchapter IV <strong>of</strong> Chapter 113 <strong>of</strong> the General Statutes <strong>of</strong> North Carolina.North Carolina Department <strong>of</strong> Conservation <strong>and</strong> Development. 1965. Commercialfisheries rules <strong>and</strong> regulations 1965.North Carolina Department <strong>of</strong> <strong>Environment</strong>, Health, <strong>and</strong> <strong>Natural</strong> Resources. 1991.Albemarle-Pamlico Estuarine Study: fish tissue baseline study. Report No. 91-05.Division <strong>of</strong> <strong>Environment</strong>al <strong>Management</strong>, Water Quality Section. 119 pp.North Carolina Department <strong>of</strong> <strong>Environment</strong> <strong>and</strong> <strong>Natural</strong> Resources. 2003. NorthCarolina fisheries regulations for coastal waters- 2003. <strong>NC</strong> <strong>Dept</strong>. Environ. <strong>and</strong>Nat. Res., Marine Fisheries Commission, Morehead City, <strong>NC</strong>, 297p.North Carolina Division <strong>of</strong> <strong>Environment</strong>al <strong>Management</strong>. 1990. Fish tissue dioxin levelsin North Carolina. Water Quality Section, Raleigh. 35 pp. + appendices.North Carolina Division <strong>of</strong> <strong>Environment</strong>al <strong>Management</strong>. 1991. 1990 update: fish tissuedioxin levels in North Carolina. Water Quality Section, Raleigh. 26 pp. +appendices.North Carolina Division <strong>of</strong> Marine Fisheries. 1997. An estimate <strong>of</strong> striped bass gill netbycatch discards in the Albemarle Sound <strong>Management</strong> Area from 1994-1996. <strong>NC</strong><strong>Dept</strong>. Enviro. <strong>and</strong> Nat. Res., Div. Mar. Fish., 9p.North Carolina Division <strong>of</strong> Marine Fisheries. 1998. Review <strong>of</strong> striped bass fisheries <strong>and</strong>monitoring programs in North Carolina-1997. Report to ASMFC Striped BassTechnical Committee. <strong>NC</strong> <strong>Dept</strong>. Enviro. <strong>and</strong> Nat. Res., Div. Mar. Fish., 44p.North Carolina Division <strong>of</strong> Marine Fisheries. 1999. Review <strong>of</strong> striped bass fisheries <strong>and</strong>monitoring programs in North Carolina-1998. Report to ASMFC Striped BassTechnical Committee. <strong>NC</strong> <strong>Dept</strong>. Enviro. <strong>and</strong> Nat. Res., Div. Mar. Fish., 40p.North Carolina Division <strong>of</strong> Marine Fisheries. 2000. Review <strong>of</strong> striped bass fisheries <strong>and</strong>328
monitoring programs in North Carolina-2000. Report to ASMFC Striped BassTechnical Committee. <strong>NC</strong> <strong>Dept</strong>. Enviro. <strong>and</strong> Nat. Res., Div. Mar. Fish., 49p.North Carolina Division <strong>of</strong> Marine Fisheries. 2001. Review <strong>of</strong> striped bass fisheries <strong>and</strong>monitoring programs in North Carolina-1999. Report to ASMFC Striped BassTechnical Committee. <strong>NC</strong> <strong>Dept</strong>. Enviro. <strong>and</strong> Nat. Res., Div. Mar. Fish., 47p.North Carolina Division <strong>of</strong> Marine Fisheries. 2003. North Carolina charter license (ForHire) Information Paper. January 16, 2003.North Carolina Division <strong>of</strong> Marine fisheries. 2003. North Carolina recreational use <strong>of</strong>commercial gear, pilot study. Progress report #1, <strong>NC</strong> <strong>Dept</strong>. Enviro. <strong>and</strong> Nat.Res., Div. Mar. Fish., 145p.North Carolina Division <strong>of</strong> Marine Fisheries. In preparation. DENR Draft Coastal HabitatProtection <strong>Plan</strong>. Morehead City, <strong>NC</strong>.North Carolina Striped Bass Study <strong>Management</strong> Board. 1992. Report on the AlbemarleSound-Roanoke River stock <strong>of</strong> striped bass. U.S. Fish <strong>and</strong> Wildlife Service,Washington DC. 56 pp. + appendices.Odom, M. C., R. J. Neves, <strong>and</strong> J. J. Ney. 1986. An assessment <strong>of</strong> anadromous fishmigrations in the Chowan River drainage, Virginia. Final Report. United StatesFish <strong>and</strong> Wildlife Service, Office <strong>of</strong> Information Transfer, Fort Collins, ColoradoOlsen, E.J. <strong>and</strong> R.A. Rulifson. 1991. Maturation <strong>and</strong> fecundity <strong>of</strong> RoanokeRiver/Albemarle Sound striped bass (Morone saxatilis). Completion Report toN.C. Striped Bass <strong>Management</strong> Board, Morehead City, <strong>NC</strong>. 43 pp.O'Rear, C.W., Jr. 1973. The toxicity <strong>of</strong> zinc <strong>and</strong> copper to striped bass eggs <strong>and</strong> fry withmethods for providing confidence limits. Proceedings <strong>of</strong> the Annual ConferenceSoutheastern Association <strong>of</strong> Game <strong>and</strong> Fish Commissions 26:484-489Otwell, W.S. <strong>and</strong> J.V. Merriner. 1975. Survival <strong>and</strong> growth <strong>of</strong> juvenile striped bass,Morone saxatilis, in a factorial experiment with temperature, salinity, <strong>and</strong> age.Transactions <strong>of</strong> the American Fisheries Society 104:560-566.Palawski, D., J.B. Hunn <strong>and</strong> F.J. Dwyer. 1985. Sensitivity <strong>of</strong> young striped bass,Morone saxatilis, to organic <strong>and</strong> inorganic contaminants in fresh <strong>and</strong> salinewaters. Transactions <strong>of</strong> the American Fisheries Society 114:748-753.Pate, P.P. 1975. Anadromous Fisheries Research Program - Tar River, Pamlico River<strong>and</strong> Northern Pamlico Sound. Annual Report, Project AFCS-10-1. N.C.Department <strong>of</strong> <strong>Natural</strong> <strong>and</strong> Economic Resources, Division <strong>of</strong> Marine Fisheries.69 pp.Patrick, W. S. <strong>and</strong> E. J. Stellwag. 2001. Genetic analysis <strong>of</strong> anadromous striped bass inNorth Carolina. Final report to <strong>NC</strong>WRC Cooperative Projects with UniversitiesProj. No. F68-02.Patrick, W.S., <strong>and</strong> M.L. Moser. 2001. Potential competition between hybrid striped bass(Morone saxatilis X M. Americana) <strong>and</strong> striped bass (M. saxatilis) in the Cape329
Fear River estuary, North Carolina. Estuaries 24:425-429.Pearson, J.C. 1938. The life history <strong>of</strong> the striped bass, or rockfish, Roccus saxatilis(Walbaum). U.S. Bureau <strong>of</strong> Fisheries Bulletin 49:825-860.Phalen, P.S. 1988. Evaluation <strong>of</strong> juvenile striped bass surveys in Albemarle Sound, <strong>NC</strong>.N.C. Department <strong>of</strong> <strong>Natural</strong> Resources <strong>and</strong> Community Development, Division <strong>of</strong>Marine Fisheries, Morehead City. 8 pp.P<strong>of</strong>f, N.L., J.D. Allan, M.B. Bain, J.R. Karr, K.L. Prestegard, B.D. Richter, R.E. Sparks,<strong>and</strong> J.C. Stromberg. 1997. The natural flow regime: a paradigm for riverconservation <strong>and</strong> restoration. Bioscience 47(11): 769-784.Polgar, T., E. Elanowicz <strong>and</strong> A. Pyne. 1975. Preliminary analyses <strong>of</strong> physical transport<strong>and</strong> related striped bass ichthyoplankton distribution properties in the PotomacRiver in 1974. Potomac River Fish. Prog. Rep. Ser. Ref. No. PRFP-75-2. 51 pp.Polgar, T., J.A. Mihursky, R.E. Ulanowicz, R.P. Morgan II <strong>and</strong> J.S. Wilson. 1976. Ananalysis <strong>of</strong> 1974 striped bass spawning success in the Potomac estuary. Pp.151-165 In M. Wiley, Ed. Estuarine Processes, Vol. I. Uses, Stresses <strong>and</strong>Adaptation to the Estuary. Academic Press, Inc., New York.Price, A.B. <strong>and</strong> R.A. Rulifson. 2000. Characterization <strong>of</strong> small mesh gill net bycatch inupper Currituck Sound, North Carolina. North Carolina Sea Grant, <strong>Fishery</strong>Resource Grant, 00FRG-08. 69p.Raney, E.C. 1952. The life history <strong>of</strong> the striped bass, Roccus saxatilis (Walbaum). Bull.Bingham Oceanogr. Collect., Yale University 14(1):5-97.Raney, E.C. 1957. Subpopulations <strong>of</strong> the striped bass Roccus saxatilis (Walbaum), intributaries <strong>of</strong> Chesapeake Bay. Pp. 85-107 In J.C. Marr, Coordinator.Contributions to the study <strong>of</strong> subpopulations <strong>of</strong> fishes. U.S. Fish <strong>and</strong> WildlifeService, Special Scientific Report-Fisheries 208.Rathjen, W.F. <strong>and</strong> L.C. Miller. 1957. Aspects <strong>of</strong> the early life history <strong>of</strong> the striped bass(Roccus saxatilis) in the Hudson River. New York Fish Game Journal 4:43-60.Regan, D.M., T.L. Wellborn, Jr. <strong>and</strong> R.G. Bowker. 1968. Striped bass, Roccus saxatilis(Walbaum), development <strong>of</strong> essential requirements for production. U.S. Fish <strong>and</strong>Wildlife Service, Bureau <strong>of</strong> Sport Fisheries <strong>and</strong> Wildlife, Division <strong>of</strong> Fisheries <strong>and</strong>Hatcheries. Atlanta, GA. 133 pp.Richkus, W. <strong>and</strong> P. Jacobson. 1990. Estimation <strong>of</strong> mean weight <strong>of</strong> captured fish <strong>and</strong>catch per unit effort in the Roanoke River-Albemarle Sound fishery. Report toDepartment <strong>of</strong> Public Utilities, City <strong>of</strong> Virginia Beach. Virginia Beach, Virginia.Richter, B.D., J.V. Baumgartner, J. Powell <strong>and</strong> D.P. Braun. 1996. A method forassessing hydrologic alteration within ecosystems. Conservation Biology 10(4):1163-1174.Richter, B.D., J.V. Baumgartner, R. Wigington <strong>and</strong> D.P. Braun. 1997. How much waterdoes a river need? Freshwater Biology 37: 231-249.330
Ricker, W.E. 1940. Relation <strong>of</strong> “catch per unit effort” to abundance <strong>and</strong> rate <strong>of</strong>exploitation. Journal <strong>of</strong> Fisheries Research Board, Canada V. 5(1): 43-70.Ritchie, D.E. <strong>and</strong> T.S.Y. Koo. 1968. Movement <strong>of</strong> juvenile striped bass in the estuary asdetermined by tagging <strong>and</strong> recapture. Chesapeake Biol. Lab. Report No. 68-31.1 p.Robins, C.R., R.M. Bailey, C.E. Bond, J.R. Brooker, E.A. Lachner, R.N. Lea <strong>and</strong> W.B.Scott. 1991. Common <strong>and</strong> scientific names <strong>of</strong> fishes from the United States <strong>and</strong>Canada. American Fisheries Society. Special Publication 20. 183 pp.Rogers, B.A., D.T. Westin <strong>and</strong> S.B. Saila. 1977. Life stage duration studies on HudsonRiver striped bass. University <strong>of</strong> Rhode Isl<strong>and</strong>, Applied Marine Resources Group,NOAA Sea Grant, Mar. Tech. Rep. 31. 111 pp.Rose, T.L. 2000. Migratory bird bycatch in submerged v/s floating shad gill nets. NorthCarolina Sea Grant, <strong>Fishery</strong> Resource Grant, 99-FEG-34. 30p.Rose, T.L. 2001. Migratory bird bycatch in submerged v/s floating shad gill nets. NorthCarolina Sea Grant, <strong>Fishery</strong> Resource Grant, 00-FEG-22. 51p.Rose, T. L. 2002. Migratory bird bycatch in submerged v/s floating shad gill nets. NorthCarolina Sea Grant, <strong>Fishery</strong> Resource Grant, 01-FEG-04. 59p.Rozengurt, M.A. <strong>and</strong> I. Haydock. 1994. The role <strong>of</strong> inl<strong>and</strong> water development in thesystemic alteration <strong>of</strong> the coastal zone environment. Pp. 755-760 in ProceedingsWatershed ’93: A National Conference on Watershed <strong>Management</strong>. US<strong>Environment</strong>al Protection Agency, Washington, DC.Rulifson, R.A. 1984. Food <strong>and</strong> feeding <strong>of</strong> young striped bass in western AlbemarleSound, North Carolina. N.C. Department <strong>of</strong> <strong>Natural</strong> Resources <strong>and</strong> CommunityDevelopment, Division <strong>of</strong> Marine Fisheries, Morehead City. Completion Reportfor Contract C-1366. 47 pp.Rulifson, R.A. 1990. Abundance <strong>and</strong> viability <strong>of</strong> striped bass eggs spawned in theRoanoke River, North Carolina, in 1989. <strong>NC</strong> Department <strong>of</strong> <strong>Environment</strong>al<strong>Management</strong>, Health <strong>and</strong> <strong>Natural</strong> Resources <strong>and</strong> U.S. <strong>Environment</strong>al ProtectionAgency, Albemarle-Pamlico Estuarine Study, Raleigh, <strong>NC</strong>. Project No. 90-11. 96pp.Rulifson, R.A. 1991a. Comparing the abundance <strong>and</strong> viability <strong>of</strong> striped bass eggsspawned in the Roanoke River, North Carolina, at two locations in 1991. Interimreport to the North Carolina Striped Bass Study <strong>Management</strong> Board. Institute forCoastal <strong>and</strong> Marine Resources, <strong>and</strong> Department <strong>of</strong> Biology, East CarolinaUniversity, Greenville, <strong>NC</strong>.Rulifson, R.A. 1991b. Striped bass spawning activity <strong>and</strong> reservoir discharge. Pp. 194-201 In R.A. Rulifson <strong>and</strong> C.S. Manooch, III, Eds. Roanoke River Water FlowCommittee Report for 1990. National Marine Fisheries Service, SoutheastFisheries Center, Beaufort, <strong>NC</strong>. NOAA Technical Memor<strong>and</strong>um NMFS-SEFC291.331
Rulifson, R.A. <strong>and</strong> C.S. Manooch, III. 1990. Recruitment <strong>of</strong> juvenile striped bass in theRoanoke River, North Carolina, as related to reservoir discharge. North AmericanJournal <strong>of</strong> Fisheries <strong>Management</strong> 10: 397-407.Rulifson, R.A. <strong>and</strong> C.S. Manooch, III (eds.). 1990. Roanoke River water flow committeereport for 1988 <strong>and</strong> 1989. NOAA Technical Memor<strong>and</strong>um NMFS-SEFC-256:1-209.Rulifson, R.A. <strong>and</strong> C.S. Manooch, III (eds.). 1991. Roanoke River Water FlowCommittee Report for 1990. NOAA Technical Memor<strong>and</strong>um NMFS-SEFC-291.433 pp.Rulifson, R.A. <strong>and</strong> C.S. Manooch, III (eds.). 1993. Roanoke River Water FlowCommittee Report for 1991-1993. <strong>NC</strong> <strong>Dept</strong>. Enviro., Health, <strong>and</strong> Nt. Res.,Albemarle-Pamlico Estuarine Study, Raleigh, <strong>NC</strong>. Report No. 93-18:1-384.Rulifson, R.A. <strong>and</strong> D. Bass. 1991. Food analyses <strong>of</strong> young-<strong>of</strong>-year. In NOAA TechnicalMemor<strong>and</strong>um NMFS-SEFC-291, pp 217-219.Rulifson, R.A., D.W. Stanley <strong>and</strong> J.E. Cooper. 1986a. Food <strong>and</strong> feeding <strong>of</strong> youngstriped bass in Roanoke River <strong>and</strong> western Albemarle Sound, North Carolina,1984-1985. N.C. Department <strong>of</strong> <strong>Natural</strong> Resources <strong>and</strong> CommunityDevelopment, Division <strong>of</strong> Marine Fisheries, Morehead City. Completion ReportAFS-24. 129 pp. + appendices.Rulifson, R.A., J.E. Cooper <strong>and</strong> D.W. Stanley. 1991. Food <strong>and</strong> feeding <strong>of</strong> young stripedbass in the lower Roanoke River <strong>and</strong> western Albemarle Sound, North Carolina,1990-1991. Interim Report to N.C. Striped Bass Study <strong>Management</strong> Board <strong>and</strong>N.C. Wildlife Resources Commission. 48 pp. + appendices.Rulifson, R.A., J.E. Cooper <strong>and</strong> G. Colombo. 1986b. Development <strong>of</strong> fed <strong>and</strong> starvedstriped bass (Morone saxatilis) larvae from the Roanoke River, North Carolina.N.C. Department <strong>of</strong> <strong>Natural</strong> Resources <strong>and</strong> Community Development, Division <strong>of</strong>Marine Fisheries. Completion Report for ECU Grant/Contract No. 5-21432.Rulifson, R.A., M.T. Huish <strong>and</strong> R.W. Thoesen. 1982a. Anadromous fish in theSoutheastern United States <strong>and</strong> recommendations for development <strong>of</strong> amanagement plan. U.S. Fish <strong>and</strong> Wildlife Service, <strong>Fishery</strong> Resources, Region 4,Atlanta, GA. 525 pp.Rulifson, R.A., M.T. Huish <strong>and</strong> R.W. Thoesen. 1982b. Status <strong>of</strong> anadromous fisheries inSoutheast U.S. estuaries. In V. Kennedy, ed. Estuarine comparisons. AcademicPress Inc., New York, NY. pp. 413-425.Rulifson, R. A. <strong>and</strong> R. W. Laney. 1999. Striped bass stocking programs in the UnitedStates: Ecological <strong>and</strong> resource management issues. Fisheries <strong>and</strong> OceansCanada, Canadian Stock Assessment Secretariat, Res. Doc. 99/07.Sasaki, S. 1966. Distribution <strong>of</strong> juvenile striped bass, Roccus saxatilis, in theSacramento-San Joaquin Delta. Pp. 59-67 In J.L. Turner <strong>and</strong> D.W. Kelley,compilers. Ecological studies <strong>of</strong> the Sacramento-San Joaquin Delta, Part II.332
Fishes <strong>of</strong> the delta. California Department <strong>of</strong> Fish <strong>and</strong> Game Bull. 136.Schaich, B.A. <strong>and</strong> C.C. Coutant. 1980. A biotelemetry study <strong>of</strong> spring <strong>and</strong> summerhabitat selection by striped bass in Cherokee Reservoir, Tennessee, 1978. OakRidge National Laboratories, ORNL/TM-7127, Oak Ridge, Tennessee.Schaefer, M. B. 1951. Estimation <strong>of</strong> size <strong>of</strong> animal populations by marking experiments.U.S. Fish <strong>and</strong> Wildlife Service <strong>Fishery</strong> Bulletin 52:191-203.Schubel, J.R. <strong>and</strong> A.H. Auld. 1974. Hatching success <strong>of</strong> blueback herring <strong>and</strong> stripedbass eggs with various time versus temperature histories. Pp. 164-190 In J.W.Gibbons <strong>and</strong> R.R. Sharitz, Eds. Thermal Ecology. U.S. Atomic EnergyCommission, Technical Information Center, Office <strong>of</strong> International Services, OakRidge, Tennessee.Schubel, J.R., T.S.Y. Koo <strong>and</strong> C.F. Smith. 1976. Thermal effects <strong>of</strong> power plantentrainment on survival <strong>of</strong> fish eggs <strong>and</strong> larvae: a laboratory assessment.Chesapeake Bay Institute, Reference 76-5, Special Report 52. Johns HopkinsUniversity. 37 pp.Schuhmann, 1999. Economic valuation <strong>of</strong> Roanoke River striped bass recreationalfishery. Coastal Fisheries Investigations. Federal Aid in Fish Restoration ProjectF-22. <strong>NC</strong> Wild. Res. Comm., Div. Inl<strong>and</strong> Fish.Scruggs, G.D., Jr. 1957. Reproduction <strong>of</strong> resident striped bass in Santee-CooperReservoir, South Carolina. Transactions <strong>of</strong> the American Fisheries Society85:144-159.Setzler, E.M., W.R. Boynton, K.V. Wood, H.H. Zion, L. Lubbers, N.K. Mountford, P.Frere, L. Tucker <strong>and</strong> J.A. Mihursky. 1980. Synopsis <strong>of</strong> biological data on stripedbass. NOAA Technical Report, NMFS Circular 443:FAO Synopsis No. 121. 69pp.Setzler-Hamilton, E.M. <strong>and</strong> L. Hall, Jr. 1991. Striped bass. Pp. 13-1 through 13-31 InS.L. Funderburk et al. (eds). Habitat requirements for Chesapeake Bay livingresources. Chesapeake Bay Program, U.S. Fish <strong>and</strong> Wildlife Service, Annapolis,MD.Setzler-Hamilton, E.M., W.R. Boynton, J.A. Mihursky, T.T. Polgar <strong>and</strong> K.V. Wood. 1981.Spatial <strong>and</strong> temporal distribution <strong>of</strong> striped bass eggs, larvae <strong>and</strong> juveniles in thePotomac Estuary. Transactions <strong>of</strong> the American Fisheries Society 110:121-136.Shapovalov, L. 1936. Food <strong>of</strong> the striped bass. California Fish <strong>and</strong> Game 22:261-271.Sholar, T. M. 1975. Anadromous fishery survey <strong>of</strong> the New <strong>and</strong> White Oak Riversystems. Completion Report, Project AFC-9, N.C. Department <strong>of</strong> <strong>Natural</strong> <strong>and</strong>Economic Resources, Division <strong>of</strong> Marine Fisheries, 49 pp.Sholar, T.M. 1977. Anadromous fisheries research program, Cape Fear River system,Phase I. Progress Report, Project AFCS-12. N.C. Department <strong>of</strong> <strong>Natural</strong>Resources <strong>and</strong> Community Development, Division <strong>of</strong> Marine Fisheries. 63 pp.333
Silk, N., J. McDonald <strong>and</strong> R. Wigington. 2000. Turning instream flow water rights upsidedown. Rivers 7(4):298-313.Skinner, J.E. 1974. A functional evaluation <strong>of</strong> a large louver screen installation <strong>and</strong> fishfacilities research on California water diversion projects. In L.D. Jensen, ed.Second workshop on entrainment <strong>and</strong> intake screening. Electric PowerResources Institute. EPRI Publication No. 74-049-00-5. Palo Alto,California. pp. 225-250.Smith, H.M. 1907. North Carolina Geological <strong>and</strong> Economic survey. Volume II. Thefishes <strong>of</strong> North Carolina. E.M. Uzzell & Co., State Printers <strong>and</strong> Binders, Raleigh.452 pp.Smith, L.D. 1973. Life history studies <strong>of</strong> striped bass. Department <strong>of</strong> <strong>Natural</strong> Resources,Game <strong>and</strong> Fish Division, Fisheries Section, Sport Fisheries Division, Brunswick,Georgia. 143 pp.Smith, T. I. <strong>and</strong> W. E. Jenkins. 1984. Controlled spawning <strong>of</strong> F1 hybrid striped bass(Morone saxatilis X M. chrysops) <strong>and</strong> rearing F2 progeny. Journal <strong>of</strong> WorldMariculture Society 15: 147-161.Smith, W.B. <strong>and</strong> J. Bayless. 1963. Biological aspects <strong>of</strong> the Roanoke River fish-kill, April21-28, 1963. N.C. Wildlife Resources Commission, Raleigh. 7 p.Stevens, D.E. 1977. Striped bass (Morone saxatilis) year class strength in relation toriver flow in the Sacramento-San Joaquin Estuary, California. Transactions <strong>of</strong> theAmerican Fisheries Society 106(1): 34-42.Stevens, D.E. 1966. Food habits <strong>of</strong> striped bass, Roccus saxatilis, in the Sacramento-San Joaquin Delta. pp. 68-96 In J.L. Turner <strong>and</strong> D.W. Kelley, compilers.Ecological studies <strong>of</strong> the Sacramento-San Joaquin Delta. Part II. Fishes <strong>of</strong> thedelta. California Department <strong>of</strong> Fish <strong>and</strong> Game. Bulletin 136.Stevens, D.E., D.W. Kohlhorst, L.W. Miller <strong>and</strong> D.W. Kelley. 1985. The decline <strong>of</strong>striped bass in the Sacramento-San Joaquin Estuary, California. Transactions <strong>of</strong>the American Fisheries Society 114:12-30.Street, M.W. 1986. Trends in the N.C. commercial fisheries, 1965-1985. N.C.Department <strong>of</strong> <strong>Natural</strong> Resources <strong>and</strong> Community Development, Division <strong>of</strong>Marine Fisheries. Morehead City, <strong>NC</strong>.Street, M.W. <strong>and</strong> A.B. Hall. 1973. Annotated bibliography <strong>of</strong> anadromous fishes <strong>of</strong> NorthCarolina through 1972. <strong>NC</strong> <strong>Dept</strong>. Nat. <strong>and</strong> Econ. Resour., Div. Commercial <strong>and</strong>Sports Fish., Spec. Sci. Rep. No. 23, 85 p.Street, M.W., P.P. Pate Jr., B.F. Holl<strong>and</strong> <strong>and</strong> A.B. Powell. 1975. Anadromous fisheriesresearch program, northern coastal region. N.C. Completion Report for ProjectFCS-8. N.C. Department <strong>of</strong> <strong>Natural</strong> <strong>and</strong> Economic Resources, Division <strong>of</strong> MarineFisheries, 210 p.Tagatz, M.E. 1961. Tolerance <strong>of</strong> striped bass <strong>and</strong> American shad to changes <strong>of</strong>334
temperature <strong>and</strong> salinity. U.S. Fish <strong>and</strong> Wildlife Service. Special Scientific ReportFisheries 388. 8 pp.Talbot, G.B. 1966. Estuarine environmental requirements <strong>and</strong> limiting factors for stripedbass. In A symposium on estuarine fishes. American Fisheries Society, SpecialPublication No. 3. pp. 37-49.Tatum, B.L., J.D. Bayless, E.G. McCoy <strong>and</strong> W.B. Smith. 1965. Preliminary experimentsin the artificial propagation <strong>of</strong> striped bass, Roccus saxatilis. N.C. WildlifeResources Commission, Division <strong>of</strong> Inl<strong>and</strong> Fisheries. 14 pp.Taylor, M. T. 1990. North Carolina fisheries in the old <strong>and</strong> new south. Masters Thesis,Department <strong>of</strong> History, N.C. State University, Raleigh, <strong>NC</strong>. 90 pp.Taylor, M.T. 1992. Seiners <strong>and</strong> tongers: North Carolina fisheries in the old <strong>and</strong> newsouth. The North Carolina Historical Review 1:1-33.Taylor, S.D. <strong>and</strong> H.C. Hardy. 1994. Striped bass monitoring. Compl. Rep. Proj. F-53.<strong>NC</strong> <strong>Dept</strong>. Enviro., Health, <strong>and</strong> Nat. Resour., Div. Mar. Fish., 45p.Texas Instruments, Inc. 1974. Hudson River ecological study in the area <strong>of</strong> Indian Point.Consolidated Edison Co., New York. 1973 Annual Report. 348 pp.Trent, L. <strong>and</strong> W.W. Hassler. 1968. Gill net selection, migration, size <strong>and</strong> agecomposition, sex ratio, harvest efficiency, <strong>and</strong> management <strong>of</strong> striped bass in theRoanoke River, N.C. Chesapeake Sci. 9(4):217-232.Trent, W.L. 1962. Growth <strong>and</strong> abundance <strong>of</strong> young-<strong>of</strong>-the-year striped bass, Roccussaxatilis (Walbaum), in Albemarle Sound, North Carolina. M.S. Thesis. NorthCarolina State University, Raleigh. 66 pp.Trowell, S.J. <strong>and</strong> S.E. Winslow. 1997. North Carolina striped bass monitoring. FinalRep. Proj. F-56, Segments 1-3, <strong>NC</strong> <strong>Dept</strong>. Enviro., Health <strong>and</strong> Nat. Resour., Div.Mar. Fish., 71p.Turner, J.L. <strong>and</strong> H.K. Chadwick. 1972. Distribution <strong>and</strong> abundance <strong>of</strong> young-<strong>of</strong>-the-yearstriped bass, Morone saxatilis, in relation to river flow in the Sacramento-SanJoaquin estuary. Transactions <strong>of</strong> the American Fisheries Society 101:442-452.Turner, J.L. <strong>and</strong> T.C. Farley. 1971. Effects <strong>of</strong> temperature, salinity, <strong>and</strong> dissolvedoxygen on the survival <strong>of</strong> striped bass eggs <strong>and</strong> larvae. California Fish <strong>and</strong>Game 57:268-273.Uph<strong>of</strong>f, J.H. 1989. <strong>Environment</strong>al effects on survival <strong>of</strong> eggs, larvae, <strong>and</strong> juveniles <strong>of</strong>striped bass in the Choptank River, Maryl<strong>and</strong>. Transactions <strong>of</strong> the AmericanFisheries Society 118(3): 251-263.Versar, Inc. 1990. Source document for the supplement to the Striped Bass Fisheries<strong>Management</strong> <strong>Plan</strong>- Amendment #4. ASMFC, Washington, DC. Fisheries<strong>Management</strong> Report No. 16: 1-1 to 11-14 + append.Vladykov, V.D. <strong>and</strong> D.H. Wallace. 1952. Studies <strong>of</strong> the striped bass, Roccus saxatilis(Walbaum), with special reference to the Chesapeake Bay region during 1936-335
1938. Bull. Bingham. Oceanogr. Collect., Yale University. 14: 132-177.Ware, F.J. 1971. Some early life history <strong>of</strong> Florida's inl<strong>and</strong> striped bass, Moronesaxatilis. Proceedings <strong>of</strong> the Annual Southeast Conference Association, Game<strong>and</strong> Fish Commission. 24:439-447.Ware, F. J. 1975. Progress with Morone hybrids in freshwater. Proceedings <strong>of</strong> the 29 thAnnual Conference <strong>of</strong> SE Assoc. <strong>of</strong> Game <strong>and</strong> Fish Commissioners 29: 45-54.Weiner, J. G. <strong>and</strong> D. P. Krabbenh<strong>of</strong>t. 1999. Methylmercury in aquatic food webs:consequences <strong>and</strong> management challenges, pp. 161-170. In D. W. Morganwalpad H. T. Buxton (eds.), Contamination <strong>of</strong> hydrologic systems <strong>and</strong> relatedecosystems: U.S. Geological Survey water resources investment report. 99-4018B.White, M.G., III <strong>and</strong> T.A. Curtis. 1969. Anadromous fish survey <strong>of</strong> the Black River <strong>and</strong>Pee Dee River watersheds. South Carolina Wildlife <strong>and</strong> Marine ResourcesDepartment, Columbia, SC. Project AFS-2-4, Job Progress Report, 1 July 1968-30 June 1969. 73 pp.Wilde, G.R., M.I. Muoneke, P.W. Bettoli, K.L. Nelson, <strong>and</strong> B.T. Hysmith. 2000. Bait <strong>and</strong>temperature effects on striped bass hooking mortality in freshwater. NorthAmerican Journal <strong>of</strong> Fisheries <strong>Management</strong>. 20:810-815.Williams, R. 1997. Characterization <strong>of</strong> shallow water mullet gill net fisheries by species,bycatch <strong>and</strong> fishing method. North Carolina Sea Grant, <strong>Fishery</strong> Resource Grant,97-FEG-37. 34p.Winslow, S.E. 1994. Striped bass fishery independent gill net survey. Compl. Rep., Proj.F-48, <strong>NC</strong> <strong>Dept</strong>. Enviro., Health <strong>and</strong> Nat. Resour., Div. Mar. Fish., 29p.Winslow, S.E. <strong>and</strong> L.T. Henry. 1988. North Carolina striped bass. Annual ProgressReport, July 1986-June 1987, Project AFCS-26-2. N.C. Department <strong>of</strong> <strong>Natural</strong>Resources <strong>and</strong> Community Development, Division <strong>of</strong> Marine Fisheries.Morehead City, <strong>NC</strong>. 25 p.Winslow, S.E. <strong>and</strong> R.C. Harris. 1986. An investigation <strong>of</strong> size, age, <strong>and</strong> sex <strong>of</strong> NorthCarolina striped bass. Completion Report, Project AFC-25, N.C. Department <strong>of</strong><strong>Natural</strong> Resources <strong>and</strong> Community Development, Division <strong>of</strong> Marine Fisheries,Morehead City, <strong>NC</strong>. 22p.Winslow, S.E., N.S. S<strong>and</strong>erlin, G.W. Judy, J.H. Hawkins, B.F. Holl<strong>and</strong>, Jr., C.A. Fischer<strong>and</strong> R.A. Rulifson. 1983. North Carolina Anadromous Fisheries <strong>Management</strong>Program. Completion Report, Project AFCS-16. N.C. Department <strong>of</strong> <strong>Natural</strong>Resources <strong>and</strong> Community Development, Division <strong>of</strong> Marine Fisheries. 402 pp.Worth, S. G. 1884. Report upon the propagation <strong>of</strong> striped bass at Weldon, <strong>NC</strong> in thespring <strong>of</strong> 1884. Bulletin <strong>of</strong> the US Fish Commission, Vol. IV (15), page 225,Washington, DC.Worth, S.G. 1903. Striped bass hatching in North Carolina. Trans. Am. Fish. Soc., Vol.336
32, 1902 (1903), p. 98-102.Zincone, L.H., Jr. <strong>and</strong> R.A. Rulifson. 1991. Instream flow <strong>and</strong> striped bass recruitment inthe lower Roanoke River, North Carolina. Rivers 2(2): 125-137.Zincone, L.H., Jr. <strong>and</strong> R.A. Rulifson. 1992. Reply to the comments <strong>of</strong> Thomas M. Leahy,III. Rivers 3(2): 114-121.337
13.0 AppendicesAppendix 1. North Carolina striped bass l<strong>and</strong>ings (Chestnut <strong>and</strong> Davis, 1975).Year Pounds('000)Value ($)('000)Year Pounds('000)Value ($)('000)1887 500 25 1951 702 1341888 560 28 1952 647 1211889 531 31 1953 757 1371890 568 32 1954 1,122 1881897 845 58 1955 736 1201902 1,175 114 1956 764 1191908 510 36 1957 597 901918 287 46 1958 1,097 1971923 477 76 1959 872 1581927 738 119 1960 782 1251928 507 72 1961 550 881929 246 41 1962 747 1201930 457 61 1963 736 1151931 327 35 1964 714 1171932 507 55 1965 484 771934 362 36 1966 653 1001936 768 61 1967 1,817 2531937 713 69 1968 1,912 3851938 523 49 1969 1,568 3261939 339 34 1970 2,318 4791940 540 59 1971 1,449 3141945 609 121 1972 1,261 3581950 797 165 1973 1,752 592338
North Carolina striped bass l<strong>and</strong>ings by gear (Chestnut <strong>and</strong> Davis 1975).Haul seines Purse seines Pound nets Gill Nets Fyke nets Trawls LinesDip nets/Bow nets Fish wheels OtherValue ($)ValueValueValueValueValueValueValueValueValue ($)YearPoundsPounds ($) Pounds ($) Pounds ($) Pounds ($) Pounds ($) Pounds ($) Pounds ($) Pounds ($) Pounds149,422 6,831 203,335 11,553 53,279 3,706 1,250 751888 161,300 6,438 270,487 15,288 57,557 3,879 1,250 751889 220,766 11,912 240,221 13,732 69,112 4,892 1,250 751890 288,587 11,798 260,464 14,874 77,980 5,387 1,310 791897 250,918 16,875 430,620 29,824 145,635 10,033 400 20 8,300 615 6,800 496 2,400 1721902 297,027 27,920 677,135 67,380 160,616 14,613 500 50 3,800 380 6,222 600 30,100 2,6881908 177,000 12,000 215,000 15,000 38,000 2,700 2,400 200 6,200 500 71,000 5,7001918 31,673 3,235 18,000 4,500 210,284 31,785 17,993 3,487 1,943 2531923 189,147 28,368 15,523 2,252 110,607 16,748 158,124 27,865 3,600 7201927 188,496 27,267 16,700 2,505 233,499 37,291 288,910 50,420 10,100 1,9781928 221,547 28,344 4,985 614 156,352 24,116 117,827 17,700 5,870 986 200 501929 80,652 11,701 95,397 16,424 64,703 11,909 5,605 1,1901930 203,526 20,863 10,000 1,500 106,350 15,569 118,650 18,475 16,350 3,643 1,000 150 1,000 2501931 185,560 16,871 5,000 750 57,550 7,198 63,900 6,862 14,500 1,8451932 236,600 20,848 75,000 11,250 75,200 9,115 95,675 10,007 21,000 2,1251934 139,300 13,405 20,000 2,000 92,400 9,240 87,300 8,730 3,000 300 11,760 1,1711936 138,100 11,932 100,000 5,000 319,800 25,001 194,000 17,769 11,300 960 20,000 2,0001937 198,300 19,372 55,000 5,500 288,700 27,826 153,500 15,006 17,400 1,720 4,600 5951938 212,400 19,879 205,900 19,777 84,700 7,111 19,700 1,8611939 47,900 4,635 158,500 15,805 126,700 12,665 6,500 6501940 49,300 5,423 248,600 27,346 231,000 25,410 11,000 1,2101945 41,700 8,284 238,200 47,576 267,300 53,036 61,300 12,2601950 191,700 32,090 112,800 22,560 310,000 73,216 137,200 28,311 45,000 9,000 100 301951 143,200 31,535 155,000 27,250 233,600 40,115 127,300 27,345 23,800 4,950 11,300 1,715 8,000 1,2001952 118,600 24,692 138,100 23,670 206,200 36,026 161,700 32,690 3,700 750 8,500 1,5301953 189,100 32,533 112,500 21,270 274,700 47,598 150,900 29,962 5,500 1,060 16,500 3,3001954 74,800 14,440 101,600 20,320 696,500 104,636 242,700 47,598 6,100 1,1981955 54,300 8,301 36,000 6,105 334,800 51,469 307,600 53,729 3,300 4951956 64,900 9,735 22,500 3,375 362,600 54,390 312,700 51,635 800 1201957 27,800 4,170 22,700 3,405 208,700 31,305 337,800 50,6701958 193,100 34,758 82,800 14,904 211,500 38,070 601,800 108,324 6,800 1,2241959 201,400 36,320 65,000 11,700 121,800 22,090 483,300 87,3461960 196,700 31,472 89,800 14,368 195,300 31,248 300,500 48,0801961 123,300 19,728 47,700 7,632 133,600 21,376 245,100 39,2161962 182,400 29,184 70,000 11,200 163,100 26,096 331,800 53,0881963 100,600 14,416 10,000 1,600 180,400 28,864 444,800 69,0281964 131,600 21,581 154,400 24,878 427,300 70,0951965 96,900 15,081 131,400 20,809 257,200 41,1111966 66,800 10,275 47,700 7,166 528,800 81,310 4,800 743 9,000 1,3721967 285,600 37,654 50,100 9,398 52,700 9,262 1,368,500 191,412 2,100 346 56,700 4,886 300 551968 24,600 5,408 92,600 15,311 1,302,500 296,649 800 156 30,200 6,028 100 181969 367,900 87,769 166,700 33,018 54,200 8,119 1,700 318 117,900 27,7891970 588,600 135,031 246,200 46,885 198,600 38,972 617,700 127,979 600 126 665,500 130,3021971 306,700 69,749 59,000 11,797 92,100 19,680 541,200 119,123 6,400 1,300 443,600 92,151339
Appendix 1. Striped bass l<strong>and</strong>ings <strong>and</strong> value by county, 1930-1968 (Chestnut <strong>and</strong> Davis, 1975).Year Bertie Camden Chowan Currituck Dare GatesPounds Value ($) Pounds Value ($) Pounds Value ($) Pounds Value ($) Pounds Value ($) Pounds Value ($)1930 3,500 425 3,000 600 19,800 3,910 61,822 11,999 136,200 19,705 400 741931 1,800 180 3,000 450 14,500 1,450 56,760 6,621 107,300 10,947 200 201934 20,900 2,090 3,000 300 18,700 1,870 47,500 4,750 116,000 11,600 No data1936 13,700 1,255 7,300 660 15,000 1,257 34,900 3,435 474,800 34,392 3,500 3501937 11,500 1,150 8,800 714 9,800 980 83,500 8,532 367,100 36,697 2,000 2001938 10,600 954 4,700 470 8,600 774 96,600 9,660 278,400 26,568 2,200 1981945 27,000 5,400 2,500 500 No data 64,500 12,900 160,000 32,000 5,000 1,0001950 5,600 1,120 5,000 1,000 22,700 4,540 162,100 26,120 335,300 77,145 1,000 2001951 5,600 1,400 3,200 800 9,800 2,450 100,400 25,100 310,700 46,610 5,000 1,0001952 4,300 860 3,500 770 16,400 3,280 94,800 20,856 238,100 35,715 1,700 4281953 16,000 3,200 4,900 1,078 20,900 4,180 77,300 15,460 269,400 41,145 1,400 2801954 9,900 2,772 7,300 1,825 No data 24,700 4,446 98,200 19,640 4,900 9801955 16,200 2,430 8,500 1,530 158,500 23,775 62,500 9,375 130,900 19,635 4,900 9801956 7,300 1,095 2,500 375 199,000 29,850 23,400 3,510 266,200 39,930 No data1957 10,600 1,590 1,500 225 247,000 37,050 16,900 2,535 112,100 16,815 No data1958 7,900 1,422 10,000 1,800 311,000 55,980 22,400 4,032 348,100 62,658 No data1959 4,700 940 9,500 1,900 280,000 50,400 19,900 3,582 225,100 40,518 No data1960 8,800 1,408 15,000 2,400 72,500 11,600 31,900 5,104 356,200 56,992 No data1961 4,400 704 13,500 2,160 64,500 10,320 6,500 1,040 116,600 26,656 No data1962 3,800 608 22,300 3,568 87,400 13,984 86,000 13,760 236,100 37,776 No data1963 7,400 1,184 30,600 4,896 141,800 22,688 81,000 12,960 132,800 19,568 No data1964 7,000 1,120 55,000 8,993 82,100 13,406 58,000 9,280 181,200 29,566 No data1965 2,600 416 23,600 3,776 51,400 8,224 61,000 9,760 110,600 17,133 No data1966 3,500 534 No data 247,500 38,143 24,400 3,700 74,200 11,269 No data1967 4,900 896 No data 436,500 73,348 9,800 1,685 886,000 96,601 No data1968 4,300 663 No data 224,300 47,216 79,800 15,040 600,000 111,519 No data340
Hertford Martin Pasquotank Perquimans Tyrrell WashingtonPounds Value ($) Pounds Value ($) Pounds Value ($) Pounds Value ($) Pounds Value ($) Pounds Value ($)1930 No data 6,000 825 25,000 4,800 60,000 9,000 12,100 1,855 80,814 1,3971931 No data 1,500 150 11,600 2,212 30,000 3,000 6,000 600 50,800 5,0801934 200 20 20,000 2,000 5,000 500 12,000 1,200 37,000 3,700 47,000 4,7001936 3,000 300 6,400 770 29,800 2,640 27,200 2,448 119,200 10,750 20,100 1,8091937 3,500 350 1,000 80 28,800 2,592 29,100 2,549 82,300 8,230 23,400 2,3401938 3,000 270 800 64 30,500 2,440 29,000 2,320 22,000 1,925 17,600 1,1791945 1,500 180 2,000 400 107,300 21,460 73,700 14,740 100,000 20,000 9,000 1,8001950 1,300 260 25,000 5,000 42,600 8,520 22,500 4,500 134,000 26,800 12,500 2,5001951 1,300 260 12,500 3,125 42,400 10,600 43,200 10,790 120,000 24,000 2,000 5001952 1,300 286 2,400 432 58,400 11,680 36,100 7,942 82,000 14,760 13,400 2,4121953 1,100 242 2,600 468 83,700 16,740 30,400 6,688 100,500 18,090 16,100 2,8981954 3,000 600 3,000 600 54,500 10,900 26,200 5,240 250,000 50,000 10,500 1,6801955 2,000 400 1,500 375 96,800 17,424 22,500 4,050 175,000 31,500 26,500 3,9751956 No data 3,000 450 74,900 15,965 9,900 1,485 108,200 16,230 52,000 7,8001957 600 90 1,000 150 61,400 9,210 6,900 1,035 111,600 16,740 16,300 2,4451958 No data 500 90 159,700 28,746 10,000 1,800 195,500 35,190 9,100 1,6381959 No data 500 90 103,000 18,540 15,000 2,700 184,500 33,210 12,800 2,3041960 No data 600 96 93,500 14,960 25,000 4,000 130,800 20,928 7,700 1,2321961 300 48 300 48 69,000 11,040 20,000 3,200 132,000 21,120 4,200 6721962 200 32 100 16 80,000 12,800 30,000 4,800 124,500 19,920 7,900 1,2641963 500 80 500 80 91,000 14,560 35,000 5,600 154,000 23,500 5,300 8481964 1,000 160 1,900 304 147,500 24,337 20,000 3,285 113,400 18,711 6,500 1,0401965 No data No data 100,000 16,000 13,000 2,080 81,100 12,895 1,200 1921966 No data No data 99,200 15,288 No data 132,300 20,109 11,000 1,7141967 No data No data 100,300 16,408 No data 105,200 18,892 151,700 24,5141968 No data No data 769,000 15,485 No data 177,800 34,958 575,400 124,640Halifax Beaufort Pamlico Carteret Craven HydePounds Value ($) Pounds Value ($) Pounds Value ($) Pounds Value ($) Pounds Value ($) Pounds Value ($)1930 No data 7,300 755 1,100 43 17,290 1,644 16,350 2,438 2,200 801931 No data 23,500 1,950 2,100 210 200 6 15,400 1,540 350 351934 No data 24,900 1,965 No data 800 80 6,500 650 No data1936 No data 8,700 783 1,000 100 500 50 1,100 108 1,600 1491937 No data 59,500 4,780 No data 0 0 1,100 110 1,500 120341
Halifax Beaufort Pamlic Carteret Craven HydeHalifax Beaufort Pamlico Carteret Craven HydePounds Value ($) Pounds Value ($) Pounds Value ($) Pounds Value ($) Pounds Value ($) Pounds Value ($)1938 No data 12,300 1,206 3,500 350 800 40 700 70 900 901945 No data 6,000 1,200 3,500 700 500 100 39,800 7,960 No data1950 No data 22,400 6,272 1,100 330 100 25 1,800 450 500 1001951 35,000 5,250 12,000 2,400 700 140 0 2,000 300 No data1952 35,500 6,390 45,200 11,300 1,000 250 0 5,500 1,650 No data1953 34,500 6,900 86,100 17,220 2,000 400 0 7,000 1,400 No data1954 No data 19,200 3,840 300 60 0 3,200 640 No data1955 No data 27,800 4,170 700 140 0 1,300 260 No data1956 No data 15,400 2,310 No data 0 600 90 No data1957 No data 8,400 1,260 No data 0 200 30 1,100 1651958 No data 14,700 2,646 100 18 0 2,300 414 3,700 6661959 No data 15,100 3,020 100 18 200 36 No Data 600 1081960 No data 34,300 5,488 800 128 2,500 400 2,100 336 No data1961 No data 27,700 4,432 1,900 304 33,800 5,408 2,900 464 100 161962 No data 38,400 6,144 12,600 2,016 11,900 1,904 3,800 608 700 1121963 No data 35,600 5,696 1,100 176 14,600 2,336 3,500 560 100 161964 No data 29,300 4,688 2,800 448 5,700 912 2,400 384 200 321965 No data 34,600 5,501 900 144 1,300 208 1,600 256 600 961966 No data 57,300 8,830 500 69 800 123 300 38 100 231967 No data 117,200 20,132 1,700 83 600 102 No Data 200 311968 No data 170,600 35,009 100 12 600 103 No Data 500 109LeniorNew HanoverPounds Value ($) Pounds Value ($)1930 4,000 1,000 No data1931 1,500 75 No data1934 2,500 250 No data1936 No data No data1937 No data No data1938 No data 500 501945 No data 5,300 6361950 No data 1,300 3251951 No data 1,400 3851952 No data 7,400 2,2201953 No data 3,100 930342
LeniorNew HanoverPounds Value ($) Pounds Value ($)1954 No data 800 2401955 No data No data1956 No data 1,100 1651957 No data 1,400 2101958 No data 1,000 1801959 No data 500 901960 No data 600 961961 No data 2,000 3201962 No data 1,600 2561963 No data 1,000 1601964 No data 400 641965 No data 800 1281966 No data 1,400 2111967 No data 2,900 5011968 No data 1,500 278343
Appendix 2Historical RegulationsThese regulations are just a few <strong>of</strong> those in place overtime.The following rules are quoted from the referenced rule books:North Carolina Fishing Laws- Consolidated Statutes 1923- Fisheries CommissionBoardIf any person fishes on Sunday with a seine, drag-net, or other kind <strong>of</strong> net, except suchas is fastened to stakes, he shall be guilty <strong>of</strong> a misdemeanor, <strong>and</strong> fines not less than twohundred nor more than five hundred dollars, or imprisoned not more than twelve months.Albemarle Sound AreaNo person shall set or fish any dutch net or pound net in Roanoke River, Cashie orMiddle <strong>and</strong> Eastmost rivers, or within two miles <strong>of</strong> the mouth <strong>of</strong> said rivers, or within onemile <strong>of</strong> the mouth <strong>of</strong> any other river emptying into Albemarle Sound, or less than twomiles in width at its mouth, any such net set within one mile <strong>of</strong> the mouth <strong>of</strong> any otherriver emptying into said sound shall not extend into the main channel at its mouth.It is unlawful to set, fish or use any gill nets <strong>of</strong> any description, either stake, anchor ordrift, for commercial purposes in the Albemarle Sound west <strong>of</strong> a line drawn straight fromBatt’s Isl<strong>and</strong> on northern side <strong>of</strong> Albemarle Sound to mouth <strong>of</strong> Scuppernong River onsouth side <strong>of</strong> said sound, except between the hours <strong>of</strong> four o’clock <strong>and</strong> eleven o’clockp.m., <strong>and</strong> then said nets or combinations <strong>of</strong> such nets shall not be more than sixhundred yards in length, <strong>and</strong> there shall not be allowed to any boat more than sixhundred yards <strong>of</strong> such gill nets.Cape Fear RiverIt is unlawful to fish with dutch, pod, fyke or other pound nets, or stake or stationary nets,or nets <strong>of</strong> like kind, in the waters <strong>of</strong> the Cape Fear River below the mouth <strong>of</strong> Black River,twelve miles above Wilmington, or in the waters <strong>of</strong> Northeast River below the CastleHayne Bridge. Drift nets shall be permitted in the waters <strong>of</strong> the Cape Fear River withinthe territory as above described in this section, <strong>and</strong> its tributaries, between February first<strong>and</strong> May first <strong>of</strong> each year. Any person violating the provisions <strong>of</strong> this section shall beguilty <strong>of</strong> a misdemeanor <strong>and</strong> fined not less than fifty dollars or imprisoned not less thanthirty days.Pamlico <strong>and</strong> Tar RiverIf any person, from the fifteenth day <strong>of</strong> February to the tenth day <strong>of</strong> May <strong>of</strong> every year,from twelve o’clock meridian <strong>of</strong> Saturday until sunrise Monday morning <strong>of</strong> each week,shall fish any seine, set net, drift net, or any other net <strong>of</strong> any name or kind whatever, inthe waters <strong>of</strong> Pamlico or Tar rivers <strong>and</strong> tributaries, except bow or skim nets, he shall beguilty <strong>of</strong> a misdemeanor.Neuse RiverIf any person shall set or fish any dutch or pound nets in the waters <strong>of</strong> Pamlico County,or shall use any seine or drag net in the waters <strong>of</strong> said county, including the north side <strong>of</strong>Neuse River from the mouth <strong>of</strong> the river to the mouth <strong>of</strong> Upper Broad Creek, from thefirst day <strong>of</strong> May to the first day <strong>of</strong> January next ensuing, or shall ant any time catch fish345
with a seine or drag net along the shores <strong>of</strong> said county on any day <strong>of</strong> the week exceptMonday, Wednesday <strong>and</strong> Friday, he shall be guilty <strong>of</strong> a misdemeanor <strong>and</strong> be fined notmore than fifty dollars or imprisoned not more than thirty days.Rules <strong>and</strong> Regulations <strong>of</strong> the Department <strong>of</strong> Conservation <strong>and</strong> DevelopmentRelative to the Commercial Fisheries <strong>of</strong> North Carolina 1947It shall be unlawful for any person, firm or corporation to take, buy, sell, <strong>of</strong>fer for sale,have in his or their possession, or unnecessarily destroy, anywhere in the State <strong>of</strong> NorthCarolina, any fish <strong>of</strong> less size than the length specified for the several kinds <strong>of</strong> fish or forany express company, railroad company or any common carrier to accept them forshipment. Rockfish or striped bass 12 inches. Provided, that this provision shall not beconstrued to prevent catches <strong>of</strong> smaller fish with hook <strong>and</strong> line for sport or personal use.Albemarle Sound AreaIt shall be lawful to use purse seines not exceeding two hundred yards in length fortaking rock in Albemarle Sound east <strong>of</strong> a line drawn from Laurel Point Light House toBatt’s Isl<strong>and</strong> from October 1 to December 20 <strong>of</strong> each year.It shall be unlawful at any time to take female (roe) striped bass (rock) with nets, seines,or by any means whatsoever in that portion <strong>of</strong> the Roanoke River between the HartBridge near Scotl<strong>and</strong> Neck <strong>and</strong> the New Highway Bridge at Weldon. Any female or roestriped bass taken within said territory shall be released immediately at the place caught<strong>and</strong> with as little damage as possible to the fish.It shall be unlawful for any person, firm or corporation to fish nets <strong>of</strong> any kind inAlbemarle Sound <strong>and</strong> its tributaries above a line drawn from Laurel’s Point Lighthouse toBatt’s Isl<strong>and</strong> between sunset <strong>and</strong> sunrise during the shad <strong>and</strong> herring fishing seasons.Neuse or Pamlico RiversIt shall be unlawful to set anchor gill nets in any <strong>of</strong> the waters <strong>of</strong> Neuse or PamlicoRivers at any season <strong>of</strong> the year.Cape Fear RiverIt shall be unlawful to catch or take with nets or seines any striped bass or rock in anywaters <strong>of</strong> New Hanover County.346
Appendix 3Regulations (rules or proclamations) resulting in conservation <strong>and</strong> /or reduction <strong>of</strong> striped bass harvest forcoastal North Carolina. (ASMA-Albemarle Sound <strong>Management</strong> Area, RRMA- Roanoke River<strong>Management</strong> Area, Central/Southern- all coastal, joint <strong>and</strong> contiguous inl<strong>and</strong> waters below ASMA line,DMF- <strong>NC</strong> Division <strong>of</strong> Marine Fisheries, WRC- <strong>NC</strong> Wildlife Resources Commission, TL- Total length, ISMinchstretched mesh, TAC- Total Allowable Catch)Year Statewide ASMA/RRMA Central/SouthernPrior to1979Minimum size limit 12 inTL, daily creel limit 25 fish(DMF/WRC)1979 Internal Coastal <strong>and</strong> JointWaters- gill nets with amesh length less than 2 ½ISM are illegal (exceptarea specifics)No trawling in Albemarle<strong>and</strong> Croatan Soundsbetween Dec 1 <strong>and</strong> Mar31Roanoke River drift gillnets must be attended atall times (DMF)Gill net mesh sizechanged from 3 ¼ ISM to3 ½ ISM- westernAlbemarle Sound <strong>and</strong>Chowan Riversummer/fall(DMF/Jul)Defined small mesh nets(mullet nets to be usedonly in eastern AlbemarleSound)(DMF/Jul)1980 Creel limit reduced to 8fish per day in Inl<strong>and</strong>Waters (WRC)Eliminated set gill nets inRoanoke River- Apr-May<strong>and</strong> restricted mesh size <strong>of</strong>drift gill nets (DMF/Oct)Field possession limitreduced to one day’s creellimit- Inl<strong>and</strong> Waters (WRC)1981 Roanoke River bownetting eliminated (WRC)Possession <strong>of</strong> large dipnets prohibited in Inl<strong>and</strong>Waters <strong>of</strong> the RoanokeRiver (WRC)Extended drift gill netregulations to mouth <strong>of</strong>Roanoke, Middle,Eastmost <strong>and</strong> Cashierivers proper (DMF/Oct)347
Year Statewide ASMA/RRMA Central/Southern1982 Minimum size limitincreased to 16 in TL inInl<strong>and</strong> Waters (WRC)1983 Eliminated small mesh gillnets in Currituck Sound,minimum size increased to3 ½ ISM (Jun-Dec)(DMF/Jan)Prohibited possession <strong>of</strong>striped bass on vesselsusing trawl in InternalCoastal Waters (DMF/Jan)Roanoke River- reinstituteduse <strong>of</strong> set gillnets Apr-May <strong>of</strong> 3 ISM <strong>and</strong>less, no more than onedrift gill net per boat (DMFJan <strong>and</strong> Oct)Eliminated 3 ¼ ISM gillnets (Jun-Dec) in all <strong>of</strong>Albemarle Sound <strong>and</strong>tributaries, increasedminimum mesh size to 3 ½ISM (DMF/Oct)1984 First limited commercialseason Oct-May(DMF/Aug)Minimum gill net meshsize 3 ½ ISM Oct-Dec(DMF/Aug)Eliminated gill nets inAlbemarle Sound <strong>and</strong>tributaries Jun-Sep,except defined “mulletnets” (2 ½-3 ISM), floating<strong>and</strong> within 300 yd <strong>of</strong> shore(DMF/Aug)Reduction in hook <strong>and</strong> linecreel limit to 8 fish/day <strong>and</strong>increase minimum sizelimit to 16 in TL for Joint<strong>and</strong> Internal CoastalWaters (Jun-Sep)(DMF/Aug)Unlawful to sell or <strong>of</strong>fer forsale striped bass fromJun-Sep (DMF/Aug)First size limit for AtlanticOcean- 24 in TL348
Year Statewide ASMA/RRMA Central/Southerncommercial <strong>and</strong>recreational (DMF/Aug)Closure <strong>of</strong> Atlantic Ocean,commercial <strong>and</strong>recreational, to possessionby proclamation(DMF/Aug)1985 Reduction in creel limit to3 fish in Inl<strong>and</strong> Waters(WRC)Reduction in commercialseason (Nov-Mar),unlawful to sell or possessstriped bass fromcommercial gear exceptduring the open season(DMF/Aug)Hook <strong>and</strong> line creel limitreduced to 3 fish/dayInternal Coastal <strong>and</strong> JointWaters year round. Nosale <strong>of</strong> hook <strong>and</strong> linecaught striped bass(DMF/Aug)Prohibit sale <strong>of</strong> stripedbass taken from Inl<strong>and</strong>Waters <strong>of</strong> the RoanokeRiver (<strong>NC</strong> GeneralAssembly)Revision <strong>of</strong> summer gillnet use (Jun-Sep), whichallowed 5 ISM <strong>and</strong> greater“flounder nets” <strong>and</strong>attendance at all timesprovisions for “mullet nets”in Albemarle Sound <strong>and</strong>tributaries (DMF/Aug)Commercial minimum sizelimit increased to 16 in TLin Joint Waters (DMF/Aug)Commercial minimum sizelimit increased to 14 in TLin Internal Coastal Waters(DMF/Oct)1986 Minimum size limitincreased to 16 in TLInternal Coastal waters(DMF/Oct)Repealed 16 in TL sizelimit, revert back to 14 inTL minimum size limitInternal Coastal Waters(DMF/Nov)Revisions to depth <strong>of</strong>water <strong>and</strong> net size for thefall gill net regulations(Oct-Dec)- increasedstriped bass conservationwithout severely impactingthe harvest <strong>of</strong> white perch<strong>and</strong> catfish (DMF/Nov)Established proclamationauthority to open <strong>and</strong>close a portion <strong>of</strong> thestriped bass season (Oct<strong>and</strong> Apr) (MFC/Nov)349
Year Statewide ASMA/RRMA Central/SouthernAligned Currituck Soundnet regulations with theAlbemarle Soundregulations relative toconservation measures(DMF/Nov)Eliminated the possession<strong>and</strong> sale <strong>of</strong> striped bassfrom the spring AlbemarleSound gill net fishery <strong>and</strong>Roanoke River deltapound net fishery (DMFeffectedby Aug 1985regulations)1987 Eliminated all trawling inAlbemarle Sound <strong>and</strong>tributaries year round(DMF/Dec)Closed a portion <strong>of</strong>western Albemarle Soundto gill netting (BatchelorBay area) <strong>and</strong> restrictedthe spring pound netfishery in the RoanokeRiver delta byproclamation (DMF/Aug)(remains in effect 2002)1988 Size limit in Atlantic Oceanwill correspond to ASMFCInterstate Striped BassFMPAllow use <strong>of</strong> “mullet gillnets” in Currituck Soundbetween 2 ½ - 3 ¼ ISM,maximum 400 yds,attended at all times (Jun-Dec) (DMF/Sep)1989 Established proclamationauthority to specify seasonor seasons: (a) hook <strong>and</strong>line <strong>and</strong> (b) commercialfishing equipment between1 Oct <strong>and</strong> 30 Apr.Proclamations may specifyareas, quantity, size <strong>and</strong>means/methods employedin harvest <strong>and</strong> requiresubmission <strong>of</strong> statistical<strong>and</strong> biological dataClosed Batchelor Bay areato anchor gill netting <strong>and</strong>restricted the possession<strong>of</strong> striped bass taken inpound nets to fish not lessthan 18 in TL or greaterthan 24 in TL.350
Year Statewide ASMA/RRMA Central/Southern(MFC/Sep)Restricted use <strong>of</strong> smallmesh “mullet gill nets” inAlbemarle Sound <strong>and</strong>tributaries (DMF/Jun <strong>and</strong>Sep)Commercial season inInternal Coastal watersclosed 20 Apr (DMF/Apr)Hook <strong>and</strong> line seasonclosed in Internal CoastalWaters 26 Nov (DMF/Nov)Delayed use <strong>of</strong>commercial gill nets <strong>of</strong>between 3-5 ISM inAlbemarle Sound <strong>and</strong>tributaries from 1 Oct until15 Nov, when commercialstriped bass seasonopened statewide. Mulletnets required attendanceat all times (DMF/Oct)Gill net mesh sizesrestricted in AlbemarleSound area (DMF/Nov)Commercial season opened15 Nov in Internal CoastalWaters (DMF/Nov)Commercial season closed inInternal Coastal Waters 22Nov (DMF/Nov)1990 Albemarle Sound area-98,000 lb. (TAC)commercial harvestallocation to be managedon a monthly basis(DMF/Jan)Gill net size restrictions inAlbemarle Sound area(DMF/Jan, Feb <strong>and</strong> Apr)Batchelor Bay area closed1 Apr to anchor gill nets<strong>and</strong> prohibited thepossession between 24<strong>and</strong> 28 in TL <strong>and</strong> less than18 in TL from pound nets(DMF/Mar)Delayed use <strong>of</strong>commercial gill nets <strong>of</strong>between 3-5 ISM from 3Oct until 7 Jan 1991, whenseason opened statewide,required mullet gill nets beattended at all times(DMF/Oct)Commercial season opened 1Jan in Internal CoastalWaters (DMF/Jan)Commercial season closed11 Jan in Internal CoastalWaters (DMF/Jan)Commercial season opened21 Feb in Internal CoastalWaters (DMF/Feb)Commercial season closed20 Apr in Internal CoastalWaters (DMF/Apr)351
Year Statewide ASMA/RRMA Central/SouthernHook <strong>and</strong> line seasonopened 1 Jan in InternalCoastal Waters (DMF/Jan)By collateral actionthrough proclamation(DMF) <strong>and</strong> emergency rule(WRC), striped bassseason closed 10 May forhook <strong>and</strong> line possessionin Joint Waters <strong>of</strong>Albemarle Sound areaHook <strong>and</strong> line seasonclosed 24 Apr in InternalCoastal Waters (excludingJoint Waters) (DMF/Apr)By collateral action DMF<strong>and</strong> WRC, closed hook<strong>and</strong> line possession inInternal Coastal, Joint <strong>and</strong>Inl<strong>and</strong> Waters 21 May(DMF <strong>and</strong> WRC/May)(DMF <strong>and</strong> WRC/May)By emergency rule seasonclosed 10 May for hook<strong>and</strong> line possession inInl<strong>and</strong> Waters <strong>of</strong> RoanokeRiver (WRC/May)1991 ASMA commercial seasonopened 7 Jan <strong>and</strong> closed9 JanEffective 1 Jan -16 in TLsize limit established <strong>and</strong> adaily creel limit not toexceed 3 fish per personper day for all InternalCoastal, Joint <strong>and</strong> Inl<strong>and</strong>Waters (DMF/WRC)ASMA commercial TAC <strong>of</strong>98,000 lbs. <strong>and</strong> managedon a monthly basis.Individual harvest permitsrequired for fishermen oroperations, 14 in TLminimum size in InternalCoastal Waters <strong>and</strong> 16 inTL in Joint Waters.Extensive gill netrestrictions with specificamount or yardage <strong>of</strong> gillnets less than 5 ISM for all1991 (DMF/Jan)ASMA opened 18 Jan withgear restrictions, harvestpermittee limited tol<strong>and</strong>ing 3 fish/day,minimum size 20 In TLASMA – 13 Feb harvestpermittee limited to l<strong>and</strong>ing5 fish/day, minimum size18 in TLASMA- 1 Mar harvestpermittee limited to l<strong>and</strong>ing10 fish/day, minimum sizeCommercial season opened 7Jan in all Internal CoastalWaters outside the ASMA(DMF/Jan)Commercial season closedby rule 30 Apr, all watersoutside ASMA (DMF)1 Nov commercial seasonopened statewide, 18 in TLminimum size limit(DMF/Nov)1 Jan- hook <strong>and</strong> line seasonopened in all Internal Coastalwaters statewide, excluding352
Year Statewide ASMA/RRMA Central/Southernlimit 18 in TLASMA (DMF/Jan)ASMA- 25 Mar harvestpermittee limited to l<strong>and</strong>ing20 fish/day, minimum size14 in TL in Internal CoastalWaters <strong>and</strong> 16 in TL inJoint Waters.Batchelor Bay area closedto anchor gill nets. Driftgill nets allowed inRoanoke, Eastmost,Middle <strong>and</strong> Cashie rivers,stationary gill netsprohibited (DMF/Mar)1 Nov- hook <strong>and</strong> line seasonopened in all Internal Coastal<strong>and</strong> Joint Waters <strong>of</strong> the state,except for ASMA <strong>and</strong> RRMAASMA- 6 Apr harvestpermittee limited to l<strong>and</strong>ing5 fish/day, minimum sizelimit 18 in TL (DMF/Apr)By rule effective 1 Jul- 3 fishdaily creel, 18 in TL minimumsize, established year roundfor Inl<strong>and</strong> Waters <strong>of</strong> the Tar,Neuse <strong>and</strong> Cape Fear rivers(WRC/Jul)By joint rule effective 1Nov, minimum size limit forJoint Waters increased to18 in TL (WRC <strong>and</strong>DMF/Nov)ASMA- 13 Apr commercialseason closed (DMF/Apr)By rule effective 1 Nov,minimum size limit inInternal Coastal Watersincreased to 18 in TL(DMF)ASMA- 21 Jun- 3 ISM gillnets allowed, attended atall times (DMF/Jun)ASMA- 3 Sep- 3-3 ½ ISMgill nets allowed with arearestrictions <strong>and</strong>attendance at all times(DMF/Sep)ASMA- 1 Oct- 2 ½ ISM<strong>and</strong> larger gill nets allowedin southern portions <strong>of</strong>Roanoke <strong>and</strong> Croatansounds (DMF/Oct)ASMA- 1 Nov commercialseason opened, harvestpermittee limited to l<strong>and</strong>ing3 fish/day, 18 in TLminimum size limit, smallmesh gill nets attended atall times, with area353
Year Statewide ASMA/RRMA Central/Southernrestrictions (DMF/Nov)ASMA- 8 Nov allowed 5 ¼ISM <strong>and</strong> larger gill nets,consistent with 18 in TLminimum size limit(DMF/Nov)ASMA- 22 Nov allowed 3-3 ½ ISM gill netsunattended in waters lessthan 6 ft deepwith restrictions(DMF/Nov)ASMA- 20 Deccommercial season closed1 Jan- MFC <strong>and</strong> WRCadopted joint rulesestablishing the AlbemarleSound <strong>Management</strong> Area(ASMA) <strong>and</strong> the RoanokeRiver <strong>Management</strong> Area(RRMA). Harvestmanagement in the twoareas based upon anallocation <strong>of</strong> 29,400 lb.(TAC) per year for eacharea (corresponds to an80% reduction in historicalhook <strong>and</strong> line harvest)WRC managementauthority for hook <strong>and</strong> lineharvest- Joint <strong>and</strong> Inl<strong>and</strong>Waters <strong>of</strong> RRMA(Roanoke, Middle,Eastmost <strong>and</strong> Cashierivers <strong>and</strong> their tributaries)MFC managementauthority for hook <strong>and</strong> lineharvest in the remainingInternal Coastal, Joint <strong>and</strong>Inl<strong>and</strong> Waters <strong>of</strong> theASMA (Albemarle,Currituck, Roanoke <strong>and</strong>Croatan sounds <strong>and</strong> theirtributaries)(Defined areas only applyto striped bass hook <strong>and</strong>line harvest management)1 Jan- hook <strong>and</strong> line354
Year Statewide ASMA/RRMA Central/Southernseason opened in ASMABy emergency rule hook<strong>and</strong> line season opened 1Jan in RRMA (WRC/Jan)31 Jan- hook <strong>and</strong> lineseason closed in ASMA(DMF/Jan)7 Feb- hook <strong>and</strong> lineseason opened in ASMA(DMF/Feb)1 May- hook <strong>and</strong> lineseason closed in ASMA(DMF/May)By emergency rule theWRC closed the hook <strong>and</strong>line season 1 May inRRMA (WRC/May)By <strong>NC</strong> General Statute113-292 (effective May 23,1991) the WRC wasgranted proclamationauthority to open <strong>and</strong>close hook <strong>and</strong> line stripedbass seasons in the inl<strong>and</strong><strong>and</strong> joint waters <strong>of</strong> coastalrivers1 Nov- hook <strong>and</strong> lineseason opened in ASMA,18 in TL minimum sizelimit <strong>and</strong> daily creel limit <strong>of</strong>3 fish (DMF/Nov)30 Nov- hook <strong>and</strong> lineseason closed in theASMA (DMF/Nov)By rule effective 1 Jul, inRRMA the following wereestablished during theopen season: 1 Jan- 31Mar- Inl<strong>and</strong> Waters- 1 fishdaily creel, 18 in TLminimum size limit, JointWaters- 3 fish daily creel,18 in TL minimum sizelimit1 Apr- 31 May- Inl<strong>and</strong>Waters 3 fish daily creel,18 in TL minimum sizelimit <strong>and</strong> NO fish between355
Year Statewide ASMA/RRMA Central/Southern22- 27 in TL mayberetained from US Hwy 258to Roanoke Rapids Dam;Joint Waters- 3 fish dailycreel, 18 in TL minimumsize limit1 Jun- 31 Dec- Inl<strong>and</strong>Waters- 1 fish daily creel,18 in TL minimum sizelimit, Joint Waters- 3 fishdaily creel, 18 in TLminimum size limit1992 Throughout 1992 in theASMA (excluding Croatan<strong>and</strong> Roanoke sounds)harvest permittee waslimited to specific yardage<strong>of</strong> gill nets with stretchedmesh less than 5 ¼ in.Gear <strong>and</strong> area restrictionsvaried seasonally.Stationary gill nets wereprohibited in the RRMA.ASMA- 11 Jan commercialseason opened, harvestpermittee limited to l<strong>and</strong>ing10 fish per day (DMF/Jan)ASMA- 3 Feb commercialharvest permittee limitedto l<strong>and</strong>ing 5 fish per day(DMF/Feb)ASMA- 19 Mar commercialharvest permittee limitedto l<strong>and</strong>ing 3 fish per day.Drift gill nets allowed inRoanoke, Middle,Eastmost <strong>and</strong> Cashierivers.21 Apr- commercial seasonclosed in all Internal Coastal<strong>and</strong> Joint waters, outside theASMA (DMF/Apr)23 Oct- commercial seasonopened in all Internal Coastal<strong>and</strong> Joint Waters, outside theASMAASMA- 16 Apr commercialseason closedASMA- 3 Jul- small meshgill nets must be attendedat all times (DMF/Jun)ASMA- 21 Oct- smallmesh gill nets must beattended between sunrise<strong>and</strong> sunset (DMF/Oct)ASMA- 9 Nov- commercialseason opened with aclosure date 20 Nov,harvest permittee limited356
Year Statewide ASMA/RRMA Central/Southernto l<strong>and</strong>ing 3 fish per day(DMF/Oct)ASMA- 23 Nov- allowedunattended small mesh gillnets (DMF/Nov)RRMA- 1 Jan- hook <strong>and</strong>line season opened(WRC/Jan)ASMA- 1 Jan- hook <strong>and</strong>line season opened(DMF/Dec)RRMA- 20 Apr- hook <strong>and</strong>line season closed(WRC/Apr)ASMA- 1 May- hook <strong>and</strong>line season closed(DMF/Apr)ASMA- 1 Nov- hook <strong>and</strong>line season opened(DMF/Oct)ASMA- 30 Nov- hook <strong>and</strong>line season closed(DMF/Nov)1993 Throughout 1993, ASMA(excluding Croatan <strong>and</strong>Roanoke sounds) harvestpermittee were limited tospecific yardage <strong>of</strong> gillnets with a stretched meshless than 5 ¼ in. Gear<strong>and</strong> area restrictionsvaried seasonally.Stationary gill nets wereprohibited in RRMA.RRMA- 18 Jan drift gillnets allowedASMA- 1 Feb commercialseason opened, harvestpermittee limited to l<strong>and</strong>ing5 fish per day, prohibitedharvest from commercialgear in RRMAASMA- 1 Mar commercialharvest permittee limitedto l<strong>and</strong>ing 3 fish per day17 Jan commercial seasonclosed in Internal Coastal <strong>and</strong>Joint Waters1 Feb commercial seasonopened in all Internal Coastal<strong>and</strong> Joint Waters, outsideASMA5 Apr commercial seasonclosed in Internal Coastal <strong>and</strong>Joint Waters outside theASMAASMA- 5 Apr commercialseason closedASMA- 17 May gill nets357
Year Statewide ASMA/RRMA Central/Southernprohibited in BatchelorBay-western AlbemarleSound <strong>and</strong> RRMA,excluding the prohibitedarea, gill nets in thewestern sound fromChowan River to the <strong>NC</strong>Power Transfer Line mustbe attendedASMA- 2 Aug small meshgill nets must be attendedat all times, excludingCroatan <strong>and</strong> RoanokesoundsASMA- 6 Oct small meshgill nets prohibited in waterdepth greater than 6 ft,excluding Croatan <strong>and</strong>Roanoke soundsRRMA- 1 Feb hook <strong>and</strong>line season openedASMA- 1 Feb hook <strong>and</strong>line season openedASMA- 18 Apr hook <strong>and</strong>line season closedRRMA- 25 Apr hook <strong>and</strong>line season closed1994 ASMA- 19 Febrecreational season openharvestdays Wed, Sat<strong>and</strong> Sun- 3 fish perperson, 18 in TL minimumsize limit <strong>and</strong> 15,000pounds spring allocationASMA- 21 Februarycommercial season openpermitteelimited to l<strong>and</strong>ing10 fish per day <strong>and</strong> 18 inTL minimum size limitASMA- 16 Marrecreational season closedRRMA- 19 Feb, hook anline season opened,possession limited to Wed,Sat <strong>and</strong> Sun, 2 Apr, lowerriver closed, 21 Apr, upperriver closedRRMA- effective 1 Jul,protective 22 to 27 in TLslot limit extended to entireCommercial 25,000 lb. TACfor joint <strong>and</strong> internal coastalwaters, outside the ASMAwith the approval <strong>of</strong> the FMPby the MFC <strong>and</strong> WRC(Annual 1994-2002)Upper portions <strong>of</strong> Pamlico,Pungo, Bay <strong>and</strong> NeuseRivers- 1 Sep gill nets lessthan 5 ISM must be attendedat all timesUpper portions <strong>of</strong> Pamlico,Pungo, Bay <strong>and</strong> NeuseRivers- 12 Oct attendancelifted on all areas exceptupper Pamlico River13 Mar commercial seasonclosed in all Internal Coastal<strong>and</strong> Joint Waters358
Year Statewide ASMA/RRMA Central/SouthernRoanoke River, 1 Apr- 31May (WRC)ASMA- 21 Novcommercial season openpermitteelimited to l<strong>and</strong>ing5 fish per day <strong>and</strong> 18 in TLminimum size limitASMA- 23 Novrecreational season openharvestdays Wed, Sat<strong>and</strong> Sun- 3 fish perperson, 18 in TL minimumsize limitASMA- 7 Dec recreationalseason closedASMA- 21 Feb no gill netsset from 4:00 p.m. Fridayuntil sunrise MondayASMA- 14 Mar- 15 Apr nogill nets set from 4:00 p.m.on Friday until sunriseMonday, 16 Apr – 31 Mayall gill nets attended 7days per week, exceptflounder netsBatchelor Bay/ WesternAlbemarle Sound closedASMA- 1 Jun- 28 Octsmall mesh gill nets 1,000yd limit attended unlessset in water less than 7 ftASMA- 17 Oct- 18 Novsmall mesh gill nets 1,000yd limit- attendedBatchelor Bay/ WesternAlbemarle Sound closedASMA- 18 Nov no gill netsset from 4:00 p.m. Fridayuntil sunrise Monday,small mesh gill netsattended, 3,000 yd limitfloundernets1995 ASMA- 16 Jan small meshgill nets (3 <strong>and</strong> 3 ¼) limit800 yds, drift gill net 2 ½-3 ISM, no flounder netsPortions (upper <strong>and</strong> 200 yds.<strong>of</strong>f shore) <strong>of</strong> Pamlico <strong>and</strong>Pungo Rivers- 20 Mar gillnets less than 5 ISM attendedat all times359
Year Statewide ASMA/RRMA Central/SouthernASMA- 1 Mar recreationalseason openPortions (upper <strong>and</strong> 200 yds.<strong>of</strong>f shore) <strong>of</strong> Pamlico <strong>and</strong>Pungo rivers- 8 Decattendance lifted for gill netsless than or equal to 3 ½ISM in nets nearshore inlower riversASMA- 1 Mar commercialseason open- permitteelimited to l<strong>and</strong>ing 5 fish perday, 18 in TL minimumsize limitASMA- 19 Marrecreational season closedASMA- 4 Apr commercialharvest- permittee limitedto l<strong>and</strong>ing 2 fish per day(striped bass not toexceed 5% <strong>of</strong> total weight<strong>of</strong> catch), 18 in TLminimum size limit,commercial season close14 Apr; Mesh size <strong>and</strong>yardage restrictions on gillnets, area closureASMA- 22 Novcommercial season open,18 in TL minimum sizelimit, limited to l<strong>and</strong>ing 2fish per day, harvestpermit required <strong>and</strong> saletagsASMA- 22 Novrecreational season open,harvest days Wed, Sat<strong>and</strong> Sun, 21 in TLminimum size limit, 2 fishper dayASMA- 24 Decrecreational season closedASMA- 26 Deccommercial season closedRRMA- 1 Mar, hook <strong>and</strong>line season opened,possession limited to Wed,Sat, <strong>and</strong> Sun, 9 Apr, lowerriver closed, 14 Apr, upperriver closedPamlico Sound, Pamlico, Bay<strong>and</strong> Neuse rivers- 22 Novcommercial season open, 18in TL minimum size limit,limited to l<strong>and</strong>ing 10 fish perday, permit required/ saletags1996 ASMA- 16 Feb commercial Cape Fear River- 29 Jan360
Year Statewide ASMA/RRMA Central/Southernseason open, 18 in TLminimum size limit, limitedto l<strong>and</strong>ing 5 fish per day(not to exceed 25% byweight <strong>of</strong> total catch),permit required <strong>and</strong> saletags, season close 15 Aprcommercial season open, 18in TL minimum size limit,limited to l<strong>and</strong>ing 10 fish perday, permit required <strong>and</strong> saletags, season close 30 AprASMA- 16 Marrecreational season openharvestdays Wed, Sat<strong>and</strong> Sun, 18 in TLminimum size limit, 3 fishper person per dayASMA- 31 Marrecreational season closedASMA- 8 Apr commercialseason, 18 in TL minimumsize limit, limited to l<strong>and</strong>ing3 fish per day (not toexceed 15% by weight <strong>of</strong>the total catch)ASMA- 30 Novcommercial season open,18 in TL minimum sizelimit, limited to l<strong>and</strong>ing 5fish per day (not to exceed25% by weight <strong>of</strong> totalcatch, permit required <strong>and</strong>sale tagsASMA- 22 Decrecreational season closedASMA- 23 Deccommercial 18 in TLminimum size limit, limitedto l<strong>and</strong>ing 10 fish per day(not to exceed 25% byweight <strong>of</strong> total catch),close 31 DecRRMA- 16 Mar, hook <strong>and</strong>line season opened,possession limited to Wed,Sat, <strong>and</strong> Sun, 10 Apr,lower river closedRRMA- effective 1 Jul,single barbless hook ruleUpper portions <strong>of</strong> Pamlico,Pungo, Bay, Neuse <strong>and</strong> TrentRivers- gill nets less than 5ISM must be attended at alltimesPamlico Sound, Pamlico,Pungo, Bay <strong>and</strong> Neuserivers- 29 Feb commercialseason open, 18 in TLminimum size limit, limited tol<strong>and</strong>ing 5 fish per day, permitrequired <strong>and</strong> sale tagsPamlico Sound, Pamlico ,Pungo, Bay <strong>and</strong> Neuserivers- 12 Dec commercialseason open, 18 in TL sizelimit, limited to l<strong>and</strong>ing 5 fishper day (not to exceed 25%by weight <strong>of</strong> total catch),harvest permits , seasonclose 31 Dec361
Year Statewide ASMA/RRMA Central/Southernenacted for RoanokeRiver, 1 Apr- 30 Jun,Roanoke River, 1 Apr- 30June, Roanoke RapidsLake Dam down stream toUS Hwy 258 bridge (WRC)1997 ASMA- 15 Feb commercialseason open, 18 in TLminimum size limit, limitedto l<strong>and</strong>ing 3 fish per day(not to exceed 25% byweight <strong>of</strong> total catchASMA- 15 Marrecreational season open,18 in TL minimum sizelimit, 3 fish per day,harvest days- Wed, Sat<strong>and</strong> SunASMA- 23 Marrecreational season closedASMA- 24 Marcommercial, 18 in TLminimum size limit, limitedto l<strong>and</strong>ing 7 fish per day(not to exceed 40% byweight <strong>of</strong> total catch),permit <strong>and</strong> sale tagsrequired, season closed15 AprASMA- 15 Novrecreational season open,21 in TL minimum sizelimit, 2 fish per day,harvest days- Wed, Sat<strong>and</strong> Sun, season close 31DecASMA- 3 Nov commercialseason open, 18 in TLminimum size limit, limitedto l<strong>and</strong>ing 5 fish per day(not to exceed 50% byweight <strong>of</strong> total catch),permit required <strong>and</strong> saletagsCape Fear River- 13 Jancommercial season open, 18in TL minimum size limit,limited to l<strong>and</strong>ing 10 fish perday, season close 30 AprPamlico Sound, Pamlico,Pungo, Bay <strong>and</strong> Neuse rivers<strong>and</strong> Carteret County- 15 Febcommercial season open, 18in TL minimum size limit,limited to l<strong>and</strong>ing 3 fish perday (not to exceed 25% byweight <strong>of</strong> total catch)Pamlico Sound, Pamlico,Pungo, Bay <strong>and</strong> Neuse rivers<strong>and</strong> Carteret County- 22 Marcommercial season closedPamlico Sound, Pamlico,Pungo, Bay, Neuse, WhiteOak <strong>and</strong> all Internal Waters <strong>of</strong>Carteret County- 3 Novcommercial season open, 18in TL minimum size limit,limited to l<strong>and</strong>ing 5 fish perday, permit <strong>and</strong> sale tagsrequiredPamlico Sound, Pamlico,Pungo, Bay, Neuse, WhiteOak <strong>and</strong> all Internal Waters <strong>of</strong>Carteret County- 19 Novcommercial season closedPortions <strong>of</strong> Pamlico, Pungo,Neuse <strong>and</strong> Trent Rivers- 24Jan attendance required forgill nets less than or equal to5 ISM, except gill nets lessthan or equal to 3 ½ ISM innearshore (less than 200 ydsfrom shore) in lower riversASMA- 5 Dec commercial362
Year Statewide ASMA/RRMA Central/Southernseason closedRRMA- 15 Mar, hook <strong>and</strong>line season opened,possession limited to Wed,Sat, <strong>and</strong> Sun, 23 Mar,lower river closed, 2 Apr,upper river closed, upperriver reopened 19 Apr for a6 hour season to useremaining allowableharvest1998 ASMA- TAC commercial125,440 lb., recreational62,720 lb., RRMA- TACrecreational 62,720 lb.ASMA- 16 Feb commercialseason open, 18 in TLminimum size limit, limitedto l<strong>and</strong>ing 5 fish per day,dealer permit <strong>and</strong> saletags requiredASMA- 14 Marrecreational seasonopen, 18 in TLminimum size limit, 3fish per day, harvestdays- Wed, Sat <strong>and</strong>SunASMA- 8 Apr commercialseason closedASMA- 22 Apr recreationalseason closedASMA- 28 Oct recreationalseason open, 18 in TLminimum size limit, 2 fishper day, harvest days-Wed, Sat <strong>and</strong> Sun, seasonclose 30 DecCape Fear River- 8 Jancommercial season open, 18in TL minimum size limit,limited to l<strong>and</strong>ing 10 fish perday, permit <strong>and</strong> sale tagsrequired, season close 30 AprPamlico Sound, CoastalRivers, Bays <strong>and</strong> Tributaries<strong>and</strong> Internal Waters <strong>of</strong>Carteret County- 16 Febcommercial season open, 18in TL minimum size limit,limited to l<strong>and</strong>ing 5 fish perday, dealer permit <strong>and</strong> saletags requiredAll Internal Coastal Waters-Carteret, Craven, Beaufort<strong>and</strong> Pamlico Counties <strong>and</strong>Pamlico <strong>and</strong> Pungo rivers- 1Dec commercial seasonopen, 18 in TL minimum sizelimit, limited to l<strong>and</strong>ing 5 fishper day, dealer permit <strong>and</strong>sale tags required, close 31DecPortions <strong>of</strong> upper Pamlico,Pungo, Neuse <strong>and</strong> TrentRivers- 1 Dec through 30 Aprattendance requires for gillnets less than 5 ISM <strong>and</strong>within 200 yds. <strong>of</strong> shore363
Year Statewide ASMA/RRMA Central/SouthernASMA- 1 Dec commercialseason open, 18 in TLminimum size limit, limitedto l<strong>and</strong>ing 10 fish per day,dealer permit <strong>and</strong> saletags required, seasonclose 31 DecRRMA- 14 Mar, hook <strong>and</strong>line season opened,possession limited to Wed,Sat, <strong>and</strong> Sun, 12 Apr,lower river closed, 29 Apr,upper river closed1999 Internal Coastal <strong>and</strong> JointWaters- 6 Nov recreationalseason open, 18 in TLminimum size limit, 3 fishper person per dayAll Primary Nursery Areas(PNAs) <strong>and</strong> SecondaryNursery Area (SNAs), notrawl areas (Outer Banksareas modified) <strong>and</strong> within200 yds. <strong>of</strong> shore- 1 Maythrough 31 Oct gill netsless than 5 ISM must beattended each yearASMA- TAC commercial137,984 lbs., recreational68,992 lbs., RRMA- TACrecreational 68,992 lbs.ASMA- 1 Jan recreationalseason open, 18 in TLminimum size limit, 2 fishper person per day,harvest days- Wed, Sat<strong>and</strong> Sun, season close 16MarCape Fear River- Internal,Joint <strong>and</strong> Coastal Waters-8 Jan commercial seasonopen, minimum size limit 18in TL, limited to l<strong>and</strong>ing 10fish per day, dealer permit<strong>and</strong> sale tags required,season close 30 AprAll Internal Coastal Waters <strong>of</strong>Carteret, Craven, Beaufort,<strong>and</strong> Pamlico Counties,Pamlico <strong>and</strong> Pungo Rivers<strong>and</strong> Pamlico Sound- 9 Febcommercial season open, 18in TL minimum size limit,limited to l<strong>and</strong>ing 5 fish perday, dealer permit <strong>and</strong> saletags requiredASMA- 9 Feb commercialseason open, 18 in TLminimum size limit, limitedto l<strong>and</strong>ing 5 fish per day,dealer permit required <strong>and</strong>sale tags, season close 28MarASMA-29 Mar commercial18 in TL minimum sizelimit, limited to l<strong>and</strong>ing 10fish per day, dealer permit<strong>and</strong> sale tags required,season closed 15 AprAll Internal Coastal Waters <strong>of</strong>Carteret, Craven, Beaufort<strong>and</strong> Pamlico Counties,Pamlico <strong>and</strong> Pungo rivers<strong>and</strong> Pamlico Sound- 5 Aprcommercial season closedUpper Pamlico, Pungo <strong>and</strong>Neuse Rivers- 1 May gill netsless than 5 ISM must beattended at all times (yearround)ASMA- 2 Apr recreationalseason open, 18 in TLminimum size limit, 2 fishper person per day,harvest days- Fri, Sat, Sun<strong>and</strong> Mon, season close 5AprAll Internal Coastal WatersCarteret, Craven, Beaufort<strong>and</strong> Pamlico Counties,Pamlico, Pungo <strong>and</strong> WhiteOak rivers- 1 Dec commercialseason open, 18 in TLminimum size limit, limited to364
Year Statewide ASMA/RRMA Central/Southernl<strong>and</strong>ing 5 fish per day,dealer permit <strong>and</strong> sale tagsrequired, season close 31DecASMA- 6 Nov recreationalseason open, 18 in TLminimum size limit, 2 fishper person per day,harvest days- Wed, Sat<strong>and</strong> Sun, season close 29Dec2000 Effective 1 Jul, no stripedbass 22 to 27 in TL maybe possessed in the Inl<strong>and</strong>Waters <strong>of</strong> Tar <strong>and</strong> Neuseriver, 1 Apr- 31 MayASMA- 1 Dec commercialseason open, 18 in TLminimum size limit, limitedto l<strong>and</strong>ing 10 fish per day,dealer permit <strong>and</strong> saletags required, seasonclose 12 DecASMA- 13 Deccommercial season open,18 in TL minimum sizelimit, limited to l<strong>and</strong>ing 5fish per day, dealer permit<strong>and</strong> sale tags required,season close 31 DecRRMA- 13 Mar, hook <strong>and</strong>line season opened,possession limited to Wed,Sat <strong>and</strong> Sun, 7 Apr, lowerriver closed, 28 Apr, upperriver closedASMA- TAC commercial225,000 lbs., recreational112,500 lbs., RRMA- TACrecreational 112,500 lbs.ASMA- 1 Jan recreationalseason open, 18 in TLminimum size limit, 2 fishper person per day,harvest days- Wed, Fri,Sat <strong>and</strong> Sun, season close26 AprASMA- 7 Jan commercialseason open, 18 in TLminimum size limit, limitedto l<strong>and</strong>ing 5 fish per day,dealer permit <strong>and</strong> saletags required, seasonclose 26 MarCape Fear River- 8 Jancommercial season open, 18in TL minimum size limit,1imited to l<strong>and</strong>ing 10 fish perday, dealer permit <strong>and</strong> saletags required, season close30 AprInternal Coastal WatersCarteret, Craven, Beaufort<strong>and</strong> Pamlico Counties, Pungo<strong>and</strong> White Oak Rivers <strong>and</strong>Pamlico Sound- 11 Febcommercial season open, 18in TL minimum size limit,limited to l<strong>and</strong>ing 5 fish per365
Year Statewide ASMA/RRMA Central/Southernday, dealer permit <strong>and</strong> saletags requiredASMA- 27 Marcommercial, 18 in TLminimum size limit, limitedto l<strong>and</strong>ing 10 fish per day,dealer permit <strong>and</strong> saletags required, seasonclose 15 AprASMA- 11 Oct recreationalseason open, 18 in TLminimum size limit, 2 fishper person per day,harvest days- Wed, Fri,Sat <strong>and</strong> Sun, season close12 NovASMA- 13 Novcommercial season open,18 in TL minimum sizelimit, limited to l<strong>and</strong>ing 5fish per day, dealer permit<strong>and</strong> sale tags required,season close 31 DecASMA- 15 Novrecreational season open,18 in TL minimum sizelimit, 1 fish per person perday, harvest days- Wed,Fri, Sat <strong>and</strong> Sun, seasonclose 3 DecRRMA- 15 Mar, hook <strong>and</strong>line season opened,possession limited to Tue,Wed, Sat <strong>and</strong> Sun, 12 Aprlower river closed, 30 Aprupper river closedPamlico Sound- InternalCoastal Waters- 9 Marcommercial season closedInternal Coastal WatersCarteret, Craven, Beaufort,<strong>and</strong> Pamlico Counties, Pungo<strong>and</strong> White Oak Rivers- 24Mar commercial seasonclosedInternal Coastal WatersCarteret, Craven, Beaufort,<strong>and</strong> Pamlico Counties, Pungo<strong>and</strong> White Oak Rivers- 13Nov commercial seasonopen, 18 in TL minimum sizelimit, limited to l<strong>and</strong>ing 5 fishper day, dealer permit <strong>and</strong>sale tags requiredInternal Coastal WatersCarteret, Craven, Beaufort,<strong>and</strong> Pamlico Counties, Pungo<strong>and</strong> White Oak Rivers- 28Nov commercial seasonclosed2001 ASMA- 5 Jan commercialseason open, 18 in TLminimum size limit, limitedto l<strong>and</strong>ing 5 fish per day,dealer permit <strong>and</strong> saletags required, seasonclosed 25 MarASMA- 17 Jan recreationalseason open, 18 in TLminimum size limit, 2 fishper person per day,harvest days- Wed, Fri,Sat <strong>and</strong> Sun, season close18 AprCape Fear River- 8 Jancommercial season open,18in TL minimum size limit,limited to l<strong>and</strong>ing 10 fish perday, dealer permit <strong>and</strong> saletags required, season close30 AprInternal Coastal WatersCarteret, Craven, Beaufort<strong>and</strong> Pamlico Counties, Pungo<strong>and</strong> White Oak Rivers <strong>and</strong>Pamlico Sound- 12 Febcommercial season open, 18in TL minimum size limit,366
Year Statewide ASMA/RRMA Central/Southernlimited to l<strong>and</strong>ing 5 fish perday, dealer permit <strong>and</strong> saletags requiredASMA- 26 Mar commercialseason open, 18 in TLminimum size limit, limitedto l<strong>and</strong>ing 10 fish per day,dealer permit <strong>and</strong> saletags required, seasonclose 15 AprASMA- 17 Oct recreationalseason open, 18 in TLminimum size limit, 2 fishper person per day,harvest days- Wed, Fri,Sat <strong>and</strong> Sun, seasonclosed 25 NovPamlico Sound- InternalCoastal Waters- 2 Marcommercial season closedInternal Coastal WatersCarteret, Craven, Beaufort,<strong>and</strong> Pamlico Counties, Pungo<strong>and</strong> White Oak Rivers- 14Mar commercial seasonclosedASMA- 19 Novcommercial season open,18 in TL minimum sizelimit, limited to l<strong>and</strong>ing 5fish per day, dealer permit<strong>and</strong> sale tags required,season closed 21 DecRRMA- 13 Mar hook <strong>and</strong>line season opened,possession limited to Tue,Wed, Sat <strong>and</strong> Sun, 22 Aprlower river closed, 29 Aprupper river closed2002 ASMA- 7 Jan commercialseason open, 18 in TLminimum size limit, limitedto l<strong>and</strong>ing 5 fish per day (not to exceed 50% byweight <strong>of</strong> the total catch),dealer permit <strong>and</strong> saletags required, seasonclosed 15 AprASMA- 7 Jan small meshgill nets not to exceed 800yds, 5 ¼ ISM <strong>and</strong> largerflounder nets limited to3,000 yds, 5 ¼ ISM <strong>and</strong>larger shad (float) netslimited to 1,000 yds (18Feb- 14 Apr), westernAlbemarle Sound areaclosed to gill netsInternal Coastal WatersCarteret, Craven, Beaufort,<strong>and</strong> Pamlico Counties, Pungo<strong>and</strong> White Oak Rivers- 3 Deccommercial season open, 18in TL minimum size e limit,limited to l<strong>and</strong>ing 5 fish perday, dealer permit <strong>and</strong> saletags requiredInternal Coastal WatersCarteret, Craven, Beaufort,<strong>and</strong> Pamlico Counties, Pungo<strong>and</strong> White Oak Rivers- 14Dec commercial seasonclosedCape Fear River- 7 Jancommercial season open, 18in TL minimum size limit,limited to l<strong>and</strong>ing 10 fish perday, dealer permit <strong>and</strong> saletags required, season close30 AprInternal Coastal WatersCarteret, Craven, Beaufort<strong>and</strong> Pamlico Counties, Pungo<strong>and</strong> White Oak Rivers <strong>and</strong>Pamlico Sound- 25 Febcommercial season open, 18in TL minimum size limit,limited to l<strong>and</strong>ing 5 fish perday, dealer permit <strong>and</strong> saletags required, season closed16 Mar367
Year Statewide ASMA/RRMA Central/SouthernASMA- 16 Jan recreationalseason open, 18 in TLminimum size limit, 2 fishper person per day,harvest days- Wed, Fri,Sat <strong>and</strong> Sun, seasonclosed 14 AprRRMA- hook <strong>and</strong> lineseason set by WRCregulations, lower riveropen 1 Mar- 15 Apr, upperriver open 15 Mar- 30 Apr,creel limit reduced to 2fish/day, possessionallowed 7 days/week,protective 22- 27 in TL slotlimit extended to includethe entire open harvestseasonASMA- 4 Nov commercialseason open, 18 in TLminimum size limit, limitedto l<strong>and</strong>ing 5 fish per day,dealer permit <strong>and</strong> saletags required, seasonclosed 20 DecASMA- 6 Nov recreationalseason open, 18 in TLminimum size limit, 2 fishper person per day,harvest days- Wed, Fri,Sat <strong>and</strong> Sun, seasonclosed 29 Dec2003 ASMA- 6 Jan commercialseason open, 18 in TLminimum size limit, limitedto l<strong>and</strong>ing 5 fish per day,dealer permit <strong>and</strong> saletags required, season toclose15 Apr, unless closedearlier by proclamationASMA- 15 Jan recreationalseason open, 18 in TLminimum size limit, 2 fishper person per day,harvest days- Wed, Fri,Sat <strong>and</strong> Sun, season willclosed 23 Apr, re-open 25Apr <strong>and</strong> closed 30 Apr, 18Internal Coastal WatersCarteret, Craven, Beaufort<strong>and</strong> Pamlico Counties, Pungo<strong>and</strong> White Oak Rivers- 2 Deccommercial season open, 18in TL minimum size limit,limited to l<strong>and</strong>ing 5 fish perday, dealer permit <strong>and</strong> saletags required, season closed13 DecCape Fear River- 9 Jancommercial season open, 18in TL minimum size limit,limited to l<strong>and</strong>ing 10 fish perday, dealer permit <strong>and</strong> saletags required, season closes30 AprInternal Coastal WatersCarteret, Craven, Beaufort<strong>and</strong> Pamlico Counties, Pungo<strong>and</strong> White Oak Rivers <strong>and</strong>Pamlico Sound- 3 Marcommercial season open, 18in TL minimum size limit,limited to l<strong>and</strong>ing 5 fish per368
Year Statewide ASMA/RRMA Central/Southernin TL minimum size limit, 2fish per person, harvestdays- Wed, Fri, Sat <strong>and</strong>day, dealer permit <strong>and</strong> saletags required, season closed31 MarSunRRMA- hook <strong>and</strong> lineseason set by WRCregulations, lower riveropen 1 Mar- 15 Apr, upperriver open 15 Mar- 30 Apr,creel limit reduced to 2fish/day, possessionallowed 7 days/week,protective 22- 27 in TL slotlimit extended to includethe entire open harvestseason, only 1 <strong>of</strong> the 2 fishdaily creel limit may begreater than 27 in TL369
RULE CHANGES ASSOCIATED WITH THE STRIPED BASS FMPNovember, 2003The Estuarine Striped Bass <strong>Fishery</strong> <strong>Management</strong> <strong>Plan</strong> (FMP) in itspresent form defines an additional management area (Central/Southern),which necessitates several changes in the rules <strong>of</strong> the Marine FisheriesCommission <strong>and</strong> the Wildlife Resources Commission where descriptions <strong>of</strong>those management units appear. Below are the proposed changes thatpertain to the North Carolina Rules for Coastal Fisheries <strong>and</strong> the Joint Rules(MFC Rules):(1) The “new” descriptions <strong>of</strong> the management areas would be placed in the MFCRulebook under 15A <strong>NC</strong>AC 3R, where all <strong>of</strong> our descriptive boundaries are found.This would be an appropriate place to add any other management areas that mayevolve in the future, such as a Cape Fear <strong>Management</strong> Area.SECTION .0200 – FISHERY MANAGEMENT AREAS15A <strong>NC</strong>AC 03R .0201STRIPED BASS MANAGEMENT AREASThe Albemarle Sound <strong>Management</strong> Area is defined designated as Albemarle Sound<strong>and</strong> all its joint <strong>and</strong> inl<strong>and</strong> water tributaries, (except for the Roanoke, Middle,Eastmost <strong>and</strong> Cashie rivers), Currituck, Roanoke <strong>and</strong> Croatan sounds <strong>and</strong> all theirjoint <strong>and</strong> inl<strong>and</strong> water tributaries, including Oregon Inlet, north <strong>of</strong> a line beginning ata point 35° 48 .3693’N - 75° 43 .7232’W on Roanoke Marshes Point, runningsoutheasterly to a point 35° 44 .1710’N - 75° 31 .0520’W on the north point <strong>of</strong> EagleNest Bay.The Roanoke River <strong>Management</strong> Area is defined designated as Roanoke River <strong>and</strong> itsjoint <strong>and</strong> inl<strong>and</strong> tributaries, including Middle, Eastmost <strong>and</strong> Cashie rivers, up to theRoanoke Rapids dam.The Central/Southern <strong>Management</strong> Area is defined designated as all internal coastal,<strong>and</strong> joint <strong>and</strong> contiguous inl<strong>and</strong> waters south <strong>of</strong> a line beginning at a point 35° 48.3693’N - 75° 43 .7232’W on Roanoke Marshes Point, running southeasterly to apoint 35° 44 .1710’N - 75° 31 .0520’W on the north point <strong>of</strong> Eagle Nest Bay, to theSouth Carolina line.(2) The description <strong>of</strong> the management areas appear in the dealer permit rule in a moredetailed version that delineates the boundaries <strong>of</strong> the Croatan, Roanoke <strong>and</strong>Currituck sounds. It is not known why this longer version exists as it has noquota monitoring or management use. It is proposed that the longer version bestricken <strong>and</strong> the ASMA <strong>and</strong> the CSMA descriptions in 3R be referred to in 3O.15A <strong>NC</strong>AC 03O .0503(2) Striped Bass Dealer Permit:370
(A)It is unlawful for a fish dealer to possess, buy, sell or <strong>of</strong>fer for salestriped bass taken from the following areas without first obtaining aStriped Bass Dealer Permit validated for the applicable harvestarea:(i)(ii)(iii)Atlantic Ocean;Albemarle Sound <strong>Management</strong> Area as designated in 15A<strong>NC</strong>AC 3R .0201. for Striped Bass which is defined asAlbemarle Sound <strong>and</strong> all its joint water tributaries includingRoanoke River, up to the Hwy. 258 bridge; Eastmost <strong>and</strong>Middle Rivers, <strong>and</strong> Cashie River below Sans Souci Ferry;Currituck Sound <strong>and</strong> all its joint water tributaries; Roanoke<strong>and</strong> Croatan Sounds <strong>and</strong> all their joint water tributaries,including Oregon Inlet, east <strong>of</strong> a line from Baum Point 35°55.1602’ N – 75° 39.5736’W to Rhodoms Point 36° 00.2146’N – 75° 43.6399’ W <strong>and</strong> east <strong>of</strong> a line from Eagleton Point36° 01.3178’ N – 75° 43.6585’ W; to Long Point 36° 02.4971’N – 75° 44.2261’ W at the mouth <strong>of</strong> Kitty Hawk Bay <strong>and</strong>north <strong>of</strong> a line from Roanoke Marshes Point 35° 48.3693’ N– 75° 43.7232’ W to the north point <strong>of</strong> Eagle Nest Bay 35°44.1710’ N – 75° 31.0520’ W; Croatan Sound south <strong>of</strong> a lineat the Highway 64/264 bridge Point at Manns Harbor <strong>and</strong>north <strong>of</strong> a line from Roanoke Marshes 35° 48.3693’ N – 75°43.7232’ W across to the north point <strong>of</strong> Eagle Nest Bay 35°44.1710’ N – 75° 31.0520’ W;Central Area which is defined as all internal coastal waters <strong>of</strong>Carteret, Craven, Beaufort, <strong>and</strong> Pamlico counties; WhiteOak <strong>and</strong> Pungo rivers; <strong>and</strong> Pamlico Sound south <strong>of</strong> a linefrom Roanoke Marshes Point 35° 48.3693’ N – 75° 43.7232’W to the north point <strong>of</strong> Eagle Nest Bay 35° 44.1710’ N – 75°31.0520’ W (southern boundary <strong>of</strong> the Albemarle Sound<strong>Management</strong> Area for Striped Bass) to the countyboundaries;(iv) Southern Area which is defined as all internal coastal waters<strong>of</strong> Pender, Onslow, New Hanover, <strong>and</strong> Brunswick counties.(iii) The joint <strong>and</strong> coastal waters <strong>of</strong> the Central/Southern<strong>Management</strong> Area as designated in 15A <strong>NC</strong>AC 3R .0201.*Note that this will necessitate the changing <strong>of</strong> the areas described on theStriped Bass Dealer Permit(3) The management areas need to be referenced in the 15A <strong>NC</strong>AC 3M .0200 Section,which are general striped bass rules. The following language is proposed for an (e)at the end <strong>of</strong> the Rule:371
15A <strong>NC</strong>AC 03M .0201.0207 ESTUARINE STRIPED BASS MANAGEMENT AREAS(e) The management units <strong>and</strong> recreational fishery management areas forestuarinestriped bass fisheries in coastal NorthCarolina are designated in 15 A <strong>NC</strong>AC 03R .0201.(4) The following are Joint Rules that are shared by the MFC <strong>and</strong> WRC. They mustbe adopted by both commissions <strong>and</strong> be worded the same. The administrativeprocedures <strong>of</strong> both commissions should be coordinated so that the effective date<strong>of</strong> this adoption occurs simultaneously.15A <strong>NC</strong>AC 03Q .0108 (WRC Rule 15A <strong>NC</strong>AC 10C .0110)MANAGEMENT PLANS RESPONSIBILITY FOR ESTUARINE STRIPED BASS INJOINT WATERS(a) The management units areas for estuarine striped bass fisheries in coastalNorth Carolina are designated in 15A <strong>NC</strong>AC 3R .0201.(b) In order to effectively manage the recreational hook <strong>and</strong> line harvest in jointwaters <strong>of</strong> the Albemarle Sound-Roanoke River stock <strong>of</strong> striped bass, the MarineFisheries Commission <strong>and</strong> the Wildlife Resources Commission deem it necessaryto establish two management areas; the Albemarle Sound <strong>Management</strong> Area <strong>and</strong>the Roanoke River <strong>Management</strong> Area as designated in 15A <strong>NC</strong>AC 3R .0201. for thejoint waters <strong>of</strong> the Albemarle Sound <strong>and</strong> the Roanoke River, along with their definedtributaries. The Wildlife Resources Commission shall have principal managementresponsibility for the stock when it is in the joint <strong>and</strong> inl<strong>and</strong> fishing waters <strong>of</strong> theRoanoke River <strong>Management</strong> Area. <strong>and</strong> its tributaries including Cashie, Middle <strong>and</strong>Eastmost rivers. The Marine Fisheries Commission shall have principalmanagement responsibility for the stock in the coastal, joint <strong>and</strong> inl<strong>and</strong> remainingwaters <strong>of</strong> the Albemarle Sound <strong>Management</strong> Area. Currictuck, Roanoke <strong>and</strong>Croatan Sounds <strong>and</strong> their tributaries, including joint <strong>and</strong> inl<strong>and</strong> waters. The annualquota for recreational harvest <strong>of</strong> the Albemarle-Roanoke striped bass stock shall bedivided equally between the two management areas. Each commission shalldevelop implement a management plans actions for recreational harvest within theirrespective management areas. The management plans shall:(1) Be consistent with the guidelines established in the Atlantic States MarineFisheries Commission <strong>Plan</strong> for Striped Bass.(2) Limit harvest to a one fish per person per day creel limit in areas for which nodata collection program is ongoing.that will be consistent with the North Carolina Estuarine Striped Bass <strong>Fishery</strong><strong>Management</strong> <strong>Plan</strong>.(5) The WRC has not conformed to the second sentence <strong>of</strong> (1) below forseveral years. They have a set creel limit <strong>and</strong> a set season, which is codified inWRC Rule 15A <strong>NC</strong>AC 10C .0305. It is proposed that that language be removedfrom the joint rule to reflect what is actually being done.372
15A <strong>NC</strong>AC 03Q .0109 (WRC Rule 15A <strong>NC</strong>AC 10C .0111)IMPLEMENTATION OF ESTUARINE STRIPED BASS MANAGEMENT PLAN:RECREATIONAL FISHINGThe Marine Fisheries <strong>and</strong> Wildlife Resources Commissions shall implement theirrespective striped bass management plans actions for recreational fishing pursuant totheir respective rule-making powers. To preserve jurisdictional authority <strong>of</strong> eachCommission, the following means are established through which managementmeasures can be implemented by a single instrument in each the followingmanagement area:(1) In the Roanoke River <strong>Management</strong> Area <strong>and</strong> tributaries, the exclusive authorityto open <strong>and</strong> close seasons <strong>and</strong> areas, <strong>and</strong> establish size <strong>and</strong> creel limits whetherinl<strong>and</strong> or joint fishing waters shall be vested in the Wildlife ResourcesCommission. The Wildlife Resources Commission shall initiate action to close themanagement area when 90 percent <strong>of</strong> the assigned quota has been taken. Aninstrument closing any management area in joint waters shall operate as <strong>and</strong>shall be a jointly issued instrument opening or closing seasons or areas toharvest in the Roanoke River management area.(2) In the Albemarle Sound Mmanagement Aarea, the exclusive authority to open<strong>and</strong> close seasons <strong>and</strong> areas, <strong>and</strong> establish size <strong>and</strong> creel limits, whethercoastal or joint fishing waters shall be vested in the Marine FisheriesCommission. The Marine Fisheries Commission The season will close theseason by proclamation if the quota is about to be exceeded. In the AlbemarleSound m<strong>Management</strong> aArea administered by the Marine Fisheries Commission,a proclamation affecting the harvest in joint <strong>and</strong> coastal waters, excluding theRoanoke River m<strong>Management</strong> aArea, shall automatically be implemented <strong>and</strong>effective as a Wildlife Resources Commission action in the inl<strong>and</strong> waters <strong>and</strong>tributaries to the waters affected.(6) Following are changes proposed by the WRC to make the Joint Rulesconform to their current management actions <strong>and</strong> to clarify two points. The WRCdoes not allow a creel limit <strong>of</strong> three fish, so they proposed the wording in (1) (b)below. It is also proposed to delete (d) <strong>and</strong> (e) because they are redundant. Theprevious rule above h<strong>and</strong>les jurisdiction <strong>of</strong> the agencies.15A <strong>NC</strong>AC 10C .0107 (MFC Rule 15A <strong>NC</strong>AC 3Q .0107)SPECIAL REGULATIONS: JOINT WATERSI In order to effectively manage all fisheries resources in joint waters <strong>and</strong> inorder to confer enforcement powers on both fisheries enforcement <strong>of</strong>ficers <strong>and</strong>wildlife enforcement <strong>of</strong>ficers with respect to certain rules; the Marine FisheriesCommission <strong>and</strong> the Wildlife Resources Commission deem it necessary to adoptspecial rules for joint waters. Such rules supersede any inconsistent rules <strong>of</strong> theMarine Fisheries Commission or the Wildlife Resources Commission that would373
otherwise be applicable in joint waters under the provisions <strong>of</strong> 15A <strong>NC</strong>AC 10C.0106:(1) Striped Bass(a) It is unlawful to possess any striped bass or striped bass hybrid takenby any means which is less than 18 inches long (total length).(b) It is unlawful to possess more than three striped bass or their hybridstaken by hook <strong>and</strong> line in any one day from joint waters one daily creellimit <strong>of</strong> striped bass or their hybrids, in the aggregate, per person perday, regardless <strong>of</strong> the number <strong>of</strong> management areas fished, <strong>and</strong> fishpossessed by the individual must be in compliance with the size <strong>and</strong>creel limits for the management area being fished.(c) It is unlawful to engage in net fishing for striped bass or their hybrids injoint waters except as authorized by duly adopted rules <strong>of</strong> the MarineFisheries Commission.(d) It is unlawful to possess striped bass or striped bass hybrids in the jointwaters <strong>of</strong> Albemarle, Currituck, Roanoke <strong>and</strong> Croatan Sounds <strong>and</strong> theirtributaries, excluding the Roanoke River, except during seasons asauthorized by duly adopted rules <strong>of</strong> the Marine Fisheries Commission.(e) In the joint waters <strong>of</strong> the Roanoke River <strong>and</strong> its tributaries, includingCashie, Middle <strong>and</strong> Eastmost Rivers, striped bass <strong>and</strong> hybrid stripedbass fishing season, size limits <strong>and</strong> creel limits shall be the same asthose established <strong>and</strong> authorized by duly adopted rules <strong>of</strong> the WildlifeResources Commission for adjacent inl<strong>and</strong> fishing waters.(2) Lake Mattamuskeet:(a) It is unlawful to set or attempt to set any gill net in Lake Mattamuskeet(b)canals designated as joint waters.It is unlawful to use or attempt to use any trawl net or seines in LakeMattamuskeet canals designated as joint waters.(3) Cape Fear River. It is unlawful to use or attempt to use any net or net stakeswithin 800 feet <strong>of</strong> the dam at Lock No.1 on the Cape Fear River.(4) Shad: It is unlawful to possess more than 10 American shad or hickory shad,in the aggregate, per person per day taken by hook-<strong>and</strong>-line.374