2006-07 deer Report - Arkansas Game and Fish Commission
2006-07 deer Report - Arkansas Game and Fish Commission
2006-07 deer Report - Arkansas Game and Fish Commission
- No tags were found...

Create successful ePaper yourself
Turn your PDF publications into a flip-book with our unique Google optimized e-Paper software.
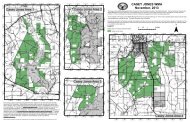
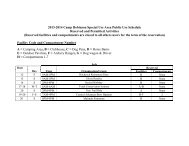
Executive Summaryin the Mississippi Alluvial Valley; the lowestadult lactation was 58 percent in the OuachitaMountains. Antler index is the sum of total numberof points, inside spread, left beam length, <strong>and</strong> leftbeam circumference. The highest average score was47 on Crowley’s Ridge; the lowest average score was39 in the West Gulf Coastal Plain.Herd Health Data SummaryHerd health data provides information on herdhealth conditions, timing of the rut, <strong>and</strong> fawnproduction. For 20<strong>07</strong>, the average number of fetusesproduced was highest in the Ozarks (2.0) <strong>and</strong>the lowest was in the Ouachita Mountains (1.16).Kidney Fat Indices (KFI) range from a high of127 percent in the Ozark Mountains to a low of33 percent in the Ouachita Mountains. Kidney fatdeposits can be used to evaluate physical conditionsof animals coming out of winter stress enteringspring green-up. Mast production <strong>and</strong> weatherconditions will determine amount of fat depositsprior to spring. The minimum desired average KFIfor a sampling period of February through April is35 percent.The peak rut in <strong>2006</strong> was similar when comparedto the five-year average in some areas. TheOzark Mountains showed the earliest peak rut atNovember 5. The latest peak rut in <strong>Arkansas</strong> wasin the Mississippi Alluvial Valley on November26. This is common. Deer in the delta <strong>and</strong> battureregions of <strong>Arkansas</strong> have historically bred latercompared to other regions. Some biologists believethe reason for this late rutting is because historicalflooding results in fawns being born later or afterthe water recedes.<strong>and</strong> antler structure. This kind of population data,along with biological data from harvested <strong>deer</strong>,provides a more detailed picture of the <strong>deer</strong> herdfor each region. More than 1,000 archery huntersparticipated in the survey <strong>and</strong> collected more than14,000 hours of data. It is important to stress thatthe information presented in this report representsonly three years of observation data. Additional datawill be needed to determine trends <strong>and</strong> potentialchange related to management strategies.Chronic Wasting Disease UpdateChronic Wasting Disease (CWD) is still amajor concern <strong>and</strong> threat to <strong>Arkansas</strong>’s native <strong>deer</strong>populations. During 2004-06 biologists completeda r<strong>and</strong>om sampling of each of <strong>Arkansas</strong>’s counties.Within each county a minimum of 50 sampleswere collected from hunter-harvested <strong>deer</strong> <strong>and</strong> herdhealth <strong>deer</strong> sampled in late winter. During <strong>2006</strong>,biologists collected samples from “hot spots” or areasof concern <strong>and</strong> worked to collect additional samplesin areas where sample collection was not adequatelydistributed geographically. To date, more than 3,700wild <strong>deer</strong> have been tested in USDA-certified labs atthe <strong>Arkansas</strong> Livestock <strong>and</strong> Poultry <strong>Commission</strong> <strong>and</strong>the University of Georgia. No evidence of CWD hasbeen detected in any of these samples.Bowhunter Observation SummaryThe <strong>2006</strong>-<strong>07</strong> archery season was the third year inwhich hunters throughout the state collected <strong>deer</strong>observation data. Hunter observations provide datasuch as sex ratios, <strong>deer</strong> density, fawn-to-doe ratio6