icolls - Sustainable Tourism CRC
icolls - Sustainable Tourism CRC
icolls - Sustainable Tourism CRC

Create successful ePaper yourself
Turn your PDF publications into a flip-book with our unique Google optimized e-Paper software.
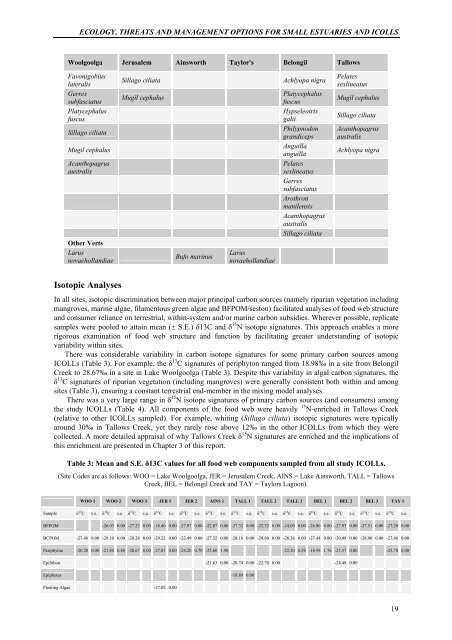
ECOLOGY, THREATS AND MANAGEMENT OPTIONS FOR SMALL ESTUARIES AND ICOLLS<br />
Woolgoolga Jerusalem Ainsworth Taylor's Belongil Tallows<br />
Favonigobius<br />
lateralis<br />
Gerres<br />
subfasciatus<br />
Platycephalus<br />
fuscus<br />
Sillago ciliata<br />
Mugil cephalus<br />
Acanthopagrus<br />
australis<br />
Other Verts<br />
Larus<br />
novaehollandiae<br />
Isotopic Analyses<br />
Sillago ciliata Achlyopa nigra<br />
Mugil cephalus<br />
Bufo marinus<br />
Larus<br />
novaehollandiae<br />
Platycephalus<br />
fuscus<br />
Hypseleotris<br />
galii<br />
Philypnodon<br />
grandiceps<br />
Anguilla<br />
anguilla<br />
Pelates<br />
sexlineatus<br />
Gerres<br />
subfasciatus<br />
Arothron<br />
manilensis<br />
Acanthopagrus<br />
australis<br />
Sillago ciliata<br />
Pelates<br />
sexlineatus<br />
Mugil cephalus<br />
Sillago ciliata<br />
Acanthopagrus<br />
australis<br />
Achlyopa nigra<br />
In all sites, isotopic discrimination between major principal carbon sources (namely riparian vegetation including<br />
mangroves, marine algae, filamentous green algae and BFPOM/seston) facilitated analyses of food web structure<br />
and consumer reliance on terrestrial, within-system and/or marine carbon subsidies. Wherever possible, replicate<br />
samples were pooled to attain mean (± S.E.) δ13C and δ 15 N isotope signatures. This approach enables a more<br />
rigorous examination of food web structure and function by facilitating greater understanding of isotopic<br />
variability within sites.<br />
There was considerable variability in carbon isotope signatures for some primary carbon sources among<br />
ICOLLs (Table 3). For example, the δ 13 C signatures of periphyton ranged from 18.98‰ in a site from Belongil<br />
Creek to 28.67‰ in a site in Lake Woolgoolga (Table 3). Despite this variability in algal carbon signatures, the<br />
δ 13 C signatures of riparian vegetation (including mangroves) were generally consistent both within and among<br />
sites (Table 3), ensuring a constant terrestrial end-member in the mixing model analyses.<br />
There was a very large range in δ 15 N isotope signatures of primary carbon sources (and consumers) among<br />
the study ICOLLs (Table 4). All components of the food web were heavily 15 N-enriched in Tallows Creek<br />
(relative to other ICOLLs sampled). For example, whiting (Sillago ciliata) isotopic signatures were typically<br />
around 30‰ in Tallows Creek, yet they rarely rose above 12‰ in the other ICOLLs from which they were<br />
collected. A more detailed appraisal of why Tallows Creek δ 15 N signatures are enriched and the implications of<br />
this enrichment are presented in Chapter 3 of this report.<br />
Table 3: Mean and S.E. δ13C values for all food web components sampled from all study ICOLLs.<br />
(Site Codes are as follows: WOO = Lake Woolgoolga, JER = Jerusalem Creek, AINS = Lake Ainsworth, TALL = Tallows<br />
Creek, BEL = Belongil Creek and TAY = Taylors Lagoon).<br />
WOO 1 WOO 2 WOO 3 JER 1 JER 2 AINS 1 TALL 1 TALL 2 TALL 3 BEL 1 BEL 2 BEL 3 TAY 1<br />
Sample δ 13 C s.e. δ 13 C s.e. δ 13 C s.e. δ 13 C s.e. δ 13 C s.e. δ 13 C s.e. δ 13 C s.e. δ 13 C s.e. δ 13 C s.e. δ 13 C s.e. δ 13 C s.e. δ 13 C s.e. δ 13 C s.e.<br />
BFPOM -26.03 0.00 -27.23 0.00 -18.40 0.00 -27.97 0.00 -22.87 0.00 -27.32 0.00 -22.32 0.00 -24.09 0.00 -26.86 0.00 -27.93 0.00 -27.51 0.00 -27.20 0.00<br />
BCPOM -27.46 0.00 -29.10 0.00 -28.28 0.00 -29.22 0.00 -22.49 0.00 -27.32 0.00 -28.18 0.00 -29.60 0.00 -28.36 0.00 -27.44 0.00 -30.08 0.00 -28.90 0.00 -27.46 0.00<br />
Periphyton -20.20 0.00 -21.80 0.40 -28.67 0.00 -27.83 0.00 -24.20 0.70 -23.60 1.90 -22.10 0.58 -18.98 1.76 -25.57 0.00 -25.70 0.00<br />
Epilithon -21.63 0.00 -20.74 0.00 -22.70 0.00 -24.48 0.00<br />
Epiphytes -18.89 0.00<br />
Floating Algae -27.02 0.00<br />
19