Annual Report - MAA
Annual Report - MAA
Annual Report - MAA
- No tags were found...

Create successful ePaper yourself
Turn your PDF publications into a flip-book with our unique Google optimized e-Paper software.
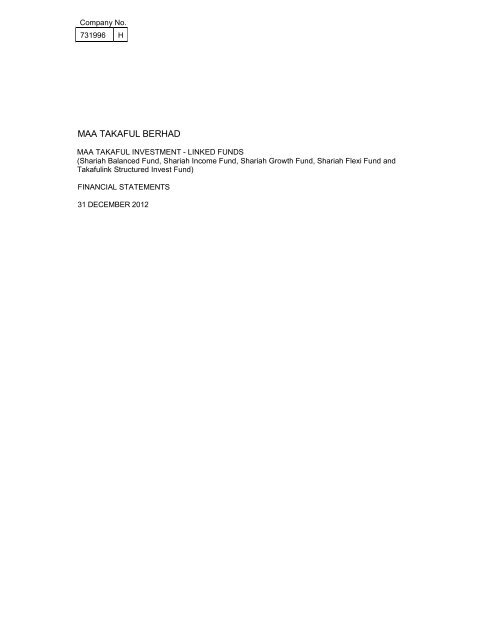
Company No.731996 H<strong>MAA</strong> TAKAFUL BERHAD<strong>MAA</strong> TAKAFUL INVESTMENT - LINKED FUNDS(Shariah Balanced Fund, Shariah Income Fund, Shariah Growth Fund, Shariah Flexi Fund andTakafulink Structured Invest Fund)FINANCIAL STATEMENTS31 DECEMBER 2012
Company No.731996 H<strong>MAA</strong> TAKAFUL BERHAD<strong>MAA</strong> TAKAFUL INVESTMENT-LINKED FUNDS, CONSISTING OF<strong>MAA</strong> TAKAFUL SHARIAH BALANCED FUND<strong>MAA</strong> TAKAFUL SHARIAH INCOME FUND<strong>MAA</strong> TAKAFUL SHARIAH GROWTH FUND<strong>MAA</strong> TAKAFUL SHARIAH FLEXI FUND<strong>MAA</strong> TAKAFULINK STRUCTURED INVEST FUND(herein after referred to collectively as 'the Investment-Linked Funds')STATEMENT BY MANAGERWe, Tan Sri Ahmad bin Mohd Don and Muhamad Umar Swift, two of the directors of <strong>MAA</strong> TakafulBerhad, state that, in the opinion of the Manager, the accompanying financial statements set out onpages 20 to 59 have been properly drawn up in accordance with the accounting policies prescribed inNote 2 to the financial information and the Guidelines on Investment-Linked Insurance/TakafulBusiness issued by Bank Negara Malaysia.Signed on behalf of the Board of Directors of the Manager in accordance with their resolution dated 24April 2013.TAN SRI AHMAD BIN MOHD DONDIRECTORMUHAMAD UMAR SWIFTDIRECTORKuala Lumpur24 April 20131
Company No.731996 HINDEPENDENT AUDITORS’ REPORT TO THE PARTICIPANTS OF<strong>MAA</strong> TAKAFUL INVESTMENT - LINKED FUNDS, CONSISTING OF<strong>MAA</strong> TAKAFUL SHARIAH BALANCED FUND<strong>MAA</strong> TAKAFUL SHARIAH INCOME FUND<strong>MAA</strong> TAKAFUL SHARIAH GROWTH FUND<strong>MAA</strong> TAKAFUL SHARIAH FLEXI FUND<strong>MAA</strong> TAKAFULINK STRUCTURED INVEST FUND(herein after referred to collectively as 'the Investment-Linked Funds')REPORT ON THE FINANCIAL STATEMENTSWe have audited the financial statements of <strong>MAA</strong> Takaful Investment-Linked Funds, which comprise thestatement of assets and liabilities as at 31 December 2012, and the statement of income andexpenditure, statement of changes in net asset value and a summary of significant accounting policiesand other explanatory notes as set out on pages 20 to 59.Manager’s Responsibility for the Financial Statements<strong>MAA</strong> Takaful Berhad (“the Manager”) is responsible for the preparation of these financial statements inaccordance with the accounting policies provided on Note 2 to the financial information and theGuidelines on Investment-Linked Insurance/Takaful Business issued by Bank Negara Malaysia and forsuch internal controls as the Manager determines are necessary to enable the presentation of financialstatement that are free from material misstatement, whether due to fraud or error.Auditors’ ResponsibilityOur responsibility is to express an opinion on these financial statements based on our audit. Weconducted our audit in accordance with approved standards on auditing in Malaysia. Those standardsrequire that we comply with ethical requirements and plan and perform the audit to obtain reasonableassurance whether the financial statements are free from material misstatement.An audit involves performing procedures to obtain audit evidence about the amounts and disclosures inthe financial statements. The procedures selected depend on our judgment, including the assessment ofrisks of material misstatement of the financial statements, whether due to fraud or error. In making thoserisk assessments, we consider internal control relevant to the Investment-Linked Funds' preparation ofthese financial statements that give a true and fair view in order to design audit procedures that areappropriate in the circumstances, but not for the purpose of expressing an opinion on the effectiveness ofthe Investment-Linked Funds' internal control. An audit also includes evaluating the appropriateness ofaccounting policies used and the reasonableness of accounting estimates made by the Manager, as wellas evaluating the overall presentation of the financial statements.We believe that the audit evidence we have obtained is sufficient and appropriate to provide a basis forour audit opinion.2
Company No.731996 HINDEPENDENT AUDITORS’ REPORT TO THE PARTICIPANTS OF<strong>MAA</strong> TAKAFUL INVESTMENT - LINKED FUNDS, CONSISTING OF<strong>MAA</strong> TAKAFUL SHARIAH BALANCED FUND<strong>MAA</strong> TAKAFUL SHARIAH INCOME FUND<strong>MAA</strong> TAKAFUL SHARIAH GROWTH FUND<strong>MAA</strong> TAKAFUL SHARIAH FLEXI FUND<strong>MAA</strong> TAKAFULINK STRUCTURED INVEST FUND(herein after referred to collectively as 'the Investment-Linked Funds')REPORT ON THE FINANCIAL STATEMENTS (CONTINUED)OpinionIn our opinion, the financial statements have been properly drawn up in accordance with the accountingpolicies prescribed in Note 2 to the financial information and the Guidelines on Investment-LinkedInsurance/Takaful Business issued by Bank Negara Malaysia.OTHER MATTERSThis report is made solely to the Participants of the Investment-Linked Funds, as a body in accordancewith the Guidelines on Investment-linked Insurance/Takaful Business issued by Bank Negara Malaysia,and for no other purpose. We do not assume responsibility to any other person for the content of thisreport.PRICEWATERHOUSECOOPERS(No. AF: 1146)Chartered AccountantsKuala Lumpur24 April 20133
Company No.731996 H<strong>MAA</strong> Takaful Shariah Balanced FundFund Fact Sheet - December 2012Investment ObjectiveThe fund objective is to reward the unit holders with a reasonable rate ofreturn on income and to realize capital growth. This is achieved throughinvesting in undervalued and high quality equities of fundamentallysound companies listed on the Bursa Malaysia and halal money marketand fixed income securities.Fund DataTop Five Equity HoldingsSime Darby Bhd 7.68%Maxis Bhd 5.91%Tenaga Nasional Bhd 5.06%Axiata Group Bhd 3.57%Telekom Malaysia Bhd 3.30%Asset AllocationNAV (as at 31 st December 2012) 0.463Fund Value (RM) 60,267,910Market ReviewCash andDeposits21.4%December was a good month for the market. The KLCI surged to a newall-time high of 1,688.95 thanks to window dressing activities. During themonth, the FBM Shariah Index rose 5.1% from 11,488 to 11,521.Average value traded on Bursa fell 19% month-on-month to RM1.36billion per day. In fixed income market, the Malaysian GovernmentSecurities yield curve gave a modest rally at the short-to-mid end of thecurve for the month shedding yields of between 2-11bps. The rally wasprimarily due to a mixture of concerns from the faltering confidence thatthe US may not be able to meet its Fiscal Cliff deadline as well as thelarger than expected contraction in the October 2012 exports. For thecorporate bond segment, December saw a rebound in trading activitywith an increase of 22% from previous month (source: Bondweb) andmost of the trading revolved around the GG and AAA bonds.FixedIncome27.1%Sector Allocation9.0%2.9%0.4%5.1%1.0%2.2%12.4%0.6%18.1%27.1%Equities51.6%ConstructionConsumerIndustrialPropertiesFinanceIPCPlantationREITTrading ServicesOutlook & Strategy21.4%Fixed IncomeCash and DepositsAs the timeframe to the general elections narrow, we maintained ourraised cash holdings for equity. Still, we will remain invested indefensive stocks, stocks with strong fundamentals and that haverealistic earnings expectations for 2013. We still favorTelecommunications and certain segments of the Oil & Gas sectors.Our fixed income strategy remains unchanged and we shall continue toprefer higher weightings in Shariah compliant corporate bonds withfocus in the AA segment. We will aim to take profit on some of theexisting bond holdings and switch to new issuances if primary yieldsprove attractive.Performance: Shariah Balanced Fund0.4800.4600.4400.4200.4000.3800.3600.340Cumulative PerformanceShariah Balanced Fund % changeMOM 3.35%3 months 1.09%6 months 2.89%YTD 6.19%1 year 6.19%2 years 13.45%3 years 28.12%Since Inception 28.74%Calendar Year Performance<strong>Annual</strong> ReturnFY2012 6.19%FY2011 6.83%FY2010 12.93%FY2009 15.52%FY2008 - 14.15%Source: CIMB-Principal IslamicFund’s Performance is calculated based on NAV toNAV, assuming bonus unit distribution, if any, werereinvested. The value unit may go up as well as down.The <strong>MAA</strong> Takaful Fund is underwritten by <strong>MAA</strong> Takaful Bhd and is managed by CIMB-Principal Islamic Asset Management Sdn Bhd. This report is prepared by themanagers for information purposes only. It does not have regard to other investment objectives, financial situation and any particular needs of any specific person whomay receive it. Investors should also consider the investment risks carefully. Past performance is not necessarily indicative of the future performance.
Company No.731996 H<strong>MAA</strong> Takaful Shariah Income FundFund Fact Sheet - December 2012Investment Objective<strong>MAA</strong> Takaful Shariah Income Fund is a bond fund which aims toprovide steady capital growth at a rate higher than average depositrates over medium to long-term period.Fund DataNAV (as at 31 st December 2012) 0.528Fund Value (RM) 37,316,412Market ReviewThe Malaysian Government Securities yield curve gave a modest rallyat the short-to-mid end of the curve for the month shedding yields ofbetween 2-11bps. The rally was primarily due to a mixture of concernsfrom the faltering confidence that the US may not be able to meet itsFiscal Cliff deadline as well as the larger than expected contraction inthe October 2012 exports. For the corporate bond segment, Decembersaw a rebound in trading activity with an increase of 22% from previousmonth (source: Bondweb) and most of the trading revolved around theGG and AAA bonds. December was a good month for the equitymarket. The KLCI surged to a new all-time high of 1,688.95 thanks towindow dressing activities. During the month, the FBM Shariah Indexrose 5.1% from 11,488 to 11,521.Outlook & StrategyOur strategy remains unchanged and we shall continue to prefer higherweightings in Shariah compliant corporate bonds with focus in the AAsegment. We will aim to take profit on some of the existing bondholdings and switch to new issuances if primary yields prove attractive.In equity market, as the timeframe to the general elections narrow, wemaintained our raised cash holdings. Still, we will remain invested indefensive stocks, stocks with strong fundamentals and that haverealistic earnings expectations for 2013. We still favorTelecommunications and certain segments of the Oil & Gas sectors.Performance: Shariah Income Fund0.6000.5500.5000.4500.400Top Five Fixed Income HoldingsAnih Bhd 19.18%Encorp Systembilt Sdn Bhd 8.98%United Growth Bhd 5.80%First Resources Ltd 5.63%Konsortium Lebuh Utara Timur Bhd 3.64 %Asset AllocationFixedIncome69.2%Sector Allocation21.7%9.1%33.7%9.0%5.8%8.5%3.1%9.2%Cash andDeposits9.1%Equities21.7%TechnologyConglomeratePlantationPortsPowerToll RoadsEquitiesCash and DepositsCumulative PerformanceShariah Income Fund % changeMOM 1.54%3 months 1.15%6 months 2.72%YTD 5.60%1 year 5.60%2 years 10.67%3 years 15.10%Since Inception 23.52%Calendar Year Performance<strong>Annual</strong> ReturnFY2012 5.60%FY2011 4.80%FY2010 4.00%FY2009 4.60%FY2008 1.79%Source: CIMB-Principal IslamicFund’s Performance calculated based on NAV to NAV,assuming cash dividend unit distribution, if any, werereinvested. The value unit may go up as well as down.The <strong>MAA</strong> Takaful Fund is underwritten by <strong>MAA</strong> Takaful Bhd and is managed by CIMB-Principal Islamic Asset Management Sdn Bhd. This report is prepared by themanagers for information purposes only. It does not have regard to other investment objectives, financial situation and any particular needs of any specific person whomay receive it. Investors should also consider the investment risks carefully. Past performance is not necessarily indicative of the future performance.
Company No.731996 H<strong>MAA</strong> Takaful Shariah Growth FundFund Fact Sheet - December 2012Investment ObjectiveThe fund objective is to provide capital appreciation. This is achievedthrough investing in undervalued and high quality equities offundamentally sound companies listed on the Bursa Malaysia.Fund DataNAV (as at 31 st December 2012) 0.476Fund Value (RM) 82,264,657Market ReviewDecember was a good month for the market. The KLCI surged to a newall-time high of 1,688.95 thanks to window dressing activities. During themonth, the FBM Shariah Index rose 5.1% from 11,488 to 11,521.Average value traded on Bursa fell 19% month-on-month to RM1.36billion per day. With the US fiscal cliff out of the way, Asia Pacific ex-Japan (APexJ) markets have risen in a relief rally. And against abackdrop of weak US growth and Europe at or near recession, PMIshave improved in China, South Korea and Taiwan. Earningsdowngrades in the region may be bottoming out, providing fundamentalsupport to APexJ markets. Bursa Malaysia will lag the recovery in theregion due to the overhang of the coming General Election.Outlook & StrategyAs the timeframe to the general elections narrow, we maintained ourraised cash holdings. Still, we will remain invested in defensive stocks,stocks with strong fundamentals and that have realistic earningsexpectations for 2013. We still favor Telecommunications and certainsegments of the Oil & Gas sectors.Performance: Shariah Growth Fund0.6000.5000.4000.3000.2000.1000.000Unit PriceFBM Shariah14,00012,00010,0008,0006,0004,0002,0000Top Five Equity HoldingsAxiata Group Bhd 9.27%Digi.com Bhd 8.95%Sime Darby Bhd 8.44%Tenaga Nasional Bhd 6.90%Maxis Bhd 6.36%Asset AllocationCash andDeposits12.9%Sector Allocation33.3%2.3%5.3%5.3%2.1%14.1%9.3%15.3%Equities87.1%12.9% ConstructionConsumerFinanceIndustrialIPCPlantationPropertiesTrading ServicesCash and DepositsCumulative PerformanceShariah Growth Fund % changeMOM 4.62%3 months 1.71%6 months 5.08%YTD 8.92%1 year 8.92%2 years 15.09%3 years 36.21%Since Inception 30.86%Calendar Year Performance<strong>Annual</strong> ReturnFY2012 8.92%FY2011 5.66%FY2010 18.35%FY2009 29.48%FY2008 - 26.97%Source: CIMB-Principal IslamicFund’s Performance is calculated based on NAV toNAV, assuming bonus unit distribution, if any, werereinvested. The value unit may go up as well as down.The <strong>MAA</strong> Takaful Fund is underwritten by <strong>MAA</strong> Takaful Bhd and is managed by CIMB-Principal Islamic Asset Management Sdn Bhd. This report is prepared by themanagers for information purposes only. It does not have regard to other investment objectives, financial situation and any particular needs of any specific person whomay receive it. Investors should also consider the investment risks carefully. Past performance is not necessarily indicative of the future performance.
Company No.731996 H<strong>MAA</strong> Takaful Shariah Flexi FundFund Fact Sheet - December 2012Investment ObjectiveThe fund aims to generate positive returns over medium to long-termperiod given the flexibility of the asset allocation of the fund.Fund DataNAV (as at 31 st December 2012) 0.596Fund Value (RM) 22,455,268Top Five Equity HoldingsSime Darby Bhd 9.49%Maxis Bhd 8.71%Tenaga Nasional Bhd 7.73%Axiata Group Bhd 4.99%Telekom Malaysia Bhd 4.40%Asset AllocationMarket ReviewDecember was a good month for the market. The KLCI surged to a newall-time high of 1,688.95 thanks to window dressing activities. During themonth, the FBM Shariah Index rose 5.1% from 11,488 to 11,521.Average value traded on Bursa fell 19% month-on-month to RM1.36billion per day. With the US fiscal cliff out of the way, Asia Pacific ex-Japan (APexJ) markets have risen in a relief rally. And against abackdrop of weak US growth and Europe at or near recession, PMIshave improved in China, South Korea and Taiwan. Earningsdowngrades in the region may be bottoming out, providing fundamentalsupport to APexJ markets. Bursa Malaysia will lag the recovery in theregion due to the overhang of the coming General Election.Equities70.6%Sector AllocationCash andDeposits29.4%ConsumerOutlook & Strategy29.4%1.5%3.0%6.5%3.8%ConstructionIndustrialFinanceAs the timeframe to the general elections narrow, we maintained ourraised cash holdings. Still, we will remain invested in defensive stocks,stocks with strong fundamentals and that have realistic earningsexpectations for 2013. We still favor Telecommunications and certainsegments of the Oil & Gas sectors.25.5%16.1%13.0%0.6%0.7%IPCREITPropertiesPlantationTrading ServicesCash and DepositsPerformance: Shariah Flexi Fund0.6200.6000.5800.5600.5400.5200.5000.4800.460Cumulative PerformanceShariah Flexi Fund % changeMOM 4.38%3 months 1.02%6 months 3.11%YTD 7.00%1 year 7.00%2 years 13.963 years -Since Inception 19.20%Calendar Year Performance<strong>Annual</strong> ReturnFY2012 7.00%FY2011 6.50%FY2010 * 4.60%*Since inception 1 October 2010Source: CIMB-Principal IslamicFund’s Performance is calculated based on NAV toNAV, assuming bonus unit distribution, if any, werereinvested. The value unit may go up as well as down.The <strong>MAA</strong> Takaful Fund is underwritten by <strong>MAA</strong> Takaful Bhd and is managed by CIMB-Principal Islamic Asset Management Sdn Bhd. This report is prepared by themanagers for information purposes only. It does not have regard to other investment objectives, financial situation and any particular needs of any specific person whomay receive it. Investors should also consider the investment risks carefully. Past performance is not necessarily indicative of the future performance.
Company No.731996 H<strong>MAA</strong> Takafulink Structured Invest FundFund Fact Sheet - December 2012Investment ObjectiveThe GEMS Asia Murabahah strategy tracks an investment in local currency Murabahah deposits equally across 5 membercountries. The Index strategy is based in the concept of investing in hypothetical short term 1 month commodity Murabahahdeposits in 5 Emerging Markets in Asia (Indian Rupee, Indonesian Rupiah, Thai Baht, South Korean Won, and PhilippinesPeso).Fund DataNAV (as at 31 st December 2012) 0.536Fund Value (RM) 44,177,868Market Review and OutlookPortfolio flows to emerging markets (EM) have been robust in the past year, particularly into fixed income markets. Theinvestor base is diversifying, strengthening flows to EM.Carry trades will still carry the day in this region, as the market is by and large expecting a sluggish global growth environmentand no let up in global monetary easing.With growth estimated at between 4.5% to 5.5% in 2013 (official estimates by the Ministry of Finance), as well as a positivereal interest rate environment, we expect Malaysia to continue being the recipient of offshore funds. Additionally, the firstMonetary Policy Meeting of the year held on 30 to 31 January 2013 should not offer any surprises, and BNM is widelyexpected to stand pat on interest rates (maintain at 3%).Performance of GEMS Asia Murabahah Strategy since inceptionSince inception (strike date) to option expiry 21 February 2012, GEMS Murabahah Strategy was up by 27.60%*. The Fund istaking a defensive stance and remains fully invested in Islamic Negotiable Instrument Deposit (iNID).*Note: Please note that this is purely the index performance and not the value of the option payoff, which will be calculated asper the Termsheet on maturity date.8
9Company No.731996 H<strong>MAA</strong> TAKAFUL BERHAD<strong>MAA</strong> TAKAFUL INVESTMENT - LINKED FUNDS(<strong>MAA</strong> Takaful Shariah Balanced Fund, <strong>MAA</strong> Takaful Shariah Income Fund, <strong>MAA</strong> Takaful Shariah GrowthFund, <strong>MAA</strong> Takaful Shariah Flexi Fund and <strong>MAA</strong> Takafulink Structured Invest Fund)FUND OBJECTIVE & FUND PERFORMANCEAS AT 31 DECEMBER 2012Name of FundsFund's Investment ObjectivesAsset Allocation<strong>MAA</strong> Takaful Shariah BalancedFundTo generate a balanced mix ofincome returns, as well as capitalgrowth over medium to long-termEquities &Derivatives51.56%<strong>MAA</strong> Takaful Shariah IncomeFundTo provide steady capital growth atrates higher than average fixeddepositrates over medium to longtermperiodEquities &Derivatives21.69%Net Investment ReturnsFixed IncomeSecuritiesCash &Deposits27.07%21.36%Fixed IncomeSecuritiesCash &Deposits69.24%9.07%Y/E 2008 420,344 Y/E 2008 161,698Y/E 2009 371,043 Y/E 2009 272,512Y/E 2010 783,717 Y/E 2010 727,007Y/E 2011 1,227,536 Y/E 2011 1,019,009Y/E 2012 1,831,542 Y/E 2012 1,374,261Description of charges levied Wakalah Tharawat fee of 1.3% p.a. Wakalah Tharawat fee of 1% p.a.Changes of Objective,restriction & limitation during theyearDetails of distribution:NAV per unit - beforedistributionNANANANANAV per unit - after distribution NA NAFuture prospects & proposedstrategiesAs the timeframe to the generalelections narrow, the Fundmaintained its raised cash holdingsfor equity, but will remain invested indefensive stocks, stocks with strongfundamentals and that have realisticearnings expectations for 2013. TheTelecommunications and certainsegments of the Oil & Gas sectorsstill remain in favour. The fixedincome strategy remains unchangedwith continued preference to higherweightings in Shariah compliantcorporate bonds with focus in the AAsegment. The Fund aims to takeprofit on some of the existing bondholdings and switch to newissuances if primary yields proveattractive.The Fund's strategy remainsunchanged with continuedpreference to higher weightings inShariah compliant corporate bondswith focus in the AA segment. TheFund aims to take profit on some ofthe existing bond holdings andswitch to new issuances if primaryyields prove attractive. In equitymarket, as the timeframe to thegeneral elections narrow, the Fundmaintained its raised cash holdings,but will remain invested in defensivestocks, stocks with strongfundamentals and that have realisticearnings expectations for 2013. TheTelecommunications and certainsegments of the Oil & Gas sectorsstill remain in favour.
10Company No.731996 H<strong>MAA</strong> TAKAFUL BERHAD<strong>MAA</strong> TAKAFUL INVESTMENT - LINKED FUNDS(<strong>MAA</strong> Takaful Shariah Balanced Fund, <strong>MAA</strong> Takaful Shariah Income Fund, <strong>MAA</strong> Takaful Shariah GrowthFund, <strong>MAA</strong> Takaful Shariah Flexi Fund and <strong>MAA</strong> Takafulink Structured Invest Fund)FUND OBJECTIVE & FUND PERFORMANCE (CONTINUED)AS AT 31 DECEMBER 2012Name of Funds<strong>MAA</strong> Takaful Shariah BalancedFund<strong>MAA</strong> Takaful Shariah IncomeFundPerformance of relevantbenchmark indicesAbsolute target return 7% p.a.Absolute target return 5% p.aY/E 2008 7.00% Y/E 2008 5.00%Y/E 2009 7.00% Y/E 2009 5.00%Y/E 2010 7.00% Y/E 2010 5.00%Y/E 2011 7.00% Y/E 2011 5.00%Y/E 2012 7.00% Y/E 2012 5.00%Y/E 2007 7% Y/E 2007 5%
11Company No.731996 H<strong>MAA</strong> TAKAFUL BERHAD<strong>MAA</strong> TAKAFUL INVESTMENT - LINKED FUNDS(<strong>MAA</strong> Takaful Shariah Balanced Fund, <strong>MAA</strong> Takaful Shariah Income Fund, <strong>MAA</strong> Takaful Shariah GrowthFund, <strong>MAA</strong> Takaful Shariah Flexi Fund and <strong>MAA</strong> Takafulink Structured Invest Fund)FUND OBJECTIVE & FUND PERFORMANCEAS AT 31 DECEMBER 2012Name of FundsFund's Investment ObjectivesAsset Allocation<strong>MAA</strong> Takaful Shariah GrowthFundTo provide capital growth overmedium to long-termEquities &Derivatives87.07%<strong>MAA</strong> Takaful Shariah FlexiFundTo generate positive returns overmedium to long-term period giventhe flexibility of the asset allocationof the fundEquities &Derivatives70.59%Net Investment ReturnsFixed IncomeSecuritiesCash &DepositsNA12.93%Fixed IncomeSecuritiesCash &DepositsNA29.41%Y/E 2008 560,607 Y/E 2008 NAY/E 2009 337,637 Y/E 2009 NAY/E 2010 980,979 Y/E 2010 24,448Y/E 2011 1,532,316 Y/E 2011 379,598Y/E 2012 2,449,230 Y/E 2012 599,056Description of charges levied Wakalah Tharawat fee of 1.5% p.a. Wakalah Tharawat fee of 1.3% p.a.Changes of Objective, restriction& limitation during the yearNANADetails of distribution:NAV per unit - before distributionNAV per unit - after distributionFuture prospects & proposedstrategiesNANAAs the timeframe to the generalelections narrow, the Fundmaintained its raised cash holdings,but will remain invested in defensivestocks, stocks with strongfundamentals and that have realisticearnings expectations for 2013. TheTelecommunications and certainsegments of the Oil & Gas sectorsstill remain in favour.NANAAs the timeframe to the generalelections narrow, the Fundmaintained its raised cash holdings,but will remain invested indefensive stocks, stocks withstrong fundamentals and that haverealistic earnings expectations for2013. The Telecommunicationsand certain segments of the Oil &Gas sectors still remain in favour.
12Company No.731996 H<strong>MAA</strong> TAKAFUL BERHAD<strong>MAA</strong> TAKAFUL INVESTMENT - LINKED FUNDS(<strong>MAA</strong> Takaful Shariah Balanced Fund, <strong>MAA</strong> Takaful Shariah Income Fund, <strong>MAA</strong> Takaful Shariah GrowthFund, <strong>MAA</strong> Takaful Shariah Flexi Fund and <strong>MAA</strong> Takafulink Structured Invest Fund)FUND OBJECTIVE & FUND PERFORMANCE (CONTINUED)AS AT 31 DECEMBER 2012Name of Funds<strong>MAA</strong> Takaful Shariah GrowthFund<strong>MAA</strong> Takaful Shariah FlexiFundPerformance of relevantbenchmark indicesFBM Shariah Index (since 2010).9% on 3 year rolling basisY/E 2008 9.00% Y/E 2008 NAY/E 2009 9.00% Y/E 2009 NAY/E 2010 18.20% Y/E 2010 2.25%Y/E 2011 2.41% Y/E 2011 9.00%Y/E 2012 11.85% Y/E 2012 9.00%Y/E 2007 7% Y/E 2007 5%
13Company No.731996 H<strong>MAA</strong> TAKAFUL BERHAD<strong>MAA</strong> TAKAFUL INVESTMENT - LINKED FUNDS(<strong>MAA</strong> Takaful Shariah Balanced Fund, <strong>MAA</strong> Takaful Shariah Income Fund, <strong>MAA</strong> Takaful Shariah GrowthFund, <strong>MAA</strong> Takaful Shariah Flexi Fund and <strong>MAA</strong> Takafulink Structured Invest Fund)FUND OBJECTIVE & FUND PERFORMANCEAS AT 31 DECEMBER 2012Name of FundsFund's Investment ObjectivesAsset Allocation<strong>MAA</strong> Takafulink StructuredInvest FundThe GEMS Asia Murabahah strategytracks an investment in localcurrency Murabahah deposits equallyacross 5 member countries. TheIndex strategy is based in theconcept of investing in hypotheticalshort term 1 month commodityMurabahah deposits in 5 EmergingMarkets in Asia (Indian Rupee,Indonesian Rupiah , Thai Baht, SouthKorean Won, Philippines Peso)Equities &DerivativesFixed IncomeSecuritiesNACash &Deposits100.00%Y/E 2008NANet Investment Return Y/E 2009 83,498Y/E 2010 17,914Y/E 2011 27,254Y/E 2012 88,229Description of charges leviedChanges of Objective, restriction& limitation during the yearDetails of distribution:Wakalah Tharawat fee of 0.5% p.a.NANANAV per unit - before distributionNAV per unit - after distributionNANAFuture prospects & proposedstrategiesThe Fund is taking a defensivestance and remains fully invested inIslamic Negotiable InstrumentDeposit (iNID)
14Company No.731996 H<strong>MAA</strong> TAKAFUL BERHAD<strong>MAA</strong> TAKAFUL INVESTMENT - LINKED FUNDS(<strong>MAA</strong> Takaful Shariah Balanced Fund, <strong>MAA</strong> Takaful Shariah Income Fund, <strong>MAA</strong> Takaful Shariah GrowthFund, <strong>MAA</strong> Takaful Shariah Flexi Fund and <strong>MAA</strong> Takafulink Structured Invest Fund)FUND OBJECTIVE & FUND PERFORMANCE (CONTINUED)AS AT 31 DECEMBER 2012Name of Funds<strong>MAA</strong> Takafulink StructuredInvest FundPerformance of relevantbenchmark indicesTarget return better than FDY/E 2008Y/E 2009Y/E 2010Y/E 2011Y/E 2012NANANANANAY/E 2007 7%
15Company No.731996 H<strong>MAA</strong> TAKAFUL BERHAD<strong>MAA</strong> TAKAFUL INVESTMENT - LINKED FUNDS(<strong>MAA</strong> Takaful Shariah Balanced Fund, <strong>MAA</strong> Takaful Shariah Income Fund, <strong>MAA</strong> Takaful Shariah GrowthFund, <strong>MAA</strong> Takaful Shariah Flexi Fund and <strong>MAA</strong> Takafulink Structured Invest Fund)FUND OBJECTIVE & FUND PERFORMANCEAS AT 31 DECEMBER 2012<strong>MAA</strong> Takaful Shariah BalancedFund Y/E 2008 Y/E 2009 Y/E 2010 Y/E 2011 Y/E 2012Composition of Fund to IndustrySector:Construction 3.00% 3.50% 4.96% 3.15% 2.19%Consumer NA 3.13% 3.05% 3.11% 1.04%Corporate Action NA 0.40% NA NA NAFinance NA NA NA 1.38% 2.86%Industrial 4.62% 5.23% 9.75% 5.07% 5.05%IPC 1.17% 1.94% 2.25% 2.58% 8.97%Plantation 4.98% 13.43% 13.41% 17.04% 12.40%Properties 1.01% 1.96% 4.08% 1.23% 0.44%REIT NA NA NA NA 0.56%Second Board 0.24% NA NA NA NATechnology NA NA 1.20% NA NATrading Services 13.22% 16.90% 15.94% 19.80% 18.06%Fixed Income NA 22.19% 20.94% 26.97% 27.07%Cash & Deposits 71.76% 31.33% 24.43% 19.66% 21.36%Category of Investment:Malaysian Government Securities NA NA NA NA NAQuoted Equity Securities 28.24% 46.49% 54.63% 53.37% 51.57%Quoted Corporate Debts NA NA NA NA NAUnquoted Investment-Linked NA NA NA NA NAUnquoted Bonds NA 22.19% 20.94% 26.97% 27.07%Fixed & Call Deposits 71.76% 31.33% 24.43% 19.66% 21.36%Total NAV 13,745,317 18,513,944 30,197,628 46,126,935 60,267,910Total Units 31,610,708 40,278,547 65,493,150 105,795,722 130,168,272NAV per unit 0.435 0.460 0.461 0.436 0.463Highest NAV per unit during the year 0.512 0.512 0.462 0.436 0.463Lowest NAV per unit during the year 0.425 0.391 0.403 0.398 0.433% of <strong>Annual</strong> Returns:- Capital Growth -14.15% 15.52% 12.93% 6.83% 6.19%- Income Distribution 7.88% 9.80% 10.60% NA NAAverage <strong>Annual</strong> Returns:- one year period -14.15% 15.52% 12.93% 6.83% 6.19%- three year period NA NA 3.85% 11.70% 8.61%- five year period NA NA NA NA 4.91%The performance of relevantbenchmark indices 7% 7% 7% 7% 7%
16Company No.731996 H<strong>MAA</strong> TAKAFUL BERHAD<strong>MAA</strong> TAKAFUL INVESTMENT - LINKED FUNDS(<strong>MAA</strong> Takaful Shariah Balanced Fund, <strong>MAA</strong> Takaful Shariah Income Fund, <strong>MAA</strong> Takaful Shariah GrowthFund, <strong>MAA</strong> Takaful Shariah Flexi Fund and <strong>MAA</strong> Takafulink Structured Invest Fund)FUND OBJECTIVE & FUND PERFORMANCEAS AT 31 DECEMBER 2012<strong>MAA</strong> Takaful Shariah GrowthFund Y/E 2008 Y/E 2009 Y/E 2010 Y/E 2011 Y/E 2012Composition of Fund to IndustrySector:Construction 11.00% 5.65% 9.42% 5.73% 5.32%Consumer NA 5.08% 5.08% 5.13% 5.34%Corporate Action NA 0.66% NA NA NAFinance NA NA NA 2.23% 2.08%Industrial 8.00% 10.54% 14.23% 8.48% 9.34%IPC 5.00% 3.16% 4.18% 3.48% 15.30%Plantation 6.00% 21.67% 24.30% 23.62% 14.08%Properties 5.00% 3.37% 6.80% 2.15% 2.30%Second Board 1.00% NA NA NA NATechnology NA NA 1.45% NA NATrading Services 23.00% 28.02% 29.84% 30.42% 33.31%TSR & Warrants 0.02% NA NA NA NACash & deposits 41.00% 21.87% 4.70% 18.75% 12.93%Category of Investment:Malaysian Government Securities NA NA NA NA NAQuoted Equity Securities 59.22% 78.13% 95.30% 81.25% 87.07%Quoted Corporate Debts NA NA NA NA NAUnquoted Investment-Linked NA NA NA NA NAUnquoted Bonds NA NA NA NA NAFixed & Call Deposits 40.78% 21.87% 4.70% 18.75% 12.93%Total NAV 12,409,441 20,338,833 40,627,343 64,706,760 82,264,657Total Units 33,484,068 45,643,948 84,926,503 148,070,389 172,824,910NAV per unit 0.371 0.446 0.478 0.437 0.476Highest NAV per unit during the year 0.516 0.516 0.482 0.438 0.476Lowest NAV per unit during the year 0.353 0.336 0.396 0.390 0.430% of <strong>Annual</strong> Returns:- Capital Growth -26.97% 29.48% 18.35% 5.66% 8.92%- Income Distribution 7.36% 8.10% 13.20% NA NAAverage <strong>Annual</strong> Returns:- one year period -26.97% 29.48% 18.35% 5.66% 8.92%- three year period NA NA 3.82% 17.42% 10.85%- five year period NA NA NA NA 5.19%The performance of relevantbenchmark indices 9% 9% 18.20% 2.41% 11.85%
17Company No.731996 H<strong>MAA</strong> TAKAFUL BERHAD<strong>MAA</strong> TAKAFUL INVESTMENT - LINKED FUNDS(<strong>MAA</strong> Takaful Shariah Balanced Fund, <strong>MAA</strong> Takaful Shariah Income Fund, <strong>MAA</strong> Takaful Shariah GrowthFund, <strong>MAA</strong> Takaful Shariah Flexi Fund and <strong>MAA</strong> Takafulink Structured Invest Fund)FUND OBJECTIVE & FUND PERFORMANCEAS AT 31 DECEMBER 2012<strong>MAA</strong> Takaful Shariah IncomeFund Y/E 2008 Y/E 2009 Y/E 2010 Y/E 2011 Y/E 2012Composition of Fund to IndustrySector:Construction 1.30% NA NA 1.35% 0.83%Consumer NA NA NA NA 0.45%Finance NA NA NA 1.17% 1.48%Industrial NA NA NA 1.59% 2.18%IPC 1.50% 1.24% 0.67% NA 3.98%Plantation NA NA NA 2.77% 5.30%Properties NA NA NA NA 0.20%Trading Services NA NA NA 3.33% 7.27%Fixed Income Securities 29.30% 88.61% 74.34% 81.53% 69.24%Commercial Papers 14.50% NA NA NA NACash & deposits 53.40% 10.15% 24.99% 8.26% 9.07%Category of Investment:Malaysian Government Securities NA NA NA NA NAQuoted Equity Securities 2.86% 1.24% 0.67% 10.20% 21.69%Quoted Corporate Debts NA NA NA NA NAUnquoted Investment-Linked NA NA NA NA NAUnquoted Bonds 43.77% 88.62% 74.34% 81.53% 69.24%Fixed & Call Deposits 53.37% 10.15% 24.99% 8.26% 9.07%Total NAV 6,865,307 13,372,490 21,015,752 21,330,080 37,316,412Total Units 13,382,715 25,561,864 40,463,688 40,706,260 70,675,023NAV per unit 0.513 0.523 0.519 0.524 0.528Highest NAV per unit during the year 0.513 0.523 0.520 0.524 0.528Lowest NAV per unit during the year 0.503 0.500 0.500 0.500 0.500% of <strong>Annual</strong> Returns:- Capital Growth 1.79% 4.60% 4.00% 4.80% 5.60%- Income Distribution 2.60% 4.60% 4.00% 4.80% NA%Average <strong>Annual</strong> Returns:- one year period 1.79% 4.60% 4.00% 4.80% 5.60%- three year period NA NA 3.46% 4.47% 4.80%- five year period NA NA NA NA 4.15%The performance of relevantbenchmark indices 5% 5% 5% 5% 5%
18Company No.731996 H<strong>MAA</strong> TAKAFUL BERHAD<strong>MAA</strong> TAKAFUL INVESTMENT - LINKED FUNDS(<strong>MAA</strong> Takaful Shariah Balanced Fund, <strong>MAA</strong> Takaful Shariah Income Fund, <strong>MAA</strong> Takaful Shariah GrowthFund, <strong>MAA</strong> Takaful Shariah Flexi Fund and <strong>MAA</strong> Takafulink Structured Invest Fund)FUND OBJECTIVE & FUND PERFORMANCEAS AT 31 DECEMBER 2012<strong>MAA</strong> Takaful Shariah Flexi Fund Y/E 2008 Y/E 2009 Y/E 2010 Y/E 2011 Y/E 2012Composition of Fund to IndustrySector:Construction- -7.03% 5.35% 2.97%Consumer- -3.89% 6.48% 1.46%Finance- -NA 2.17% 3.83%Industrial- -15.14% 3.68% 6.48%IPC- -NA 2.76% 12.97%Plantation- -20.35% 24.72% 16.05%Properties- -6.07% 2.17% 0.60%REIT- -NA NA 0.72%Technology- -1.43% NA NATrading Services- -16.73% 28.72% 25.51%Cash & deposits- -29.36% 23.96% 29.41%Category of Investment:Malaysian Government SecuritiesQuoted Equity SecuritiesQuoted Corporate DebtsUnquoted Investment-LinkedUnquoted BondsFixed & Call DepositsTotal NAVTotal UnitsNAV per unitHighest NAV per unit during the yearLowest NAV per unit during the year% of <strong>Annual</strong> Returns:- Capital Growth- Income DistributionAverage <strong>Annual</strong> Returns:- one year period- three year period- five year periodThe performance of relevantbenchmark indices- -- -- -- -- -- -- -- -- -- -- -- -- -- -- -- -- -NA NA NA70.64% 76.04% 70.59%NA NA NANA NA NANA NA NA29.36% 23.96% 29.41%6,845,290 17,532,197 22,455,26813,080,526 31,476,117 37,676,6240.523 0.557 0.5960.525 0.557 0.5960.499 0.504 0.5524.60% 6.50% 7.00%NA NA NA4.60% 6.50% 7.00%NA NA 6.03%NA NA NA2.25% 9.00% 9.00%
19Company No.731996 H<strong>MAA</strong> TAKAFUL BERHAD<strong>MAA</strong> TAKAFUL INVESTMENT - LINKED FUNDS(<strong>MAA</strong> Takaful Shariah Balanced Fund, <strong>MAA</strong> Takaful Shariah Income Fund, <strong>MAA</strong> Takaful Shariah GrowthFund, <strong>MAA</strong> Takaful Shariah Flexi Fund and <strong>MAA</strong> Takafulink Structured Invest Fund)FUND OBJECTIVE & FUND PERFORMANCEAS AT 31 DECEMBER 2012<strong>MAA</strong> Takafulink Structured InvestFund Y/E 2008 Y/E 2009 Y/E 2010 Y/E 2011 Y/E 2012Composition of Fund to IndustrySector:Option NA 5.04% 4.01% 2.59% NACash & deposits 100.00% 94.96% 95.99% 97.41% 100.00%Category of Investment:Equities & Derivatives NA 5.04% 4.01% 2.59% NAFixed & Call Deposits 100.00% 94.96% 95.99% 97.41% 100.00%Total NAV 41,796,100 40,340,497 41,311,330 41,861,794 44,177,868Total Units 83,592,200 83,502,267 82,864,260 82,730,818 82,421,395NAV per unit 0.500 0.483 0.499 0.506 0.536Highest NAV per unit during the year 0.500 0.488 0.503 0.508 0.536Lowest NAV per unit during the year 0.500 0.478 0.482 0.497 0.506% of <strong>Annual</strong> Returns:- Capital Growth NA -3.40% 3.31% 1.40% 5.93%- Income Distribution NA NA NA NA NAAverage <strong>Annual</strong> Returns:- one year period NA -3.40% 3.31% 1.40% 5.93%- three year period NA NA NA NA 3.53%- five year period NA NA NA NA NAThe performance of relevantbenchmark indices NA NA NA NA NA
20Company No.731996 H<strong>MAA</strong> TAKAFUL BERHAD<strong>MAA</strong> TAKAFUL INVESTMENT - LINKED FUNDS(<strong>MAA</strong> Takaful Shariah Balanced Fund, <strong>MAA</strong> Takaful Shariah Income Fund, <strong>MAA</strong> Takaful Shariah GrowthFund, <strong>MAA</strong> Takaful Shariah Flexi Fund and <strong>MAA</strong> Takafulink Structured Invest Fund)STATEMENT OF ASSETS AND LIABILITIESAS AT 31 DECEMBER 2012INVESTMENTSBalanced FundIncome FundNote 2012 2011 2012 2011RM RM RM RMQuoted investments 3 31,914,198 24,958,554 7,748,941 2,102,040Unquoted investments 4 16,571,400 12,478,500 24,580,450 16,655,050Fixed and call deposits 13,048,000 9,247,000 3,115,000 1,726,000─────── ─────── ─────── ───────61,533,598 46,684,054 35,444,391 20,483,090─────── ─────── ─────── ───────OTHER ASSETSAmount due from Manager - 387,783 2,140,247 1,176,403Receivables 333,454 155,532 235,695 145,019Cash and bank balances 178,236 20,564 55,424 20,383─────── ─────── ─────── ───────511,690 563,879 2,431,366 1,341,805─────── ─────── ─────── ───────TOTAL ASSETS 62,045,288 47,247,933 37,875,757 21,824,895─────── ─────── ─────── ───────LIABILITIESPayables 859,424 578,672 319,626 263,315Current tax liabilities 341,390 355,709 157,487 186,006Deferred tax liabilities 200,713 186,617 82,232 45,494Amount due to Manager 375,851 - - -─────── ─────── ─────── ───────TOTAL LIABILITIES 1,777,378 1,120,998 559,345 494,815─────── ─────── ─────── ───────NET ASSET VALUE OF FUND 60,267,910 46,126,935 37,316,412 21,330,080═══════ ═══════ ═══════ ═══════REPRESENTED BY:Unitholders’ capital 41,312,081 18,955,829 34,843,247 2,473,165Undistributed surpluscarried forward 18,955,829 27,171,106 2,473,165 18,856,915─────── ─────── ─────── ───────PARTICIPANTS’ FUND 60,267,910 46,126,935 37,316,412 21,330,080═══════ ═══════ ═══════ ═══════Number of units in circulation 130,168,272 105,795,722 70,675,023 40,706,260═══════ ═══════ ═══════ ═══════Net asset value per unit 0.463 0.436 0.528 0.524═══════ ═══════ ═══════ ═══════The accompanying notes are an integral part of these financial statements
21Company No.731996 H<strong>MAA</strong> TAKAFUL BERHAD<strong>MAA</strong> TAKAFUL INVESTMENT - LINKED FUNDS(<strong>MAA</strong> Takaful Shariah Balanced Fund, <strong>MAA</strong> Takaful Shariah Income Fund, <strong>MAA</strong> Takaful Shariah GrowthFund, <strong>MAA</strong> Takaful Shariah Flexi Fund and <strong>MAA</strong> Takafulink Structured Invest Fund)STATEMENT OF ASSETS AND LIABILITIESAS AT 31 DECEMBER 2012 (CONTINUED)INVESTMENTSGrowth FundFlexi FundNote 2012 2011 2012 2011RM RM RM RMQuoted investments 3 73,798,668 53,153,281 16,727,444 13,465,134Fixed and call deposits 11,895,000 13,100,000 6,809,000 4,666,000─────── ─────── ─────── ───────85,693,668 66,253,281 23,536,444 18,131,134─────── ─────── ─────── ───────OTHER ASSETSAmount due from Manager - 903,132 - 101,882Receivables 258,576 19,718 134,199 17,181Cash and bank balances 209,489 20,134 26,548 20,525─────── ─────── ─────── ───────468,065 942,984 160,747 139,588─────── ─────── ─────── ───────TOTAL ASSETS 86,161,733 67,196,265 23,697,191 18,270,722─────── ─────── ─────── ───────LIABILITIESPayables 2,529,916 1,661,104 266,198 637,644Current tax liabilities 447,176 464,664 135,789 32,435Deferred tax liabilities 550,430 363,736 83,738 68,446Amount due to Manager 369,554 - 756,198 -─────── ─────── ─────── ───────TOTAL LIABILITIES 3,897,076 2,489,504 1,241,923 738,525─────── ─────── ─────── ───────NET ASSET VALUE OF FUND 82,264,657 64,706,760 22,455,268 17,532,197═══════ ═══════ ═══════ ═══════REPRESENTED BY:Unitholders’ capital 51,650,717 30,613,940 11,504,603 10,950,665Undistributed surpluscarried forward 30,613,940 34,092,820 10,950,665 6,581,532─────── ─────── ─────── ───────PARTICIPANTS’ FUND 82,264,657 64,706,760 22,455,268 17,532,197═══════ ═══════ ═══════ ═══════Number of units in circulation 172,824,910 148,070,389 37,676,624 31,476,117═══════ ═══════ ═══════ ═══════Net asset value per unit 0.476 0.437 0.596 0.557═══════ ═══════ ═══════ ═══════The accompanying notes are an integral part of these financial statements
22Company No.731996 H<strong>MAA</strong> TAKAFUL BERHAD<strong>MAA</strong> TAKAFUL INVESTMENT - LINKED FUNDS(<strong>MAA</strong> Takaful Shariah Balanced Fund, <strong>MAA</strong> Takaful Shariah Income Fund, <strong>MAA</strong> Takaful Shariah GrowthFund, <strong>MAA</strong> Takaful Shariah Flexi Fund and <strong>MAA</strong> Takafulink Structured Invest Fund)STATEMENT OF ASSETS AND LIABILITIESAS AT 31 DECEMBER 2012 (CONTINUED)INVESTMENTSStructured Invest Fund2012 2011RM RMFixed and call deposits 45,677,519 42,741,414OTHER ASSETS─────── ───────45,677,519 42,741,414─────── ───────Receivables 5,879 83,569Amount due from Manager - -─────────────────────5,879 83,569───────TOTAL ASSETS 45,683,398 42,824,983LIABILITIES──────────────Payables 595,467 367,153Current tax liabilities 17,351 10,293Deferred tax liabilities 306,735 85,125Amount due to Manager 585,977 500,618──────────────TOTAL LIABILITIES 1,505,530 963,189─────── ───────NET ASSET VALUE OF FUND 44,177,868 41,861,794═══════ ═══════REPRESENTED BY:Unitholders’ capital 42,437,187 1,740,681Undistributed surpluscarried forward 1,740,681 40,121,113──────────────PARTICIPANTS’ FUND 44,177,868 41,861,794══════════════Number of units in circulation 82,421,395 82,730,818═══════ ═══════Net asset value per unit 0.536 0.506═══════ ═══════The accompanying notes are an integral part of these financial statements
23Company No.731996 H<strong>MAA</strong> TAKAFUL BERHAD<strong>MAA</strong> TAKAFUL INVESTMENT - LINKED FUNDS(<strong>MAA</strong> Takaful Shariah Balanced Fund, <strong>MAA</strong> Takaful Shariah Income Fund, <strong>MAA</strong> Takaful Shariah GrowthFund, <strong>MAA</strong> Takaful Shariah Flexi Fund and <strong>MAA</strong> Takafulink Structured Invest Fund)STATEMENT OF INCOME AND EXPENDITUREFOR THE FINANCIAL YEAR ENDED 31 DECEMBER 2012INCOMEBalanced FundIncome Fund2012 2011 2012 2011RM RM RM RMNet investment incomeProfit income 991,691 754,093 1,232,376 1,048,039Dividend income 840,475 553,115 187,985 13,234Profit on disposalDebt securities 141,790 80,400 87,820 25,018Equity securities 2,143,318 2,184,920 346,697 -Unrealised capital gainDebt securities 75,634 143,982 364,220 193,884Equity securities 100,566 - 95,000 172,745Accretion of discounts - - - -─────── ─────── ─────── ───────TOTAL INCOME 4,293,474 3,716,510 2,314,098 1,452,920─────── ─────── ─────── ───────OUTGOManagement fees and administrativeexpenses (719,274) (500,567) (319,136) (217,358)Loss on disposal -Debt securities - - - -Equity securities - - - (21,925)Unrealised capital lossEquity securities - (315,481) - -Amortisation of premium (624) (79,672) (46,100) (42,264)─────── ─────── ─────── ───────TOTAL OUTGO (719,898) (895,720) (365,236) (281,547)─────── ─────── ─────── ───────Surplus transfer from risk fund - - 4,967,097 3,126,588Net surplus before taxation 3,573,575 2,820,790 6,915,959 4,297,961Taxation (343,428) (265,708) (181,440) (111,097)NET SURPLUS FOR THEFINANCIAL YEAR 3,230,147 2,555,082 6,734,519 4,186,864Amount available for distribution - - - -─────── ─────── ─────── ───────Undistributed surpluscarried forward 3,230,147 2,555,082 6,734,519 4,186,864═══════ ═══════ ═══════ ═══════The accompanying notes are an integral part of these financial statements
24Company No.731996 H<strong>MAA</strong> TAKAFUL BERHAD<strong>MAA</strong> TAKAFUL INVESTMENT - LINKED FUNDS(<strong>MAA</strong> Takaful Shariah Balanced Fund, <strong>MAA</strong> Takaful Shariah Income Fund, <strong>MAA</strong> Takaful Shariah GrowthFund, <strong>MAA</strong> Takaful Shariah Flexi Fund and <strong>MAA</strong> Takafulink Structured Invest Fund)STATEMENT OF INCOME AND EXPENDITUREFOR THE FINANCIAL YEAR ENDED 31 DECEMBER 2012 (CONTINUED)INCOMEGrowth FundFlexi Fund2012 2011 2012 2011RM RM RM RMNet investment incomeProfit income 302,513 414,985 126,585 153,608Dividend income 2,146,717 1,117,331 472,471 225,990Profit on disposalEquity securities 3,209,353 3,299,638 1,064,279 65,281Unrealised capital gainEquity securities 2,333,679 - 191,152 616,890─────── ─────── ─────── ───────TOTAL INCOME 7,992,262 4,831,954 1,854,487 1,061,769─────── ─────── ─────── ───────OUTGOManagement fees and administrativeexpenses (1,113,299) (784,511) (266,199) (176,789)Unrealised capital lossEquity securities - (287,689) - -─────── ─────── ─────── ───────TOTAL OUTGO (1,113,299) (1,072,200) (266,199) (176,789)─────── ─────── ─────── ───────Net surplus before taxation 6,878,963 3,759,754 1,588,288 884,980Taxation (639,381) (363,540) (148,359) (84,942)NET SURPLUS FOR THEFINANCIAL YEAR 6,239,582 3,396,214 1,439,929 800,038Amount available for distribution - - - -─────── ─────── ─────── ───────Undistributed surpluscarried forward 6,239,582 3,396,214 1,439,929 800,038═══════ ═══════ ═══════ ═══════The accompanying notes are an integral part of these financial statements
25Company No.731996 H<strong>MAA</strong> TAKAFUL BERHAD<strong>MAA</strong> TAKAFUL INVESTMENT - LINKED FUNDS(<strong>MAA</strong> Takaful Shariah Balanced Fund, <strong>MAA</strong> Takaful Shariah Income Fund, <strong>MAA</strong> Takaful Shariah GrowthFund, <strong>MAA</strong> Takaful Shariah Flexi Fund and <strong>MAA</strong> Takafulink Structured Invest Fund)STATEMENT OF INCOME AND EXPENDITUREFOR THE FINANCIAL YEAR ENDED 31 DECEMBER 2012 (CONTINUED)INCOMEStructured Invest Fund2012 2011RM RMNet investment incomeProfit income 88,229 27,254Unrealised capital gainOthers 2,770,185 1,026,274──────────────TOTAL INCOME 2,858,414 1,053,528OUTGO──────────────Management fees and administrativeexpenses (228,306) (211,570)──────────────TOTAL OUTGO (228,306) (211,570)──────────────Net surplus before taxation 2,630,108 841,958Taxation (228,673) (84,279)NET SURPLUS FOR THEFINANCIAL YEAR 2,401,435 757,679Amount available for distribution - -Undistributed surplus──────────────carried forward 2,401,435 757,679═══════ ═══════The accompanying notes are an integral part of these financial statements
26Company No.731996 H<strong>MAA</strong> TAKAFUL BERHAD<strong>MAA</strong> TAKAFUL INVESTMENT - LINKED FUNDS(<strong>MAA</strong> Takaful Shariah Balanced Fund, <strong>MAA</strong> Takaful Shariah Income Fund, <strong>MAA</strong> Takaful Shariah GrowthFund, <strong>MAA</strong> Takaful Shariah Flexi Fund and <strong>MAA</strong> Takafulink Structured Invest Fund)STATEMENT OF CHANGES IN NET ASSET VALUEFOR THE FINANCIAL YEAR ENDED 31 DECEMBER 2012Balanced FundIncome Fund2012 2011 2012 2011RM RM RM RMNet asset value at beginningof financial year 46,126,936 30,197,628 21,330,079 21,015,752Movements due to units createdand cancelled during the financial year :Net creation of units 19,593,301 18,930,895 23,175,507 1,351,848Net cancellation of units (8,682,474) (5,245,146) (13,923,693) (4,133,472)Net switching of units - (311,524) - (1,090,912)─────── ─────── ─────── ───────57,037,763 43,571,853 30,581,893 17,143,216─────── ─────── ─────── ───────Net income for the financial year:Net realised income 3,068,044 2,712,861 6,312,036 3,849,565Unrealised capital (loss)/gain net of taxon investments 162,103 (157,779) 422,482 337,299─────── ─────── ─────── ───────3,230,147 2,555,082 6,734,518 4,186,864─────── ─────── ─────── ───────Net asset value before distribution 60,267,910 46,126,935 37,316,411 21,330,080Distribution during the financial year - - - -─────── ─────── ─────── ───────Net asset value at end of financial year 60,267,910 46,126,935 37,316,411 21,330,080═══════ ═══════ ═══════ ═══════The accompanying notes are an integral part of these financial statements
27Company No.731996 H<strong>MAA</strong> TAKAFUL BERHAD<strong>MAA</strong> TAKAFUL INVESTMENT - LINKED FUNDS(<strong>MAA</strong> Takaful Shariah Balanced Fund, <strong>MAA</strong> Takaful Shariah Income Fund, <strong>MAA</strong> Takaful Shariah GrowthFund, <strong>MAA</strong> Takaful Shariah Flexi Fund and <strong>MAA</strong> Takafulink Structured Invest Fund)STATEMENT OF CHANGES IN NET ASSET VALUEFOR THE FINANCIAL YEAR ENDED 31 DECEMBER 2012 (CONTINUED)Growth FundFlexi Fund2012 2011 2012 2011RM RM RM RMNet asset value at beginning 64,706,760 40,627,343 17,532,198 6,845,290of financial yearMovements due to units createdand cancelled during the financial year :Net creation of units 26,103,529 35,120,324 11,767,328 12,029,639Net cancellation of units (14,785,214) (13,323,358) (8,284,189) (2,142,770)Net switching of units - (1,113,763 - -─────── ─────── ─────── ───────76,025,075 61,310,546 21,015,337 16,732,159─────── ─────── ─────── ───────Net income for the financial year:Net realised income 4,092,596 3,660,888 1,264,069 232,500Unrealised capital (loss)/gain net of taxon investments 2,146,985 (264,674) 175,860 567,538─────── ─────── ─────── ───────6,239,581 3,396,214 1,439,929 800,038─────── ─────── ─────── ───────Net asset value before distribution 82,264,656 64,706,760 22,455,266 17,532,197Distribution during the financial year - - - -─────── ─────── ─────── ───────Net asset value at end of financial year 82,264,656 64,706,760 22,455,266 17,532,197═══════ ═══════ ═══════ ═══════The accompanying notes are an integral part of these financial statements
28Company No.731996 H<strong>MAA</strong> TAKAFUL BERHAD<strong>MAA</strong> TAKAFUL INVESTMENT - LINKED FUNDS(<strong>MAA</strong> Takaful Shariah Balanced Fund, <strong>MAA</strong> Takaful Shariah Income Fund, <strong>MAA</strong> Takaful Shariah GrowthFund, <strong>MAA</strong> Takaful Shariah Flexi Fund and <strong>MAA</strong> Takafulink Structured Invest Fund)STATEMENT OF CHANGES IN NET ASSET VALUEFOR THE FINANCIAL YEAR ENDED 31 DECEMBER 2012 (CONTINUED)Structured Invest Fund2012 2011RM RMNet asset value at beginning 41,861,791 41,311,330of financial yearMovements due to units createdand cancelled during the financial year :Net creation of units - -Net cancellation of units (85,359) (207,215)Net switching of units - -─────── ───────41,776,432 41,104,115─────── ───────Net income for the financial year:Net realised loss (147,134) (186,495)Unrealised capital gain net of taxon investments 2,548,570 944,174──────────────2,401,436 757,679──────────────Net asset value before distribution 44,177,868 41,861,794Distribution during the financial year - -─────── ───────Net asset value at end of financial year 44,177,868 41,861,794═══════ ═══════The accompanying notes are an integral part of these financial statements
29Company No.731996 H<strong>MAA</strong> TAKAFUL BERHAD<strong>MAA</strong> TAKAFUL INVESTMENT - LINKED FUNDS(<strong>MAA</strong> Takaful Shariah Balanced Fund, <strong>MAA</strong> Takaful Shariah Income Fund, <strong>MAA</strong> Takaful Shariah GrowthFund, <strong>MAA</strong> Takaful Shariah Flexi Fund and <strong>MAA</strong> Takafulink Structured Invest Fund)NOTES TO THE FINANCIAL STATEMENTS - 31 DECEMBER 20121 PRINCIPAL ACTIVITIES AND GENERAL INFORMATIONThe <strong>MAA</strong> Takaful Investment-Linked Funds consist of the <strong>MAA</strong> Takaful Shariah Balanced Fund, <strong>MAA</strong>Takaful Shariah Income Fund, <strong>MAA</strong> Takaful Shariah Growth Fund, <strong>MAA</strong> Takaful Shariah Flexi Fund and<strong>MAA</strong> Takafulink Structured Invest Fund (hereinafter referred to collectively as "the Funds"). The principalactivities of the Funds are to invest in authorised investments.The Manager of the Funds is <strong>MAA</strong> Takaful Berhad, a company incorporated in Malaysia, whose principalactivity is that of conducting general and family takaful business, including investment-linked familybusiness.The financial statements were authorised for issued by the Board of Directors of the Manager inaccordance with their resolution on 24 April 2013.2 SUMMARY OF SIGNIFICANT ACCOUNTING POLICIESThe following accounting policies have been used consistently in dealing with items which are consideredmaterial in relation to the financial statements.(a)Basis of preparationThe financial statements have been prepared under the historical cost convention, except asdisclosed in the summary of significant accounting policies as described below and the Guidelineson Investment-Linked Insurance/Takaful Business issued by Bank Negara Malaysia.(b)InvestmentsQuoted investments are valued at the market values at the balance sheet date. Market value isdetermined by reference to the stock exchange closing price at the balance sheet date.Unquoted investments are stated at the prices quoted by financial institutions at the balance sheetdate.Any increase or decrease in the value of these investments is credited or charged to the statementof income and expenditure.
30Company No.731996 H<strong>MAA</strong> TAKAFUL BERHAD<strong>MAA</strong> TAKAFUL INVESTMENT - LINKED FUNDS(<strong>MAA</strong> Takaful Shariah Balanced Fund, <strong>MAA</strong> Takaful Shariah Income Fund, <strong>MAA</strong> Takaful Shariah GrowthFund, <strong>MAA</strong> Takaful Shariah Flexi Fund and <strong>MAA</strong> Takafulink Structured Invest Fund)NOTES TO THE FINANCIAL STATEMENTS - 31 DECEMBER 2012 (CONTINUED)2 SUMMARY OF SIGNIFICANT ACCOUNTING POLICIES (CONTINUED)(c)ReceivablesReceivables are carried at invoiced amount less an allowance for doubtful debts.(d)Net creation of unitsNet creation of units represents contributions paid by participants as payment for a new contractor subsequent payments to increase the amount of that contract. Net creation of units isrecognised on a receipt basis.(e)Net cancellation of unitsNet cancellation of units represents cancellation of units arising from surrenders and withdrawals.Cancellation is recognised upon surrendering of the related takaful contract.(f)Income recognitionProfit income on fixed and call deposits and unquoted investments, including the amount ofamortisation of premiums and accretion of discounts, is recognised on a time proportion basis thattakes into account the effective yield of the asset.Dividend income is recognised when the right to receive payment is established.Gains or losses arising from the disposal of investments are credited or charged to the statementof income and expenditure.(g)Income taxesCurrent tax expense is determined according to the tax laws of the jurisdiction in which theCompany operates and includes all taxes based upon the taxable profits.Deferred tax is recognised in full, using the liability method, on temporary differences arisingbetween the amounts attributed to assets and liabilities for tax purpose and their carrying amountsin the financial statements.Deferred tax assets are recognised to the extent that it is probable that taxable profits will beavailable against which the deductible temporary differences or unused tax losses can be utilised.Deferred tax is determined using tax rate (and tax laws) enacted or substantively enacted by thebalance sheet date are used to determine deferred tax.
31Company No.731996 H<strong>MAA</strong> TAKAFUL BERHAD<strong>MAA</strong> TAKAFUL INVESTMENT - LINKED FUNDS(<strong>MAA</strong> Takaful Shariah Balanced Fund, <strong>MAA</strong> Takaful Shariah Income Fund, <strong>MAA</strong> Takaful Shariah GrowthFund, <strong>MAA</strong> Takaful Shariah Flexi Fund and <strong>MAA</strong> Takafulink Structured Invest Fund)NOTES TO THE FINANCIAL STATEMENTS - 31 DECEMBER 2012 (CONTINUED)2 SUMMARY OF SIGNIFICANT ACCOUNTING POLICIES (CONTINUED)(h)Cash and cash equivalentsCash and cash equivalents consist of cash and bank balances, excluding fixed and call deposits,that are readily convertible to known amounts of cash and which are subject to an insignificant riskof changes in value.(i)Financial instrumentsDescriptionA financial instrument is any contract that gives rise to both a financial asset of one enterprise anda financial liability or equity instrument of another enterprise.A financial asset is any asset that is cash, a contractual right to receive cash or another financialasset from another enterprise, a contractual right to exchange financial instruments with anotherenterprise under conditions that are potentially favourable, or an equity instrument of anotherenterprise.A financial liability is any liability that is a contractual obligation to deliver cash or another financialasset to another enterprise, or to exchange financial instruments with another enterprise underconditions that are potentially unfavourable.The particular recognition method adopted for financial instruments recognised on the balancesheet is disclosed in the individual accounting policy note associated with each item.The Company's basis of estimation of fair values for financial instruments is as follows:• Malaysian Government Securities and Treasury bills/Bank Negara Malaysia papers arebased on the indicative market prices.• Quoted investments are based on quoted market prices.
Company No.731996 H<strong>MAA</strong> TAKAFUL BERHAD<strong>MAA</strong> TAKAFUL INVESTMENT - LINKED FUNDS(<strong>MAA</strong> Takaful Shariah Balanced Fund, <strong>MAA</strong> Takaful Shariah Income Fund, <strong>MAA</strong> Takaful Shariah Growth Fund and <strong>MAA</strong> Takafulink Structured InvestFund)NOTES TO THE FINANCIAL STATEMENTS - 31 DECEMBER 2012 (CONTINUED)3 QUOTED INVESTMENTSBalanced Fund Income Fund Growth Fund Flexi Fund2012Market Market Market MarketCost value Cost value Cost value Cost valueRM RM RM RM RM RM RMShares/warrants:SectorMain MarketIndustrial Products 2,829,663 3,123,927 755,223 779,139 6,983,818 7,919,907 1,392,772 1,534,910Construction 1,342,774 1,354,974 291,096 296,155 4,577,013 4,505,662 698,708 704,085Trading & Services 9,905,464 11,175,614 2,403,627 2,596,430 24,941,553 28,234,346 5,461,257 6,046,000IPC 5,355,061 5,549,325 1,413,924 1,422,665 11,632,896 12,968,793 2,968,912 3,073,356Properties 288,936 273,000 75,592 71,400 1,747,391 1,947,120 151,182 142,800Plantation 7,240,769 7,675,796 1,798,939 1,893,104 11,480,880 11,935,506 3,582,663 3,802,744Finance 1,709,649 1,772,528 567,515 529,670 1,399,734 1,761,870 868,063 906,898──────── ──────── ──────── ──────── ──────── ──────── ──────── ────────28,672,316 30,925,164 7,305,916 7,588,563 62,763,285 69,273,204 15,123,557 16,210,793──────── ──────── ──────── ──────── ──────── ──────── ──────── ────────Consumer Products 682,863 643,314 171,792 160,378 4,155,008 4,525,464 365,858 345,984REIT 387,453 345,720 - - - - 191,303 170,667──────── ──────── ──────── ──────── ──────── ──────── ──────── ────────1,070,316 989,034 171,792 160,378 4,155,008 4,525,464 557,161 516,651──────── ──────── ──────── ──────── ──────── ──────── ──────── ──────────────── ──────── ──────── ──────── ──────── ──────── ──────── ────────29,742,632 31,914,198 7,477,708 7,748,941 66,918,293 73,798,668 15,680,718 16,727,444════════ ════════ ════════ ════════ ════════ ════════ ════════ ════════32
Company No.731996 H<strong>MAA</strong> TAKAFUL BERHAD<strong>MAA</strong> TAKAFUL INVESTMENT - LINKED FUNDS(<strong>MAA</strong> Takaful Shariah Balanced Fund, <strong>MAA</strong> Takaful Shariah Income Fund, <strong>MAA</strong> Takaful Shariah Growth Fund and <strong>MAA</strong> Takafulink Structured InvestFund)NOTES TO THE FINANCIAL STATEMENTS - 31 DECEMBER 2012 (CONTINUED)3 QUOTED INVESTMENTS (CONTINUED)Balanced Fund Income Fund Growth Fund Flexi Fund2011Market Market Market MarketCost value Cost value Cost value Cost valueRM RM RM RM RM RM RMShares/warrants:SectorMain MarketIndustrial Products 2,295,505 2,372,911 278,929 327,560 5,054,743 5,546,260 603,403 651,564Construction 1,312,156 1,474,480 266,929 277,330 3,418,037 3,749,940 874,357 946,800Trading & Services 8,443,959 9,260,283 599,890 685,800 18,199,269 19,900,231 4,761,595 5,085,355IPC 917,425 1,205,495 - - 1,715,241 2,275,500 400,401 489,005Properties 457,645 575,960 - - 1,171,131 1,408,440 317,130 384,780Plantation 7,325,051 7,969,015 534,468 569,780 14,184,826 15,454,140 4,093,466 4,377,120Finance 616,886 647,570 245,587 241,570 1,410,333 1,459,570 371,471 383,670──────── ──────── ──────── ──────── ──────── ──────── ──────── ────────21,368,627 23,505,714 1,925,803 2,102,040 45,153,579 49,794,081 11,421,823 12,318,294──────── ──────── ──────── ──────── ──────── ──────── ──────── ────────Consumer Products 1,518,926 1,452,840 - - 3,453,006 3,359,200 1,187,739 1,146,840──────── ──────── ──────── ──────── ──────── ──────── ──────── ────────1,518,926 1,452,840 - - 3,453,006 3,359,200 1,187,739 1,146,840──────── ──────── ──────── ──────── ──────── ──────── ──────── ──────────────── ──────── ──────── ──────── ──────── ──────── ──────── ────────22,887,553 24,958,554 1,925,803 2,102,040 48,606,585 53,153,281 12,609,562 13,465,134════════ ════════ ════════ ════════ ════════ ════════ ════════ ════════33
Company No.731996 H<strong>MAA</strong> TAKAFUL BERHAD<strong>MAA</strong> TAKAFUL INVESTMENT - LINKED FUNDS(<strong>MAA</strong> Takaful Shariah Balanced Fund, <strong>MAA</strong> Takaful Shariah Income Fund, <strong>MAA</strong> Takaful Shariah Growth Fund, <strong>MAA</strong> Takaful Shariah Flexi Fund and <strong>MAA</strong>Takafulink Structured Invest Fund)NOTES TO THE FINANCIAL STATEMENTS - 31 DECEMBER 2012 (CONTINUED)3 QUOTED INVESTMENTS (CONTINUED)There were no quoted investment held by the Structured Invest Fund as at 31 December 2012 (2011:NIL)34
35Company No.731996 H<strong>MAA</strong> TAKAFUL BERHAD<strong>MAA</strong> TAKAFUL INVESTMENT - LINKED FUNDS(<strong>MAA</strong> Takaful Shariah Balanced Fund, <strong>MAA</strong> Takaful Shariah Income Fund, <strong>MAA</strong> Takaful Shariah GrowthFund, <strong>MAA</strong> Takaful Shariah Flexi Fund and <strong>MAA</strong> Takafulink Structured Invest Fund)3 QUOTED INVESTMENTS (CONTINUED)EQUITY ALLOCATION – 31 DECEMBER 2012<strong>MAA</strong> TAKAFUL% of NetSHARIAH BALANCED FUND No. of shares Total Cost Market Value Asset ValueUnit RM RM %2012Main MarketINDUSTRIAL PRODUCTSDayang Enterprise Holding Bhd 53,900 127,851 128,282 0.2Lafarge Malayan Cement Bhd 47,300 470,166 455,026 0.7Malaysia Steel Works KL Bhd 190,100 225,996 159,684 0.3Petronas Gas Bhd 91,800 1,435,460 1,791,936 2.9Supermax Corp Bhd 96,900 197,343 187,017 0.3Top Glove Corp Bhd 71,400 372,847 401,982 0.6─────── ─────── ─────── ───────551,400 2,829,663 3,123,927 5.0─────── ─────── ─────── ───────CONSTRUCTIONGamuda Bhd 233,000 828,831 848,120 1.4WCT Bhd 112,355 264,994 264,034 0.4YTL Corp Bhd 127,800 248,949 242,820 0.4─────── ─────── ─────── ───────473,155 1,342,774 1,354,974 2.2─────── ─────── ─────── ───────TRADING/SERVICESAeon Co. M Bhd 36,100 421,013 509,732 0.8Axiata Group Bhd 335,300 1,760,976 2,209,627 3.6Dialog Group Bhd 379,624 857,742 911,098 1.5Petronas Dagangan Bhd 39,700 847,553 932,950 1.5Sapura-Kencana Petroleum Bhd 456,250 980,792 1,437,187 2.3Telekom Malaysia Bhd 337,900 1,947,799 2,040,916 3.3Tenaga Nasional Bhd 451,600 3,089,589 3,134,104 5.1─────── ─────── ─────── ───────2,036,474 9,905,464 11,175,614 18.1─────── ─────── ─────── ───────
36Company No.731996 H<strong>MAA</strong> TAKAFUL BERHAD<strong>MAA</strong> TAKAFUL INVESTMENT - LINKED FUNDS(<strong>MAA</strong> Takaful Shariah Balanced Fund, <strong>MAA</strong> Takaful Shariah Income Fund, <strong>MAA</strong> Takaful Shariah GrowthFund, <strong>MAA</strong> Takaful Shariah Flexi Fund and <strong>MAA</strong> Takafulink Structured Invest Fund)3 QUOTED INVESTMENTS (CONTINUED)EQUITY ALLOCATION – 31 DECEMBER 2012 (CONTINUED)<strong>MAA</strong> TAKAFUL% of NetSHARIAH BALANCED FUND No. of shares Total Cost Market Value Asset ValueUnit RM RM %2012Main Market (continued)INFRASTRUCTURE PROJECT COMPANY (IPC)Digi.com Bhd 358,000 1,560,664 1,893,820 3.1Maxis Bhd 549,700 3,794,397 3,655,505 5.9─────── ─────── ─────── ───────907,700 5,355,061 5,549,325 9.0─────── ─────── ─────── ───────PROPERTIESUEM Land Bhd 130,000 288,936 273,000 0.4─────── ─────── ─────── ───────PLANTATIONGenting Plantations Bhd 48,100 394,639 432,900 0.7IJM Plantations Bhd 34,400 100,121 102,512 0.2IOI Corporation Bhd 104,000 527,491 530,400 0.9Kuala Lumpur Kepong Bhd 77,400 1,677,306 1,857,600 3.0Sime Darby Bhd 499,200 4,541,212 4,752,384 7.6─────── ─────── ─────── ───────763,100 7,240,769 7,675,796 12.4─────── ─────── ─────── ──────FINANCEBIMB Holding Bhd 334,400 791,292 939,664 1.5Syarikat Takaful Malaysia Bhd 153,100 918,357 832,864 1.3─────── ─────── ─────── ───────487,500 1,709,649 1,772,528 2.8─────── ─────── ─────── ──────CONSUMER PRODUCTSFraser & Neave Holding Bhd 35,700 682,863 643,314 1.0─────── ─────── ─────── ───────REITAl-‘Aqar Healthcare RealEstate 268,000 387,453 345,720 0.6─────── ─────── ─────── ───────TOTAL 5,653,029 29,742,632 31,914,198 51.5═══════ ═══════ ═══════ ═══════
37Company No.731996 H<strong>MAA</strong> TAKAFUL BERHAD<strong>MAA</strong> TAKAFUL INVESTMENT - LINKED FUNDS(<strong>MAA</strong> Takaful Shariah Balanced Fund, <strong>MAA</strong> Takaful Shariah Income Fund, <strong>MAA</strong> Takaful Shariah GrowthFund, <strong>MAA</strong> Takaful Shariah Flexi Fund and <strong>MAA</strong> Takafulink Structured Invest Fund)3 QUOTED INVESTMENTS (CONTINUED)EQUITY ALLOCATION – 31 DECEMBER 2012 (CONTINUED)<strong>MAA</strong> TAKAFUL% of NetSHARIAH BALANCED FUND No. of shares Total Cost Market Value Asset ValueUnit RM RM %2011Main MarketINDUSTRIAL PRODUCTSMalaysia Steel Works KL Bhd 323,000 389,950 374,680 0.8Petronas Chemicals Group Bhd 47,000 563,199 714,000 1.5Scomi Group Bhd 341,000 158,291 95,480 0.2Supermax Corp Bhd 149,700 584,880 573,351 1.2Top Glove Corp Bhd 123,000 599,185 615,000 1.3─────── ─────── ─────── ───────983,700 2,295,505 2,372,911 5.0─────── ─────── ─────── ───────CONSTRUCTIONGamuda Bhd 91,000 273,918 308,490 0.7IJM Corporation Bhd 115,000 599,369 649,750 1.4Malaysian Resources Corp Bhd 239,000 438,869 516,240 1.1─────── ─────── ─────── ───────445,000 1,312,156 1,474,480 3.2─────── ─────── ─────── ───────TRADING/SERVICESAirasia Bhd 228,000 686,587 859,560 1.8Axiata Group Bhd 346,000 1,527,246 1,778,440 3.8Bumi Armada Bhd 386,000 1,483,237 1,582,600 3.8Dialog Group Bhd 244,020 524,561 641,773 1.4Kencana Petroleum Bhd 288,000 771,987 855,360 1.8KPJ Healtcare Bhd 105,000 419,100 493,500 1.1MISC Bhd - Local 93,000 783,513 508,710 1.1Perdana Petroleum Bhd 508,000 491,426 398,780 0.9Sapura Crest Petroleum Bhd 157,000 561,256 722,200 1.5Telekom Malaysia Bhd 191,000 728,698 947,360 2.0Tenaga Nasional Bhd 80,000 466,349 472,000 1.0─────── ─────── ─────── ───────2,626,020 8,443,959 9,260,283 20.2─────── ─────── ─────── ───────
38Company No.731996 H<strong>MAA</strong> TAKAFUL BERHAD<strong>MAA</strong> TAKAFUL INVESTMENT - LINKED FUNDS(<strong>MAA</strong> Takaful Shariah Balanced Fund, <strong>MAA</strong> Takaful Shariah Income Fund, <strong>MAA</strong> Takaful Shariah GrowthFund, <strong>MAA</strong> Takaful Shariah Flexi Fund and <strong>MAA</strong> Takafulink Structured Invest Fund)3 QUOTED INVESTMENTS (CONTINUED)EQUITY ALLOCATION – 31 DECEMBER 2012 (CONTINUED)<strong>MAA</strong> TAKAFUL% of NetSHARIAH BALANCED FUND No. of shares Total Cost Market Value Asset ValueUnit RM RM %2011Main Market (continued)INFRASTRUCTURE PROJECT COMPANY (IPC)Digi.com Bhd 204,000 536,097 791,520 1.7Time Dotcom Bhd 571,000 381,328 413,975 0.9─────── ─────── ─────── ───────775,000 917,425 1,205,495 2.6─────── ─────── ─────── ───────PROPERTIESUEM Land Bhd 238,000 457,645 575,960 1.2─────── ─────── ─────── ───────PLANTATIONGenting Plantations Bhd 129,000 950,017 1,109,400 2.4IOI Corporation Bhd 342,066 1,691,937 1,840,315 4.0Kuala Lumpur Kepong Bhd 59,000 1,218,308 1,339,300 2.9Sime Darby Bhd 400,000 3,464,788 3,680,000 7.8─────── ─────── ─────── ───────930,066 7,325,050 7,969,015 17.1─────── ─────── ─────── ──────FINANCEBank Islam Malaysia Bhd 319,000 616,886 647,570 1.2─────── ─────── ─────── ───────CONSUMER PRODUCTSMSM Malaysia Holdings Bhd 118,000 576,806 575,840 1.2Tan Chong Motor 100,000 468,314 408,000 0.8UMW Holding 67,000 473,806 469,000 1.0─────── ─────── ─────── ───────TOTAL 6,601,786 22,887,553 24,958,554 53.4═══════ ═══════ ═══════ ═══════
39Company No.731996 H<strong>MAA</strong> TAKAFUL BERHAD<strong>MAA</strong> TAKAFUL INVESTMENT - LINKED FUNDS(<strong>MAA</strong> Takaful Shariah Balanced Fund, <strong>MAA</strong> Takaful Shariah Income Fund, <strong>MAA</strong> Takaful Shariah GrowthFund, <strong>MAA</strong> Takaful Shariah Flexi Fund and <strong>MAA</strong> Takafulink Structured Invest Fund)3 QUOTED INVESTMENTS (CONTINUED)EQUITY ALLOCATION – 31 DECEMBER 2012 (CONTINUED)<strong>MAA</strong> TAKAFUL% of NetSHARIAH INCOME FUND No. of shares Total Cost Market Value Asset ValueUnit RM RM %2012Main MarketINDUSTRIAL PRODUCTSDayang Enterprise Holding Bhd 13,600 32,260 32,368 0.1Lafarge Malayan Cement Bhd 11,900 118,461 114,478 0.3Petronas Gas Bhd 23,000 422,039 448,960 1.3Supermax Corp Bhd 41,900 86,192 80,867 0.2Top Glove Corp Bhd 18,200 96,271 102,466 0.3─────── ─────── ─────── ───────108,600 755,223 779,139 2.2─────── ─────── ─────── ───────CONSTRUCTIONGamuda Bhd 62,800 223,253 228,592 0.6WCT Bhd 28,750 67,843 67,563 0.2─────── ─────── ─────── ───────91,550 291,096 296,155 0.8─────── ─────── ─────── ───────TRADING/SERVICESAeon Co. M Bhd 9,900 109,586 139,788 0.4Axiata Group Bhd 83,300 480,373 548,947 1.5Dialog Group Bhd 92,900 223,339 222,960 0.6Petronas Dagangan Bhd 9,200 198,006 216,200 0.6Sapura-Kencana Petroleum Bhd 72,034 168,090 226,907 0.6Telekom Malaysia Bhd 75,500 442,173 456,020 1.3Tenaga Nasional Bhd 113,200 782,060 785,608 2.2─────── ─────── ─────── ───────456,034 2,403,627 2,596,430 7.2─────── ─────── ─────── ───────INFRASTRUCTURE PROJECT COMPANY (IPC)Digi.com Bhd 81,000 379,285 428,490 1.2Maxis Bhd 149,500 1,034,639 994,175 2.8─────── ─────── ─────── ───────230,500 1,413,924 1,422,665 4.0─────── ─────── ─────── ───────
40Company No.731996 H<strong>MAA</strong> TAKAFUL BERHAD<strong>MAA</strong> TAKAFUL INVESTMENT - LINKED FUNDS(<strong>MAA</strong> Takaful Shariah Balanced Fund, <strong>MAA</strong> Takaful Shariah Income Fund, <strong>MAA</strong> Takaful Shariah GrowthFund, <strong>MAA</strong> Takaful Shariah Flexi Fund and <strong>MAA</strong> Takafulink Structured Invest Fund)3 QUOTED INVESTMENTS (CONTINUED)EQUITY ALLOCATION – 31 DECEMBER 2012 (CONTINUED)<strong>MAA</strong> TAKAFUL% of NetSHARIAH INCOME FUND No. of shares Total Cost Market Value Asset ValueUnit RM RM %2012Main Market (continued)PROPERTIESUEM Land Bhd 34,000 75,592 71,400 0.2─────── ─────── ─────── ───────PLANTATIONGenting Plantations Bhd 12,300 113,207 110,700 0.3IJM Plantations Bhd 10,400 30,355 30,992 0.1IOI Corporation Bhd 18,600 94,382 94,860 0.3Kuala Lumpur Kepong Bhd 19,400 422,762 465,600 1.3Sime Darby Bhd 125,100 1,138,233 1,190,952 3.3─────── ─────── ─────── ───────185,800 1,798,939 1,893,104 5.3─────── ─────── ─────── ──────FINANCEBIMB Holding Bhd 88,600 255,952 248,966 0.7Syarikat Takaful Malaysia Bhd 51,600 311,563 280,704 0.8─────── ─────── ─────── ───────140,200 567,515 529,670 1.5─────── ─────── ─────── ──────CONSUMER PRODUCTSFraser & Neave Holding Bhd 8,900 171,792 160,378 0.4─────── ─────── ─────── ───────TOTAL 1,255,584 7,477,708 7,748,941 21.6═══════ ═══════ ═══════ ═══════
41Company No.731996 H<strong>MAA</strong> TAKAFUL BERHAD<strong>MAA</strong> TAKAFUL INVESTMENT - LINKED FUNDS(<strong>MAA</strong> Takaful Shariah Balanced Fund, <strong>MAA</strong> Takaful Shariah Income Fund, <strong>MAA</strong> Takaful Shariah GrowthFund, <strong>MAA</strong> Takaful Shariah Flexi Fund and <strong>MAA</strong> Takafulink Structured Invest Fund)3 QUOTED INVESTMENTS (CONTINUED)EQUITY ALLOCATION – 31 DECEMBER 2012 (CONTINUED)<strong>MAA</strong> TAKAFUL% of NetSHARIAH INCOME FUND No. of shares Total Cost Market Value Asset ValueUnit RM RM %2011Main MarketINDUSTRIAL PRODUCTSSupermax Corp Bhd 32,000 107,845 122,560 0.6Top Glove Corp Bhd 41,000 171,085 205,000 1.0─────── ─────── ─────── ───────73,000 278,930 327,560 1.6─────── ─────── ─────── ───────CONSTRUCTIONIJM Corporation Bhd 25,000 141,654 141,250 0.7Malaysian Resources Corp Bhd 63,000 125,276 136,080 0.7─────── ─────── ─────── ───────88,000 266,929 277,330 1.4─────── ─────── ─────── ───────TRADING/SERVICESKencana Petroleum Bhd 90,000 233,992 267,300 1.3KPJ Healtcare Bhd 45,000 189,025 211,500 1.0Sapura Crest Petroleum Bhd 45,000 176,873 207,000 1.0─────── ─────── ─────── ───────180,000 599,890 685,800 3.3─────── ─────── ─────── ───────PLANTATIONGenting Plantations Bhd 16,000 119,387 137,600 0.7IOI Corporation Bhd 41,000 211,029 220,580 1.0Sime Darby Bhd 23,000 204,053 211,600 1.0─────── ─────── ─────── ───────80,000 534,468 569,780 2.7─────── ─────── ─────── ──────FINANCEBank Islam Malaysia Bhd 119,000 245,587 241,570 1.1─────── ─────── ─────── ───────TOTAL 540,000 1,925,805 2,102,040 10.2═══════ ═══════ ═══════ ═══════
42Company No.731996 H<strong>MAA</strong> TAKAFUL BERHAD<strong>MAA</strong> TAKAFUL INVESTMENT - LINKED FUNDS(<strong>MAA</strong> Takaful Shariah Balanced Fund, <strong>MAA</strong> Takaful Shariah Income Fund, <strong>MAA</strong> Takaful Shariah GrowthFund, <strong>MAA</strong> Takaful Shariah Flexi Fund and <strong>MAA</strong> Takafulink Structured Invest Fund)3 QUOTED INVESTMENTS (CONTINUED)EQUITY ALLOCATION – 31 DECEMBER 2012 (CONTINUED)<strong>MAA</strong> TAKAFUL% of NetSHARIAH GROWTH FUND No. of shares Total Cost Market Value Asset ValueUnit RM RM %2012Main Market (continued)INDUSTRIAL PRODUCTSLafarge Malayan Cement Bhd 150,800 1,182,950 1,450,696 1.7Petronas Chemical Group Bhd 265,300 1,746,348 1,697,920 2.0Petronas Gas Bhd 203,100 3,313,203 3,964,512 4.7Top Glove Corp Bhd 143,300 741,317 806,779 1.0─────── ─────── ─────── ───────762,500 6,983,818 7,919,907 9.4─────── ─────── ─────── ───────CONSTRUCTIONGamuda Bhd 634,200 2,326,697 2,308,488 2.7Malaysian Resources Corp Bhd 231,300 408,646 358,515 0.4WCT Bhd 505,655 1,178,174 1,188,289 1.4YTL Corp Bhd 342,300 663,496 650,370 0.8─────── ─────── ─────── ───────1,713,455 4,577,013 4,505,662 5.3─────── ─────── ─────── ───────TRADING/SERVICESAeon Co. M Bhd 131,900 1,437,056 1,862,428 2.2Axiata Group Bhd 1,192,200 6,366,129 7,856,598 9.3Benalec Holding Bhd 1,143,600 1,641,821 1,589,604 1.9Dialog Group Bhd 454,572 1,007,316 1,090,973 1.3KPJ Healthcare Bhd 185,700 912,196 1,065,918 1.3MBM Resources Bhd 117,500 443,637 377,175 0.4Petronas Dagangan Bhd 121,900 2,654,938 2,864,650 3.4Sapura-Kencana Petroleum Bhd 725,280 1,661,861 2,284,632 2.7Telekom Malaysia Bhd 562,500 3,153,206 3,397,500 4.0Tenaga Nasional Bhd 842,200 5,663,393 5,844,868 6.9─────── ─────── ─────── ───────5,477,352 24,941,553 28,234,346 33.4─────── ─────── ─────── ───────
43Company No.731996 H<strong>MAA</strong> TAKAFUL BERHAD<strong>MAA</strong> TAKAFUL INVESTMENT - LINKED FUNDS(<strong>MAA</strong> Takaful Shariah Balanced Fund, <strong>MAA</strong> Takaful Shariah Income Fund, <strong>MAA</strong> Takaful Shariah GrowthFund, <strong>MAA</strong> Takaful Shariah Flexi Fund and <strong>MAA</strong> Takafulink Structured Invest Fund)3 QUOTED INVESTMENTS (CONTINUED)EQUITY ALLOCATION – 31 DECEMBER 2012 (CONTINUED)<strong>MAA</strong> TAKAFUL% of NetSHARIAH GROWTH FUND No. of shares Total Cost Market Value Asset ValueUnit RM RM %2012Main Market (continued)INFRASTRUCTURE PROJECT COMPANY (IPC)Digi.com Bhd 1,433,200 6,276,851 7,581,628 8.9Maxis Bhd 810,100 5,356,045 5,387,165 6.4─────── ─────── ─────── ───────2,243,300 11,632,896 12,968,793 15.3─────── ─────── ─────── ───────PROPERTIESKLCC Property Holding Bhd 217,700 1,187,348 1,371,510 1.6UEM Land Bhd 274,100 560,043 575,610 0.7─────── ─────── ─────── ───────491,800 1,747,391 1,947,120 2.3─────── ─────── ─────── ──────PLANTATIONIOI Corporation Bhd 508,700 2,652,089 2,594,370 3.1Kuala Lumpur Kepong Bhd 91,000 1,942,534 2,184,000 2.6Sime Darby Bhd 751,800 6,886,257 7,157,136 8.4─────── ─────── ─────── ───────1,351,500 11,480,880 11,935,506 14.1─────── ─────── ─────── ──────FINANCEBIMB Holding Bhd 627,000 1,399,734 1,761,870 2.1─────── ─────── ─────── ───────CONSUMER PRODUCTSCocoaland Holding Bhd 165,800 392,728 382,998 0.5Nestle Malaysia Bhd 10,800 722,650 678,672 0.8UMW Holding Bhd 290,100 3,039,630 3,463,794 4.1─────── ─────── ─────── ──────TOTAL 13,133,607 66,918,293 73,798,668 87.3═══════ ═══════ ═══════ ═══════
44Company No.731996 H<strong>MAA</strong> TAKAFUL BERHAD<strong>MAA</strong> TAKAFUL INVESTMENT - LINKED FUNDS(<strong>MAA</strong> Takaful Shariah Balanced Fund, <strong>MAA</strong> Takaful Shariah Income Fund, <strong>MAA</strong> Takaful Shariah GrowthFund, <strong>MAA</strong> Takaful Shariah Flexi Fund and <strong>MAA</strong> Takafulink Structured Invest Fund)3 QUOTED INVESTMENTS (CONTINUED)EQUITY ALLOCATION – 31 DECEMBER 2012 (CONTINUED)<strong>MAA</strong> TAKAFUL% of NetSHARIAH GROWTH FUND No. of shares Total Cost Market Value Asset ValueUnit RM RM %2011Main Market (continued)TRADING/SERVICESAirasia Bhd 515,000 1,610,926 1,941,550 1.8Axiata Group Bhd 721,000 3,184,405 3,705,940 3.8Bumi Armada Bhd 628,000 2,394,743 2,574,800 3.8Dialog Group Bhd 532,060 1,144,755 1,399,318 1.4Kencana Petroleum Bhd 465,070 1,036,091 1,381,258 1.8KPJ Healtcare Bhd 365,000 1,485,936 1,715,500 2.6MISC Bhd - Local 235,000 1,972,757 1,285,450 1.9Perdana Petroleum Bhd 571,000 548,143 448,235 0.7Pos Malaysia Bhd 222,000 722,064 574,980 0.8Sapura Crest Petroleum Bhd 300,000 1,065,565 1,380,000 2.1Telekom Malaysia Bhd 395,000 1,572,218 1,959,200 3.0Tenaga Nasional Bhd 260,000 1,461,667 1,534,000 2.3─────── ─────── ─────── ───────5,209,130 18,199,269 19,900,231 26.0─────── ─────── ─────── ───────INFRASTRUCTURE PROJECT COMPANY (IPC)Digi.com Bhd 360,000 910,322 1,396,800 2.3Time Dotcom Bhd 1,212,000 804,918 878,700 3.1─────── ─────── ─────── ───────1,572,000 1,715,241 2,275,500 5.4─────── ─────── ─────── ───────PROPERTIESUEM Land Bhd 582,000 1,171,131 1,408,440 2.1─────── ─────── ─────── ──────
45Company No.731996 H<strong>MAA</strong> TAKAFUL BERHAD<strong>MAA</strong> TAKAFUL INVESTMENT - LINKED FUNDS(<strong>MAA</strong> Takaful Shariah Balanced Fund, <strong>MAA</strong> Takaful Shariah Income Fund, <strong>MAA</strong> Takaful Shariah GrowthFund, <strong>MAA</strong> Takaful Shariah Flexi Fund and <strong>MAA</strong> Takafulink Structured Invest Fund)3 QUOTED INVESTMENTS (CONTINUED)EQUITY ALLOCATION – 31 DECEMBER 2012 (CONTINUED)<strong>MAA</strong> TAKAFUL% of NetSHARIAH GROWTH FUND No. of shares Total Cost Market Value Asset ValueUnit RM RM %2011Main Market (continued)PLANTATIONGenting Plantations Bhd 262,000 1,932,968 2,253,200 3.4IOI Corporation Bhd 858,000 4,413,338 4,616,040 7.0Kuala Lumpur Kepong Bhd 103,000 2,027,747 2,338,100 3.6Sime Darby Bhd 679,000 5,810,772 6,246,800 9.5─────── ─────── ─────── ───────1,902,000 14,184,826 15,454,140 23.5─────── ─────── ─────── ──────FINANCEBank Islam Malaysia Bhd 719,000 1,410,333 1,459,570 2.2─────── ─────── ─────── ───────CONSUMER PRODUCTSMSM Malaysia Holdings Bhd 460,000 2,267,611 2,244,800 3.4Tan Chong Motor 105,000 490,493 428,400 0.7UMW Holding 98,000 694,901 686,000 1.0─────── ─────── ─────── ───────TOTAL 13,240,130 48,606,585 53,153,281 81.25═══════ ═══════ ═══════ ═══════
46Company No.731996 H<strong>MAA</strong> TAKAFUL BERHAD<strong>MAA</strong> TAKAFUL INVESTMENT - LINKED FUNDS(<strong>MAA</strong> Takaful Shariah Balanced Fund, <strong>MAA</strong> Takaful Shariah Income Fund, <strong>MAA</strong> Takaful Shariah GrowthFund, <strong>MAA</strong> Takaful Shariah Flexi Fund and <strong>MAA</strong> Takafulink Structured Invest Fund)3 QUOTED INVESTMENTS (CONTINUED)EQUITY ALLOCATION – 31 DECEMBER 2012 (CONTINUED)<strong>MAA</strong> TAKAFUL% of NetSHARIAH FLEXI FUND No. of shares Total Cost Market Value Asset ValueUnit RM RM %2012Main MarketINDUSTRIAL PRODUCTSDayang Enterprise Holding Bhd 27,300 64,756 64,974 0.3Lafarge Malayan Cement Bhd 24,600 244,457 236,652 1.0Petronas Gas Bhd 44,700 730,146 872,544 3.7Supermax Corp Bhd 50,100 105,585 96,693 0.4Top Glove Corp Bhd 46,900 247,828 264,047 1.1─────── ─────── ─────── ───────193,600 1,392,772 1,534,910 6.5─────── ─────── ─────── ───────CONSTRUCTIONGamuda Bhd 115,700 411,650 421,148 1.8WCT Bhd 58,305 137,561 137,017 0.6YTL Corp Bhd 76,800 149,497 145,920 0.6─────── ─────── ─────── ───────250,805 698,708 704,085 3.0─────── ─────── ─────── ───────TRADING/SERVICESAeon Co. M Bhd 26,000 300,930 367,120 1.5Axiata Group Bhd 179,600 978,572 1,183,564 5.0Dialog Group Bhd 233,800 550,688 561,120 2.4Petronas Dagangan Bhd 20,700 443,732 486,450 2.1Sapura-Kencana Petroleum Bhd 181,739 371,500 572,478 2.4Telekom Malaysia Bhd 172,700 994,107 1,043,108 4.4Tenaga Nasional Bhd 264,000 1,821,728 1,832,160 7.7─────── ─────── ─────── ───────1,078,539 5,461,257 6,046,000 25.5─────── ─────── ─────── ───────INFRASTRUCTURE PROJECT COMPANY (IPC)Digi.com Bhd 190,900 839,437 1,009,861 4.3Maxis Bhd 310,300 2,129,475 2,063,495 8.7─────── ─────── ─────── ───────501,200 2,968,912 3,073,356 13.0─────── ─────── ─────── ───────
47Company No.731996 H<strong>MAA</strong> TAKAFUL BERHAD<strong>MAA</strong> TAKAFUL INVESTMENT - LINKED FUNDS(<strong>MAA</strong> Takaful Shariah Balanced Fund, <strong>MAA</strong> Takaful Shariah Income Fund, <strong>MAA</strong> Takaful Shariah GrowthFund, <strong>MAA</strong> Takaful Shariah Flexi Fund and <strong>MAA</strong> Takafulink Structured Invest Fund)3 QUOTED INVESTMENTS (CONTINUED)EQUITY ALLOCATION – 31 DECEMBER 2012 (CONTINUED)<strong>MAA</strong> TAKAFUL% of NetSHARIAH FLEXI FUND No. of shares Total Cost Market Value Asset ValueUnit RM RM %2012Main Market (continued)PROPERTIESUEM Land Bhd 68,000 151,182 142,800 0.6─────── ─────── ─────── ───────PLANTATIONGenting Plantations Bhd 24,700 207,151 222,300 0.9IJM Plantations Bhd 19,100 55,591 56,918 0.2IOI Corporation Bhd 54,500 276,470 277,950 1.2Kuala Lumpur Kepong Bhd 41,500 901,944 996,000 4.2Sime Darby Bhd 236,300 2,141,507 2,249,576 9.5─────── ─────── ─────── ───────376,100 3,582,663 3,802,744 16.0─────── ─────── ─────── ──────FINANCEBIMB Holding Bhd 169,800 396,987 477,138 2.0Syarikat Takaful Malaysia Bhd 79,000 471,076 429,760 1.8─────── ─────── ─────── ───────248,800 868,063 906,898 3.8─────── ─────── ─────── ──────CONSUMER PRODUCTSFraser & Neave Holding Bhd 19,200 365,858 345,984 1.5─────── ─────── ─────── ───────REITAl-‘Aqar Healthcare RealEstate 132,300 191,303 170,667 0.7─────── ─────── ─────── ───────TOTAL 2,868,544 15,680,718 16,727,444 70.6═══════ ═══════ ═══════ ═══════
48Company No.731996 H<strong>MAA</strong> TAKAFUL BERHAD<strong>MAA</strong> TAKAFUL INVESTMENT - LINKED FUNDS(<strong>MAA</strong> Takaful Shariah Balanced Fund, <strong>MAA</strong> Takaful Shariah Income Fund, <strong>MAA</strong> Takaful Shariah GrowthFund, <strong>MAA</strong> Takaful Shariah Flexi Fund and <strong>MAA</strong> Takafulink Structured Invest Fund)3 QUOTED INVESTMENTS (CONTINUED)EQUITY ALLOCATION – 31 DECEMBER 2012 (CONTINUED)<strong>MAA</strong> TAKAFUL% of NetSHARIAH FLEXI FUND No. of shares Total Cost Market Value Asset ValueUnit RM RM %2011Main MarketINDUSTRIAL PRODUCTSCoastal Contract 70,033 136,557 135,164 0.7Lafarge Malayan Cement Bhd 26,000 191,750 182,000 1.0Petronas Chemicals Group Bhd 22,000 275,096 334,400 1.8─────── ─────── ─────── ───────118,033 603,403 651,564 3.5─────── ─────── ─────── ───────CONSTRUCTIONGamuda Bhd 47,000 149,914 159,330 0.9IJM Corporation Bhd 87,000 466,597 491,550 3.0Malaysian Resources Corp Bhd 137,000 257,845 295,920 1.7─────── ─────── ─────── ───────271,000 874,356 946,800 5.6─────── ─────── ─────── ───────TRADING/SERVICESAirasia Bhd 117,000 371,351 441,090 2.4Axiata Group Bhd 169,000 810,041 868,660 4.9Bumi Armada Bhd 171,000 637,250 701,100 3.9Dialog Group Bhd 138,000 318,354 362,940 2.0Kencana Petroleum Bhd 126,000 320,764 374,220 2.1KPJ Healtcare Bhd 115,000 481,996 540,500 3.5MISC Bhd - Local 51,000 412,346 278,970 1.5Perdana Petroleum Bhd 149,000 143,241 116,965 0.7Pos Malaysia Bhd 45,000 151,014 116,550 0.7Sapura Crest Petroleum Bhd 80,000 314,304 368,000 2.0Telekom Malaysia Bhd 111,000 460,194 550,560 3.1Tenaga Nasional Bhd 62,000 340,741 365,800 2.0─────── ─────── ─────── ───────1,334,000 4,761,596 5,085,335 28.8─────── ─────── ─────── ───────INFRASTRUCTURE PROJECT COMPANY (IPC)Digi.com Bhd 81,000 240,062 314,280 1.7Time Dotcom Bhd 241,000 160,339 174,725 1.0─────── ─────── ─────── ───────322,000 400,401 489,005 2.7─────── ─────── ─────── ───────
49Company No.731996 H<strong>MAA</strong> TAKAFUL BERHAD<strong>MAA</strong> TAKAFUL INVESTMENT - LINKED FUNDS(<strong>MAA</strong> Takaful Shariah Balanced Fund, <strong>MAA</strong> Takaful Shariah Income Fund, <strong>MAA</strong> Takaful Shariah GrowthFund, <strong>MAA</strong> Takaful Shariah Flexi Fund and <strong>MAA</strong> Takafulink Structured Invest Fund)3 QUOTED INVESTMENTS (CONTINUED)EQUITY ALLOCATION – 31 DECEMBER 2012 (CONTINUED)<strong>MAA</strong> TAKAFUL% of NetSHARIAH FLEXI FUND No. of shares Total Cost Market Value Asset ValueUnit RM RM %2011Main Market (continued)PROPERTIESUEM Land Bhd 159,000 317,130 384,780 2.1─────── ─────── ─────── ───────PLANTATIONGenting Plantations Bhd 68,000 517,237 584,800 3.3IOI Corporation Bhd 229,000 1,177,237 1,232,020 7.0Kuala Lumpur Kepong Bhd 37,000 784,460 839,900 4.7Sime Darby Bhd 187,000 1,614,532 1,720,400 9.7─────── ─────── ─────── ───────521,000 4,093,466 4,377,120 24.7─────── ─────── ─────── ──────FINANCEBank Islam Malaysia Bhd 189,000 371,471 383,670 2.2─────── ─────── ─────── ───────CONSUMER PRODUCTSMSM Malaysia Holdings Bhd 113,000 552,944 551,400 3.1Tan Chong Motor 55,000 256,107 224,400 1.2UMW Holding 53,000 378,687 371,000 2.1─────── ─────── ─────── ───────TOTAL 3,135,033 12,609,561 13,465,134 76.0═══════ ═══════ ═══════ ═══════
Company No.731996 H<strong>MAA</strong> TAKAFUL BERHAD<strong>MAA</strong> TAKAFUL INVESTMENT - LINKED FUNDS(<strong>MAA</strong> Takaful Shariah Balanced Fund, <strong>MAA</strong> Takaful Shariah Income Fund, <strong>MAA</strong> Takaful Shariah Growth Fund, <strong>MAA</strong> Takaful Shariah Flexi Fund and <strong>MAA</strong>Takafulink Structured Invest Fund)NOTES TO THE FINANCIAL STATEMENTS - 31 DECEMBER 2012 (CONTINUED)4 UNQUOTED INVESTMENTS (CONTINUED)2012Balanced Fund Income FundMarket MarketCost value Cost valueRM RM RMIslamic debt securitiesSectorConglomerate - - 2,015,860 2,069,400Port - - 1,013,810 1,096,800Financial Service 1,000,000 1,035,200 - -Plantation 4,006,200 4,003,000 3,000,000 3,016,900Power 6,210,900 6,384,100 3,243,400 3,253,100Technology - - 3,128,400 3,188,400Telecommunications 1,012,230 1,022,600 - -Toll Roads/Ports 2,069,950 2,123,500 11,593,300 11,955,850Real Estate 2,000,000 2,003,000 - -──────── ──────── ──────── ────────16,299,280 16,571,400 23,994,770 24,580,450──────── ──────── ──────── ────────50
Company No.731996 H<strong>MAA</strong> TAKAFUL BERHAD<strong>MAA</strong> TAKAFUL INVESTMENT - LINKED FUNDS(<strong>MAA</strong> Takaful Shariah Balanced Fund, <strong>MAA</strong> Takaful Shariah Income Fund, <strong>MAA</strong> Takaful Shariah Growth Fund, <strong>MAA</strong> Takaful Shariah Flexi Fund and <strong>MAA</strong>Takafulink Structured Invest Fund)NOTES TO THE FINANCIAL STATEMENTS - 31 DECEMBER 2012 (CONTINUED)4 UNQUOTED INVESTMENTS2012Balanced Fund Income FundMarket MarketCost value Cost valueRM RM RMIslamic debt securitiesAt cost 16,299,280 16,299,280 23,994,770 23,994,770(Amortisation ofpremiums)/accretionof discounts net (65,222) - (170,979)Net unrealisedcapital gain 337,342 - 756,659──────── ──────── ──────── ────────16,299,280 16,571,400 23,994,770 24,580,450════════ ════════ ════════ ════════51
Company No.731996 H<strong>MAA</strong> TAKAFUL BERHAD<strong>MAA</strong> TAKAFUL INVESTMENT - LINKED FUNDS(<strong>MAA</strong> Takaful Shariah Balanced Fund, <strong>MAA</strong> Takaful Shariah Income Fund, <strong>MAA</strong> Takaful Shariah Growth Fund, <strong>MAA</strong> Takaful Shariah Flexi Fund and <strong>MAA</strong>Takafulink Structured Invest Fund)NOTES TO THE FINANCIAL STATEMENTS - 31 DECEMBER 2012 (CONTINUED)4 UNQUOTED INVESTMENTS (CONTINUED)2011Balanced Fund Income FundMarket MarketCost value Cost valueRM RM RM RMIslamic debt securitiesSectorAsset-backed Securities (ABS) - - 1,084,300 1,076,300Banks - - 1,029,900 1,029,800Oil and Gas - - 974,400 980,600Port - - 1,013,810 1,071,100Construction 1,031,800 1,037300 - -Financial Service 1,000,000 1,030,000 1,000,000 1,030,000Plantation 2,005,560 2,025,200 1,002,780 1,012,600Power 4,212,400 4,278,700 4,339,100 4,410,400Telecommunications 1,012,230 1,010,300 - -Toll Roads/Ports 3,019,400 3,097,000 5,943,200 6,044,250──────── ──────── ──────── ────────12,281,390 12,478,500 16,387,490 16,655,050──────── ──────── ──────── ────────52
Company No.731996 H<strong>MAA</strong> TAKAFUL BERHAD<strong>MAA</strong> TAKAFUL INVESTMENT - LINKED FUNDS(<strong>MAA</strong> Takaful Shariah Balanced Fund, <strong>MAA</strong> Takaful Shariah Income Fund, <strong>MAA</strong> Takaful Shariah Growth Fund, <strong>MAA</strong> Takaful Shariah Flexi Fund and <strong>MAA</strong>Takafulink Structured Invest Fund)NOTES TO THE FINANCIAL STATEMENTS - 31 DECEMBER 2012 (CONTINUED)4 UNQUOTED INVESTMENTS (CONTINUED)2011Balanced Fund Income FundMarket MarketCost value Cost valueRM RM RM RMIslamic debt securitiesAt cost 12,281,390 12,281,390 16,387,490 16,387,490(Amortisation ofpremiums)/accretionof discounts net (64,725) - (125,167)Net unrealisedcapital gain 261,834 - 392,727──────── ──────── ──────── ────────12,281,390 12,478,500 16,387,490 16,655,050════════ ════════ ════════ ════════53
Company No.731996 H<strong>MAA</strong> TAKAFUL BERHAD<strong>MAA</strong> TAKAFUL INVESTMENT - LINKED FUNDS(<strong>MAA</strong> Takaful Shariah Balanced Fund, <strong>MAA</strong> Takaful Shariah Income Fund, <strong>MAA</strong> Takaful Shariah Growth Fund, <strong>MAA</strong> Takaful Shariah Flexi Fund and<strong>MAA</strong> Takafulink Structured Invest Fund)NOTES TO THE FINANCIAL STATEMENTS - 31 DECEMBER 2012 (CONTINUED)4 UNQUOTED INVESTMENTS (CONTINUED)The following funds did not hold any investments in unquoted investment as at 31 December 2012 (2011:NIL)• <strong>MAA</strong> Takaful Shariah Growth Fund• <strong>MAA</strong> Takaful Shariah Flexi Fund• <strong>MAA</strong> Takafulink Structured Invest Fund54
55Company No.731996 H<strong>MAA</strong> TAKAFUL BERHAD<strong>MAA</strong> TAKAFUL INVESTMENT - LINKED FUNDS(<strong>MAA</strong> Takaful Shariah Balanced Fund, <strong>MAA</strong> Takaful Shariah Income Fund, <strong>MAA</strong> Takaful Shariah GrowthFund, <strong>MAA</strong> Takaful Shariah Flexi Fund and <strong>MAA</strong> Takafulink Structured Invest Fund)4 UNQUOTED INVESTMENTSISLAMIC DEBT ALLOCATION – 31 DECEMBER 2012<strong>MAA</strong> TAKAFUL% of NetSHARIAH BALANCED FUND No. of shares Total Cost Market Value Asset ValueUnit RM RM %2012FINANCIAL SERVICEGulf Investment Corporation 1,000,000 1,000,000 1,035,200 1.7─────── ─────── ─────── ───────PLANTATIONGolden Asset Intl Fin Ltd 2,000,000 2,006,200 2,007,800 3.3Kuala Lumpur Kepong Bhd 2,000,000 2,000,000 1,995,200 3.3─────── ─────── ─────── ───────4,000,000 4,006,200 4,003,000 6.6─────── ─────── ─────── ──────POWERJimah Energy Ventures Sdn Bhd 1,000,000 1,089,200 1,071,900 1.8Manjung Island Energy 1,000,000 1,004,900 1,049,100 1.7Ranhill Powertron Sdn Bhd 1,000,000 1,022,600 1,072,700 1.7Tanjung Bin Energy Issuer Bhd 2,000,000 2,086,200 2,171,800 3.6TAQA Abu Dhab National Energy 1,000,000 1,008,000 1,018,600 1.7─────── ─────── ─────── ───────6,000,000 6,210,900 6,384,100 10.5─────── ─────── ─────── ──────TELECOMMUNICATIONSTelekom Malaysia 1,000,000 1,012,230 1,022,600 1.7─────── ─────── ─────── ───────TOLL ROADAnih Bhd 1,000,000 1,062,500 1,100,700 1.8Projek Lebuhraya Usahasama Bhd 500,000 503,400 510,500 0.8Projek Lebuhraya Usahasama Bhd 500,000 504,050 512,750 0.9─────── ─────── ─────── ───────2,000,000 2,069,950 2,123,500 3.5REAL ESTATEAman Sukuk Bhd 1,000,000 1,000,000 991,400 1.6Aman Sukuk Bhd 1,000,000 1,000,000 1,011,600 1.7─────── ─────── ─────── ───────TOTAL 16,000,000 16,299,280 16,571,400 27.3═══════ ═══════ ═══════ ═══════
56Company No.731996 H<strong>MAA</strong> TAKAFUL BERHAD<strong>MAA</strong> TAKAFUL INVESTMENT - LINKED FUNDS(<strong>MAA</strong> Takaful Shariah Balanced Fund, <strong>MAA</strong> Takaful Shariah Income Fund, <strong>MAA</strong> Takaful Shariah GrowthFund, <strong>MAA</strong> Takaful Shariah Flexi Fund and <strong>MAA</strong> Takafulink Structured Invest Fund)4 UNQUOTED INVESTMENTS (CONTINUED)ISLAMIC DEBT ALLOCATION – 31 DECEMBER 2012 (CONTINUED)<strong>MAA</strong> TAKAFUL% of NetSHARIAH BALANCED FUND No. of shares Total Cost Market Value Asset ValueUnit RM RM %2011CONSTRUCTIONGamuda Bhd 1,000,000 1,031,800 1,037,300 2.9─────── ─────── ─────── ───────FINANCIAL SERVICEGulf Investment Corporation 1,000,000 1,000,000 1,030,000 3.6─────── ─────── ─────── ───────PLANTATIONPadiberas Nasional Bhd 2,000,000 2,005,560 2,025,200 1.9─────── ─────── ─────── ───────POWERJimah Energy Ventures Sdn Bhd 1,000,000 1,089,200 1,105,500 2.5Manjung Island Energy 1,000,000 1,004,900 1,008,600 12.2Ranhill Powertron Sdn Bhd 1,000,000 1,022,600 1,056,700 8.7Ranhill Powertron Sdn Bhd 1,000,000 1,095,700 1,107,900 3.1─────── ─────── ─────── ───────4,000,000 4,212,400 4,278,700 26.5─────── ─────── ─────── ──────TELECOMMUNICATIONSTelekom Malaysia 1,000,000 1,012,230 1,010,300 7.8─────── ─────── ─────── ───────TOLL ROADAnih Bhd 1,000,000 1,010,100 1,022,400 5.8Konsortium Lebuhraya 1,000,000 946,500 1,000,000 3.2Lingkaran Trans Kota 1,000,000 1,062,800 1,074,600 5.9─────── ─────── ─────── ───────TOTAL 12,000,000 12,281,390 12,478,500 57.6═══════ ═══════ ═══════ ═══════
57Company No.731996 H<strong>MAA</strong> TAKAFUL BERHAD<strong>MAA</strong> TAKAFUL INVESTMENT - LINKED FUNDS(<strong>MAA</strong> Takaful Shariah Balanced Fund, <strong>MAA</strong> Takaful Shariah Income Fund, <strong>MAA</strong> Takaful Shariah GrowthFund, <strong>MAA</strong> Takaful Shariah Flexi Fund and <strong>MAA</strong> Takafulink Structured Invest Fund)4 UNQUOTED INVESTMENTS (CONTINUED)ISLAMIC DEBT ALLOCATION – 31 DECEMBER 2012 (CONTINUED)<strong>MAA</strong> TAKAFUL% of NetSHARIAH INCOME FUND No. of shares Total Cost Market Value Asset ValueUnit RM RM %2012CONGLOMERATEUnited Growth Bhd 2,000,000 2,015,860 2,069,400 5.8─────── ─────── ─────── ───────PORTSWestports Malaysia Sdn Bhd 1,000,000 1,013,810 1,096,800 3.1─────── ─────── ─────── ───────PLANTATIONFirst Resources Ltd 2,000,000 2,000,000 2,006,200 5.6First Resources Ltd 1,000,000 1,000,000 1,010,700 2.9─────── ─────── ─────── ───────3,000,000 3,000,000 3,016,900 8.5─────── ─────── ─────── ──────POWERJimah Energy Ventures Sdn Bhd 1,000,000 1,100,100 1,071,900 3.0Jimah Energy Ventures Sdn Bhd 1,000,000 1,120,700 1,108,500 3.1Ranhill Powertron Sdn Bhd 1,000,000 1,022,600 1,072,700 3.0─────── ─────── ─────── ───────3,000,000 3,243,400 3,253,100 9.1─────── ─────── ─────── ──────TECHNOLOGYEncorp Systembilt Sdn Bhd 3,000,000 3,128,400 3,188,400 8.9─────── ─────── ─────── ───────
58Company No.731996 H<strong>MAA</strong> TAKAFUL BERHAD<strong>MAA</strong> TAKAFUL INVESTMENT - LINKED FUNDS(<strong>MAA</strong> Takaful Shariah Balanced Fund, <strong>MAA</strong> Takaful Shariah Income Fund, <strong>MAA</strong> Takaful Shariah GrowthFund, <strong>MAA</strong> Takaful Shariah Flexi Fund and <strong>MAA</strong> Takafulink Structured Invest Fund)4 UNQUOTED INVESTMENTS (CONTINUED)ISLAMIC DEBT ALLOCATION – 31 DECEMBER 2012 (CONTINUED)<strong>MAA</strong> TAKAFUL% of NetSHARIAH INCOME FUND No. of shares Total Cost Market Value Asset ValueUnit RM RM %2012TOLL ROADAnih Bhd 1,000,000 1,020,200 1,107,700 3.1Anih Bhd 6,000,000 6,627,300 6,817,800 19.1Konsortium Lebuhraya 1,000,000 1,237,300 1,286,700 3.6Konsortium Lebuhraya 500,000 593,800 602,850 1.7Maju Expressway Sdn Bhd 1,000,000 1,106,600 1,115,300 3.1Projek Lebuhraya Usahasama Bhd 1,000,000 1,008,100 1,025,500 2.9─────── ─────── ─────── ───────TOTAL 22,500,000 23,994,770 24,580,450 68.9═══════ ═══════ ═══════ ═══════2011ASSET-BACKED SECURITIES (ABS)RH Capital Sdn Bhd 1,000,000 1,084,300 1,076,300 2.7─────── ─────── ─────── ───────BANKSNational Bank Of Abu Dhabi 1,000,000 1,029,900 1,029,800 3.2─────── ─────── ─────── ───────OIL & GASKencana Petroleum Bhd 1,000,000 974,400 980,600 4.1─────── ─────── ─────── ───────PORTSWestports Malaysia Sdn Bhd 1,000,000 1,013,810 1,071,100 9.57─────── ─────── ─────── ───────FINANCIAL SERVICEGulf Investment Corporation 1,000,000 1,000,000 1,030,000 3.6─────── ─────── ─────── ───────PLANTATIONPadiberas Nasional Bhd 1,000,000 1,002,780 1,012,600 1.9─────── ─────── ─────── ───────
59Company No.731996 H<strong>MAA</strong> TAKAFUL BERHAD<strong>MAA</strong> TAKAFUL INVESTMENT - LINKED FUNDS(<strong>MAA</strong> Takaful Shariah Balanced Fund, <strong>MAA</strong> Takaful Shariah Income Fund, <strong>MAA</strong> Takaful Shariah GrowthFund, <strong>MAA</strong> Takaful Shariah Flexi Fund and <strong>MAA</strong> Takafulink Structured Invest Fund)4 UNQUOTED INVESTMENTS (CONTINUED)ISLAMIC DEBT ALLOCATION – 31 DECEMBER 2012 (CONTINUED)<strong>MAA</strong> TAKAFUL% of NetSHARIAH INCOME FUND No. of shares Total Cost Market Value Asset ValueUnit RM RM %2011POWERJimah Energy Ventures Sdn Bhd 1,000,000 1,100,100 1,105,500 2.5Jimah Energy Ventures Sdn Bhd 1,000,000 1,120,700 1,140,300 3.3Ranhill Powertron Sdn Bhd 1,000,000 1,022,600 1,056,700 8.6Ranhill Powertron Sdn Bhd 1,000,000 1,095,700 1,107,900 3.1─────── ─────── ─────── ───────4,000,000 4,339,100 4,410,400 17.5─────── ─────── ─────── ──────2011TOLL ROADAnih Bhd 1,000,000 1,020,200 1,032,500 10.0Anih Bhd 1,000,000 1,038,800 1,047,700 10.9Konsortium Lebuhraya 1,000,000 1,237,300 1,259,700 10.3Konsortium Lebuhraya 500,000 593,800 594,750 8.8Konsortium Lebuhraya 1,000,000 946,500 1,000,000 3.2Maju Expressway Sdn Bhd 1,000,000 1,106,600 1,109,600 6.1─────── ─────── ─────── ───────TOTAL 15,500,000 16,387,490 16,655,050 81.53═══════ ═══════ ═══════ ═══════