2009 AAMI Crash Index
2009 AAMI Crash Index
2009 AAMI Crash Index
- No tags were found...

Create successful ePaper yourself
Turn your PDF publications into a flip-book with our unique Google optimized e-Paper software.
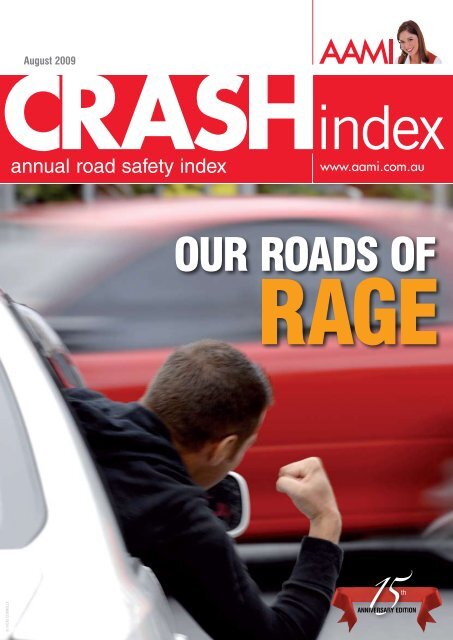
The <strong>2009</strong> <strong>AAMI</strong> <strong>Crash</strong> <strong>Index</strong> is the 15th annual road safety index published by <strong>AAMI</strong> toeducate and inform drivers about collisions and why they happen. Over time, the <strong>Index</strong> hasevolved to consider the many factors that contribute to crashes, particularly inattention,speed, alcohol and fatigue, which statistics show cause most crashes.In addition to analysing the role of these factors in crashes, the <strong>2009</strong> <strong>AAMI</strong> <strong>Crash</strong> <strong>Index</strong>looks at how aggression leads to dangerous driving – a factor in many collisions thatresult in injury or death.<strong>Crash</strong>es – more likelythan not for driversInvolvement in a crash – either as adriver or a passenger – is somethingmost Australians have experienced.Four in five (80 per cent) have had acrash in their lifetime, with WesternAustralians the most likely of all(86 per cent), followed by ACT (85 percent), New South Wales (83 per cent)and Northern Territory (80 per cent)drivers.South Australians are least likely tohave experienced a crash (72 per cent),slightly less than Tasmanian (74 percent), Queensland (77 per cent) andVictorian drivers (79 per cent).Inattention causes most crashesNot paying attention is still the majorfactor in most car crashes. Almosthalf of all drivers nationally (48 percent) attributed previous crashesto inattention.ACT drivers are most likely to blameinattention for crashes (55 per cent)followed by Northern Territory (53 percent), South Australian (52 per cent)and New South Wales and Victoriandrivers (49 per cent). Tasmanian driversare least likely to blame inattention forcrashes they have had (41 per cent).Lead feet play a partSpeed is a factor in crashes for 15 percent of drivers nationally. However,Western Australia, with its thousandsof kilometres of open roads, is hometo more drivers who blame speed fortheir crashes (23 per cent). Queenslandcomes a close second with 18 per centof the state’s drivers attributing crashesto speed, followed by South Australia80%of drivershave hada crashin theirlifetime(18 per cent), Tasmania (17 per cent)and the Northern Territory (16 per cent).Victorian drivers are least likely to blamespeed for crashes (12 per cent),just ahead of ACT (13 per cent) andNew South Wales drivers (14 per cent).Drowsy drivers continue to crashFor one in 10 drivers nationally,drowsiness has been a factor in crashesthey have had. For them, getting to theirdestination faster far outweighs thecommon sense of taking a break andarriving safely.Victorian and Northern Territory driversare most likely to blame fatigue forcrashes they have had (11 per cent),followed by Queensland and NewSouth Wales drivers (10 per cent). ACTdrivers are least likely to have crashedbecause of fatigue (six per cent), justahead of South Australians (seven percent), Tasmanians (eight per cent) andWestern Australians (nine per cent).Key national findings■ Most Australians (80 per cent) have experienced a car crash as a driver orpassenger in their lifetime.■ Drivers are more likely to blame not paying attention for crashes they havehad (48 per cent) than they are speeding (15 per cent), fatigue (10 per cent)and alcohol (eight per cent).■ Speeding is the norm – just 16 per cent of drivers say they never speed.■ Drivers increasingly say travelling just over the speed limit isn’t reallyspeeding (29 per cent). Many are confused about the limit (33 per cent)because of the abundance of varying speed zones.■ Knowingly driving while over .05 is something one-third of drivers nationally(33 per cent) have done – despite alcohol being a factor in eight per cent ofcrashes.■ Three in five drivers worry about being the victim of a road rage attack.Of these, 17 per cent worry ‘a lot’.Driven to drinkWhile declining, alcohol remains afactor in far too many crashes. One in12 drivers nationally (eight per cent)say alcohol was a factor in a crash theyhave had.Alcohol appears to be a considerableproblem for Northern Territory drivers,15 per cent of whom blame alcoholfor crashes they have had. This isfollowed by Queensland and SouthAustralian drivers (10 per cent),Victorian and Western Australian drivers(nine per cent), and Tasmanian drivers(eight per cent).ACT drivers are least likely to have hada crash involving alcohol (five per cent),
<strong>Crash</strong> claim by day of weekHow crashes happenHow crashes happenCollision with a pole/tree/fence/building 14%Hit in rear 28%Damaged while parked 15%Hit animal 3%Failure to yield right of way 21%Hit parked car 4%Loss of control 3%Claims incidence rate by state <strong>2009</strong>Reversing collision 12%Source: 2008 <strong>AAMI</strong> Claims Data33%country saying they don’t speed to avoidlosing points. The exception to this isDespite one-third of drivers admittingto driving when their blood alcoholcent). Northern Territory and WesternAustralian drivers were most likely toNew South Wales where double demerit content was probably over .05,admit to have driven after using illicit drugs (14How crashes VICdrivinghappen NSW QLDwhen per cent) SA followed TAS by Queensland NT and WApoint losses are a probable factor inremarkably few have received a penaltyfor drink-driving. Just one per cent of they were ACT drivers (10 per cent).15 per cent of drivers observing speedprobably Collision pole/tree/fence/building 14%Claims incidence rate by state <strong>2009</strong> drivers have received a drink-drivinglimits to avoid losing points.over .05 Insured hitNewin rearSouth15%Wales drivers were leastinfringement in the last two years,likely to drive when they were probablywith Tasmanian drivers three timesover <strong>Crash</strong> .05 claims and by drivers monthfrom SouthHigh speed causesDamaged whilst parked – TP known 8%higher than the national average toAustralia were least likely to drive aftermost infringementshave been penalised for this offenceDamagedusingwhilstillicitparkeddrugs.– TP unknown 7%Speeding remains one of the main (three per cent).Hit animalFailure to Prescription yield right of way for – trouble insured 9%reasons drivers are issued withinfringement notices, with one-quarterDrugs + alcohol + drivingFailure to yield right of way – third party 11%Taking prescription drugs and driving= poor combinationLoss of control(23 per cent) penalised for speeding inhas come3%under the spotlight with moreStruck while people stationery using prescribed 1%VIC NSW QLD SA TAS medication forthe last two years. Western Australians DespiteNTgovernmentsWAand motoringStruck TP ongoing while IO conditions. reversing Many 8% of these drugsare more likely than drivers in other authorities spending millions of dollarsJAN FEB Hit MARparked APRhaveMAY car side 3% JUNeffects JULthatAUGimpairSEPT OCTdrivingNOV DECstates to have been fined for speedingwarning drivers about the dangers ofThird party ability alleged so it cause is concerning of accident that onefifthof drivers nationally (21 per cent)1%mixing driving with substance abuse,(31 per cent) with ACT drivers the least<strong>Crash</strong> claims by month many openly admit to driving afterThird party reversed into insured 4%likely (16 per cent).admit to driving after taking prescriptionusing drugs and alcohol. One-thirdmedications that carry warnings againstRed lights and stop signs were a admit driving when they were probably<strong>Crash</strong> operating claims a by motor time of vehicle. dayproblem for five per cent of drivers over .05 and nine per cent say theynationally who were fined for failing have driven after using marijuana,Drivers in Western Australia faredworst on this measure with 26 perto stop in the last two years. Victorian speed or cocaine.AMPMdonecent admitting to driving after usingdrivers are most prone to running red Northern Territory drivers were mostprescription drugs. Queensland andlights and stop signs with eight per likely to have driven despite being overSouth Australia were a close secondHow crashes happencent fined for this. Tasmanian and ACT .05 (45 per cent) followed by those(25 per cent), followed by drivers inJAN FEB MAR APR MAY JUN JUL AUG SEPT OCT NOV DECdrivers are least likely to have received in Western Australia and the ACT (43Collision pole/tree/fence/building Victoria (21 per cent) 14% and New Southa penalty for this.per cent) and South Australia (36 perInsured hit in Wales rear 15% (18 per cent).12.7%7.6%<strong>Crash</strong> claims by time of day4.1%MIDNIGHT– 4 am8.3%14%8.4%AM6.5%4 am– 8 am8.3%12.4%8.7%<strong>Crash</strong> claims by time of day25.1%8 am– MIDDAY8.1%12.6%8.5%28.9%10.7%8.4%MIDDAY– 4 pm8%PM27.8%14.7%8.5%4 pm– 8 pm8.3%13.3%8.9%7.5%8 pm– MIDNIGHTdone12.7%7.6%4.1%13.8%8.3%14%8.4%6.5%8.3%12.4%8.7%25.1%Third party hit in rear 12%MIDNIGHT 4 am 8 am MIDDAY 4 pm– 4 am Damaged – 8 whilst – MIDDAY parked – – TP 4 pmknown – 8% 8 pmDamaged whilst parked – TP unknown 7%crash claims by day of weekHit animal <strong>Crash</strong> claim by day of weekFailure to yield right of way – insured 9%Failure to yield right of way – third party 11%Loss of control 3%Struck while stationery 1%Struck TP while IO reversing 8%8.1%12.6%8.5%28.9%10.7%8.4%8%27.8%14.7%8.5%Hit parked car 3%Third party alleged cause of accident 1%14.7% 15.1%Third party reversed into insured 4%8.3%13.3%8.9%7.5%8 pm– MIDNIGHT15.5% 16.5% 14.1% 10.2%MON TUE WED THU FRI SAT SUNSource: 2008 <strong>AAMI</strong> Claims DataSource: 2008 <strong>AAMI</strong> Claims Data
Our driving shame: spotlight on aggressionThe phrase ‘road rage’ was entrenchedin the Australian vernacular when the<strong>AAMI</strong> <strong>Crash</strong> <strong>Index</strong> first reported ondriver attitude and behaviour in 1996.Then, <strong>AAMI</strong> found 57 per cent ofdrivers thought the roads were ‘like abattlefield’, 47 per cent ‘often got mad’at other drivers, 22 per cent made‘angry’ gestures, and six per centresorted to ‘chasing’ other cars.Almost 15 years on, the <strong>AAMI</strong> <strong>Crash</strong><strong>Index</strong> continues to be a barometer ondriver attitude and behaviour, especiallythe less flattering and outrightdangerous things drivers do.Sadly, things are getting worse. Thisyear, nine in 10 drivers (91 per cent)say motorists are becoming moreaggressive, continuing a trend thathas steadily worsened since <strong>AAMI</strong>began canvassing motorists about theiraggression.Conditions are now so bad that 60per cent of drivers worry about beinga victim of road rage. Of those, 17per cent worry ‘a lot’. Among theaggressive behaviours drivers admitto, 56 per cent gesture rudely at othersin response to behaviour they don’tagree with, while 58 per cent respondto other drivers with yelling or swearingof their own, and 22 per cent havebecome so angry with another driverthey have tailgated them – almost fourtimes higher than 1996 (six per cent).Considering the types of road rage mostdrivers have experienced from otherdrivers, it is little wonder so many worryabout becoming a victim. Rude gestures(79 per cent), verbal abuse (64 percent) and tailgating (65 per cent) areexperiences common to most. However,the numbers who have experiencedpersonal confrontation are alarming:three in 10 drivers (29 per cent) havebeen followed, one in eight (12 per cent)has been forced off the road, one in14 (seven per cent) has had their carwilfully damaged and two per cent havebeen physically assaulted by a roadraging motorist.Sadly, when it comes to evaluating theirown behavior, most drivers see these91%said motoristsare becomingincreasinglyaggressivetypes of actions as acceptable. Fourin five (83 per cent) say yelling,swearing and gesturing rudely is ajustifiable response to road rage fromother drivers. Worse still, two thirds(63 per cent) say tailgating otherdrivers in response to their aggressionis justified.Congestion the majorfactor in our aggressionThe causes of road rage have longbeen a source of conversation anddebate, but <strong>AAMI</strong>'s research showstraffic congestion is the major source ofaggression on our roads.Since 2005, the <strong>AAMI</strong> <strong>Crash</strong> <strong>Index</strong> hasseen the number of drivers who say ittakes them 30 minutes or more to driveto work, triple – from eight per centin 2005 to 30 per cent in <strong>2009</strong>. Thisis significant evidence that increasedtraffic congestion is a reality formany drivers.Over the same period, the <strong>Index</strong> hasrecorded an 18 per cent increase inthe number of drivers who attributeaggression and road rage to trafficcongestion, from 70 per cent in 2005to a high of 88 per cent in <strong>2009</strong>. Thisclearly shows the frustration driversare experiencing with increasinglyclogged and cluttered roads, withmotorists all-too-often bearing thebrunt of others' anger.avoiding aggressionThe best way to avoid being a victim of road rage is to avoid provoking other drivers:Gestures: obscene or offensive gestures irritate other drivers. Be aware that any gesture may be misinterpreted by another driver.Eye contact: if a motorist tries to pick a fight, do not make eye contact. Get out of the way without acknowledging the other motorist. If the driverfollows you, do not go home. Go to a police station or location where you can get help and there will be witnesses.Aggressive tailgating: riding the bumper of the vehicle in front of you is both annoying and unsafe.Aggressive horn use: leaning on the horn to express your anger is aggravating.Aggressive headlight use: flashing headlights to denote irritation is rude and unsafe.Use common courtesy to avoid provoking aggression from others:Lane blocking: don't block the passing lane on multiple lane highways. Allow vehicles to pass you.Tailgating: maintain a safe distance between your vehicle and the vehicle in front of you.Indicator use: don't change lanes without using your indicator, and make sure you can change lanes without cutting another driver off.Horn use: use your horn sparingly. Noise is shown to be a contributor to stress.
Road rage reaches new high<strong>AAMI</strong> Executive General Manager Anthony DurakovicDriver aggression shows little sign of abating; if anything,the trends suggest drivers are even angrier and increasinglyconfrontational in venting their rage and aggression.This is the disturbing reality of the <strong>2009</strong> <strong>AAMI</strong> <strong>Crash</strong> <strong>Index</strong>.AnthonyDurakovicWhen <strong>AAMI</strong> released its first <strong>Crash</strong><strong>Index</strong> report, little did we anticipatethat the <strong>Index</strong> would becomea benchmark for driver attitudeand behaviour. That first reportfocussed on variations in crashrelatedinsurance claims, painting aninteresting picture of the role of manyfactors in vehicle collisions – age,gender, time and location of crash, andeven the age of the car.Of concern then was the sharpincrease in the <strong>Crash</strong> Claims IncidenceRate 1 in the three years after therecession of the early 1990s – the rateof claims rose 15 per cent over thoseyears. As the <strong>Index</strong> reported then,Australians were literally crashing theirway out of recession.Fast forward 15 years and little haschanged. The <strong>Crash</strong> Claims IncidentRate has remained steady whichshows Australian drivers are crashingat roughly the same rate as theywere then.What has changed – and for the worse– are drivers’ experiences of aggressionand road rage. <strong>AAMI</strong> started researchingthe road rage phenomenon with itssecond <strong>Crash</strong> <strong>Index</strong>. That <strong>Index</strong> showeda majority of drivers thought the roadswere like a battlefield, almost half ofdrivers surveyed got mad at others, onein five gestured rudely at other driverswhen angered and five per cent resortedto tailgating.Disturbingly, the <strong>2009</strong> <strong>AAMI</strong> <strong>Crash</strong><strong>Index</strong> proves that not only are driversstill angry, they are prepared to takethat anger from the cocoon of their carto a personally confrontational situationwith the driver that angered them.The statistics show:• Drivers are now fives times as likelyto follow or pursue a driver theythought did something stupid as theywere in 1996• They are now four times as likely totailgate drivers who angered them asthey were in 1996. Since 2005, thishas increased by eight per cent• The ability of drivers to justify thisappalling and dangerous behaviourhas similarly increased. Just overhalf of drivers in 2005 said tailgatingwas justifiable compared to almosttwo-thirds todayPolice, governments and otherauthorities have tried hard and spentmillions to improve conditions on ourroads, and in many respects they havebeen successful with the rate of injuryand road tolls on the decline. However,the aggressive behaviours shown inthis and previous <strong>AAMI</strong> <strong>Crash</strong> <strong>Index</strong>esis something drivers need to takeresponsibility for.By exposing this aggression – andits frequency – <strong>AAMI</strong> hopes toconvince drivers that suppressing theiranger is far more beneficial than theconsequences of responding to roadrage with road rage.Ultimately, drivers are responsible fortheir actions. On this count, we hopethey’re paying attention.1 <strong>Crash</strong>es per 100 policyholdersThe <strong>2009</strong> <strong>AAMI</strong> <strong>Crash</strong> <strong>Index</strong>is based on an independentnational telephone and internetsurvey of 2500 licensed driversin every state and territory.The survey is conducted bySweeney Research, oneof the largest and mostrespected researchconsultancies in Australia.The survey was conductedin the following locationsaround Australia:• Adelaide• Ballarat, Bendigoand Shepparton• Batemans Bay, Begaand Ulludulla• Brisbane• Canberra• Central Queensland• Coffs Harbour andPort Macquarie• Darwin• Geelong• Gold Coast• Hobart• Launceston• Melbourne• Newcastle and Gosford• North Queensland• Perth• Regional South Australia• Regional Western Australia• Sunshine Coast• Sydney• Tamworth• Toowoomba andthe Darling Downs• Wagga Wagga and Griffith• Wollongong and NowraOnce collected, data iscarefully weighted to ensurethe results are representativeof the Australian community bygender, age and location. Thedata is weighted in line withpopulation statistics from theAustralian Bureau of Statisticsfor statistical validity. Weightingallows <strong>AAMI</strong> to generalise itsdata to the entire population.Except where stated thesurvey explored respondents’experiences over their lifetime.<strong>AAMI</strong>’s research may differfrom government and policeagencies whose research istypically limited to a 12-monthperiod. Also, smaller orunreported incidents may becaptured in <strong>AAMI</strong>’s research butnot by others.The confidence interval for thesample size is plus or minustwo per cent, which means thatfor the survey sample of 2500,if the observed result is 50 percent, the chances are 95 in 100that the range (48-52 per cent)included the true percentage forthe population.PRINTED ON RECYCLED PAPERA01867 15/07/09 A