LM1/LC-1 - Innovate Motorsports
LM1/LC-1 - Innovate Motorsports
LM1/LC-1 - Innovate Motorsports
- No tags were found...

Create successful ePaper yourself
Turn your PDF publications into a flip-book with our unique Google optimized e-Paper software.
<strong>LM1</strong>/<strong>LC</strong>-1 – Installation and Tuning GuideApexi Power FCDataloggit Logger13B Turbo RotaryAnd Other ApplicationsJustin Baltrucki
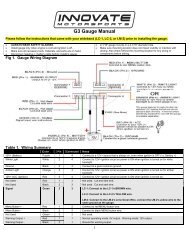
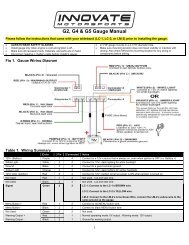
LM-1 Installation and Tuning Guide – Apexi PFC - Dataloggit1. LM-1 InstallDescriptionThis Tutorial will provide instructions for the wiring, programming and integration of the<strong>Innovate</strong> <strong>LM1</strong>/<strong>LC</strong>-1 with an Apexi Power FC equipped with a Dataloggit logger. It willalso cover the data logging instructions, data processing and guidelines for modificationof the injection maps. This guide will not cover the physical installation of the sensor inthe exhaust system. Details for this are covered in the product manual. Data loggingand tuning will be performed with deactivation of the O2 feedback control on a 3 rdgeneration Mazda RX7. For this you can replace the factory O2 sensor with the LM-1sensor. Please refer to manufacturer’s manuals for details, warnings, and otherspecific information.Dataloggit Analog Input ConnectionsThe Dataloggit has up to 4 analog inputs. To reduce errors associated with electricalnoise, and offsets in the grounds, it is best to connect the LM-1/<strong>LC</strong>-1’s analog signal toAN1, and connect the LM-1/<strong>LC</strong>-1’s Ground to AN-2. In the case of the <strong>LC</strong>-1, you willneed to ground both the system and the analog ground wires (white and green) to theAN-2 and the Heater ground (red wire) to the Power FC’s ground.Both the LM-1 and <strong>LC</strong>-1 have 2 configurable analog outputs, either of these outputs canbe configured to output to the Dataloggit. On the LM-1’s analog output cable red isanalog output 1. white is analog output 2, and the remaining wire is the ground. The <strong>LC</strong>-1’s yellow wire is analog output 1 and brown is analog output 2.When configured the signal will be the difference between AN1, and AN2. You will losean additional input however; you will improve the resolution of the signal and removeerrors associated with the ground. If you do not have available open inputs, you can usethe 0V as a common ground, and any AN input for the power.Programming the Analog Output- 1 -Figure 2. Dataloggit Analog Input ConnectionsThe LM-1/<strong>LC</strong>-1 can be configured to output a linear 0-5 volt signal in proportionto the recorded air fuel ratio. It is best to configure the output in the useablerange for a turbo rotary engine. Air fuel should not be outside of the 9 – 16:1AFR. This section details configuration of the analog output.
LM-1 Installation and Tuning Guide – Apexi PFC - Dataloggit1. Connect the LM-1 or <strong>LC</strong>-1 to the computer.2. Turn power ON to the LM-1/<strong>LC</strong>-1.3. Open the LM Programmer software application.4. Click on the “Analog Out 1” or “Analog Out 2” tab. Make sure you program theappropriate analog output which you wired.5. Select “use air-fuel-ratio” option.6. Set the “Analog Out 1” to the following:a. 0 Volts at AFR: 9.0b. 5 Volts at AFR: 16.07. Click the “Program” button to program these values into the LM-1/<strong>LC</strong>-1.Please refer to the manual for further details on programming the LM-1/<strong>LC</strong>-1.2. Configuring FC Edit to read the Analog OutputTo properly interpret the analog output the FC Edit software for the dataloggit has to beconfigured to the same 0-5 volt signal as the LM-1/<strong>LC</strong>-1 output.- 2 -1. Open the FC-Edit Software
LM-1 Installation and Tuning Guide – Apexi PFC - Dataloggit2. Select - Setup – AuxiliaryFigure 4. Select AuxiliaryThe auxiliary menu is shown in figure 5. Depending on how you connected theAnalog output to the Dataloggit there are two possible configurations. If using AN1for the power wire and AN2 for the ground, select Delta AN1 – AN2. Then enter inthe numbers for Voltage and Value in the upper left section for AN1 – AN2. Changethe name to Wideband, and the units to A/F. (The configuration will match figure 5).If using only AN1 do not select any boxes, and enter the values and the name forAN1.Figure 5. Configured AN1 – AN2 Analog InputLogging Data Using the FC – Edit software and Map Watch1. Power the LM-1/<strong>LC</strong>-1- 3 -
LM-1 Installation and Tuning Guide – Apexi PFC - Dataloggit2. Turn the car to the power on position3. Connect to the Dataloggit using the serial port connection (more details on thisare available in the Dataloggit Manual.) Open the FC-Edit program to connect tothe ECU.If an error message “interface not responding” is displayed key the car off and onand try again.4. To prevent the Factory O2 sensor from interfering with the injection map it is bestto turn off the O2 feedback. This is also necessary if the factory O2 sensor hasbeen removed and replaced with the LM-1/<strong>LC</strong>-1 Wideband. In the FC-Editprogram go to the settings 1 tab. Click the function select #4 “O2 F/B Control” toturn off O2 feedback.Figure 6. Settings 1 Tab – O2 Feedback Deactivation5. Next, select - Window - “MAP WATCH”- 4 -
LM-1 Installation and Tuning Guide – Apexi PFC - DataloggitFigure 7. – Window map WatchThe map watch will open in another window. It is a 20 x 20 grid configured like the fueltables in the FC edit. There are several important features of the map watch that mustbe configured to properly log the data.Figure 8. Map Watch Window6. In the left pull down menu – scroll down to the input you would like to log. ForAFR monitoring this with either be AUX AN1 Wide Band, or AUX AN1 – AN2Wide Band (Depending how this was wired and configured)7. The next pull down menu allows you to select Min/Max/Average/Num. The firstthree are just what you think they are. Average is best because there can beerroneous data from throttle transitions. The NUM is simply the number of datapoints collected. This will be explained later. Set this window to Average- 5 -
LM-1 Installation and Tuning Guide – Apexi PFC - Dataloggit8. The next section to the right labelled (hold off mSec) is an important feature. Ifyou are making a rapid transition through a cell then the data is not very useful. Ifyou do not stay in a particular cell for 20 milliseconds then it will not record a datapoint. I have found that 20 mSec works well. You can experiment with thisnumber depending on what kind of operating conditions you intend to monitor.Leave this at 20 mSec to start.9. The next section “max Val” is where you can set the max value you intend toview. For AFR the max value is 16, make sure you set this value 16 or higher.10. Notice in the 20x20 grid that the upper left hand section is red and the cell has aborder. This is the map tracer. This will highlight the cell that you are currentlyoperating in. (with the car off it’s the upper left). To activate this map tracer go toView and select map trace, and Ghost.Figure 9. View - Map Tracer and Ghost11. Start the Car and allow it to warm up to operating temperature. Cold start-upenrichment will give false rich data when logging.12. Start the logging by selecting Log – Start or by pressing F1Figure 10. Log – StartThe log should highlight the cells that you are operating in the idle range, and willfill in the table with the AFR numbers. If the logging does not work you may need tocheck the monitor window to make sure that you are logging all the data needed. In themap watch go to – Window – Monitor. The monitor window will appear and display allinputs to the ecu. Select the boxes circled in red to log all data.- 6 -
LM-1 Installation and Tuning Guide – Apexi PFC - DataloggitFigure 11. Monitor Window13. With the Map Watch working and the data logging, now is a good time to verifythat the logged data matches the AFR displayed on the <strong>LM1</strong>. If the numbers donot match, verify your electrical connections, and repeat the procedures above.When the logged data matches the Drive the car around to collect data. Try touse smooth pedal inputs with varying RPM and boost levels to fill in all the data.Avoid engine braking and rapid throttle inputs as this can record bad data points.Holding a constant throttle position from low to high RPM is best. Using 3 rd gearand higher is best as you spend more time in each cell and collect smootherdata. After driving for a while the data should look like figure 12. If you haveselected “ghost” then the data fields will be highlighted in red.Figure 12. Map Watch With logged AFR- 7 -
LM-1 Installation and Tuning Guide – Apexi PFC - DataloggitNow that you have successfully logged the data, there are a few things you shouldknow about the data.Saving Data –It is important to save the data periodically to make sure that you do not lose the data. Itis also important to make sure that you stop logging and restart logging after makingany changes to the injection map in the ECU. With averaging the data, it will take sometime for averages to clean out the old data.Engine Braking –Rows P1, P2, and even part of P3 can be corrupted by engine braking. When lifting thethrottle during engine braking, the ECU does not inject any fuel. The engine iseffectively an air pump and the AFR will be off the scale lean. This is normal, howeverthe data collected during engine braking is useless and often causes users to add andadd fuel to try to correct this.Missfires –When an engine miss-fires it will pump unburnt fuel and fresh air into the exhaustsystem. Because the Air fuel ratio is actually measured by an oxygen sensor, thisshows up as a lean mixture due to the excess of oxygen. This will often show up on the<strong>LM1</strong> display as a dancing AFR reading from rich to lean. On the logging this will beaveraged out, so you won’t see it. If you have misfires in a particular area, do not usethe logged data at face value.Erroneous Data –While logging, blipping the throttle, rev matching shifts, or engine braking can give baddata in various spots on the map. If there is an odd air fuel reading surrounded byreasonable numbers there is a good chance that it could be a bad number. To helpidentify these bad numbers the map watch has an option that let’s you view the numberof data points that were collected in a particular cell. In step 6 we set the logging to viewthe data. If we select NUM instead of average it will display the number of data pointscollected in that cell. If only 1 point was used to generate the data and the data isstrange, it’s likely a bad data point. It is still a good idea to check the injection maps tosee if there is an unreasonable dip or spike in the numbers in that cell.Data Interpolation –While driving, the car does not really run in any one particular cell. The car will run inbetween two or more cells. The ecu uses linear interpolation to calculate the values thatthe ECU should use to run the car. If you have a high value in the injection map it willtend to add fuel to the cells around it. For this reason tuning is a lengthy iterativeprocess that requires several sessions of data collection and manual smoothing of theinjection maps. After running some logging sessions and making changes based onAFR, go back to the MAP and look for strange spots in the MAP. Look for high valuessurrounded by low values, or dips in the curve. The fueling should increase with Boost,and should generally increase with RPM near the torque peak of the engine, and thendrop off slightly.Data Processing –With all the data in the 20 x 20 grid it is very tedious to change all of the points in theinjection map. It is best to use a spreadsheet to process the data automatically, andthen paste the changes into the injection correction map. Using a spreadsheet toprocess the data can often get the air fuel ratio within 5% in just a few logging sessions.- 8 -
LM-1 Installation and Tuning Guide – Apexi PFC - DataloggitData Processing with MS-ExcelTo process the data a relatively simple spreadsheet can be made. These spreadsheetsare often available online for download, or you can make your own. Most excel userscan create the spreadsheet based on the instructions below.The spreadsheet consists of 3 sections.INPUT –This is a 20x20 grid where you paste in the logged AFR data. When using spreadsheetsto tune you need to delete any bad data points. Engine braking, and erroneous pointsneed to be removed. Rows P1 and P2 should be deleted. Often it is a good Idea to tunethe idle manually, and to delete the idle region form the pasted AFR data as well. Deletethese in the Input section.MEASURED AVERAGE AFR400 800 1200 1600 2000 2400 2800 3200 3600 4000 4400 4800 5200 5600 6000 6400 6800 7200 7600 80000.10.2 13.80.3 14.7 12 12.7 12.6 13 12.7 14.4 12.9 13.5 13.30.4 12.9 12.1 13.2 12.9 12.9 12.9 13.4 12.9 13.2 12.4 12.20.5 14.4 12.8 14.4 14.4 14.1 14 14.3 13.8 14.2 13.6 12.3 130.6 13.8 14.4 14.2 14.3 14.4 14.5 14.6 14.4 14.1 13.6 13.10.7 13.9 14 14.1 14.1 14 14.2 14.3 13.7 14.1 13.4 14.4 14.4 11.90.8 13.1 13.8 13.7 13.8 13.7 13.5 13.8 12.6 14.2 11.2 14.4 120.9 13.1 12 12.8 13.5 13.5 14.8 13.9 12.3 12.6 14.9 12.81 14.8 10.6 10.7 14 13.21.1 14 12.8 12.5 111.2 14.4 12.3 12.3 11.21.3 13.5 12.6 12.5 12.5 11.6 11 10.61.4 12.6 12.4 11.1 11.2 11.2 12 15.61.5 12.3 12.3 11.5 12.9 10.9 11.4 11.61.6 11.9 11.4 11.4 11.5 11.3 11.6 11.9 11.4 11.6 10.81.8 11.7 11.2 10.6 10.6 10.9 11.5 11.7 11.4 11.7 11.4 11.52 11.3 10.92.22.4Figure 13. Measured AFR Section of SpreadsheetDESIRED AFR –This is a 20 x 20 grid where you define the desired AFR. Desired AFR should considerthe very different requirements for idle, cruising, midrange, high boost and high RPM.AFR is often a blend from a cruising range of 14.7:1 to a full boost value of ~11.0:1 for aturbo rotary. The idle AFR may vary depending on the engines state of tune. There issome debate on what is the best AFR and this should be researched carefully beforetuning. A desired AFR graph used successfully on a single turbo street ported RX7 isshown below in figure 13.- 9 -
LM-1 Installation and Tuning Guide – Apexi PFC - DataloggitDesired target AFRBoost 400 800 1200 1600 2000 2400 2800 3200 3600 4000 4400 4800 5200 5600 6000 6400 6800 7200 7600 80000.1 13.5 13.5 13.5 13.5 13.8 14 14 14 14 14 14 14 14 14 14 14 14 14 14 140.2 13.5 13.5 13.5 13.5 13.8 14 14 14 14 14 14 14 14 14 14 14 14 14 14 140.3 13.5 13.5 13.5 13.5 13.8 14 14 14 14 14 14 14 14 14 14 14 14 14 14 140.4 13.5 13.5 13.5 13.5 13.8 14 14 14 14 14 14 14 14 14 14 14 14 14 14 140.5 13.5 13.5 13.5 13.5 13.8 14 14 14 14 14 14 14 14 14 14 14 14 14 14 140.6 13.5 13.5 13.5 13.5 13.8 13.8 14 14 14 14 14 14 14 14 14 14 14 14 14 140.7 13.8 13.8 13.8 13.8 13.8 13.8 13.8 13.8 13.8 13.8 13.8 13.8 13.8 13.8 13.8 13.8 13.8 13.8 13.8 13.80.8 13.5 13.5 13.5 13.5 13.5 13.5 13.5 13.5 13.5 13.5 13.5 13.5 13.5 13.5 13.5 13.5 13.5 13.5 13.5 13.50.9 13.3 13.3 13.3 13.3 13.3 13.3 13.3 13.3 13.3 13.3 13.3 13.3 13.3 13.3 13.3 13.3 13.3 13.3 13.3 13.31 13 13 13 13 13 13 13 13 13 13 13 13 13 13 13 13 13 13 13 131.1 12.8 12.8 12.8 12.8 12.8 12.8 12.8 12.8 12.8 12.8 12.8 12.8 12.8 12.8 12.8 12.8 12.8 12.8 12.8 12.81.2 12.7 12.7 12.7 12.7 12.7 12.7 12.7 12.7 12.7 12.7 12.7 12.7 12.7 12.7 12.7 12.7 12.7 12.7 12.7 12.71.3 12.5 12.5 12.5 12.5 12.5 12.5 12.5 12.5 12.5 12.5 12.5 12.5 12.5 12.5 12.5 12.5 12.5 12.5 12.5 12.51.4 12.2 12.2 12.2 12.2 12.2 12.2 12.2 12.2 12.2 12.2 12.2 12.2 12.2 12.2 12.2 12.2 12.2 12.2 12.2 12.21.5 12 12 12 12 12 12 12 12 12 11.8 11.8 11.8 11.8 11.8 12 12 12 12 12 121.6 12 12 12 12 12 12 11.6 11.6 11.6 11.4 11.4 11.4 11.4 11.4 11.6 11.6 11.6 11.6 11.6 11.61.8 12 12 12 12 12 12 11.5 11.5 11.5 11.2 11.2 11 11 11.1 11.2 11.2 11.2 11.2 11.2 11.22 12 12 12 12 12 12 11.3 11.2 11.2 11.1 11 10.9 10.9 10.9 11 11.1 11.2 11.2 11 112.2 12 12 12 12 12 12 11 10.9 10.8 10.8 10.8 10.8 10.8 10.9 11 11 11 11 11 112.4 12 12 12 12 12 12 10.5 10.5 10.5 10.5 10.5 10.5 10.5 10.5 10.5 10.5 10.5 10.5 10.5 10.5Figure 13. Desired AFR – GT35/40 13B Street PortedCORRECTION MAP –This is another 20 x 20 grid where the Pasted AFR values are compared to the desiredAFR values, and a correction factor is calculated. In MS excel the equation for thesecells is as follows: CELL =IF(OR(ISBLANK(B3)),1,((B3)/B27)) Where B3 is the pastedAFR value and B27 is the desired AFR value. Should the input be blank, the value willbe 1, otherwise it will simply divide the actual AFR by the desired AFR.As an example if the AFR is 14.0 and the desired AFR is 10.0 then the correction factoris (14/10) = 1.4. The spreadsheet will add 40% more fuel to obtain the desired AFR.Figure 14 is the correction factor map based on the input data and the desired AFR grid.CORRECTION FACTOR CA<strong>LC</strong>ULATEDBOOST 400 800 1200 1600 2000 2400 2800 3200 3600 4000 4400 4800 5200 5600 6000 6400 6800 7200 7600 80000.1 1.00 1.00 1.00 1.00 1.00 1.00 1.00 1.00 1.00 1.00 1.00 1.00 1.00 1.00 1.00 1.00 1.00 1.00 1.00 1.000.2 1.00 1.00 1.00 1.00 1.00 1.00 1.00 1.00 1.00 1.00 1.00 1.00 1.00 1.00 1.00 1.00 1.00 0.99 1.00 1.000.3 1.00 1.00 1.00 1.00 1.07 0.86 0.91 0.90 0.93 0.91 1.03 0.92 0.96 0.95 1.00 1.00 1.00 1.00 1.00 1.000.4 1.00 1.00 1.00 1.00 0.93 0.86 0.94 0.92 0.92 0.92 0.96 0.92 0.94 0.89 0.87 1.00 1.00 1.00 1.00 1.000.5 1.00 1.00 1.00 1.00 1.04 0.91 1.03 1.03 1.01 1.00 1.02 0.99 1.01 0.97 0.88 1.00 1.00 0.93 1.00 1.000.6 1.00 1.00 1.00 1.00 1.00 1.04 1.01 1.02 1.03 1.04 1.04 1.03 1.01 0.97 1.00 1.00 1.00 1.00 0.94 1.000.7 1.00 1.00 1.01 1.01 1.02 1.02 1.01 1.03 1.04 0.99 1.02 0.97 1.04 1.04 1.00 1.00 1.00 1.00 0.86 1.000.8 1.00 1.00 0.97 1.02 1.01 1.02 1.01 1.00 1.02 0.93 1.05 0.83 1.07 0.89 1.00 1.00 1.00 1.00 1.00 1.000.9 1.00 0.98 0.90 0.96 1.02 1.02 1.00 1.11 1.05 0.92 0.95 1.00 1.12 0.96 1.00 1.00 1.00 1.00 1.00 1.001 1.00 1.00 1.00 1.00 1.00 1.00 1.00 1.14 0.82 0.82 1.00 1.00 1.08 1.02 1.00 1.00 1.00 1.00 1.00 1.001.1 1.00 1.00 1.00 1.00 1.00 1.00 1.09 1.00 1.00 0.98 1.00 1.00 1.00 0.86 1.00 1.00 1.00 1.00 1.00 1.001.2 1.00 1.00 1.00 1.00 1.00 1.00 1.13 1.00 0.97 1.00 0.97 1.00 1.00 1.00 1.00 1.00 1.00 1.00 0.88 1.001.3 1.00 1.00 1.00 1.00 1.00 1.00 1.08 1.00 1.01 1.00 1.00 1.00 1.00 1.00 1.00 1.00 0.93 0.88 0.85 1.001.4 1.00 1.00 1.00 1.00 1.00 1.00 1.00 1.00 1.00 1.03 1.00 1.02 0.91 0.92 0.92 0.98 1.00 1.00 1.00 1.281.5 1.00 1.00 1.00 1.00 1.00 1.00 1.00 1.03 1.03 0.97 1.09 1.00 0.92 0.97 1.00 1.00 1.00 1.00 1.00 0.971.6 1.00 1.00 1.00 1.00 1.00 1.00 1.03 0.98 0.98 1.01 0.99 1.02 1.04 1.00 1.00 1.00 1.00 1.00 1.00 0.931.8 1.00 1.00 1.00 1.00 1.00 1.00 1.02 0.97 0.92 0.95 0.97 1.00 1.05 1.05 1.02 1.04 1.00 1.02 1.03 1.002 1.00 1.00 1.00 1.00 1.00 1.00 1.00 1.00 1.00 1.00 1.00 1.00 1.00 1.00 1.00 1.02 0.97 1.00 1.00 1.002.2 1.00 1.00 1.00 1.00 1.00 1.00 1.00 1.00 1.00 1.00 1.00 1.00 1.00 1.00 1.00 1.00 1.00 1.00 1.00 1.002.4 1.00 1.00 1.00 1.00 1.00 1.00 1.00 1.00 1.00 1.00 1.00 1.00 1.00 1.00 1.00 1.00 1.00 1.00 1.00 1.00Figure 14. Correction Factor grid- 10 -
LM-1 Installation and Tuning Guide – Apexi PFC - DataloggitUsing Processed <strong>LM1</strong> Data with FC-Edit1. To move the logged data from the Map Watch to the spreadsheet a simple copyand paste operation can be used. Highlight the 20x20 grid and press Ctrl+C tocopy. Right clicking and selecting copy works on the newer revisions of the FCedit. Be sure to highlight all of the data. This can be done on the fly while tuningthe car. Usually stopping the logging and copying the raw logged data is best.The logs can get rather large and difficult for a laptop to save and open later.Copying the data on the fly ensures you won’t lose it.2. Pasting the data into the 20 x 20 grid is just as simple. Highlight the 20 x 20 gridin excel and press Ctrl+V to paste the data, or right click and paste. Be sure tohave the data aligned properly in the grid. If the data is shifted, it will seriouslyskew the results of tuning.3. After pasting in the data it needs to be cleaned up to remove any bad datapoints, engine braking, and any areas that we do not want to modify (idle rangeperhaps).4. To input the correction values into the FC edit file, we need to first reset theinjection correction map to all 1’s by recalculating the base map. The FC edit has2 maps that are used to determine the fuel quantity provided to the engine. Thereis an Injection Correction map, and a Base Map. These two maps are multipliedto calculate the injected fuel. There are several other factors that get used todetermine the actual fueling, however they are beyond the scope of thisdocument. Using tools – Recalculate base map, the FC-edit software will performthis multiplication and adjust the base map while setting the correction map to1.00 in all cells.Figure 15. Tools - Recalculate Base Map- 11 -
LM-1 Installation and Tuning Guide – Apexi PFC - DataloggitAfter recalculating the Base Map, the INJ MAP will look like figure 16.Figure 16. INJ MAP after recalculating Base Map5. Now that the INJ MAP is all 1’s, we can paste in the correction values from ourspreadsheet. Highlight the 20 x 20 correction values from the spreadsheet pressCtrl+C, or right click Copy.6. Highlight the 20 x 20 INJ MAP and paste in the data by pressing Ctrl + V, or rightclick paste. Be sure to have the complete grid highlighted. The new INJ MAPshould look like figure 17. Be sure to verify that the numbers pasted are in factthe numbers from the spreadsheet. They should be numbers close to 1.00. Anumber of 1.10 will add 10% fuel ad a 0.90 will subtract 10% fuel. Unless the caris running really rough, try to avoid large changes of %30+.- 12 -
LM-1 Installation and Tuning Guide – Apexi PFC - DataloggitFigure 17. INJ MAP with Pasted Correction Values.7. Save the new FC-Edit file and write it to the ECU by clicking Update.8. You have now completed logging and correcting based on the logs. The AFRvalues should be quite close to the desired AFR after only 1 or 2 sessions. It isimportant to drive the car, or dyno test the car under all boost and RPMconditions where it will operate to ensure that all cells are modified. After eachlogging session the data collected needs to be pasted into excel for processingthen copied and pasted back into FC-Edit. Each time data will be pasted into FC-Edit it is important to recalculate the base map and reset the INJ MAP to all 1’sbefore pasting correction values.9. It is often a good idea to start with a rich running car, and then remove fuel bytuning. Starting with a lean car can be dangerous because of engine knock, andhigh exhaust gas temperatures. Rotary engines are particularly sensitive to leanmixtures, and easy to damage. If you have a generally lean mixture, go into theINJ map and add fuel almost everywhere by changing all values to greater than1. A general rule of thumb is that 10% extra fuel will lower your AFR by a fullpoint.- 13 -