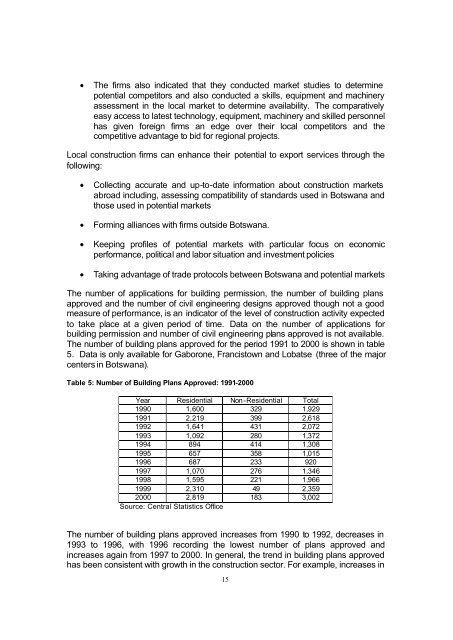
• The firms also indicated that they conducted market studies to determinepotential competitors and also conducted a skills, equipment and machineryassessment in the local market to determine availability. The comparativelyeasy access to latest technology, equipment, machinery and skilled personnelhas given foreign firms an edge over their local competitors and thecompetitive advantage to bid for regional projects.Local construction firms can enhance their potential to export services through thefollowing:• Collecting accurate and up-to-date information about construction marketsabroad including, assessing compatibility of standards used in <strong>Botswana</strong> andthose used in potential markets• Forming alliances with firms outside <strong>Botswana</strong>.• Keeping profiles of potential markets with particular focus on economicperformance, political and labor situation and investment policies• Taking advantage of trade protocols between <strong>Botswana</strong> and potential marketsThe number of applications for building permission, the number of building plansapproved and the number of civil engineering designs approved though not a goodmeasure of performance, is an indicator of the level of construction activity expectedto take place at a given period of time. Data on the number of applications forbuilding permission and number of civil engineering plans approved is not available.The number of building plans approved for the period 1991 to 2000 is shown in table5. Data is only available for Gaborone, Francistown and Lobatse (three of the majorcenters in <strong>Botswana</strong>).Table 5: Number of Building Plans Approved: 1991-2000Year Residential <strong>No</strong>n-Residential Total1990 1,600 329 1,9291991 2,219 399 2,6181992 1,641 431 2,0721993 1,092 280 1,3721994 894 414 1,3081995 657 358 1,0151996 687 233 9201997 1,070 276 1,3461998 1,595 221 1,9661999 2,310 49 2,3592000 2,819 183 3,002Source: Central Statistics OfficeThe number of building plans approved increases from 1990 to 1992, decreases in1993 to 1996, with 1996 recording the lowest number of plans approved andincreases again from 1997 to 2000. In general, the trend in building plans approvedhas been consistent with growth in the construction sector. For example, increases in15
the number of residential plans experienced in 1996 to 1999 are consistent withincreases in residential construction activity resulting from the Accelerated LandServicing Program. Restructuring of the <strong>Botswana</strong> Housing Corporation (BHC), asignificant (if not the largest) residential property developer in <strong>Botswana</strong> and theresulting commitment to more effective and efficient delivery of new housing mayalso have in part, contributed to increases in the number of residential plansapproved.However, the number of residential plans has not always been consistent with growthin the construction sector. For instance, in 1996, construction sector performancewas recovering while the number of building plans was lowest. This could be due tothe fact that construction activity has not necessarily been concentrated in buildingprojects or in the major centers of Gaborone, Lobatse and Francistown. This isparticularly true for non-residential construction activity, primarily led by Governmentexpenditure which has been distributed throughout the country. <strong>Construction</strong> of neweducation facilities and expansion of existing ones in the late 1990s is a case in point.Cost, time and quality are three of the performance measurement standards used.Improving cost, time and quality performance are important aspects towards acompany’s good image. An evaluation of the cost performance of public constructionprojects in <strong>Botswana</strong> (Chimwaso, 2000) concluded that there were four criticalcontributory factors to construction cost overruns. These were incomplete designs atthe time of tender, additional work at the client’s request, changes in client’s brief andlack of cost planning/monitoring (Chimwaso, 2000). According to the evaluationthree other factors that were normally ignored, but contributed to cost overruns,included delays in issuing information at the construction stage, technical omissionsat the design stage and contractual claims such as extension of project time with costclaims.An assessment of the cost performance of 10 public projects during the evaluationrevealed that 70% of projects experienced cost overruns. The major contributoryfactors were variations (or design changes), re-measurement of provisional works,contractual claims and fluctuations in the cost of labor and material. Variations wereconsidered the most significant factor. The implication of this assessment is thatvariations needs attention. The evaluation attributes design changes to insufficientplanning and suggests that improving the quality of tender documents would lessenthe problem.<strong>Construction</strong> booms also lead to increases in cost of materials and labour. Withregard to skilled labour (engineers, architects, quantity surveyors) shortages becomemore acute during boom periods and tend to increase construction costs. Short-runinput shortages may worsen cost push inflation and there is likely that private sectorneeds are crowded out (Bank of <strong>Botswana</strong>, 1999). In view of the link between publicsector projects and construction booms, (for example front loading of NationalDevelopment Plan 8 projects), and increases in inflation associated with booms,Government has to link implementation of National Development Plan projects withother macroeconomic policy objectives such as inflation control.16