ACTA UNIVERSITATIS PALACKIANAE OLOMUCENSIS GYMNICA ...
ACTA UNIVERSITATIS PALACKIANAE OLOMUCENSIS GYMNICA ...
ACTA UNIVERSITATIS PALACKIANAE OLOMUCENSIS GYMNICA ...
- No tags were found...

Create successful ePaper yourself
Turn your PDF publications into a flip-book with our unique Google optimized e-Paper software.
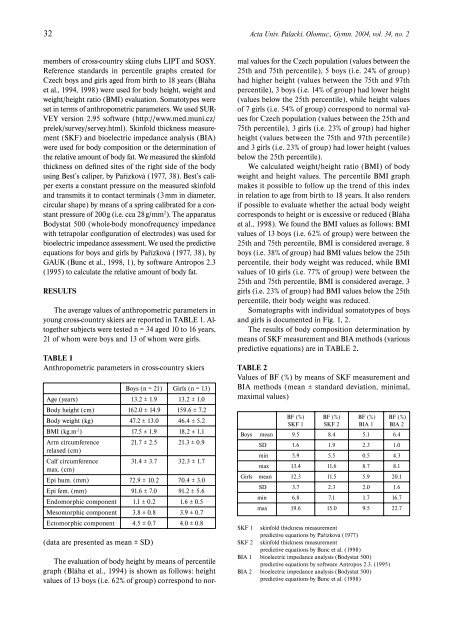
32 Acta Univ. Palacki. Olomuc., Gymn. 2004, vol. 34, no. 2members of cross-country skiing clubs LIPT and SOSY.Reference standards in percentile graphs created forCzech boys and girls aged from birth to 18 years (Bláhaet al., 1994, 1998) were used for body height, weight andweight/height ratio (BMI) evaluation. Somatotypes wereset in terms of anthropometric parameters. We used SUR-VEY version 2.95 software (http://www.med.muni.cz/prelek/survey/servey.html). Skinfold thickness measurement(SKF) and bioelectric impedance analysis (BIA)were used for body composition or the determination ofthe relative amount of body fat. We measured the skinfoldthickness on defined sites of the right side of the bodyusing Best’s caliper, by Pařízková (1977, 38). Best’s caliperexerts a constant pressure on the measured skinfoldand transmits it to contact terminals (3 mm in diameter,circular shape) by means of a spring calibrated for a constantpressure of 200 g (i.e. cca 28 g/mm 2 ). The apparatusBodystat 500 (whole-body monofrequency impedancewith tetrapolar configuration of electrodes) was used forbioelectric impedance assessment. We used the predictiveequations for boys and girls by Pařízková (1977, 38), byGAUK (Bunc et al., 1998, 1), by software Antropos 2.3(1995) to calculate the relative amount of body fat.RESULTSThe average values of anthropometric parameters inyoung cross-country skiers are reported in TABLE 1. Altogethersubjects were tested n = 34 aged 10 to 16 years,21 of whom were boys and 13 of whom were girls.TABLE 1Anthropometric parameters in cross-country skiersBoys (n = 21) Girls (n = 13)Age (years) 13.2 ± 1.9 13.2 ± 1.0Body height (cm) 162.0 ± 14.9 159.6 ± 7.2Body weight (kg) 47.2 ± 13.0 46.4 ± 5.2BMI (kg.m -2 ) 17.5 ± 1.9 18.2 ± 1.1Arm circumference 21.7 ± 2.5 21.3 ± 0.9relaxed (cm)Calf circumference 31.4 ± 3.7 32.3 ± 1.7max. (cm)Epi hum. (mm) 72.9 ± 10.2 70.4 ± 3.0Epi fem. (mm) 91.6 ± 7.0 91.2 ± 5.6Endomorphic component 1.1 ± 0.2 1.6 ± 0.5Mesomorphic component 3.8 ± 0.8 3.9 ± 0.7Ectomorphic component 4.5 ± 0.7 4.0 ± 0.8(data are presented as mean ± SD)The evaluation of body height by means of percentilegraph (Bláha et al., 1994) is shown as follows: heightvalues of 13 boys (i.e. 62% of group) correspond to normalvalues for the Czech population (values between the25th and 75th percentile), 5 boys (i.e. 24% of group)had higher height (values between the 75th and 97thpercentile), 3 boys (i.e. 14% of group) had lower height(values below the 25th percentile), while height valuesof 7 girls (i.e. 54% of group) correspond to normal valuesfor Czech population (values between the 25th and75th percentile), 3 girls (i.e. 23% of group) had higherheight (values between the 75th and 97th percentile)and 3 girls (i.e. 23% of group) had lower height (valuesbelow the 25th percentile).We calculated weight/height ratio (BMI) of bodyweight and height values. The percentile BMI graphmakes it possible to follow up the trend of this indexin relation to age from birth to 18 years. It also rendersif possible to evaluate whether the actual body weightcorresponds to height or is excessive or reduced (Bláhaet al., 1998). We found the BMI values as follows: BMIvalues of 13 boys (i.e. 62% of group) were between the25th and 75th percentile, BMI is considered average, 8boys (i.e. 38% of group) had BMI values below the 25thpercentile, their body weight was reduced, while BMIvalues of 10 girls (i.e. 77% of group) were between the25th and 75th percentile, BMI is considered average, 3girls (i.e. 23% of group) had BMI values below the 25thpercentile, their body weight was reduced.Somatographs with individual somatotypes of boysand girls is documented in Fig. 1, 2.The results of body composition determination bymeans of SKF measurement and BIA methods (variouspredictive equations) are in TABLE 2.TABLE 2Values of BF (%) by means of SKF measurement andBIA methods (mean ± standard deviation, minimal,maximal values)BF (%)SKF 1BF (%)SKF 2BF (%)BIA 1BF (%)BIA 2Boys mean 9.5 8.4 5.1 6.4SD 1.6 1.9 2.3 1.0min 5.9 5.5 0.5 4.3max 13.4 11.6 8.7 8.1Girls mean 12.3 11.5 5.9 20.1SD 3.7 2.3 2.0 1.6min 6.8 7.1 1.7 16.7max 19.6 15.0 9.5 22.7SKF 1 skinfold thickness measurementpredictive equations by Pařízková (1977)SKF 2 skinfold thickness measurementpredictive equations by Bunc et al. (1998)BIA 1 bioelectric impedance analysis (Bodystat 500)predictive equations by software Antropos 2.3. (1995)BIA 2 bioelectric impedance analysis (Bodystat 500)predictive equations by Bunc et al. (1998)