ACTA UNIVERSITATIS PALACKIANAE OLOMUCENSIS GYMNICA ...
ACTA UNIVERSITATIS PALACKIANAE OLOMUCENSIS GYMNICA ...
ACTA UNIVERSITATIS PALACKIANAE OLOMUCENSIS GYMNICA ...
- No tags were found...

You also want an ePaper? Increase the reach of your titles
YUMPU automatically turns print PDFs into web optimized ePapers that Google loves.
<strong>ACTA</strong><strong>UNIVERSITATIS</strong> <strong>PALACKIANAE</strong> <strong>OLOMUCENSIS</strong><strong>GYMNICA</strong>Vol. 34No. 2
Editor in Chiefdoc. MUDr. Pavel Stejskal, CSc.Managing Editordoc. PhDr. Vlasta Karásková, CSc.Editorial Boardprof. Dr. Joăo M. S. C. Abrantesprof. Dr. Herman Van Coppenolleprof. PhDr. Karel Frömel, DrSc.prof. MUDr. Dušan Hamár, CSc.prof. Dr. Peter Hirtzprof. PhDr. Bohuslav Hodaň, CSc.doc. RNDr. Miroslav Janura, Dr.prof. Dr. Bojan Joštprof. Dr. hab. Stanisław KowalikDr. Elisabeth Mattosprof. PhDr. Karel Měkota, CSc.doc. PhDr. Jiří Novosad, CSc.prof. MUDr. Jaroslav Opavský, CSc.prof. Dr. hab. Joachim Raczekprof. RNDr. Jarmila Riegerová, CSc.prof. James F. Sallis, Ph.D.prof. PhDr. Hana Válková, CSc.prof. PhDr. František Vaverka, CSc.Faculty of Physical CulturePalacký University, Olomouc, Czech RepublicFaculty of Physical CulturePalacký University, Olomouc, Czech RepublicFaculty of Human Movement,Technical University, Lisbon, PortugalFaculty of Physical Education and PhysiotherapyKatholic University, Leuven, BelgiumFaculty of Physical CulturePalacký University, Olomouc, Czech RepublicFaculty of Physical Education and SportsComenius University, Bratislava, Slovak RepublicErnst-Moritz-Arndt University, Greifswald, GermanyFaculty of Physical CulturePalacký University, Olomouc, Czech RepublicFaculty of Physical CulturePalacký University, Olomouc, Czech RepublicFaculty of Sport, University of Ljubljana, SloveniaUniversity School of Physical Education, Poznan, PolandUniversity of Sao Paulo, Sao Paulo, BrazilFaculty of Physical CulturePalacký University, Olomouc, Czech RepublicFaculty of Physical CulturePalacký University, Olomouc, Czech RepublicFaculty of Physical CulturePalacký University, Olomouc, Czech RepublicAcademy of Physical Education, Katowice, PolandFaculty of Physical CulturePalacký University, Olomouc, Czech RepublicSan Diego State University, San Diego, USAFaculty of Physical CulturePalacký University, Olomouc, Czech RepublicFaculty of Physical CulturePalacký University, Olomouc, Czech Republic
<strong>ACTA</strong><strong>UNIVERSITATIS</strong> <strong>PALACKIANAE</strong> <strong>OLOMUCENSIS</strong><strong>GYMNICA</strong>Vol. 34No. 2PALACKÝ UNIVERSITY OLOMOUC2004
All contributions were reviewed anonymously.Všechny příspěvky byly recenzovány anonymně.The authors take response for contents and correctness of their texts.Autoři odpovídají za obsah a jazykovou správnost prací.Electronic form available on address: http://www.gymnica.upol.cz© Vlasta Karásková, 2004ISBN 80-244-0898-8ISSN 1212-1185
Acta Univ. Palacki. Olomuc., Gymn. 2004, vol. 34, no. 2 5CONTENTSBurnout in physical training teachers: A macro-path of professional burnoutMaria Brudnik. . . . . . . . . . . . . . . . . . . . . . . . . . . . . . . . . . . . . . . . . . . . . . . . . . . . . . . . . . . . . . . . . . . . . . . . . . . . . . . . . 7Posture assessment in children of the school age group (7–15 years of age) in the Olomouc regionMiroslav Kopecký. . . . . . . . . . . . . . . . . . . . . . . . . . . . . . . . . . . . . . . . . . . . . . . . . . . . . . . . . . . . . . . . . . . . . . . . . . . . . . 19Physical profile in young cross-country skiers from 10 to 16 years oldIvana Kinkorová, Růžena Randáková . . . . . . . . . . . . . . . . . . . . . . . . . . . . . . . . . . . . . . . . . . . . . . . . . . . . . . . . . . . . . . 31Evaluation of muscle functions in athletes performing climbing and judoJarmila Riegerová, Zbyněk Jančík, Petr Kytka . . . . . . . . . . . . . . . . . . . . . . . . . . . . . . . . . . . . . . . . . . . . . . . . . . . . . . . 37Application of the method of spectral analysis of heart rate variability during effects assessmentof selected breathing techniques on functional changes in the autonomous nervous systemPetr Kolisko, Dobroslava Jandová, Jiří Salinger, Jaroslav Opavský, Miroslav Ježek, Karel Slováček . . . . . . . . . . . . . . . 43The agility test in functional diagnostics of athletesErika Zemková, Dušan Hamar . . . . . . . . . . . . . . . . . . . . . . . . . . . . . . . . . . . . . . . . . . . . . . . . . . . . . . . . . . . . . . . . . . . 61Motor skills in mentally retarded childrenIrena Momola, Regina Marszałek . . . . . . . . . . . . . . . . . . . . . . . . . . . . . . . . . . . . . . . . . . . . . . . . . . . . . . . . . . . . . . . . 67Programmed learning in the process of motor learningHalina Guła-Kubiszewska, Marta Wieczorek. . . . . . . . . . . . . . . . . . . . . . . . . . . . . . . . . . . . . . . . . . . . . . . . . . . . . . . . . 71OBSAHSyndrom vyhoření u učitelů tělesné výchovy – proces rozvoje syndromuMaria Brudnik. . . . . . . . . . . . . . . . . . . . . . . . . . . . . . . . . . . . . . . . . . . . . . . . . . . . . . . . . . . . . . . . . . . . . . . . . . . . . . . . . 7Hodnocení držení těla dětí mladšího a staršího školního věku v olomouckém regionuMiroslav Kopecký. . . . . . . . . . . . . . . . . . . . . . . . . . . . . . . . . . . . . . . . . . . . . . . . . . . . . . . . . . . . . . . . . . . . . . . . . . . . . . 19Tělesný profil lyžařů běžců ve věku 10–16 letIvana Kinkorová, Růžena Randáková . . . . . . . . . . . . . . . . . . . . . . . . . . . . . . . . . . . . . . . . . . . . . . . . . . . . . . . . . . . . . . 31Hodnocení svalových funkcí u sportovců zabývajících se volným lezením a judemJarmila Riegerová, Zbyněk Jančík, Petr Kytka . . . . . . . . . . . . . . . . . . . . . . . . . . . . . . . . . . . . . . . . . . . . . . . . . . . . . . . 37Využití metody spektrální analýzy variability srdeční frekvence při hodnocení efektuvybraných dechových technik na aktuální funkční změny autonomního nervového systémuPetr Kolisko, Dobroslava Jandová, Jiří Salinger, Jaroslav Opavský, Miroslav Ježek, Karel Slováček . . . . . . . . . . . . . . . 43Test agility ve funkční diagnostice sportovcůErika Zemková, Dušan Hamar . . . . . . . . . . . . . . . . . . . . . . . . . . . . . . . . . . . . . . . . . . . . . . . . . . . . . . . . . . . . . . . . . . . 61Motorické dovednosti u mentálně retardovaných dětíIrena Momola, Regina Marszałek . . . . . . . . . . . . . . . . . . . . . . . . . . . . . . . . . . . . . . . . . . . . . . . . . . . . . . . . . . . . . . . . 67Programované učení v procesu motorického učeníHalina Guła-Kubiszewska, Marta Wieczorek. . . . . . . . . . . . . . . . . . . . . . . . . . . . . . . . . . . . . . . . . . . . . . . . . . . . . . . . . 71
Acta Univ. Palacki. Olomuc., Gymn. 2004, vol. 34, no. 2 7BURNOUT IN PHYSICAL TRAINING TEACHERSA MACRO-PATH OF PROFESSIONAL BURNOUTMaria BrudnikBronisław Czech Academy of Physical Education, Cracow, PolandSubmitted in January, 2004The investigations were carried out in male and female physical training teachers from Cracow and Wieliczka, firstyearAcademy of Physical Educations students from Cracow (post-bachelor and extramural course) and participantsin three post-graduate courses (N = 256) between February and October, 2003. The syndrome was diagnosed basedon the MBI Maslach questionnaire. Empirical material was analyzed using variance analysis, the non-parametric testof difference significance and cluster analysis.More than one half of physical education teachers (58.6%) were demonstrated not to experience professionalburnout, while burned-out individuals accounted for 27.4% of the sample; the process of burnout was generally notdependent on the gender variable. Both the scope and intensity of burnout were found to be lower as compared togeneral education teachers. The initial reaction of physical training teachers to specific stress was a loss of job – relatedsatisfaction. The author failed to determine a burnout macro-path for physical training teachers; the missing T2segment requires elucidation based on a larger sample of material.Keywords: Professional burnout, physical training teacher.“It represents an erosion of values, dignity, spirit, and will – an erosionof the human soul. It is a malady that spreads gradually and continuouslyover time, putting people into a downward spiral from which it’s hard to reverse.”Ch. Maslach & M. Leiter, 1997, 17INTRODUCTIONThe term “burnout” was recognized as a scientificnotion less than 30 years ago, when it was employedsimultaneously and independently by a psychiatrist,Herbert J. Freudenberger, and a social psychologist,Christine Maslach (Tucholska, 2001).The burnout syndrome, which originally emerged asa social issue, has gained almost a score of conceptualizationsand operationalizations (see: Tucholska, 2003,19–55). The symptoms of burnout described by variousinvestigators have been collected by Cherniss (Noworol,1998, 215–216), and by other authors (see: Tucholska,2003, 38–39). In the literature on the subject, the mostpopular proposal is that presented by Maslach, who wasthe first to develop a coherent concept of the burnoutsyndrome and constructed a tool for measuring the phenomenon,i.e. the Maslach Burnout Inventory (MBI)(Maslach & Jackson, 1986).According to her concept, the burnout syndrome isthe reaction of the organism to chronic emotional stressresulting from the collapse of adaptation processes toone’s work environment. “It is a syndrome of physicaland mental exhaustion, which includes the developmentof negative concepts of ‘I’, a negative attitude towardsone’s work, a loss of emotions and contact in relationswith other people” (Maslach, 1978, in Noworol, 1989,124–125).Stress is a consequence of interpersonal contactsoccurring in various relations that result from one’swork contract. Social professions, such as nurses,physicians and teachers, are believed to be especiallyendangered with specific stress. Another group includesmanagers, high-level office workers and banking sectoremployees (Noworol, 2000), as well as individuals whohighly value professional work as such. These peopleare inclined to make special sacrifices; they often ignoretheir own needs and are at risk of deep disappointmentand frustration when faced with numerous stresses andan unfavorable work environment (Paines, 1993, in Tucholska,2003). Negative effects of burnout may spreadto other spheres of the life of the individual sufferingfrom the syndrome, leading to gradually increasing familyproblems, an escape into illness, substance abuse anddevelopment of psychogenic problems (Maslach, 1997,in Kliś & Kossewska, 1998).
8 Acta Univ. Palacki. Olomuc., Gymn. 2004, vol. 34, no. 2According to the concept developed by Maslach, theburnout syndrome is a multi-dimensional phenomenon.Its three dimensions are:Emotional Exhaustion – EE: A subjective senseof exhaustion or depletion of one’s resistance andemotional resources and a loss of the “joie de vivre”.Individuals who manifest this dimension of burnoutshow strong emotional reactions to weak stimuli, areeasily engaged in conflicts, become uncommunicativeand increasingly more emotionally involved in situationsthat require professional interventions.Personal Accomplishment – PA: A subjective assessmentof the value of one’s professional work. Thedimension – the realm of positive feelings – is negativelycorrelated with the other two dimensions; in the courseof the analysis and interpretation of MBI scores, the scaleis reversed. The Negative Sense of Professional AchievementScale (NSPAS) is a tool for diagnosing a decreasedsense of one’s competencies or achievements at work.Depersonalization – DP: It is manifested throughnegative, cool, distanced (or even outright cynical)behaviors towards individuals, with whom the affectedperson maintains work-associated relations. Any problemspertaining to other people are perceived as justlydeserved, for which the said others should suffer consequences(Noworol, 2003, an unpublished manuscript).The phenomenon of burnout progresses with timeand is manifested in various ways in particular individuals.According to Maslach, the presented symptom isan increasing emotional exhaustion, followed by lossof satisfaction over one’s professional achievements. Inconsequence of the situation, the process of depersonalizationbegins – the affected person distances himselffrom specific stress posed by another human being(Noworol, 2000). Burned-out individuals are defi nedas persons manifesting the triad of the factors characteristicof the multi-dimensionally analyzed syndrome(Krawulska-Ptaszyńska, 1992).emotional exhaustion⇒ negative sense of professional achievements⇒ depersonalizationAccording to McConnell, the tri-dimensional burnoutsyndrome develops at three levels (McConnell,1982, in Noworol, 1989).Level 1:Mild, short-term symptoms that appear incidentally;– the symptoms may be relieved via relaxation or workbreaks.Level 2:The symptoms are intensifi ed and occur more regularly;– the typical strategies of symptom alleviation, suchas, for example, weekend rest and recreation, ceaseto be successful;– the recovery and ability of continued self-care requirean additional effort.Level 3:Continuous signals of burnout, physical and mentalproblems appear (depression, manic states);– any efforts directed towards relieving the symptomson one’s own are pointless;– any professional help does not provide an immediateeffect.Based on the theory developed by Maslach, Golembiewskidetermined a contrary direction of the burnoutpathway. In his opinion, depersonalization, also understoodas the effect of stress that leads to a lowered sensitivitythreshold, and in consequence to the developmentof distancing behaviors, is the first factor to appear. Thereaction of other fellow-workers to the increasing coolnessand distance in professional contacts with theaffected person with progressive burnout leads in the latterto a decreased sense of self-esteem and professionalachievements. As a result of intensified symptoms, theemployee starts to react in the emotional sphere, whichleads to emotional burnout (Noworol, 2000).depersonalization⇒ negative sense of professional achievements⇒ emotional exhaustionThe burnout process described by Maslach andGolembiewski may be schematically represented asa system of pathways that have reverse directions. Inview of this fact, these theories have been termed “facingtheories” (Noworol, 2000).The seemingly contrary theories have been combinedinto a comprehensive unity in the four-stage typologicalmodel of burnout that has originated from theeight-stage model developed by Golembiewski (Noworol& Marek, 1994).In the typological model (Fig. 6), the burnoutprocess includes four major stages: T0 (Unaffected byburnout), T1, T2, T3 (Burned-out), with the T1 and T2phases being complex. The progressive burnout processmay proceed along various paths that are specificfor a given individual (a micro-path), or a professionalgroup (a macro-path), which is depicted in Fig. 6. Thefacing theories constitute two separate paths in the fourstagemodel – the theory developed by Maslach describesthe burnout process in the so-called helping professions,while the solution proposed by Golembiewski explains theintensification of the syndrome chiefly in the managerialprofessions (Noworol, 2000).Polish studies on the phenomenon of burnout inteachers chiefly concentrate on analyzing the problemin relation to methods of coping with stress, somepersonality and temperament-associated determinants,
Acta Univ. Palacki. Olomuc., Gymn. 2004, vol. 34, no. 2 9sexual identity, social support, level of education offeredand type of school (public schools, special educationschools), sex, age, education, as well as the time of practicingthe profession (Krawulska-Ptaszyńska, 1992; Sęk,1994, 1996; Golińska & Świętochowski, 1998; Kliś &Kossewska, 1998; Przybyła, 1998; Mandal, 1999;Sekułowicz, 2002; Tucholska, 2003). Świętochowski(2001) investigated the effect of burnout on non-clinicalsomatic disorders among teachers. Tucholska (2003), inher cross-sectional study of general education schoolteachers(N = 256), included a variable of the subjecttaught; the number of investigated physical trainingteachers was N = 16. Using the concept developed byGolembiewski, she also proposed a sequence of increasingburnout symptoms in the studied group.The aim of the present report was to answer thequestion of how the burnout syndrome developed inphysical training teachers and to attempt to define themacro-path of burnout in teachers of this subject.Two hypotheses were formulated:In view of the specific character of their work, thepopulation of female and male physical training teachersmanifests the phenomenon of burnout.The course of the burnout macro-path among physicaltraining teachers is in agreement with the burnoutpath described by Maslach, the latter illustrates theprocess as occurring in social professions.METHODThe study employed the method of diagnostic pollingand was carried out between February and September,2003, among physical training teachers from variousCracow and Wieliczka schools (elementary, junior highand high), students of the Cracow Academy of PhysicalEducation (freshmen attending the post-baccalaureateextramural program, students of extramural courses)and participants of three post-grad courses for physicaltraining teachers organized by Province PostgraduateTraining Center for Teachers in Cracow and Nowy Sącz(N = 256; women N = 144, men N = 112).Among the respondents, the most numerous groupconsisted of physical training teachers employed byelementary schools (38.7%) in large urban centers(province capital – 72.3%, district towns – 19.1%, ruralareas – 8.6%). The mean age of the respondents was36.9 years, the mean duration of employment in schoolamounted to approximately 13 years (TABLE 4), withthe range of age and employment duration of 23–57 and1–40 years, respectively.To diagnose the burnout syndrome, the Maslach BurnoutInventory (MBI Form Ed.) was employed; the scalehad been adapted to Polish conditions by Noworol (1994;an unpublished manuscript). The MBI questionnaireallows for determining the level of burnout as a consequenceof chronic emotional stress in a work setting.The questionnaire consists of 22 statements groupedinto three subscales:• Emotional Exhaustion (EE) – 9 items;• Negative Sense of Professional Achievement (NSPA)– 8 items;• Depersonalization (DP) – 5 items.Using a seven-point scale, each responder determinesthe frequency of experiencing a given state. The scaleranges from 0 – never, to 6 – every day; the intermediatevalues denote the frequency of once/several times peryear, month, and week.The empirical material was analyzed using the varianceanalysis, the non-parametric U Mann-Whitney test(Ferguson & Takane, 1999), as well as the cluster analysis(the k-mean method of Mac Quin) (Noworol, 1987)and employing the SPSS/11 statistical software.RESULTSIn the investigated population of physical trainingteachers, the gender variable basically did not affectthe structure of the burnout phenomenon. Only inthe group of women was emotional exhaustion (EE)slightly more pronounced (p < 0.05) (TABLE 1). Themean values of the other dimensions (NSPA and DP)did not differ significantly.TABLE 1The burnout structure among female and male teachersof physical trainingFemales N = 144 Males N = 112MBI x – SD x – SD pEE 13.56 8.302 11.70 8.560 0.042NSPA 11.53 7.682 10.36 6.865 0.255DP 3.85 3.847 4.42 4.026 0.204EE – emotional exhaustion, NSPA – negative sense of professional achievement,DP – depersonalizationTABLE 2Burnout among physical training teachers – the clusteranalysisBurnout among physical training teachersCluster N % – x Me SD min maxI. 150 58.6 18.67 19.00 8.27 1 45II. 1 0.4 105.00 105.00 – 105 105III. 30 11.7 30.53 28.50 7.14 18 49IV. 6 2.3 44.33 44.50 8.64 30 54V. 69 27.0 44.14 42.00 10.60 29 74Total 256 100 27.86 26.00 15.14 1 105
10 Acta Univ. Palacki. Olomuc., Gymn. 2004, vol. 34, no. 2TABLE 3Burnout of physical training teachers – the statistical analysis of dimensions from the Maslach Burnout Inventory(MBI) within particular clusters (emotional exhaustion EE, negative sense of professional achievement NSPA, depersonalizationDP)MBI I. II.ClusterIII. IV. V. Totalx– SD – x SD – x SD – x SD – x SD – x SDEE 8.9 5.39 53.0 – 8.2 3.81 21.5 2.17 21.7 6.68 12.7 8.45NSPA 6.8 4.29 34.0 – 18.7 5.41 10.7 5.82 16.6 6.54 11.0 7.34DP 2.9 2.97 18.0 – 3.7 2.81 12.2 5.04 5.9 4.30 4.1 3.93TABLE 4Cluster description: gender, age and duration of employment among physical training teachersClusterFemalesGender Age Duration ofemploymentMalesN % N % x – SD x – SDI. 79 52.7 71 47.3 36.2 2.97 12.4 8.10II. 0 0 1 100 50.0 – 25.0 –III. 16 53.5 14 46.7 38.8 8.54 14.2 8.46IV. 4 66.7 2 33.3 33.0 7.18 7.3 4.84V. 45 65.2 24 34.8 37.5 7.82 12.9 7.50Total 144 100 112 100 36.9 7.86 12.7 7.97Subsequent statistical analyses allowed for definingfive clusters in the studied population (TABLE 2). Theclusters were homogenous with respect to burnout leveland they grouped individuals characterized by the sameburnout pattern, i.e. with similar values of the three dimensions:emotional exhaustion (EE), negative sense ofprofessional achievement (NSPA) and depersonalization(DP) (TABLE 3–4). In view of the fact that the burnoutprocess in female (N = 144) and male physical trainingteachers (N = 112) was similar (ANOVA, F = 0.881,p > 0.05), the variable of gender was disregarded infurther analyses.Among the respondents, 58.6% were found not tobe burned out (Cluster I; N = 150) (TABLE 2–3, Fig.1). Working with children was a clear source of satisfactionto this group of educators – their mean value ofthe negative sense of professional achievement dimension(x – I. NSPA = 6.8) was almost twice as low as themean value for the entire population (x – NSPA = 11.0).Characterized by a relatively low degree of burnout,these teachers were capable of maintaining the closestcontacts with their pupils – the mean value of the depersonalizationdimension DP (x – I. DP = 2.9) was thelowest in this cluster (TABLE 3).Clusters II and V (N = 70) grouped burned-outteachers (27.4%), who experienced symptoms of emotionalexhaustion and depersonalization, while clearlyderiving no satisfaction from their work. In the remainingteachers – Cluster III and IV (N = 36; 14.0%) theburnout syndrome was beginning to manifest itself indiverse ways (TABLE 2–3).Cluster II was a one-element cluster (TABLE2–4). Very high values of the three MBI dimensions:EE = 53.0, NSPA = 34.0 and DP = 18.0, proved a veryhigh, outright extreme burnout level in one respondent,a male teacher of a junior high school employed for 25years (Fig. 2).The population of physical education teachersgrouped in Cluster V was also characterized by highmean values of the triad of factors that together formedthe phenomenon of burnout. Considerable emotionalexhaustion was clearly seen (x – V.EE = 21.7) (TABLE 3).
Acta Univ. Palacki. Olomuc., Gymn. 2004, vol. 34, no. 2 11Fig. 1Graphic presentation of three burnout dimensions in Cluster I. N = 150 (emotional exhaustion EE, negative sense ofprofessional achievement NSPA, depersonalization DP)6050403020x cluster Ix total100EE NSPA DPFig. 2A graphic presentation of three burnout dimensions in Cluster II. N = 1 (emotional exhaustion EE, negative sense ofprofessional achievement NSPA, depersonalization DP)6050403020x cluster IIx total100EE NSPA DPFig. 3Graphic presentation of three burnout dimension in Cluster V. N = 69 (emotional exhaustion EE, negative sense ofprofessional achievement NSPA, depersonalization DP)6050403020x cluster Vx total100EE NSPA DP
12 Acta Univ. Palacki. Olomuc., Gymn. 2004, vol. 34, no. 2Fig. 4Graphic presentation of three burnout dimensions in Cluster III. N = 30 (emotional exhaustion EE, negative sense ofprofessional achievement NSPA, depersonalization DP)6050403020x cluster IIIx total100EE NSPA DPFig. 5Graphic presentation of three burnout dimensions in Cluster IV. N = 6 (emotional exhaustion EE, negative sense ofprofessional achievement NSPA, depersonalization DP)6050403020x cluster IVx total100EE NSPA DPThe fully developed syndrome manifested in this clusteris presented graphically in Fig. 3.Cluster III (N = 30) included teachers that, despitetheir low values of emotional exhaustion (x – III.EE = 8.2;x– EE = 12.7) and medium level of depersonalizationDP, were beginning to experience an absence of professionalachievements, gradually losing the sense ofvalue and usefulness of their work (x – III.NSPA = 18.7)(TABLE 3). These were individuals who were partiallyburned-out and progressing through subsequent phasesof burnout (Fig. 4).Cluster IV (N = 6) grouped teachers of physicaltraining who – with the progressing burnout process –experienced their first crisis in professional work. Theirmean duration of employment was approximately 7years and their mean age was 33 years (TABLE 4). Theteachers reacted to work-related stress with a high levelof emotional exhaustion (x – IV.EE = 21.5; x – EE = 12.7),which – at the moderate satisfaction level of their work(NSPA) – triggered clear depersonalization (TABLE3, Fig. 5). The mean value of the DP dimension(x – IV.DP = 12.2) was twice as high as compared to themean value characteristic of the population of burnedoutteachers from Cluster V and at the same time threetimes as high as the DP value in the population of nonburnedout teachers (Cluster I) (Fig. 3).Subsequently, based on the four-phase typologicalburnout model, an attempt was made to determine themacro-path of the burnout phenomenon that developedamong teachers of physical training (Fig. 6).The starting point for the progressive burnout processamong physical education teachers is the T0 phase– Cluster I, which is formed by individuals unaffected byburnout (N = 150) (Fig. 1). Subsequently, the T1 phasedenotes the process of a gradual increase of dissatisfactionand a loss of professional satisfaction, which – atlow values of emotional exhaustion – is accompaniedby intensifying symptoms of depersonalization, still
Acta Univ. Palacki. Olomuc., Gymn. 2004, vol. 34, no. 2 13Fig. 6Macro-path illustrating the course of burnout process in the studied population of physical training teachers (N = 256)plotted using the four-stage typological model with Maslach’s and Golembiewski’s pathsLegend: E – emotional exhaustion (EE); P – negative sense of professional achievement (NSPA); D – depersonalization (DP); a letter in subscript – a low level ofthe dimension; a letter in superscript – a high level of the dimension (Noworol, 2000)Fig. 7Macro-path illustrating the course of burnout process in the population of general education teachers (N = 256) plottedusing the four-stage typological modelLegend: E – emotional exhaustion (EE); P – negative sense of professional achievement (NSPA); D – depersonalization (DP); a letter in subscript – a low level ofthe dimension; a letter in superscript – a high level of the dimension (Noworol, 2000)
14 Acta Univ. Palacki. Olomuc., Gymn. 2004, vol. 34, no. 2maintained at a level that is somewhat lower than themean value for the investigated population (ClusterIII; N = 30) (Fig. 4). The next segment of the burnoutmacro-path in physical training teachers (the T2 phase)is unclear and requires further research. The final linkof the developing burnout process (the T3 phase) isCluster V (N = 69) (Fig. 3) that includes teachers characterizedby high values of all the three burnout dimensions.The epilogue of the macro-path determined in thetypological model is the one-element Cluster II (Fig. 2)that illustrates the extraordinary case of a male teacherwho experienced extreme burnout.Cluster IV (Fig. 5), treated in view of its low samplesize (N = 6) as a case study, was not included in themodel.DISCUSSIONThe population of physical education teachers employedin various schools (II–IV education level) depictsan interesting portrayal of the analyzed process. Witha relatively high number of burned-out teachers (N = 70;27.4%), a high percentage of the group is constituted byindividuals who have not experienced burnout (N = 150;58.6%). The results of studies carried out amonggeneral education teachers indicated a signifi cantlylower percentage of both non-burned out and burnedoutindividuals: Tucholska (2003) 20.7% and 32.8%(N = 256), Sekułowicz (2002) 6.6% and 13.8% (N = 99),Sęk (1996) 5.9% 1 and 14.3% (N = 119), respectively.Golińska & Świętochowski (1998) found no burnoutsymptoms in 15.4% of their sample (N = 395); at thesame time, more than 1/5 of the respondents indicateda considerable intensity and frequency of experiencingthe phenomenon. While performing self-evaluation,“(…) 19% of teachers assessed (…) their burnout levelas very high” (Przybyła, 1998, 18); 44% did not noticeany symptoms of the syndrome. Mandal (1999) signaledthe burnout syndrome symptoms as occurring in morethan one half of Polish teachers.The mean results of the analyzed group of physicaltraining teachers for particular dimensions – emotionalexhaustion (EE), negative sense of professionalachievements (NSPA) and depersonalization (DP) – aremarkedly lower as compared to the results obtained byTucholska (2003) 2 . Similar results were achieved instudies carried out in elementary (ES) and high school(HS) 3 teachers (Kliś & Kossewska, 1998). This suggeststhat the intensity of burnout is lower among physicaltraining teachers.The variable of gender basically does not play a differentiatingrole in the phenomenon of burnout amongphysical training teachers. The process of syndromeintensifi cation among females and males (the clusteranalysis) has a similar course (ANOVA, F = 0.881,p > 0.05); the analysis of burnout structure indicatesonly a slightly higher level of emotional exhaustionamong female physical training teachers (p < 0.05)(TABLE 1). A tendency towards more pronouncedpsychophysical and emotional exhaustion in femaleteachers was defined as a trend (p < 0.056) by Tucholska(2003).The above quoted results allow for cautious concludingthat physical training teachers as a professionalgroup do not experience negative effects of specifi cstress to the same degree as other teachers do. Whenyoung, the majority of physical training teachers wereinvolved in sports, although not necessarily at the highestlevel. Personality traits that differentiate betweensportspeople and non-sportspeople include extraversion,self-assurance, high motivation towards achievements,low anxiety level and a strong, healthy nervous system;all these factors in combination play a decisive role inresistance to stress (Czajkowski, 1996).A higher level of mental stamina is associated witha better ability to cope with stressful situations; highlyreactive individuals were found to be more susceptibleto burnout (Marek, 1993; Noworol & Marek, 1994, inDworzańska, 1999). Highly reactive teachers clearly deriveless satisfaction from working in schools (Golińska& Świętochowski, 1998). The sense of work-associatedsatisfaction among teachers is at the same time directlydependent on extraversion (Kliś & Kossewska, 1998).The more dynamic character of physical traininglessons and the possibility of conducting them in enclosed(a gym, body-building shop and others) and inopen spaces (a sports field, open terrain) exclude monotony.The ability of the teacher to join the students(participation in exercises or games, etc.) – in spite ofhis mentally and physically cumbersome work – allowshim to alleviate stress to a degree. Recreation at leisure,in touch with Nature, sports and mountain climbing(to which teachers of physical training seem to be predisposed)decrease the risk of burnout (Kwiatkowski,1993; Sęk, 1994).In comparison to general education teachers, theburnout phenomenon among teachers of physical trainingis relative more extensive – 27.4% of the investigatedgroup consisted of burned-out individuals. The syndromeoften affects highly motivated people, who have givenpriority to their career over other values (Paines, 1993;Schaufeli & Enzmann 1998, in Tucholska, 2003). Thehigh level of motivation and competitiveness, characteristicof sportspeople (Czajkowski, 1996) may accelerate1calculated based on data presented in TABLE 3.7, page 52 (Sęk, 1996)2EE = 12.7 and 21.07; NSPA = 11.0 and 14.52; DP = 4.10 and 6.41, respectively3ES and HS – EE = 13.9 and 20.9; NSPA = 31.5 and 27.6; DP = 5.7 and 8.0, respectively
16 Acta Univ. Palacki. Olomuc., Gymn. 2004, vol. 34, no. 23. The gender variable basically does not affect theburnout process among teachers of physical training;female teachers have manifested only a slightlyelevated level of emotional and psychophysical exhaustion(p < 0.05).4. Both the extent and the depth of the burnout phenomenonare lower among teachers of physical trainingas compared to teachers of general subjects.5. The fi rst reaction of physical training teachers tospecifi c stress is their gradual loss of the sense ofcompetence and satisfaction derived from theirwork.In order to determine the macro-path of burnout inphysical training teachers, further studies conducted ona larger sample are necessary. In such investigations thegeneral typological model of burnout among staffers inorganizations (Noworol, in press) will be helpful. In thiscase, while statistically analyzing the material, it will benecessary to distinguish a larger group of homogenousclusters.A complete analysis of the process of physical trainingteachers’ burnout will allow for adopting preventivemeasures. An appropriately composed teachingsyllabus, mostly with respect to the methodology ofteaching subjects, as well as well-designed postgraduateworkshops addressed to young teachers should alleviatethe stress associated with the situation, conditions andexpectations of their work environment, thus delayingthe development of the syndrome.REFERENCESBańka, A. (2000). Psychologia pracy. In J. Strelau(Ed.), Psychologia podręcznik akademicki, tom 3(pp. 283–320). Gdańsk: Gdańskie WydawnictwoPsychologiczne.Czajkowski, Z. (1996). Psychologia sprzymierzeńcemtrenera. Warszawa: COS.Dworzańska, M. (1999). Podmiotowe uwarunkowaniasyndromu wypalenia zawodowego. Roczniki Naukowo-DydaktyczneAkademii Pedagogicznej w Krakowie.Prace Psychologiczne, 7, 115–126.Ferguson, G. A., & Takane, Y. (1999). Analiza statystycznaw psychologii i statystyce. Warszawa: PWN.Golińska, L., & Świętochowski, W. (1998). Temperamentalnei osobowościowe determinanty wypaleniazawodowego u nauczycieli. Psychologia Wychowawcza,5, 385–398.Kliś, M., & Kossewska, J. (1998). Cechy osobowościnauczycieli a syndrom wypalenia zawodowego. PsychologiaWychowawcza, 2, 125–140.Krawulska-Ptaszyńska, A. (1992). Analiza czynnikowawypalenia zawodowego u nauczycieli szkół średnich.Przegląd Psychologiczny, 3, 403–410.Kwiatkowski, P. (1993). Stres zawodowy pedagogaresocjalizacyjnego; niektóre aspekty profilaktyki naetapie przygotowania do pracy. Szkoła Specjalna, 4,147–157.Mandal, E. (1999). Syndrom wypalenia zawodowegoa tożsamość płciowa nauczycielek. Psychologia Wychowawcza,1, 27–33.Maslach, C., & Jackson, S. (1986). The Maslach BurnoutInventory (2 nd ed). Paolo Alto, CA: ConsultingPsychologist Press.Maslach, C., & Leiter, M. P. (1997). The Truth AboutBurnout. San Francisco: Jossey-Bass Publishers.Niegowska, W. (2003). Przyczyny zniechęcające nauczycieliwf do wykonywania zawodu. WychowanieFizyczne i Zdrowotne, 1, 29–35.Noworol, C. (1994). Adaptacja do warunków polskichkwestionariusza wypalenia zawodowego. Maslach BurnoutInventory (MBI) [An unpublished manual].Noworol, C. (1989). Analiza skupień w badaniach empirycznych.Rozmyte modele hierarchiczne. Warszawa:PWN.Noworol, C. (in press). Proces wypalania się kadr w organizacjach.Noworol, C. (1987). Zarys analizy skupień. Niehierarchicznei hierarchiczne techniki skupiania. In J.Brzeziński (Ed.), Wielozmiennowe modele statystycznew badaniach psychologicznych (pp. 185–190).Warszawa – Poznań: PWN.Noworol, C. (2000). Zarządzanie wypaleniem czy wypaleniezarządzania. Zespół wypalenia zawodowegoIn T. Borkowski, A. Marcinkowski, & A. Oherow-Urbaniec (Eds.), W kręgu zarządzania. Spojrzeniemultidyscyplinarne (pp. 47–62). Kraków: KsięgarniaAkademicka.Noworol, C. (1998) Zespół wypalenia zawodowegou pielęgniarek pracujących na zmiany. In I. Iskra-Golec, G. Costa, S. Folkard, T. Marek, J. Pokorski,& L. Smith (Eds.), Stres pracy zmianowej. Przyczyny,skutki, strategie przeciwdziałania (pp. 213–226).Kraków: Universitas.Noworol, C., & Marek, T. (1994). Typology of Burnout:Methodology modelling of the syndrome. PolishPsychological Bulletin, 24(4), 319–326.Przybyła, H. (1998). Psychologiczne koszty zespołu wypaleniazawodowego wśród nauczycieli a kierunkipomocy psychologicznej. In T. Rogozińska, W. Gaida,& U. Schaarschmidt (Eds.), Zdrowie psychicznew zawodzie nauczycielskim (pp. 15–21). Zielona Góra– Potsdam.Sekułowicz, M. (2002). Wypalenie zawodowe nauczycielipracujących z osobami z niepełnosprawnościąintelektualną. Przyczyny – symptomy – zapobieganie– przezwyciężanie. Wrocław: UW.Sęk, H. (1994). Wypalenie zawodowe u nauczycieli.Społeczne i podmiotowe uwarunkowania. In J.
Acta Univ. Palacki. Olomuc., Gymn. 2004, vol. 34, no. 2 17Brzeziński, & L. Witkowski (Eds.), Edukacja wobeczmiany społecznej (pp. 325 - 343). Poznań – Toruń:Edytor.Sęk, H. (Ed.). (1996). Wypalenie zawodowe psychologicznemechanizmy i uwarunkowania. Poznań: ZakładWydawniczy K. Domke.Świętochowski, W. (2001). Wypalenie zawodowe a dolegliwościsomatyczne u nauczycieli. Acta UniversitatisLodziensis. Folia Psychologica, 5, 95–109.Tucholska, S. (2003). Wypalenie zawodowe u nauczycieli.Poznań: KUL.Van Harrison, R. (1987). Indywidualno-środowiskowedopasowanie a stres w pracy. In G. L. Cooper& R. Payne (Eds.), Stres w pracy (pp. 260–305).Warszawa: PWN.První reakcí učitelů tělesné výchovy na specifický stresje ztráta profesionální satisfakce. Nepodařilo se přesněstanovit proces, v němž k rozvoji syndromu vyhořeníu učitelů tělesné výchovy dochází. Vysvětlení chybějícífáze T2 v tomto procesu by vyžadovalo výzkum většíhorozsahu.Klíčová slova: vyhoření, učitel tělesné výchovy.Dr. Maria BrudnikSYNDROM VYHOŘENÍU UČITELŮ TĚLESNÉ VÝCHOVY –– PROCES ROZVOJE SYNDROMU(Souhrn anglického textu)Výzkum byl realizován v období únor až září 2003mezi učitelkami a učiteli tělesné výchovy v Krakově,Wieliczce, mezi posluchači I. ročníku AWF (SUM;dálkové studium) a účastníky tří kurzů odbornéhovzdělávání (N = 256). K diagnóze syndromu byl využitdotazník MBI Maslach. Empirický materiál byl zpracováns použitím analýzy variance, neparametrickéhotestu významnosti rozdílů a klastrové analýzy.Více než polovina učitelů tělesné výchovy vevýzkumném vzorku (58,6 %) nepociťuje vyhoření,pedagogové, u nichž se tento syndrom objevuje, tvoří27,4 %. Proměnná pohlaví obecně vzato rozvoj syndromuneovlivňuje. Rozsah stejně jako hloubka vyhořeníjsou nižší ve srovnání s učiteli všeobecného vyučování.Academyof Physical Educational. Jana Pawła II 7831-571 KrakówPolandEducation and previous work experienceEducation: Bronisław Czech Academy of Physical Education,Cracow.Previous work experience:1978–91 teacher of physical training, elementary school,Cracow.Since 1989 Chair of Physical Education Theory andMethodology, Bronisław Czech Academy of PhysicalEducation, Cracow.First-line publicationUntil now published 17 articles and research studies inPoland.
Acta Univ. Palacki. Olomuc., Gymn. 2004, vol. 34, no. 2 19POSTURE ASSESSMENT IN CHILDREN OF THE SCHOOL AGE GROUP(7–15 YEARS OF AGE) IN THE OLOMOUC REGIONMiroslav KopeckýPedagogical Faculty, Palacký University, Olomouc, Czech RepublicSubmitted in February, 2004Within the framework of anthropological research, the diagnosis of posture using the Jaroš & Lomíček somatoscopicmethod (1957) was carried out in a set of 1201 children of school age as well as foot arch assessment using plantogramsas suggested by Klementa (1987). The posture assessment results imply a continuing unfavorable trend of functionaldisorders of the locomotive system in the present childhood population. Defective posture has been diagnosed in 56%of boys and 37% of girls. The author finds the main cause of the defective posture in the occurrence of muscular dysbalances,namely the upper and lower crossed syndromes. The posture disorders manifest themselves in keeping thehead stuck forward, round shoulders, shoulder blades standing out, high pelvis inclination accompanied with lumberlordosis, and in many cases with loose abdominal muscles.The condition of the foot arch is relatively satisfactory, as the normal foot arch has been found in 85% of theprobands.Keywords: School age group, posture, somatoscopic method, defective posture, muscular dysbalances, foot arch, Olomoucregion.INTRODUCTIONThe increasing occurrence of defective posture accompaniedby the insufficient fitness of present childrenand teenagers cannot leave us unconcerned, consideringthe fact that if not diagnosed and rectified in time, thesedefects can lead to serious disorders requiring medicaltreatment. Naturally, the defects of statics, dynamics anddefective posture have also appeared in the past, but thepresent occurrence is substantially higher. This negativetrend is mentioned in studies by Riegerová et al. (1993),Přidalová (1997), Jankovská (1998), and Kolisko andJandová (2002). According to Kubát (1975), defectiveposture in school age children appears in 50% of thepopulation and Picek (1986) states that defective posturecan be found in 85% of our children. The increasingnumber of children with defective posture, spinal disorders,small deformations and bad locomotive stereotypesis probably in relationship not only to the acceleration ofgrowth and development of the present population, butalso with an insufficient amount of movement stimuli,excessive static stress, or one-sided and improper bodyload, tiredness, excessive sitting and at last but not leastwith psychological stress. The conditions that influenceor cause defective posture do not affect children separatelybut they mingle and influence one another, whichallows us to speak about multifactorial agents.The mechanical understanding of the origin of defectiveposture has become a thing of the past. At present,we understand defective posture as a manifestation ofa certain muscular dysbalance. Muscular dysbalancesappear between two basic groups of skeletal musclesthat may be found on the front as well as the rear partof the human body. From this point of view, we differentiatetonic muscles (postural, antigravitational), thatfunction more statically with prevailing isometric contraction,and phasic muscles (phasic, locomotive) withprevailing dynamic function accompanied by isotoniccontraction. The origin of muscular dysbalance oftenmanifests itself in, and is also more or less accompaniedby, defects of locomotive stereotypes. The most seriouschange occurring in muscular dysbalance is muscularshortening. The static and dynamic functions of thelocomotive system are caused by the imbalance of thepostural muscle that tends to stiffen and phasic musclethat tends to slacken. If the hypertrophic posturalmuscles overwhelm the phasic muscles that tend toslacken the respective part of the body, it is affectedby the defective posture. The most frequent types ofslackness result from muscular dysbalances. Musculardysbalances most often occur: in the area of the pelvisand lower limbs (important regarding static function),in the area of the upper trunk, neck and head, and inthe area of the lower limbs. Defective posture is characterizedby the absence of morphological changes inthe skeleton, and it is important that defective postureand its deviations may be rectified by deliberate effort.Therefore, the primary disorder is that of the neuromuscularsystem and central nervous system. Whendiagnosing muscular dysbalances and deviations from
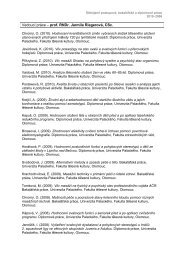
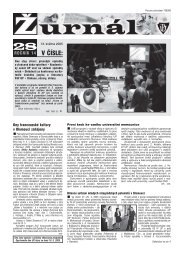
20 Acta Univ. Palacki. Olomuc., Gymn. 2004, vol. 34, no. 2upright posture in a child, it is necessary to begin withits rectification. Unfavorable phenomena can be local orhave overall effects. Without rectification of the resultingmuscular dysbalances and bad locomotive stereotypes,pathogenic stimuli can cause the deterioration of balanceand, in the long term, can lead to changes in thetissue structure. In maturity, they manifest themselves aspainful vertebrogenic syndromes. Kolisko and Jandová(2002) point out that, at the present time, approximately70% of the mature population suffer from vertebrogenicdisorders.Upright posture assessment has theoretical as wellas practical significance. In practice, we have to assessposture in order to have an objective monitoring ofthe habit of upright posture, to classify pupils whenassigning them to remedial physical training programs,to evaluate the effectiveness of the remedial physicaltraining programs and to differentiate upright posturefrom deviations. Anthropometrical methods used for theassessment of monitoring of general growth and developmentof children are not fully sufficient for postureassessment. Ideal posture appears rarely and the transitionbetween upright posture and defective posture,as pointed out by Novotná and Kohlíková (2000), issmooth and often hard to define.Teachers, trainers, occupational therapy assistants,etc. need to know, at least in general, what is the stateof postural and phasic muscles involved in keepingposture correct.To be able to find the results of our posture improvementactivities, we have to assess the initial state of thechild’s posture expressed if possible in exact numbers.Lots of various methods have been developed tomeasure the quality of posture keeping: siluetographic,photographic, X-ray pictures, plaster casts, pantographicmethods (tracing the body silhouette with appropriatereduction on a paper), goniometric methods (usinggoniometers with gravitation protractors).Many examinations make use of instruments, but itis not always easy to carry them out in usual school practiceor remedial physical training programs. Thereforewe are satisfied with these practical and most often usedsimple methods based on visual observations – somatoscopicmethods – assessment of posture, general bodybuild and individual body parts, plus the shape of thespine and foot arch.METHODSThis study is a result of a research project whichforms a part of the Research Framework MSM154100020 “Research on the Somatic and PsychologicalState of the Czech Population with Applications inAnthropagogy, Pedagogical Psychology, Clinical Anthropologyand Ergonomics” for the period 1999–2003,carried out by the Department of Anthropology andHygiene of the Pedagogical Faculty of Palacký University,Olomouc.Within the transversal anthropological survey atseven primary schools of the Olomouc region in theperiod 2001–2002, the assessment of posture and footarches was carried out on 1201 probands (621 boys and580 girls) aged 7 to 15 years. For technical reasons,we chose the Jaroš and Lomíček (1957) somatoscopicmethod of posture assessment based on the evaluationof individual body parts, which is also recommended asthe most suitable by Přidalová (1997) who carried outher own survey of children in Olomouc, as well as byVařeková and Vařeka (1995).This method is easy, not time consuming, cheap,workable, with relatively maximum accuracy – i.e.results with minimum errors. Assessment is focusedon the following body parts: head and neck posture,thorax posture, abdomen posture with pelvis inclination,curve of the back, posture in the frontal plane, and assessmentof the lower limbs. Each assessed body partwas evaluated with a mark from 1 to 4. The foot archstate diagnostics were carried out using plantogramsin accordance with the Klementa (1987) method. Asa part of the survey, the examined children answereda questionnaire on their life style that brought informationon back pain during the day and pain in the areaof the spine where it occurs most often.For numeric processing of the results of postureevaluation and the questionnaire, we used mathematicalstatistics methods and Statgraphics Version 5 software.The statistical level of significance, so called Pearson’scorrelation coeffi cient, was used to fi nd out the relationshipbetween the age and the posture of probandsin particular age groups. The testing was on the 0.05significance level.RESULTS AND DICUSSIONThe results of the posture assessment of boys andgirls of school age, as for distribution and percentage ofoccurrence, do not imply a positive trend (TABLE 1, 2and Fig. 1, 2). For both sexes of all age groups, perfectposture occurs only sporadically. Perfect posture wasonly found in 5 boys and 6 girls. Very bad posture wasnot found in girls, only in one twelve-year old boy. Themost frequent categories are: II – nearly perfect postureand III – defective posture.From the results, the inter-sexual differences betweenthe posture of boys and girls are obvious (TABLE 1, 2).Girls of all age groups have better posture than boys ofthe same age. In category II – nearly perfect posture,there are 43.16% boys and 62.07% girls. In category III– defective posture, the relationship is inverse – 56%boys and 36.90% girls. The achieved results are in cor-
Acta Univ. Palacki. Olomuc., Gymn. 2004, vol. 34, no. 2 21TABLE 1Boys’ posture within individual age groupsCategory Iperfect postureCategory IInearly perfect postureCategory IIIdefective postureCategory IVvery bad postureAge nn % n % n % n %7 67 1 1.49 22 32.84 44 65.67 0 08 64 0 0 37 57.81 27 42.19 0 09 64 0 0 34 53.12 30 46.88 0 010 83 0 0 29 34.94 54 65.06 0 011 73 1 1.37 35 47.95 37 50.68 0 012 78 0 0 24 30.77 53 67.95 1 1.2813 68 0 0 26 38.24 42 61.76 0 014 67 1 1.49 31 46.27 35 52.24 0 015 57 2 3.51 30 52.63 25 43.86 0 0Total 621 5 0.80 268 43.16 347 55.88 1 0.16Fig. 1Boys’ posture within individual age groups80%7060504030201007 8 9 10 11 12 13 14 15ageCategory I - perfect posture Category II - nearly perfect postureCategory III - defective posture Category IV - very bad posturerelation with data presented by Riegerová et al. (1993),Štěpnička (1976), Kristiníková and Dobešová (1998).Riegerová et al. (1993) states the results of a posturesurvey of pupils aged 10 to 14 years within the semilongitudinalresearch carried out at Olomouc schoolsin the period 1985 to 1990.Following posture assessment in accordance with theJaroš and Lomíček method (1957), only one probandwas ranked within the category I – perfect posture, onequarter of the probands (26.4%) came under category II– nearly perfect posture and defective posture was foundin nearly three quarters of the set (72.7%). Štěpnička
22 Acta Univ. Palacki. Olomuc., Gymn. 2004, vol. 34, no. 2TABLE 2Girls’ posture within individual age groupsCategory Iperfect postureCategory IInearly perfect postureCategory IIIdefective postureCategory IVvery bad postureAge nn % n % n % n %7 65 1 1.54 39 60 25 38.46 0 08 73 0 0 42 57.53 31 42.47 0 09 65 4 6.15 36 55.38 25 38.47 0 010 63 1 1.59 41 65.08 21 33.33 0 011 70 0 0 45 64.28 25 35.72 0 012 76 0 0 54 71.10 22 28.90 0 013 66 0 0 37 56.04 29 43.96 0 014 42 0 0 25 59.52 17 40.48 0 015 60 0 0 41 68.33 19 31.67 0 0Total 580 6 1.03 360 62.07 214 36.90 0 0Fig. 2Girls’ posture within individual age groups80%7060504030201007 8 9 10 11 12 13 14 15ageCategory I - perfect postureCategory II - nearly perfect postureCategory III - defective posture(1976) in his representative set found out that no boyand only 2% of the girls came under category I, 41%of the boys and 48% of the girls in category II – nearlyperfect posture, 53% of the boys and 46% of the girlsin category III – defective posture, and 6% of the boysand 5% of the girls came under category IV – very badposture. Very bad posture was not found in any pupiland the inter-sexual difference implied slightly betterposture in girls. Kristiníková and Dobešová (1998)found in the same age groups that nearly 60% of theboys had defective posture and boys had worse posturein comparison with girls.On the contrary, it does not support the resultspresented by Přidalová (1997), who evaluated posturein Olomouc children aged 6–10 years. Přidalová (1997)found better posture in boys in all measured categoriesin comparison with girls. An unfavorable developmentregarding the state of posture is also found by
24 Acta Univ. Palacki. Olomuc., Gymn. 2004, vol. 34, no. 2Fig. 4The curve of the back in girls in particular age groups90%807060504030201007 8 9 10 11 12 13 14 15agenormal back round back flat backposture varies from 29% at 12 years of age to the highestpercentage found at the age of 13 with 44% of girls.For more detailed information on the relationshipbetween age and posture, the statistical level ofsignificance was analyzed using the Pearson’s correlationcoeffi cient to fi nd out the relationship betweenthe dependence between the two quantities. Testingwas carried out at the statistical level of signifi canceof 0.05. The calculated correlation coefficient, used fortesting each age group of a certain sex in relationship toparticular posture categories, did not confirm a significantrelationship between the age group and the posturecategory. Posture in boys and girls within this age rankprobably does not depend on age.When examining posture, we also evaluated theposture of individual body parts in sagittal and frontalplanes. In the sagittal plane, the thorax spine archwas evaluated within three levels: the spine is slightlykyphotic = normal back, the spine shows slight deviationsand significant bending in this part = round back(this group includes probands whose curve of the backwithin the thorax part is evaluated by the degree of 2, 3or 4 in accordance with the Jaroš & Lomíček method),and with a lack of normal curve = flat back. The assessmentof the thorax spine curve is shown in TABLE 3and Fig. 3, 4.The high percentage of round backs found in nearly53% of boys and 75% of girls imply the occurrence ofmuscular dysbalances in this area that is called “uppercross syndrome” in the literature. Janda (1982) describesthis syndrome as a typical occurrence of muscular dysbalancesbetween the shortened postural muscles onthe front side of the thorax (major pectoral and minorpectoral muscles), and on the rear side of the thorax,the slackened phasic muscles, namely shoulder blademuscles (trapezius, rhomboid muscles), back musclesand trunk erectors and also between deep neck flexorson one side and neck extensors on the other side. Theseresults in keeping the head forward, keeping shouldersraised and stuck forward and the abduction locomotivestereotype in the shoulder joint is negatively affected.To a certain extent, this fact is supported by the findingof outstanding shoulder blades as a consequence of theabove-mentioned slackening of shoulder blade musclesthat was found in 84% of boys and 67.4% of girls.The high percentage of round backs in girls is causedby a kind of shyness connected with the period of adolescenceand the growth of breasts, which is evidencedby a gradual increase in the occurrence of round backsin girls within the age group of 12 to 15 years.The assessment of the curve of the back in the sagittalplane using the tangent let fall from protuberantiaoccipitalis shows the depth of the bend in the areaof the cervical and lumbar lordosis. In probands notranked within the category I – perfect posture, thedepth of the cervical and lumbar lordosis varied withinthe limits stated by Srdečný et al. (1982) and Kryštofič(2000). In this category, the cervical lordosis variedwithin 2.5–3 cm and the lumbar lordosis within 3–3.5 cm.Probands ranked within the category II – nearly perfectposture and had an average depth of cervical and lumbarlordosis within 4 to 5 cm. The largest depth of thecervical and lumbar lordosis was found in category III– defective posture. For both sexes, the average depth
26 Acta Univ. Palacki. Olomuc., Gymn. 2004, vol. 34, no. 2Fig. 5Occurrence of scoliotic posture in boys%807060504030201007 8 9 10 11 12 13 14 15scoliotic posture yesscoliotic posture noageFig. 6Occurrence of scoliotic posture in girls80%7060504030201007 8 9 10 11 12 13 14 15agescoliotic posture yes scoliotic posture noThe slightly decreasing occurrence of scoliotic postureis obvious from 7 to 15 years, with the deepest dropbetween 14 and 15 years of age (TABLE 4 and Fig. 5,6). It may be caused by the fact that back and abdomenmuscles of the muscle corset get stronger in the adolescenceperiod. Scoliotic posture symptoms in someprobands were so signifi cant that we could diagnoseidiopathic scoliosis.Rychlíková (1997), Lewit (1996), Novotná andKohlíková (2000) characterize scoliosis as a deflectionof the spine on the frontal plane caused by the rotationof vertebrae around their longitudinal axes when thestress changes result in their deformation and structuralchanges. Unlike scoliotic posture, scoliosis cannot beremoved by active muscle exercises. Probands witha suspected occurrence of scoliosis received a recommendationto go see the orthopedics specialist. It issurprising that probands with apparent symptoms ofscoliosis had not been to see orthopedics specialists,their parents did not show any concern nor did theyeven notice that their child did not have correct postureand even did not know about this possible defect at all.By way of illustration, in 81% of boys, uneven height ofshoulders was found (right shoulder higher in 45.8%,left shoulder higher in 35.1% of boys), in girls the asymmetryof shoulders was found in 72.1% of evaluated
Acta Univ. Palacki. Olomuc., Gymn. 2004, vol. 34, no. 2 27TABLE 5Lower limbs assessment in boys and girlsLower limbsNormal Varus Valgusn % n % n %Boys 590 95.00 25 4.00 6 1.00Girls 529 91.20 15 2.59 36 6.21Fig. 7Lower limbs assessment in boys and girls100% 9080706050403020100boysnormal varus valgusgirlsprobands (right shoulder higher in 38%, left shoulderhigher in 34.1% of girls).In probands with scoliotic posture, the uneven heightof the paravertebral muscle groups occurred regularly;the muscles were unevenly dislocated at the both sidesof the spine, when a boy or a girl gradually bent forwardand then unbent from a deep forward bend. The forwardbend or following unbending was frequently accompaniedwith turning the trunk to the side.Scoliotic posture was found in all probands witha flat back, where the physiological spine bend was notapparent. A fl at back was found in 44 boys, i.e. 7.1%and in 62 girls, i.e. 10.7% of the sample. A fl at backappeared especially in asthenic probands with generalmuscle slackness.The flat back, as stated by Srdečný et al. (1982), respectivelyflat spine, has lower resistance against higherloads. The flat spine efforts to balance the load exertedon it and this can result in lateral deflection. Srdečný etal. (1982) attracts attention to the dangerous combinationof a fl at back and scoliotic posture as the lowestdegree of scoliosis, i.e. a serious defect manifestingitself in changes of structure, rotation and the shape ofvertebrae and their deformities.The last area of posture assessment in accordancewith the Jaroš and Lomíček method (1957) is the evaluationof the lower limbs. Unlike the previous areas, thisevaluation brings much better results. Normal postureof lower limbs was found in 590 (95%) boys and 529(91.2%) girls. Valgus posture of limbs was found in 1%of boys and 6.21% of girls. Varus posture of limbs occurredin 4% of boys and 2.59% of girls (TABLE 5 andFig. 7).Together with the posture assessment, the foot archwas evaluated in accordance with the method stated byKlementa (1987). The results imply that in boys, a normalfoot arch occurs in the right foot in 84.4% and inthe left foot in 84.3% of probands, flat foot occurs in theright foot in 10.1% of cases and in the left foot in 7.5%of the cases and a high foot arch was found in the rightfoot in 5.5% and in the left foot in 8.2% of boys. In girls,a normal foot arch was found in the right foot in 85.5%and in the left foot in 84.4% of girls. In comparison withboys, girls had a lower number of flat feet, 2.8% in theright foot and 3.3% in the left foot, and a higher numberin the high foot arch, 11.7% in the right foot and 12.3%in the left foot.In the questionnaire asking about the health conditionof the spine, the question “Does your back hurtduring the day?” was answered “Yes” by 5.7% of theboys and by 9.5% of the girls. Occasional pain occursin 30.3% of the boys and in 42.8% of the girls. The secondquestion, “In which part of the spine does the painoccur most often?”, was answered “cervical spine” by10% of the boys and 18.9% of the girls, “thorax spine”by 11.5% of the boys and 13.3% of the girls and “lumbarspine” by 18.7% of the boys and 19.1% of the girls.Generally, the above results of the posture assessmentof Olomouc boys and girls confirm an unfavourabletrend. The assessment results imply that 57% ofboys and 37% of girls with defective posture should attendsome remedial training programs. However, sucha remedial training program is not offered at any of theseven schools where the survey was carried out, whichis a very surprising finding.CONCLUSIONThe above results and the presented data from literaturesuggest that the occurrence of defective posture isvery high in the present-day school age population. Theassessment results imply that:1. Defective posture appears in 57% of boys and 37% ofgirls in the age group 7–15 years.2. The main reason for the defective posture is musculardysbalance, the so-called upper cross syndromeand lower cross syndrome manifested in keeping thehead stuck forward, a round back, outstanding shoulderblades, high pelvis inclination accompanied with lumbarlordosis, and in many cases with loose abdominalmuscles.3. Scoliotic posture was found in 69% of boys and 62%of girls. A typical example of this functional disease isthe uneven height of the shoulders and shoulder blades,
28 Acta Univ. Palacki. Olomuc., Gymn. 2004, vol. 34, no. 2uneven thorax-abdominal triangles, lateral spine curvedeflection and unevenness of the paravertebral musculargroup profiles.4. The occurrence of defects in lower limbs is very low.Normal positioning of lower limbs was found in 95% ofthe boys and 91.2% of the girls. The right foot arch wasfound in approximately 85% of both boys and girls. Boyshad flat foot more often than girls. On the contrary, girlsmore often had high foot arch than boys.5. No remedial training program was offered at any ofthe schools where the survey was carried out, althoughthe occurrence of defective posture is high.The high occurrence of functional disorders ofthe locomotive system is alarming. It is necessary tobe aware of the fact that defective posture cannot beimproved at lessons of physical training or by pupils’activities in their free time, leaving the development ofthe posture only to natural evolution. This is very unreliableas the children of the present generation tend tohypomobility accompanied by a high intensity of a staticphysical load in sitting.However, it is not possible to see only the bad stateof things. It is necessary to emphasize that defectiveposture causes disorders of static and dynamic locomotivestereotypes, which results in overloading of the supportive-locomotivesystem and its functional disordersthat may lead to pain and higher muscular tension, andlater even to morphological disorders. Defective postureis not only an aesthetic disorder but also the cause ofvertebrogenic difficulties that are the cause of an incapacityto work at the productive age.REFERENCESČermák, J., & Strnad, P. (1976). Tělesná výchova přivadném držení těla. Praha: Avicenum.Čermák, J., Chválová, O., Botlíková, V., & Dvořáková,H. (2000). Záda už mě nebolí. Praha: Jan Vašut.Janda, V. (1982). Základy kliniky funkčních hybnýchporuch. Brno: Ústav pro vzdělávání SZP.Jankovská, Ž. (1998). Držanie tela žiakov 5.–8. ročníkaZŠ. Bulletin Slovenskej antropologickej spoločnosti přiSAV, 1, 52–54.Jaroš, M., & Lomíček, M. (1957). Návrh zjednodušenéhohodnocení postavy žáků všeobecně vzdělávací školy.Tělesná výchova mládeže, 5, 23, 197–203.Klementa, J. (1987). Somatometrie nohy. Praha: Státnípedagogické nakladatelství.Kolisko, P., & Jandová, D. (2002). Integrační přístupyv hodnocení vlivu inadekvátní tělesné zátěže nazměny tvaru a funkce páteře. In Diagnostika pohybovéhosystému – metody vyšetření, primární prevence,prostředky pohybové terapie. Sborník V. mezinárodníkonference v oboru funkční antropologie a zdravotnítělesné výchovy (pp. 56–65). Olomouc: UniverzitaPalackého.Kristiníková, J., & Dobešová, P. (1998). Využití velkéhomíče jako alternativní sedací plochy u dětí s vadnýmdržením těla. Bulletin Slovenskej antropologickejspoločnosti při SAV, 4, 88–92.Krištofič, J. (2000). Gymnastika pro kondiční a zdra votníúčely. Praha: ISV.Kubát, R. (1975). Ortopedie praktického lékaře. Praha:Avicenum.Lewit, K. (1996). Manipulační léčba v myoskeletálnímedicíně. Heidelberg – Leipzig: J. A. Barth.Liba, J. (2000). Výchova k zdraviu a pohyb. Prešov:FHV UP.Novotná, H., & Kohlíková, E. (2000). Děti s diagnózouskolióza. Praha: Olympia.Picek, F. (1986). Přístroj pro objektivní hodnocení drženítěla dětí a dorostu. Bratislava: Obzor.Přidalová, M. (1997). Držení těla u olomouckých dětímladšího školního věku. In Diagnostika pohybovéhosystému – metody vyšetření, primární prevence,prostředky pohybové terapie. Sborník III. celostátníkonference v oboru funkční antropologie a zdravotníTV (pp. 66–70). Olomouc: Univerzita Palackého.Riegerová, J. et al. (1993). Antropologické aspektyvývoje dětí na školách různého zaměření. Tělesnákultura, 24, 97–103.Rychlíková, E. (1985). Skryto v páteři. Praha: Avicenum.Rychlíková, E. (1997). Manuální medicína. Průvodce diagnostikoua léčbou vertebrogenních poruch. Praha:MAXDORF s.r.o.Srdečný, V. (1982). Tělesná výchova zdravotně oslabených.Praha: Státní pedagogické nakladatelství.Škvára, F., & Srdečný, V. (1969). Teorie vyučovánízvláštní tělesné výchově. Praha: Státní pedagogickénakladatelství.Štěpnička, J. (1976). Somatotyp, držení těla, motorikaa pohybová aktivita mládeže. Acta Universitatis CarolinaeGymnica. 12(2), 2–93.Tichý, M. (2000). Funkční diagnostika. Praha: TRITONs.r.o.Vařeková, R., & Vařeka, I. (1995). Význam a problémystandardizace klinického vyšetření pohybového systému.In Diagnostika pohybového systému – metodyvyšetření, primární prevence, prostředky pohybové terapie.Sborník II. celostátní konference v oboru zdravotníTV a funkční antropologie (pp. 77–79). Olomouc:Univerzita Palackého.
Acta Univ. Palacki. Olomuc., Gymn. 2004, vol. 34, no. 2 29HODNOCENÍ DRŽENÍ TĚLA DĚTÍ MLADŠÍHOA STARŠÍHO ŠKOLNÍHO VĚKUV OLOMOUCKÉM REGIONU(Souhrn anglického textu)V rámci antropologického výzkumu byla provedenadiagnostika držení těla u 1201 dětí mladšího a staršíhoškolního věku somatoskopickou metodou Jarošea Lo míčka (1957) a hodnocení klenby nohy technikouplantogramů, kterou uvádí Klementa (1987). Výsledkyhodnocení držení těla ukazují na dále pokračující nepříznivýtrend funkčních poruch pohybového aparátuu současné populace dětí a mládeže. Vadné držení tělabylo diagnostikováno celkem u 56 % chlapců a 37 % dívek.Hlavní příčinu vadného držení těla autor spatřujepředevším ve výskytu svalové dysbalance ve smyslu horníhoa dolního zkříženého syndromu. Stav klenby nohyje poměrně uspokojivý, protože u cca 85 % probandůbyla zjištěna normálně klenutá noha.Klíčová slova: mladší a starší školní věk, držení těla, somatoskopickámetoda, vadné držení těla, svalové dysbalance,klenba nohy, olomoucký region.PaedDr. Miroslav Kopecký, Ph.D.Palacký UniversityPedagogical FacultyŽižkovo nám. 5771 40 OlomoucCzech RepublicEducation and previous work experience1983–1988 graduated from Pedagogical Faculty, PalackýUniversity, Olomouc; teaching of general educationalsubjects PE – biology.1989 state rigorous examination at Pedagogical Facultyof Palacký University, Olomouc; teaching of general educationalsubjects, title Doctor of pedagogy (PaedDr.).1989–1997 teacher of PE and biology at primary schoolin Senice na Hané.1999 state doctoral examination at Pedagogical Facultyof Palacký University, Olomouc; anthropology; titleDoctor (Ph.D.).Since 1997 works as a lecturer in department of anthropologyand hygiene at Pedagogical Faculty of PalackýUniversity, Olomouc. He teaches subjects: developmentanthropology, physical anthropology, biology of human,and health PE. He works also as a secretary of department.2001–2002 he organized research of anthropology specializedon physical and motor development of childrenand youth.2002–2003 he passed the programme on life-long educationin a course “Preparation and realization of distanceeducation”, which carried on by Centre of distance educationUP in Olomouc.Scientific orientationArea of his scholastic interest is physical anthropology,infl uence of living conditions on physical and kineticdevelopment of current population.First-line publicationUntil now published over 30 articles, research studiesand books in Czech Republic as well as abroad.
32 Acta Univ. Palacki. Olomuc., Gymn. 2004, vol. 34, no. 2members of cross-country skiing clubs LIPT and SOSY.Reference standards in percentile graphs created forCzech boys and girls aged from birth to 18 years (Bláhaet al., 1994, 1998) were used for body height, weight andweight/height ratio (BMI) evaluation. Somatotypes wereset in terms of anthropometric parameters. We used SUR-VEY version 2.95 software (http://www.med.muni.cz/prelek/survey/servey.html). Skinfold thickness measurement(SKF) and bioelectric impedance analysis (BIA)were used for body composition or the determination ofthe relative amount of body fat. We measured the skinfoldthickness on defined sites of the right side of the bodyusing Best’s caliper, by Pařízková (1977, 38). Best’s caliperexerts a constant pressure on the measured skinfoldand transmits it to contact terminals (3 mm in diameter,circular shape) by means of a spring calibrated for a constantpressure of 200 g (i.e. cca 28 g/mm 2 ). The apparatusBodystat 500 (whole-body monofrequency impedancewith tetrapolar configuration of electrodes) was used forbioelectric impedance assessment. We used the predictiveequations for boys and girls by Pařízková (1977, 38), byGAUK (Bunc et al., 1998, 1), by software Antropos 2.3(1995) to calculate the relative amount of body fat.RESULTSThe average values of anthropometric parameters inyoung cross-country skiers are reported in TABLE 1. Altogethersubjects were tested n = 34 aged 10 to 16 years,21 of whom were boys and 13 of whom were girls.TABLE 1Anthropometric parameters in cross-country skiersBoys (n = 21) Girls (n = 13)Age (years) 13.2 ± 1.9 13.2 ± 1.0Body height (cm) 162.0 ± 14.9 159.6 ± 7.2Body weight (kg) 47.2 ± 13.0 46.4 ± 5.2BMI (kg.m -2 ) 17.5 ± 1.9 18.2 ± 1.1Arm circumference 21.7 ± 2.5 21.3 ± 0.9relaxed (cm)Calf circumference 31.4 ± 3.7 32.3 ± 1.7max. (cm)Epi hum. (mm) 72.9 ± 10.2 70.4 ± 3.0Epi fem. (mm) 91.6 ± 7.0 91.2 ± 5.6Endomorphic component 1.1 ± 0.2 1.6 ± 0.5Mesomorphic component 3.8 ± 0.8 3.9 ± 0.7Ectomorphic component 4.5 ± 0.7 4.0 ± 0.8(data are presented as mean ± SD)The evaluation of body height by means of percentilegraph (Bláha et al., 1994) is shown as follows: heightvalues of 13 boys (i.e. 62% of group) correspond to normalvalues for the Czech population (values between the25th and 75th percentile), 5 boys (i.e. 24% of group)had higher height (values between the 75th and 97thpercentile), 3 boys (i.e. 14% of group) had lower height(values below the 25th percentile), while height valuesof 7 girls (i.e. 54% of group) correspond to normal valuesfor Czech population (values between the 25th and75th percentile), 3 girls (i.e. 23% of group) had higherheight (values between the 75th and 97th percentile)and 3 girls (i.e. 23% of group) had lower height (valuesbelow the 25th percentile).We calculated weight/height ratio (BMI) of bodyweight and height values. The percentile BMI graphmakes it possible to follow up the trend of this indexin relation to age from birth to 18 years. It also rendersif possible to evaluate whether the actual body weightcorresponds to height or is excessive or reduced (Bláhaet al., 1998). We found the BMI values as follows: BMIvalues of 13 boys (i.e. 62% of group) were between the25th and 75th percentile, BMI is considered average, 8boys (i.e. 38% of group) had BMI values below the 25thpercentile, their body weight was reduced, while BMIvalues of 10 girls (i.e. 77% of group) were between the25th and 75th percentile, BMI is considered average, 3girls (i.e. 23% of group) had BMI values below the 25thpercentile, their body weight was reduced.Somatographs with individual somatotypes of boysand girls is documented in Fig. 1, 2.The results of body composition determination bymeans of SKF measurement and BIA methods (variouspredictive equations) are in TABLE 2.TABLE 2Values of BF (%) by means of SKF measurement andBIA methods (mean ± standard deviation, minimal,maximal values)BF (%)SKF 1BF (%)SKF 2BF (%)BIA 1BF (%)BIA 2Boys mean 9.5 8.4 5.1 6.4SD 1.6 1.9 2.3 1.0min 5.9 5.5 0.5 4.3max 13.4 11.6 8.7 8.1Girls mean 12.3 11.5 5.9 20.1SD 3.7 2.3 2.0 1.6min 6.8 7.1 1.7 16.7max 19.6 15.0 9.5 22.7SKF 1 skinfold thickness measurementpredictive equations by Pařízková (1977)SKF 2 skinfold thickness measurementpredictive equations by Bunc et al. (1998)BIA 1 bioelectric impedance analysis (Bodystat 500)predictive equations by software Antropos 2.3. (1995)BIA 2 bioelectric impedance analysis (Bodystat 500)predictive equations by Bunc et al. (1998)
Acta Univ. Palacki. Olomuc., Gymn. 2004, vol. 34, no. 2 33Fig. 1Somatographs with individual somatotypes of boysFig. 2Somatographs with individual somatotypes of girls
34 Acta Univ. Palacki. Olomuc., Gymn. 2004, vol. 34, no. 2TABLE 3Correlation (r) and a paired t-test (t) between selected SKF and BIA predictive equationsA) BoysSKF 2 BIA 1 BIA 2SKF 1 r 0.346 –0.054 0.610p < 0.01 N.S. 0.01t N.S N.S. N.S.SKF 2 r 0.824 0.279p < 0.01 N.S.t 0.01 N.S.BIA 1 r 0.099p < N.S.t N.S.B) GirlsSKF 2 BIA 1 BIA 2SKF1 r 0.755 0.288 0.003p < 0.05 N.S. N.S.t N.S. 0.005 0.05SKF 2 r 0.497 0.118p < N.S. N.S.t 0.005 0.005BIA 1 r 0.470p < N.S.t 0.005Correlation analysis was applied to assess the degreeof association between SKF measurement and BIAmethods, or more precisely between selected predictiveequations. A paired t-test was used to identify the differences(TABLE 3).DISCUSSIONBody composition is the most significant anthropometricparameter in cross-country skiers. Amount ofbody fat averages 5 to 10% of body weight for malesand 16 to 22 % of body weight for females (Havlíčkováet al., 1993, 107). The best cross-country skiers tend tohave the lowest body fat, by Orvanová (1987). Typicalpercentages of body fat range from about 5 to 12% forelite males and 16 to 22 % for elite females (Hoffman,& Clifford, 1992, 8). The boys (age 16.62 ± 1.4 years)had lower amount of body fat (5.2 ± 1.6%), whencompared to other groups of boys of comparable age.The girls (age 15.7 ± 1.21 years) had lower levels ofbody fat (10.6 ± 2.3%), when compared to girls in thenormal, untrained population (Pařízková, 1994, 252).It is important to say, that amount of essential lipidsranges about 6% for males and 10% for females. Thatmeans some assessed values of body fat (%) from SKFmeasurement and BIA methods are inadequate. Malecross-country skiers were classifi ed as ectomorphicmesomorphs, while female skiers were characterisedas endomorphic mesomorphs (Havlíčková et al., 1993,107). However, the results of our study are different. Forboys mesomorphic ectomorph is predominanted, whilefor girls mesomorphic ectomorph and ectomorphic mesomorphwere mostly found (Fig. 1, 2). The distributionof body fat in children is different from distribution ofbody fat in adults. Changes of all of three componentsare affected by many factors, especially growth, typeof biological maturation, start of peak height velocity(PHV) (Riegerová, 1998, 61).Comparison of selected predictive equations point tothe significant difference of various methods (TABLE2, 3). Correlation analysis shows low relation betweenpredictive equations for SKF and BIA methods. Theresults of paired t-test show nonsignifi cant difference(< 2 %) between the applied predictive equations forboys, while signifi cant difference (> 2%) between theapplied predictive equations for girls.SKF measurement and BIA methods are the mostfrequent methods for the body composition determinationin fi eld conditions. Low price, availability, easyattendance and minimal charge of tested individualsare their priorities. On the other hand both forenamedmethods aren’t “trouble–free“ (Bunc, 1998, 3). The pri-
Acta Univ. Palacki. Olomuc., Gymn. 2004, vol. 34, no. 2 35mary problem of using these indirect methods for bodycomposition assessment is the predictive equations.There are others factors, that can influence the resultsof measurements (e.g. instrumentation, subject factors,technical skill, environmental factors…). The method ofSKF measurement uses to calculation of body fat ratiothe specific predictive equations. Total error (biologicaland technical) range about 3.3% of body fat (Dlouhá,1998, 8). The accuracy of BIA measurement is infl u-enced by various factors, e.g. errors caused by devicehandling (cca 3%), method’s errors-software (80%, especiallypredictive equations), hardware – the selectedapparatus (cca 1.5%), the type of electrodes (3%), theside of body (1–2%), the selected frequency (1–2%), thehydratation of body (2–4%) and many others (Bunc,2001, 189).CONCLUSIONThere are various factors, which affect the results ofmeasurement and the assessment of body composition(e.g. technical skill, the selected apparatus, environmentalfactors…). The primary problem of using the indirectmethods for the body composition determination is thepredictive equations. DEXA method (dual energy X-rayabsorptiometry) is thought as “the gold standard”, butbecause of the high price and technology requirementsit is not useful in fields conditions (Bunc, 2001, 189).Research and our study show, that monitoring thethickness of a single skinfold or sum of SKFs (Σ SKF)is optimal for detection of changes in the amount anddistribution of subcutaneous fat (Bunc, 2001, 189).There are various apparatus working with the bioelectricimpedance principle, but not all of them found thecorresponding values. The results of bioelectric analysisare affected by the selected predictive equations. It isto accent, that the measurement should be made bya skilled person to reduce the human factor. The singlemethods measure the other physical quantity, thereforewe can’t confuse the results of the single methods. Atthe conclusion it is to accent too, that it is importantto use the same selected method for the body compositiondetermination during the longitudinal monitoringof individuals.REFERENCESBláha, P., & Vignerová, J. (1998). Percentilový graf BMI.Praha: Přírodovědecká fakulta UK.Bláha, P. et al. (1998). Percentilový graf tělesné výšky.Praha: SZÚ, ÚSM.Bunc, V., & Dlouhá, R. (1998). Možnosti stanovenítělesného složení bioimpedanční metodou u netrénovanýcha trénovaných jedinců. Med Sport BohemSlov, 7, 89a.Bunc, V. et al. (1998). Inovace predikčních rovnic pro stanovenísložení těla bioimpedanční metodou a metodouměření tloušťky kožních řas.[Dílčí zpráva GAUK].Univerzita Karlova, Fakulta tělesné výchovy a sportu,Praha.Bunc, V., Cingálek, R., Moravcová, J., & Kalous, J.(2001). Možnosti stanovení tělesného složení u dětíbioimpedanční metodou. In H. Válková & Z. Hanelová(Eds.), Pohyb a zdraví (pp. 188–190). Olomouc:Vydavatelství Univerzity Palackého.Dlouhá, R. (1998). Výživa – přehled základní problematiky.Praha: Karolinum.Dlouhá, R., Heller, J., & Bunc, V. (1998). Srovnánírovnic Pařízkové pro zjišťování tělesného tuku sportujícíchžen. Med Sport Bohem Slov, 7, 7–12.Havlíčková, L. et al. (1993). Fyziologie tělesné zátěže II.,Speciální část – 1. díl. Praha: Karolinum.Hoffmann, M. D., & Clifford, P. S. (1992). Physiologicalaspects of competitive cross-country skiing. Journalof Sports Sciences, 10, 3–27.Orvanová, E. (1987). Physical structure of winter sportsathletes. Journal of Sports Sciences, 5, 197–248.Pařízková, J. (1977). Body fat and physical fi tness. TheHaque Martinus Nijhoff B.V./Medical Division.Pařízková, J. (1994). Dietary intake and body physiquein adolescent cross-country skiers. Journal of SportsSciences, 12, 251–254.Pařízková, J. (1998). Složení těla, metody měření a využitíve výzkumu a lékařské praxi. Med Sport BohemSlov, 7, 1–6.Riegerová, J., & Ulbrichová, M. (1998). Aplikace fyzickéantropologie v tělesné výchově a sportu. Olomouc:Vydavatelství Univerzity Palackého.The study was supported by grant of Czech Ministryof Education, Youth and Sport No. MSM 115100001.TĚLESNÝ PROFIL LYŽAŘŮ BĚŽCŮVE VĚKU 10–16 LET(Souhrn anglického textu)Sledování hodnot různých tělesných charakteristikdětí a mládeže je nejjednodušším způsobem hodnocenítělesného profilu jedince či skupiny populace. Tělesnésložení, tj. velikost podílu aktivní tělesné hmoty a depotníhotuku, vytváří výrazný somatický znak, kterýse cha rakteristicky rozvíjí v závislosti na věku, stupnitělesného rozvoje a pohlaví. Cílem této studie bylo zhodnotittělesný profil u skupiny lyžařů, žáků sportovníchtříd se zaměřením na běh na lyžích, s důrazem na hodnocenízákladních antropometrických charakteristik, tj.tělesné hmotnosti, tělesné výšky, BMI a somatotypu.Dílčím cílem bylo porovnání kaliperace a bioimpe dancejako metod pro stanovení tělesného složení, resp. po-
36 Acta Univ. Palacki. Olomuc., Gymn. 2004, vol. 34, no. 2rovnání predikčních rovnic používaných pro konečnýpřepočet na procento tělesného tuku. Do studie bylozahrnuto celkem 34 probandů ve věku 10–16 let, z toho21 chlapců a 13 děvčat. Z výsledků je patrné, žeu převážné většiny probandů tělesná výška a hmotnostodpovídají normám populace. Při srovnání jednotlivýchpredikčních rovnic pro přepočet procenta tělesnéhotuku je patrná značná odlišnost jednotlivých metodik.Korelační analýza ukazuje převážně na nízkou závislostmezi predikčními rovnicemi pro kaliperaci a BIA.Z výsledků t-testu vyplývá, že u chlapců byl z hlediskavýznamnosti zaznamenán převážně statisticky i věcně(< 2 %) nevýznamný rozdíl mezi použitými predikčnímirovnicemi, naopak u děvčat byl rozdíl v použitých rovnicíchstatisticky i věcně významný.Klíčová slova: složení těla, měření tloušťky kožních řas,bioimpedance.Mgr. Ivana KinkorováCharles UniversityFaculty of Physical Educationand SportJosé Martího 31162 52 Prague 6Czech RepublicEducation and previous work experience1996–2001 – Physiotherapy of internal and civilisationdiseases, Charles University, Prague, Faculty of PhysicalEducation and Sport.Since 2001 – Ph.D. study at home faculty.Since 2001 – research worker, Biomedical Laboratory,Faculty of Physical Education and Sport, Charles University,Prague.Scientific orientationPhysiotherapy, kinesiotherapy, nutrition, body composition,teaching of sports and clinical nutrition.First-line publicationUntil now published over 20 articles, research studiesand books in Czech as well as abroad.
Acta Univ. Palacki. Olomuc., Gymn. 2004, vol. 34, no. 2 37EVALUATION OF MUSCLE FUNCTIONS IN ATHLETESPERFORMING CLIMBING AND JUDOJarmila Riegerová, Zbyněk Jančík, Petr KytkaFaculty of Physical Culture, Palacký University, Olomouc, Czech RepublicSubmitted in September, 2003In two groups of athletes performing climbing and judo, belonging to the Juvenis, Adultus and Maturus 1 age groups,we conducted an analysis of muscle function and motor stereotypes. On average, the climbers had achieved the VIIthlevel of difficulty (a good climbing level), the judoists had been doing judo at the 2 nd league level. The low, almost zero,finding of shortening and substitutions in climbers gave us the idea of the evocation of an evolutionarily old, earlycoded model of reflexive motorics during climbing. With the group of judoists, tendency was seen which is knowneven in other sports, confirming the insufficient compensation of both the unilateral training load and lifestyle.Keywords: Muscle functions, motor stereotypes, free climbing, judo.INTRODUCTIONIn 2002 we conducted examinations for muscle functionsand motor stereotypes on two groups of athleteswho did climbing and judo. Members of both groupscame from the Moravian region. The group of climberscomprised 36 men ranging in age between 20 and 25(Adultus) and 3 men between the ages of 35–38 years(Maturus I).TABLE 1 shows the performance scale of theclimbers. It is scaled according to the level of difficultyof individual climbing paths – from the easiest (I) tothe most diffi cult path (XI). The highlighted sectionindicates the interval between individual levels reachedby the athletes. Level VII, the average level of difficultyachieved, represents a group of athletes at a good climbinglevel. The average performance of older men wasbetween levels IX–X+.RESULTSThe examination of muscle functions and motorstereotypes was conducted in accordance with themethod of Janda 1996, with alternative adjustmentof evaluation (Riegerová, 1993). The highly differingexamination results of the groups led us to undertake ananalytical study on the causes of this situation.TABLE 1Performance Scale of ClimbersI II III IV –V V V+ VI– VI VI+ VII– VII VII+VIII– VIII VIII+IX– IX IX+ X– X X+ XI– XIThe group of judoists comprised 30 men ranging in agebetween 15–29 years (Juvenis and Adultus). Their judoskills were on the 2 nd league level.Firstly, the group of climbers: Prior to each trainingsession, it is essential that each climber performs warmup exercises; e.g. Tefelner (1999) which presents sometechniques on thorough muscle stretching around the
38 Acta Univ. Palacki. Olomuc., Gymn. 2004, vol. 34, no. 2rhizoid joints, of the trunk musculature and the limbs.For training schedules aimed at children and youth, itis strongly recommended to include additional sportsactivities, gymnastic exercises and stretching exercisesfor greater articulation.Both the body height and weight of climbers werewithin the limits of standard variations for the averagepopulation in the Czech Republic (body height –– 179.3 cm, n.i. = 0.20 s, body weight 73.3 kg, n.i. == –0.26 s). For comparison with the population standard,we always calculated the weighted average andweighted standard deviations for the relevant age category.During examination of the postural muscles, wefound a comparatively low frequency of shortened muscleseven in the age group of Adultus and Maturus.The most problematic of the muscular region is thebilateral m. trapezius where the shortening occurredin 33.3% and 22.2%. We assume that the conditionsand functionality of m. trapezius are considerably influenced by the technique of climbing and belay, andit also reflects the emotional state of the individual. In22% a shortening of the spinal erector in the lumbararea occurred.The incidence of muscular shortening was in directrelation to the performance of climbers who have beendoing this sport from 1 to 9 years on the levels of difficultybetween Vth and IXth (the shorter the climbingtime, the greater the extent of muscle shortening for anindividual).With regard to muscles with a predominantly phasicfunction, a certain debilitation was detected in 19.45% atthe m. serratus anterior and mm. rhomboidei (19.45%).Even in this case we assume that this finding is relatedto the condition of m. trapezius, further of m. latissimusdorsi and is probably conditioned by the length of trainingand climbing technique.Substitute motor stereotypes were not found, whichis surprising with regard to the thus far known highfrequencies in childhood, adolescence and in the adultpopulation. Therefore we consider the infl uence ofthe mechanism of the evocation of evolutionarily old,early coded models of reflexive motorics. The evolutionprocess of the change of functional involvement of m.gluteus maximus from an abductor muscle to a musclefor extension in the hip joint is connected with habitualbipeds and with morphological adaptation to it.According to Vojta et al. (1995), reflexive creepingand refl exive turning are congenital global models ofmotor ontogenesis. During ontogenesis of erection, theybecame polymorphic, and development ensued.Free climbing is thus a natural implementation ofthese basic models in space. The genetically coded locomotormodel is, during the learning (training) process,specialized IAW its utilization in sports.During climbing, the muscle groups of the upperpart of the body are most involved, especially the antebrachii.The body of a climber, due to the elevatorof the rhizoid joint, moves and thus a high afference isspontaneously activated. During climbing, it is necessaryto involve a large range of joint motility to limitlevels. A major, actively performed flexion stage of thehip joint is related not only to the fl exion but also tothe external rotation and abduction of the thigh. Alsothe adductors go into contraction and, together withthe external rotation and femoral abduction, into extension(zero or very low incidence of contraction of thesemuscles – Fig. 1). Due to contraction of the abdominalFig. 1The frequency of shortening of postural muscles and muscular groups of climbers (n = 36, 1 = 2.78%) and judoists(n = 30, 1 = 3.33%)10090807060% 5040302010012345678muscle, muscular group9climbersjudoistsjudoists1011climbers1 m. triceps surae dex.2 knee joint flexors dex.3 m. rectus femoris dex.4 m. tensor fasciae latae dex.5 hip joint adductors dex.6 m. iliopsoas dex.7 m. quadratus lumborum dex.8 m. erector spinae9 m. pectoralis major dex.10 m. trapezius sin.11 m. trapezius dex.
Acta Univ. Palacki. Olomuc., Gymn. 2004, vol. 34, no. 2 39wall, dorsal pelvic fl exion is evoked involving the backmuscles and the ischiocrural muscles. The bias positionof the pelvis on a frontal level is exerted by m. latissimusdorsi and m. quadratus lumborum. The condition of thesemuscles ranged from very good to excellent.Three of the tested climbers belonging to the MaturusI (35–38 years) age group have been actively climbingfor 17–22 years, with the achieved performance levelsof between IX–X+. Shortening of the postural musclesoccurred twice at m. trapezius only, muscle shorteningonly once at m. serratus anterior and mm. rhomboidei.Substitute motor stereotypes were not found again.In fact, the group of climbers did not complain ofsubjective pains in individual joint areas, apart fromhand joints in 27.78% and knee joints in 16.67%. Painin the cervical region of the spine was felt by 11.11% ofthe tested.Judoists belonging to the Juvenis (15–17 years) agegroup were below average in both their body height andweight (height 170.23 cm, n.i. = –0.80, weight 58.35 kg,n.i. = –0.86). In adult men (18–23 years) these basicantropometric parameters were within limits of standardvariations (weight 180.0 cm, n.i. = 0.21, weight70.81 kg, n.i. = –0.29), older men (24–29 years) weretaller and had above average weight (height 181.25 cm,n.i. = 0.55, weight 89.88 kg, n.i. = 1.24). For judo itis a remarkable advantage to be in the higher weightcategory because for an individual with these dispositions,it is easier to defend against an opponent whoattempts to destabilize his center of gravity.For an assessment of the overall condition of musclefunctions, we merged the age categories Juvenisand Adultus into one group.The resulting situation was signifi cantly worsethan in the case of climbers (Fig. 1). The highest frequencyof shortening (60% and exceeding 60%) wasshown by the knee flexors and decreasing bundles ofm. trapezius. Muscle groups securing motions in thehip joint were almost at half strength of the group inthe process of shortening, which makes evident thefrequent abidance in flexion positions and insufficientcompensation in the training process. An incorrectattitude to compensation exercises is generally known.These exercises are often considered by trainers andathletes to be a waste of time. Without any statisticalimportance of differences, there were only frequencyfi ndings of shortening at the m.erector spinae andm.pectoralis major dex.The established conditions of shortening correspondto the high percentage of substitution motorstereotypes in the area of hip joint, in the sense of primaryactivation of the hamstrings during extension.This knowledge can further expand the scope ofexercises in health-oriented physical education.Fig. 2Frequency of muscle weakness and substitutional motor stereotypes for the group of judoists (n = 30, 1 = 3.33%)10090807060% 5040302010012muscle, muscular group3456climbersjudoistsjudoistsclimbers1 nape flexion2 trunk flexion3 lower limb extension4 lower limbs abduction5 push-up test6 higher limb abduction
40 Acta Univ. Palacki. Olomuc., Gymn. 2004, vol. 34, no. 2The push-up test manifested the muscle force of them.serratus anterior and rhombic muscles. Also hereonly 50% of the test exercise was performed properly.The mm. rhombodei draws the shoulder blade to thespine and pushes it a bit higher. The m. serratus anterioris involved in the protraction and anteversion ofthe shoulder blade. The m. trapezius is the auxiliarymuscle, which has a fixating and rotating effect on theshoulder blade.A conclusion from the above analysis: One reacts toexogenous and endogenous motor stimuli as in a system.Free climbing evokes evolutionarily old, ontogeneticallyearly motor coded models of reflexive motorics. This,together with the necessity of the application of stretchingbefore each climb, influences positively the motorsystem of athletes. In young judoists a certain tendencyis shown which is true also for other sports (Riegerová,2002). A unilateral load and neglect of compensationsat the very beginning of each training (although in thisparticular case, several sports clubs in three Moraviancities have been discussed) brings to light health problemsand is also a disincentive in achieving a successfulsports performance. This knowledge can further expandthe scope of exercises in health-oriented physical education.SUMMARYIn groups of athletes doing free climbing and judoand belonging to the Juvenis, Adultus and Maturus 1age groups, we conducted an analysis of muscle functionand motor stereotypes. On the average, climbershad achieved the VIIth level of difficulty (a good climbinglevel), the judoists had been doing judo at the 2 ndleague level.The low, almost zero, fi nding of shortening andsubstitutions in climbers gave us the idea of evocationof an evolutionarily old, early coded model of reflexivemotorics during climbing.Free climbing is the natural implementation ofrefl exive creeping and refl exive turning in space. Thegenetically coded locomotor model is, during the learning(training) process, specialized in its utilization insports.The incidence of muscular shortening is in directrelation to the performance of climbers, who have beendoing this sport from 1 to 9 years at the levels of difficultybetween the Vth and IXth (the shorter the climbingtime, the greater the extent of muscle shortening foran individual).The most problematic of the muscular region is thebilateral m. trapezius, where the shortening occurredin 33.3% and 22.2%. In 22% a shortening of the spinalerector in the lumbal area occurred. Substitute motorstereotypes were not found.With the group of judoists, a tendency was seenwhich is known even with other sports, confirming insufficientcompensation of both the unilateral trainingload and lifestyle. We noted the resulting high frequencyof shortening of the muscle group, securing motionsin the hip joint, knee fl exors and m. trapezius. Theestablished conditions of shortening correspond to thehigh percentage of substitution of hamstrings duringextension.This knowledge is worthy of further attention becauseit can help further expand the scope of exercisesin health-oriented physical education.REFERENCESJanda, V. (1996). Funkční svalový test. Praha: GradaPublishing.Přidalová, M. (2002). Stav a funkce nohy jako nezanedbatelnásoučást péče o podpůrně pohybový systém.In Š. Andělová (Ed.), XXX. ostravské dny dětí a dorostu(pp. 82–93). Ostrava: Repronis.Přidalová, M. (2000). Stav podpůrně pohybového systémuu selektovaných skupin dětí staršího školníhověku. In J. Riegerová (Ed.), Diagnostika pohybovéhosystému (pp. 144–148). Olomouc: VydavatelstvíUniverzity Palackého.Riegerová, J. et al. (1999). Základní somatometriea roz bor svalových funkcí u čtyř populačních skupinmužů a žen ve věku Maturus a Presenilis. Českáantropologie, 49, 28–31.Riegerová, J. (2002). Péče o stav svalového aparátua kloubní pohyblivosti – základní zásada primárníprevence poruch hybného systému. In Š. Andělová(Ed.), XXX. ostravské dny dětí a dorostu (pp. 63–67).Ostrava: Repronis.Tefelner, R. (1999). Trénink sportovního lezce. Brno:Datis.Vojta, V., & Peters, A. (1995). Vojtův princip. Prague:Grada Publishing.The study was supported by grant of Grant Agencyof Czech Republic No. 406/02/0146.HODNOCENÍ SVALOVÝCH FUNKCÍU SPORTOVCŮ ZABÝVAJÍCÍCH SE VOLNÝMLEZENÍM A JUDEM(Souhrn anglického textu)U souboru sportovců zabývajících se volným lezeníma judem ve věku Juvenis, Adultus a Maturus 1jsme provedli rozbor svalových funkcí a pohybovýchstereotypů. Sportovní lezci dosahovali v průměru VII.výkonnostního stupně (dobrá lezecká úroveň), judisté sejudem zabývali na úrovni 2. ligy. Nízký až nulový nález
Acta Univ. Palacki. Olomuc., Gymn. 2004, vol. 34, no. 2 41zkrácení a substitucí u sportovních lezců nás přivedl namyšlenku evokace evolučně starých, raně kódovanýchvzorů reflexní motoriky při volném lezení. Volné lezenípřestavuje přirozenou realizaci reflexního plazení a reflexníhootáčení v prostoru. Geneticky kódovaný lokomočnívzor je pak v procesu učení (tréninku) precizovándo sportovního využití. Výskyt svalových zkrácení bylu sledovaného souboru v přímém vztahu k výkonnostilezců, kteří se tomuto sportu věnovali v rozmezí 1 až9 let od V. po IX. stupeň obtížnosti (čím kratší dobalezení, tím vyšší počet svalových zkrácení u jednotlivce).Nejproblematičtější svalovou skupinou byl oboustranněm. trapezius (33,3 % a 22,2 %). Ve 22,0 % bylo nalezenozkrácení vzpřimovače trupu v bederní oblasti. Substitučnípohybové stereotypy nalezeny nebyly.U souboru judistů se projevil trend známý i u ostatníchsportů, potvrzující nedostatečnou kompenzacijednostranného pohybového zatížení i způsob života.Nalezli jsme vysoké procento zkrácení svalových skupinzajišťujících pohyby v kyčelním kloubu, flexorů koleni m. trapezius. Zjištěnému stavu zkrácení odpovídalo i vysoképrocento substitučních pohybových stereotypův oblasti kyčelního kloubu ve smyslu primární aktivacehamstringů při extenzi.Tyto poznatky zasluhují další pozornost, nebomohou rozšířit spektrum cvičení ve zdravotní tělesnévýchově.Prof. RNDr. Jarmila Riegerová, CSc.Palacký UniversityFaculty of Physical Culturetř. Míru 115771 11 OlomoucCzech RepublicEducation and previous work experienceUniversity education, 1968–1990 lecturer, docent at Facultyof Science, Palacký University, Olomouc.Since 1991 – Faculty of Physical Culture, Palacký University,Olomouc.Since 2001 – professor at the same Faculty.Scientific orientationFunctional anthropology, environmentalism of human,kinesiology.First-line publicationUntil now published 120 papers and research studies inCzech as well as in foreign literature, 1 monograph and5 instructional texts.Klíčová slova: svalové funkce, pohybový stereotyp, volnéhorolezectví, judo.
Acta Univ. Palacki. Olomuc., Gymn. 2004, vol. 34, no. 2 43APPLICATION OF THE METHOD OF SPECTRAL ANALYSISOF HEART RATE VARIABILITY DURING EFFECTS ASSESSMENTOF SELECTED BREATHING TECHNIQUESON FUNCTIONAL CHANGES IN THE AUTONOMOUS NERVOUS SYSTEMPetr Kolisko, Dobroslava Jandová*, Jiří Salinger, Jaroslav Opavský, Miroslav Ježek, Karel Slováček*Faculty of Physical Culture, Palacký University, Olomouc, Czech Republic* Priessnitz curative spa, corporation, Jeseník, Czech RepublicSubmitted in April, 2004Respiration is one of the fundamental factors influencing the actual functional condition of the autonomous nervoussystem. Our study attempts to clarify the influence of voluntary regulation of the respiratory pattern on the actualfunctional changes in R-R interval variability. It is closely related to the influence of vagus regulation which can bemonitored using the Vario Cardio TF4 diagnostic system and the method of spectral analysis of heart rate variability(SAHRV). In this manner we were able to observe the infl uence of selective yoga breathing techniques on the frequencyand amplitude changes during the observed frequency spectrum of 0.02–0.4 Hz that is related to the activityof the autonomous nervous system. One of the frequency components in this domain is respiratory dependent vagalactivity. This frequency and its amplitude markedly stabilise during rhythmisation of respiratory frequency. In respiratorytechniques with deeper breathing an increase in total spectral power happens wherein, above all, a frequencycomponent is present which is considered to be respiratory dependent vagus activity. The amplitude of this frequencyis modulated by respiratory volume and the inspiratory muscles, whereby the frequency alters by 0.0167 Hz/1 respiratorycycle depending on the respiration rhythm. During a rhythmised respiratory frequency of 12 cycles/min andspeed ratio of inspiration to expiration of 2 : 3, our studies observe that this frequency component stabilises in theregion of 0.2 Hz.Keywords: Heart rate variability, autonomous nervous system, regulated/spontaneous respiration, yoga breathing technique.INTRODUCTIONHuman metabolism is related to the input of oxygen,its utilisation inside the body and the subsequent outputof carbon dioxide. Respiration is the fundamental physiologicalfunction of a living organism and accordingto Paleček et al. (1999), it encompasses: gas exchangebetween the external environment and the lungs (ventilation),gas exchange within the lungs (diffusion), gastransport (oxygen, carbon dioxide) between the lungsand tissues, and culminates in the utilisation of oxygeninside the cells.The respiratory system, according to Paleček (1999),is comprised of bones, joints and chest muscles, theperipheral nerves, relevant structures in the CNS andthe chemoreceptors. Breathing accounts partly for themetabolic processes realised by respiration, and partlyalso for other non-metabolic functions such as participationof breathing in voluntary motor functions such asspeech, singing, etc. (Véle, 1997).Ganong (1999), and similarly Paleček et al. (1999)state that other processes take place in the lungs whichare not directly related to breathing: the lungs playan important immunity role, they produce a rangeof enzymes, DNA, RNA, and prostaglandins. Manysubstances are also synthesised, degraded and removedduring pulmonary blood flow – removal of 25–50% ofnoradrenalin from the blood during one instance ofpulmonary flow, in addition to the significant removalof serotonin. On the surface of the endothelial cellsresides an enzyme responsible for transforming angiotensinfrom angiotensin I to angiotensin II. The totalpulmonary metabolic activity is relatively high underthe infl uence of these processes and accounts fornearly 5% of the total resting oxygen expenditure. Thelungs also work as an effective sieve that catches, forinstance, thromboses travelling upwards from the lowerlimb veins. Breathing participates in water metabolism.A great proportion of water is exhausted through thelungs; the evaporation of water from within the respiratorysystem makes possible, to some extent, the maintenanceof thermal balance in the body. Rapid absorptionof substances also occurs in the lungs – inhalation oftoxic substances, inhalation anaesthesia, etc.According to Paleček (1999, 208) “Ventilation isregulated such that it optimises breathing from the
44 Acta Univ. Palacki. Olomuc., Gymn. 2004, vol. 34, no. 2perspective of survival, minimal energy expenditure,synergism with other systems and in human beings, especiallyexpressively, from the viewpoint of realisationof functions directed by the cerebral cortex”.The maintenance of adequate metabolic levels dependingon actual bodily needs is necessary for survival.These actual functional needs of the body are cateredto by means of chemical and nervous regulation ofrespiration. In human beings, a sign of our superiorityover other animal species is the ability to perform, toa certain degree, the voluntary regulation of ventilation,or respiratory pattern, which has been developed overgenerations (Paleček, 1999). The voluntary regulation ofrespiratory patterns in humans takes place through:1. regulation of respiratory frequency;2. regulation of respiratory volume;3. regulation of the ratio of duration of inspirationand expiration;4. regulation of respiratory resistance;5. regulation of inspiratory and expiratory muscletone.Regulation of respiration is dependent on externalconditions and the functional status of the body, therebyinfluencing the dynamics of all of the above processes.By the term optimal respiratory pattern Ganong (1999)understands a respiratory pattern where the respiratoryeffort is minimal. According to Dylevský, Druga, andMrázková (2000) the respiratory cycle is directed underthe command of the respiratory centre in the oblongata.Inspiration is directed by a system of afferent and efferentconnections. Fibres of the vagus, fi bres of thephrenic nerve, fi bres of the spinal nerves innervatingthe inspiratory muscles, the spinal circuits and thesympathetic and parasympathetic fi bres innervatingthe bronchial muscles constitute the afferent part ofthe reflex arc.The ability to voluntarily regulate respiratory patternin humans is related not only to an autonomousregulation at the level of the oblongata and the brainstem, but also to a certain degree of mutual co-operationbetween the autonomous and cortical regulatory systems.According to Souček and Kára (2002) voluntaryregulation of respiratory pattern infl uences, throughautonomous regulation, among others, changes inblood pressure and heart rate by directly influencing therespiratory centre at the cardio and vasomotor centreslocated in the brain stem, especially in the oblongata.Apparently, information from receptors in the lung parenchymaand capillaries plays an important role in influencingautonomous regulation. According to Palečeket al. (1999) the cardiovascular system, to some extent,has corporate arterial baroreceptors in common withthe respiratory system. According to Souček and Kára(2002) it is by these means that the modulation of bloodpressure and heart rate through the direct influence ofthe respiratory centre on the cardio and vasomotor centresof the brain steam and oblongata occurs during thecourse of a respiratory cycle. This interaction modulatesalso the function of arterial and probably also low-pressurebaroreflexion. Periodical changes in blood pressureknown as the so-called Traube-Hering waves, which arerelated to autonomous regulation and partly influencedby respiration. Relationships between respiration andchanges in heart rhythm are mentioned in the study byGoldberger et al. (1984).Respiratory frequency and respiratory volume, respectivelyintensity of breathing, influence changes inthe actual functional activity of ANS. Changes in heartrate variability influenced by breathing during restingconditions known as the so called heart respiratory arrhythmia,thus express a relation among vagus activity,respiration and the modulation of heart rate. By observingthe changes in heart rate variability during spontaneousrespiration and during voluntary respiratory pattern,we can thus observe the relationship between respirationand actual changes in heart rate variability, respectivelychanges in the functional activity of the nervous system(Goldberger et al., 1994; Grosmann, 1992b; Katona &Jih, 1975; Malik, 1998).Mutual relations among respiration, functional activityof the autonomous nervous system and cortical regulationof respiration are empirically used, for instance, inthe Indian practise of respiratory exercises (pranajama).This part of so-called hathayoga is regarded traditionallyto be the most important component of yoga exercises(Dostálek, 1996). In Western culture, respiratory gymnasticsoriginated from a yoga-type respiration used forhealing of ventilation disorders.The influence of some yoga respiratory techniqueson changes in lung ventilation was studied in the pastand duly published in the papers by Frostel, Pande, andHedenstierna (1983), Gore and Gharote (1987), andMiles (1964). Frostel, Pande, and Hedenstierna (1983)state that during rapid diaphragmatic respiration, withthe so-called technique of kapalabhaty which we usedas one of the yoga techniques in our research, changesin blood gas concentration do not occur. Raghujah andTelles (2003) describe the influence of supported respirationthrough one nostril on changes in ANS activity.Some auto concentration techniques using the effectof respiratory techniques and their influence on changesin cerebral cortex activity were described in studies byDostálek and Krása (1976), Fabián, Lepičovská, andDostálek (1982), Lepičovská and Dostálek (1981),Meyer and Gotoh (1960).The influence of respiration on blood pressure decreasewas described in the works of Patel (1978). Inthe works of Ornish (1991) the complex effect of yogaexercise is described and the practise of breathing onpositive changes in stenosal coronary vessels section
Acta Univ. Palacki. Olomuc., Gymn. 2004, vol. 34, no. 2 45in patients with ischemic heart disorder played animportant role. The use of spectral analysis of heartrate variability when assessing the effect of respiratorytechniques on the functional changes in the autonomousnervous system was studied in a thesis by Ježek (2001).The influence of regulated and spontaneous respirationon actual changes in the autonomous nervous system,respectively on the frequency and amplitude modulationof the respiratory bound activity of the vagus, was studiedin the works of Kolisko, Salinger et al. (1997, 2001).Additionally, Brown et al. (1993), Grosmann, Beek, andWietjes (1990), Saul, Kaplan, and Kitney (1988) studiedthe relation among respiration frequency, heart rate oscillationand respectively, the R-R intervals.Some special respiratory techniques (hyperventilationetc.) are used in some special psychotherapeutictechniques (for example holotropic respiration). In thesphere of psychotherapy the effect of regulated intensifiedrespiration is known to induce intensified relaxationresponses in the body (Baštecký, Šavlík, & Šimek, 1993;Benson & Starková, 1997; Míček, 1984).Voluntary regulation of respiration is thus regardedby us as a fundamental factor that aims to infl uence,through actual autonomous regulation, the activity of itspartial subsystems in sympathetic and parasympatheticaspects while systematically influencing the body’s activitydirected by this system. That’s why, since 1995, wehave been engaged in the study of the problem and thepossibilities of objectifying the voluntary regulation ofthe actual functional condition of ANS with the methodof spectral analysis of heart rate variability (Kolisko,Salinger, Opavský et al., 1997).The Vario Cardio TF4 diagnostic system used byus for assessing R-R intervals variability enables us,together with the method of spectral analysis of heartrate variability (Yamamoto & Hughson, 1991; Havano,Sakakibara, Yamada et al., 1991; Salinger, Vychodil,Novotný et al., 1995; Salinger, Pumpla, Vychodil et al.,1999), to observe non-invasively the actual functionalchanges in heart rate variability that reflect actual functionalchanges in regulation modulated by the autonomousnervous system.The method of spectral analysis of heart rate variabilityenables the observation of the relationship betweenselected respiratory techniques and actual functionalchanges in heart rate variability.The current literature does not offer detailedstudies on the relations between voluntary regulationof respiration and changes in heart rate variability,respectively frequency and amplitude modulation ofthe frequency spectrum characterising sympatheticand vagus activities. The problems of the relationshipbetween respiratory frequency and changes in heartrhythm is described in the works of Brown, Beightol,Koh, and Eckberk (1993), Grossman (1992a, 1992b),Grossman, Karemaker, and Wieling (1991), Grossmanand Kollai (1993). Saul et al. (1988, 1989) found a relationshipbetween respiratory frequency and respiratorysinus arrhythmia. The occurrence of respiratorysinus arrhythmia is closely related to vagus activation.In a number of published works there is a descriptionof a marked decrease or a complete absence of respiratorysinus arrhythmia during cholinergic blockage orafter vagotomy (Cacioppo et al., 1994; Katona & Jih,1975; Kollai & Mizsci, 1990). For this reason we supposethat regulation of respiration has an extraordinaryimportance during activation of the vagus componentof the autonomous nervous system and enables actualregulation of the sympathetic-vagus balance (Akselrodet al., 1981, 1985).Intentionally, apart from Šlachta, Stejskal, Elfmarket al. (2002) and Stejskal, Šlachta, Elfmark et al. (2002),we did not apply the total autonomous regulation levelparameter, so-called functional age, which expressesbasically the functional changes in sympathetic andparasympathetic activities depending on the verticaland horizontal body position during examination.In our study, we opted for the sitting position with anupright trunk for assessing the influence of respirationon changes in SAHRV. This position is connected withchanges of diaphragm position and enables a highereffectiveness of respiratory muscles engagement (Véle,1997; Paleček et al., 1999). That’s why it is evidentlyempirically applied and duly recommended for respiratoryand auto concentration exercises in yoga (Dostálek,1996).RESEARCH AIMTo find changes in heart rate variability, respectivelychanges in the autonomous nervous system during differentbreathing techniques.RESEARCH QUESTIONS AND HYPOTHESES1. What is the relationship between frequency of respirationand the frequency component of ANS bound torespiration which we regard as vagus activity?2. In what manner do the values of the observed functionalparameters of the spectral analysis of heart ratevariability (SAHRV) change in frequency zones of verylow frequency (VLF), low frequency (LF) and high frequency(HF) during rhythmised respiratory frequencyof 12 cycles/min., during spontaneous respiratoryfrequency, during intensified respiration (so-called fullyoga breath), during alternate respiration through onenostril and during rhythmised tachypnoe (the so-calledtechnique of kapalabhaty)?
46 Acta Univ. Palacki. Olomuc., Gymn. 2004, vol. 34, no. 2H1 During a rhythmised respiratory frequency of 12cycles/min. frequency stabilisation appears in all examinedsubjects connected with respiration frequency(respiratory bound vagus activity) in the region of0.2 Hz. During spontaneous respiration this respiratorybound frequency will depend on individual respiratoryfrequency.H2 During so-called full yoga respiration characterisedby higher air volume and lower respiration frequencyof less than 9 cycles/min. (interval T6), we found anincrease in the total spectral power in ms 2 in comparisonwith spontaneous respiration.H3 By the influence of a decrease of average respirationfrequency of less than 9 cycles/min. during intensifiedrespiration in the measured interval T6, there occursa frequency shift of respiratory bound vagus activityfrom the high frequency zone HF during spontaneousrespiration (interval T5) to the zone of frequency componentLF during intensified respiration as comparedwith a spontaneous respiration frequency of more than9 cycles/min. (interval T5).H4 Increase in a total spectral power in ms 2 at intervalsT6, T8 with intensified respiration is directly related toan increase in vagus activity.H5 During tachypnoe in the respiratory technique ofkapalabhaty (respiratory frequency approximately 120cycles/min.) there occurs a shift of respiratory boundvagus activity above the upper frequency level of 0.4 Hzdetermined to be the upper frequency zone in the diagnosticsystem Vario pulse TF4. The dominant frequencyin the zone of HF will not be bound to respiration underthese conditions.METHODResearch methodThe experiment was conducted under laboratoryconditions with goal-directed manipulation of independentvariables (position, respiratory pattern). Allparticipants in the experiment were selected by drawfrom a group of students of Faculty of Physical Culture,Palacký University. The room temperature was 20°C; themeasurements were always conducted in the morninghours. The first stage of the experiment measured theresting reactivity of heart rate variability in supine-standing-supinepositions at the rhytimized breathing frequencyof 12 cycles/min. and then in the supine position atspontaneous respiration frequency. The second stagemeasurements were monitored in subsequent intervalswith the subjects in sitting position performing spontaneousrespiration, respectively applying the breathingtechnique of spontaneous respiration.Subjects18 men and women; aged 20–25 years, = 22.1years, BMI = 23.4 healthy individuals not on medication,non-smokers, 24 hours prior to the examinationthere had to be an absence of elevated physical load aswell as of alcohol use.Used instrumentationChanges in the actual functional state of the autonomousnervous system under the influence of respiratorytechniques were assessed by the method of short-termspectral analysis of heart rate variability using the telemetricsystem of Vario TF4. Each examined intervalrecorded a section of 300 beats, respectively 5 minutesof recording.The diagnostic system of Vario TF4 allows for thethorough scanning of an EKG signal registering seriesof successive R-R intervals and, with the use of a softwaresystem, allows for the carrying out of the methodof Fourier’s fast transformation of subsequent spectralanalysis in the region of 0.02–0.4 Hz which is regardedas the frequency zone corresponding to ANS activity.The result of SAHRV and respectively of monitoredR-R intervals is graphic and numerical analysis at thefrequency level of 0.02–0.4 Hz. In this frequency zonethere are three partial frequency components analysedby the software system, which are related to the activityof partial ANS subsystems.• Very Low Frequency – VLF within the range of0.02–0.05 Hz. This frequency component is notstrictly identified and is usually related to thethermoregulative sympathetic activity of vesselsand also to the level of circulating katecholaminsand to fluctuations in the renin-angiotensinsystem. Regarding the fact that there are very slowfrequencies ranging from 0.6–3.0 rhythms/min., theinterpretation of functional changes in this zone bymeans of the short-term analysis of pulse frequencyvariability is rather difficult.• Low Frequency – LF within the range of 0.05–0.150 Hz.This frequency component is related to slow fluctuationsin arterial pressure and is infl uenced by thebarorefl ective sympathetic activity of vessels (theso-called Mayer’s pressure wave) with a frequencydomain in this frequency range. According to Malik(1998) the frequency component LF is also infl u-enced by parasympathetic activity.• High Frequency – HF within the range of 0.151–0.4 Hz.According to Malik (1998) this component is influencedentirely by efferent vagus activity. Duringrhythmised respiratory frequency of 10 or more
Acta Univ. Palacki. Olomuc., Gymn. 2004, vol. 34, no. 2 47cycles/min. it is possible within this frequency rangeto exactly identify the frequency bound to respiration,which we regard as parasympathetic respiratorybound activity. Depending on the frequency ofrespiration, frequency shifts of this component occurup to the range assessed as the frequency range ofLF. Apart from parasympathetic respiratory boundactivity, we found in this frequency zone other subdominantfrequencies whose origin remains unclear.These subdominant frequencies in the HF zone arerelated probably to the modulation of vagus activityinduced by signals from inner organs directedby the parasympathetic system. It is also probablethat harmonic frequencies evoked by respiration frequencyplay an expressive role in these subdominantfrequencies.• The respiratory bound frequency component. Frequencydomain and frequency amplitude boundto respiration, which we regard as parasympatheticrespiratory bound activity, is expressively bound torhythmisation of respiratory frequency and stabilityof respiratory volume. By rhythmisation or observationof respiratory frequency it is possible to identifythe activity of the respiratory bound frequency component.In people with rhythmised or spontaneousbradypnoe of less than 9 cycles/min., this respiratorybound frequency is found in the zone of LFfrequency. The frequency shift of this respiratorybound component is 0.0167 Hz/1 per respiratorycycle (Kolisko, Salinger, Opavský et al., 1997).By rhythmisation of respiratory frequency at12 cycles/min. and rhythmisation of the length ofinspiration and expiration with a ratio of 2 : 3, it ispossible to stabilise respiratory bound frequency at0.2 Hz.Under these conditions we may unambiguouslyregard the HF zone as a frequency zone of parasympatheticand dominant frequency in the LF zoneas “Mayer’s pressure wave” relating to baroreceptoractivity.Under conditions of stable respiratory frequency,amplitude modulation (spectral power in ms 2 ),which we regard to be respiratorily bound vagus activity,is influenced by respiratory volume. Togetherwith an increase in respiratory volume, the totalspectral power of the respiratory bound frequencycomponent also increases, while with a reduction inrespiratory volume it decreases.Measurement process1. Observation of SAHRV changes, respectively of theactual functional condition of ANS during restingconditions with a rhythmised respiratory frequencyof 12 cycles/min. depending on body position; lying– interval T1, standing – interval T2, lying afterorthostasis – interval T3.2. Observation of SAHRV changes in a lying positiondepending on changes in respiratory rhythm;lying with a rhythmised respiratory frequency of12 cycles/min. – interval T3, lying during spontaneous,observed respiratory frequency – interval T4.3. Observation of respiratory techniques’ effects onchanges of heart rate variability, respectively onchanges of the functional condition of ANS; inan observed position – sitting. Measured intervals:T5 – sit ting, spontaneous respiration, T6 – sitting, intensifiedspontaneous respiration (full yoga breath),T7 – sitting, spontaneous respiration, T8 – sitting,alternate respiration through the right and left nostril(anuloma – viloma), T9 – sitting, spontaneousrespiration, T10 – accelerated shallow diaphragmrespiration (kapalabhaty).Methods used for evaluation and processing of dataobtainedThe length of one scanned interval was 300 beats.Computation of SAHRV parameters was carried outby a software programme in a standard manner accordingto an adjusted algorithm of CGSA (coarse-grainingspectral analysis) IAW Yamamoto & Hughson (1991).The number of parameters characterising ANS activityin the particular frequency zones of VLF, LF, and HFare the results of spectral analysis.Observed functional parameters in individual observedpositions1. Total spectral power in ms 2 .2. Spectral powers of individual frequency componentsVLF, LF, HF in ms 2 .3. Relative spectral powers of frequency componentVLF, LF, HF in % from total spectral power.4. Ratio of spectral powers of individual frequencyzones VLF/HF, LF/HF, VLF/LF.5. Ratio of the radical of spectral powers in the LFand HF (CCVLF, CCVHF) frequency zones as anindicator of total activity in the zone LF and HF.6. The average value of the R-R interval length at measuredintervals in ms (R-R interval).7. Dominant frequency components of VLF, LF, HFin mHz.Statistical method used1. Basic descriptive statistics for data description – arithmetical mean, standard deviation.2. Wilcoxon’s non-parametric test was used foranalysing the signifi cance of changes in observedpara meters depending on the applied respiratorytechnique among selected intervals.
48 Acta Univ. Palacki. Olomuc., Gymn. 2004, vol. 34, no. 2Goal-directed manipulated independent variable1. Position during experiment (standing, supine, sitting).2. Respiratory frequency (rhythmised respiratory frequency12 cycles/min. at intervals T2, T3, spontaneousrespiratory frequency at intervals T4, T5, T7,T9).3. Special respiratory techniques used in yoga (full yogabreath), breathing alternatively through the right andleft nostrils (anuloma – viloma), rapid diaphragmrespiration (kapalabhaty).4. Age (20–25 years), health condition (healthy individuals).5. Examination conditions (without medications, 24hours prior to the start there was an absence ofelevated physical load, the consumption of alcohol,and smoking. The examination was always carriedout before noon under laboratory conditions).Observed dependent variables – experimental effects1. The effect of orthostasis and horizontal position witha rhythmised respiratory frequency of 12 cycles/min.on changes of observed functional parameters SAHRV.2. The effect of rhythmised and spontaneous respiratoryfrequency on changes of observed functionalparameters SAHRV while lying.3. The effect of a position change from lying to sitting duringspontaneous respiration on the functional changesof observed functional parameters of SAHRV.4. The effect of the voluntary regulation of the breathingpattern while sitting at the intervals T6, T8,and T10 on changes in the observed functionalparameters of SAHRV in comparison to intervalswith spontaneous respiration (intervals T5, T7, T9)while sitting.Interpretation of supposed changes of observed functionalparametersA rhythmised respiratory frequency of 12 cycles/min.We will regard to be a demonstration of parasympatheticactivity the following:• The enhancement of the absolute and relative spectralpower of frequency component HF, the simultaneousincrease of the parameter CCV HF in a lyingposition, the extension of R-R interval length and thedominant HF frequency which is bound to respirationfrequency in the following relation: Respirationfrequency (min -1 ) x 0.0167 = dominant frequency HF(mHz).We will regard the following to be a demonstration of enhancedsympathetic activity:• A decline in total spectral power as well as in therelative and absolute spectral power of the frequencycomponent HF, a reduction in the parameter CCVHF, an enhancement of relative spectral power in thezones VLF and LF, the enhancement of CCV VLFand LF, and a decrease in the R-R interval length.We will regard to be a demonstration of the enhancedfunctional activity of the autonomous nervous system:• The enhancement of total spectral power in ms 2 .Respiratory bound frequency, regarded as vagus activity,will be assessed as:• The dominant frequency respiration at a frequencyof 12 cycles/min. in the HF zone in the fi eld of0.2 Hz.Voluntary regulation of the respiratory patternWe will regard to be a demonstration of enhanced vagusactivity, respectively respiratory bound vagus activity:When, while using the technique of bradypnoe, the averagerespiratory frequency is less than 9 cycles/min. (interval T6– full yoga breath, interval T8 – anuloma, viloma).• The enhancement of total spectral power; the enhancementof the relative power of the frequencycomponent LF and the dominant frequency in theLF zone that is bound to respiration frequency; a simultaneousdecrease in the absolute as well as in relativepower in the zone of frequency component HF(effect of the shift of a respiratory bound frequencyinto the zone of the LF frequency component).During intensified shallow diaphragm breathing (kapalabhatytechnique).• A total reduction in spectral power, a marked reductionin the absolute spectral power of the HFfrequency component, and a simultaneous extensionof R-R intervals.RESULTS1. Frequency changes in HF and LF components in observedrespiratory techniques depending on respirationfrequency (TABLES 1–5; Fig. 1 and 2).During examination of heart rate variability ata rhythmised respiratory frequency of 12 cycles/min.at interval T2 (standing) and at interval T3 (lying afterorthostasis) the frequency bound to the respiratoryfrequency in the region of 0.2 Hz in the fi eld of highfrequency component HF with low values of standarddeviation was dominant (TABLE 1, Fig. 1). This frequencyrange for the given condition we regard to be thefrequency zone of total parasympathetic activity. At T4(lying with spontaneous respiration) the average value ofrespiration in the examined individuals was 11.8 cycles/min. The standard deviation value thus shows considerablevariability in the value of average respiratory frequency.Under these conditions when individual shifts offrequency bound to respiration occur, the average value ofthe observed respiratory frequency does not relate strictlyto the average value of minute respiration calculatedfrom the relationship between respiratory frequency
Acta Univ. Palacki. Olomuc., Gymn. 2004, vol. 34, no. 2 49TABLE 1Changes in selected functional parameters of SAHRV at intervals with rhythmised and spontaneous respiratoryfrequencyT2 standing, rhytm.resp. T3 lying, rhytm. resp. T4 lying, spont. resp. Stat. sig.Parameter x – S x – S x – S T3 : T4Spect. pow. VLF 1566.6 1275.85 540.42 383.57 969.42 1101.77Spect. pow. LF 1116.5 758.81 740.87 698.45 1788.66 1685.13 *Spect. pow. HF 1261.4 1017.36 5974.87 5492.28 4705.76 4976.35Rel. sp. pow VLF 39.54 15.74 9.26 6.46 15.11 11.27 *Rel. sp. pow LF 29.75 11.67 11.89 9.05 24.08 19.18 *Rel. sp. pow HF 30.71 14.58 78.84 11.37 60.81 19.57 **Freq. VLF 20.15 5.47 20.89 3.85 24.17 8.32Freq. LF 78.72 15.42 104.61 29.76 111.46 28.73Freq. HF 206.37 7.62 204.35 12.35 241.15 73.7Rat. LF/HF 1.33 0.96 0.18 0.18 0.38 0.36 **R-R interval 0.75 0.12 1.09 0.16 1.1 0.17CCV LF 4.29 1.47 2.27 0.83 3.42 1.81CCV HF 4.47 2.02 6.59 2.68 5.73 2.96 *Total spect. pow. 3944.1 2596.02 7256.17 5886.94 7463.5 6592.97Resp. freq./min. 12 0.45 12 0.7 11.8 3.8Counted Fr. resp. 12.34 0.46 12.21 0.74 14.49 4.41Fig. 1Changes in dominant frequencies at frequency component zones of VLF, LF and HF during lying with rhythmisedrespiratory frequency of 12 cycles/min. during standing (interval T2), during lying (interval T3), during spontaneousrespiratory frequency (interval T4)mHz300250200150100500T2 T3 T4Freq.VLFVLFFrekq. Freq. LFFrekv. Freq. HFand the position of respiratory bound frequency (TABLE1). During spontaneous respiration, the ratio betweenrespiratory volume and respiratory frequency and theratio between the duration of inspiration to expiration fluctuates.These individual oscillations of respiratory rhythmduring the measured interval, coupled with spontaneousrespiration, create frequency and amplitude modulationin the component bound to respiration regarded asvagus activity. A high variability of respiratory boundfrequency values is the result of these frequency shiftsduring spontaneous respiratory frequency. In thegraphic and numerical protocol of SAHRV results andin young healthy individuals it is possible to preciselyanalyse the position of this component.
50 Acta Univ. Palacki. Olomuc., Gymn. 2004, vol. 34, no. 2TABLE 2Changes in selected functional parameters of SAHRV at intervals with spontaneous respiratory frequency during lying(interval T4) and sitting (interval T5)T4 spont. resp. T5 spont resp. Stat. sigParameter x – S x – S T4 : T5Spect. pow. VLF 969.42 1101.77 684.65 400.04Spect. pow. LF 1788.6 1685.13 1717.78 1660.45Spect. pow. HF 4705.7 4976.35 2561.35 2212.73 *Rel. sp. pow VLF 15.11 11.27 16.55 12.37Rel. sp. pow LF 24.08 19.18 34.16 25.38Rel. sp. pow HF 60.81 19.57 49.29 23.29Freq. VLF 24.17 8.32 24.29 8.17Freq. LF 111.46 28.73 101.37 32.86Freq. HF 241.15 73.7 223.07 82.85Rat. LF/HF 0.38 0.36 0.67 0.16R-R interval 1.1 0.17 0.99 0.15 **CCV LF 3.42 1.81 3.84 2.12CCV HF 5.73 2.96 4.75 2.09Total spect. pow. 7463.5 6592.97 4963.78 3106.21 *Resp. freq./min. 11.8 3.8 11.4 3.ICounted Fr. resp. 14.49 4.41 13.57 4.9Fig. 2Changes in dominant frequencies at frequency component zones of VLF, LF and HF during sitting with full yogarespiration (interval T6), with alternate respiration (interval T8), during kapalabhaty (interval T10); intervals T5, T7,T9 during spontaneous respiratory frequency300250mHz200150100Freq.VLFFreq. Frekq. LFFreq. Frekv. HF500T5 T6 T7 T8 T9 T10In all the following positions of sitting during spontaneousrespiration (positions T5, T7, T9) we foundsimilar disproportions between the observed respiratoryfrequency and the respiratory frequency calculated fromthe relation RvFr. (mHz) = Fr. R (min –1 ) × 0,0167 (Hz),(RvFr. – respiratory bound frequency regarded as vagusactivity in the frequency zone HF or LF, Fr.R – averagevalue of respiratory frequency) (TABLES 2–5, Fig. 2).The position of sitting with full yoga breathing (intervalT6) was characterised by a distinct slowdown of respiratoryrhythm of less than 9 cycles/min. and a simultaneousenhancement of respiratory volume. Calculated respiratoryfrequency in these positions assumed just the relationshipto dominant activity only, in the zone of frequency componentLF. In the literature, the dominant frequency in thiszone is related to baroreceptor activity. In our researchthere is just a frequency shift of frequency bound to respirationfrom the HF zone into the frequency zone of LFdepending on the respiration frequency. The dominantfrequency bound to respiration that we regard as vagus
Acta Univ. Palacki. Olomuc., Gymn. 2004, vol. 34, no. 2 51Fig. 3Changes in the total spectral power and partial spectral powers of frequency components VLF, LF, HF during lyingwith rhythmised respiratory frequency 12 cycles/min., during standing (interval T2), during lying (interval T3), duringlying with spontaneous respiratory frequency (interval T4)800070006000500040003000200010000ms 2T2 T3 T4Spect.pow.VLFSpect.pow.LFSpect.pow.HFTotalspect.pow.Fig. 4Changes in the relative spectral powers of frequency components VLF, LF, HF during lying with rhythmised respiratoryfrequency 12 cycles/min., during standing (interval T2), during lying (interval T3), during lying with spontaneousrespiratory frequency (interval T4)100%80604020Rel.sp.powVLFRel.sp.pow LFRel.sp.pow HF0T2 T3 T4activity, respectively frequency shifts, during change ofrespiration frequency, thus influences the actual activityand functional parameters in the zones evaluated bythe software system Vario TF4, Vario Cardio and thefollowing version as frequency components LF and HF.The border between frequency zone LF and HF is 0.15Hz. During the respiratory frequency of 9 cycles/minwe find respiratory bound vagus activity on the borderof both frequency components.At interval T10 (rapid diaphragmal respiration – socalledtechnique of kapalabhaty, average frequency ofrespiration 107 cycles/min.) the frequency componentANS bound to the respiration frequency moved abovethe spectral field 0.4, respectively 0.5 Hz was registeredby the diagnostic system Vario TF4. During average respirationof 107 cycles/min. this frequency bound on respirationfrequency probably was situated in the zone 1.79Hz (TABLE 5). Residual dominant and other subdominantfrequencies in zone HF under these conditions donot have a direct bearing on the respiratory bound vagusactivity. Under the given conditions it is probably possibleto regard frequency activity and its modulation inthis zone as parasympathetic activity originating fromsources other than vagus activity bound to respiration.2. Changes in other observed functional SAHRV parametersdepending on the respiration techniqueWe regard as a demonstration of the enhancement ofthe total functional activity of the autonomous nervoussystem to be, among others, the enhancement of totalspectral power in ms 2 during each observed position.We compared mutually:
52 Acta Univ. Palacki. Olomuc., Gymn. 2004, vol. 34, no. 2TABLE 3Changes in selected functional parameters of SAHRV at intervals during sitting with spontaneous respiration (intervalT5) and full yoga respiration (interval T6)T5 spont. resp. T6 full yoga breathing Stat. sigParameter x – S x – S T5 : T6Spect. pow. VLF 684.65 400.04 426.93 267.33 *Spect. pow. LF 1717.7 1660.45 10494.2 7862.34 **Spect. pow. HF 2561.3 2212.73 1794.68 1822.89Rel. sp. pow VLF 16.55 12.37 5.84 6.63 **Rel. sp. pow LF 34.16 25.38 76.03 22.28 **Rel. sp. pow HF 49.29 23.29 18.13 20.48 **Freq. VLF 24.29 8.17 25.2 9.27Freq. LF 101.37 32.86 98.57 26.95Freq. HF 223.07 82.85 199.73 60.51Rat. LF/HF 0.67 0.16 5.84 4.21 **R-R interval 0.99 0.15 0.94 0.14 **CCV LF 3.84 2.12 9.93 4.22CCV HF 4.75 2.09 4.08 1.1Total spect. pow. 4963.7 3106.21 12715.8 8288.26 **Resp. freq./min. 11.4 3.1 6.4 1.8Counted Fr. resp. 13.57 4.9 11.98 3.64Fig. 5Changes in the total spectral power and partial spectral powers of frequency components VLF, LF, HF during sittingwith full yoga respiration (interval T6), during alternate respiration (interval T8), during kapalabhaty (interval T10);intervals T5, T7, T9 with spontaneous respiratory frequency (ms 2 )14000120001000080006000400020000ms 2T5 T6 T7 T8 T9 T10Spect.pow.VLFSpect.pow.LFSpect.pow.HFTotalspect.pow.2.1 Rhythmised and spontaneous respiration (TABLE 1,Fig. 3, and 4)During comparison of intervals while lying (T3rhythmised respiration 12 cycles/min., T4 spontaneousrespiration) we did not fi nd any significantchanges in the total spectral power. Concurrently,there occurred an enhancement of spectral powerin the frequency components VLF and LF, and a reductionin the spectral power of the HF component.Similar changes were observed in the case of relativespectral powers. There an enhancement in LF/HFratio and decrease of CCVHF parameter occurred.The mentioned changes are related to a highervariability of individual respiratory frequency inthe examined sample during spontaneous respiration(TABLE 1).2.2 Position change from lying to sitting during spontaneousrespiration (TABLE 2)During a position change from lying (interval T4) tositting (interval T5), we found a significant reductionin total spectral power (sitting as a demonstration ofpartial orthostasis). Concurrently, a significant reductionin the spectral power of the frequency componentHF, a reduction in the relative spectral power HF,
Acta Univ. Palacki. Olomuc., Gymn. 2004, vol. 34, no. 2 53TABLE 4Changes in selected functional parameters of SAHRV at intervals during sitting with spontaneous respiration (intervalT7) and alternate respiration (interval T8)T7 spont. resp.T8 anuloma-vilomabreathing Stat.signParameter x – S x – S T7 : T8Spect. pow. VLF 1352.3 1236.36 477.28 253.19 **Spect. pow. LF 2340.7 2356.73 4333.62 4995.73 **Spect. pow. HF 2343.4 2164.54 3769.78 4106.91Rel. sp. pow VLF 23.95 14.63 8.53 7.01 **Rel. sp. pow LF 36.63 24.21 48.75 27.83 **Rel. sp. pow HF 39.42 21.99 42.72 28.95 **Freq. VLF 25.84 8.63 25.51 8.99Freq. LF 102.99 27.07 115.59 26.35Freq. HF 195.12 37.83 188.01 32.07Rat. LF/HF 2.92 5.41 1.15 0.89R-R interval 0.97 0.15 0.98 0.15CCV LF 4.61 2.43 6.02 3.42CCV HF 4.62 2.28 5.64 3.22Total spect. pow. 6036.1 3352.88 8580.68 5892.08Resp. freq./min. 10.74 2.91 7.62 1.74Counted Fr. resp. 11.75 2.23 11.26 1.92Fig. 6Changes in the relative spectral powers of frequency components VLF, LF, HF%80706050403020100T5 T6 T7 T8 T9 T10Rel.sp.pow VLFRel.sp.pow LFRel.sp.pow HFan enhancement of the ratio in the spectral powersLF/HF, a reduction in the CCVHF parameter,and a shortening of the R-R interval, occurred. Thementioned changes characterise a sitting when comparedto a lying position as a position with a partialorthostatic load under the influence of the activityof the trunk postural muscles.2.3 Full yoga breathing and spontaneous respirationduring sitting (TABLE 3, Fig. 5, 6)During full yoga breathing (interval T6) a significantenhancement in the total spectral power, comparedwith spontaneous respiratory frequency, occurred,which is very probably related to the intensity ofthe respiratory volume. In the following positionsduring spontaneous respiration, the total spectralpower again signifi cantly declined. A frequencyshift of respiratory bound vagus activity from theHF zone into the LF zone happens as a result ofa decrease in respiratory frequency (x – = 6.4) andsimultaneously the spectral power of this frequencycomponent increases influenced by the enhancementof respiratory volume. A frequency shift of respiratorybound vagus activity owing to a change in respiratoryfrequency has a linear character; changes in ampli-
54 Acta Univ. Palacki. Olomuc., Gymn. 2004, vol. 34, no. 2TABLE 5Changes in selected functional parameters of SAHRV at intervals during sitting with spontaneous respiration (intervalT9) and fast rhythmised respiration – kapalabhaty (interval T10)T9 spont.resp. T10 kapalabhaty Stat.sigParameter x – S x – S T9 : T10Spect. pow. VLF 1067.09 709.89 598.09 404.19Spect. pow. LF 2145.9 2249.28 681.63 501.49 **Spect. pow. HF 2866.9 2228.97 513.33 472.82 **Rel. sp. pow VLF 22.73 17.53 35.81 15.11 *Rel. sp. pow LF 32.05 20.56 38.25 12.35Rel. sp. pow HF 45.22 23.38 25.93 12.16 **Freq. VLF 23.09 7.58 23 7.21Freq. LF 97.8 31.44 85.38 18.91Freq. HF 246.7 89.97 232.16 114.22Rat. LF/HF 0.75 0.52 1.33 0.96R-R interval 0.98 0.14 0.89 0.17 **CCV LF 4.18 2.03 2.94 1.38CCV HF 5.02 2.37 2.43 1.34 **Total spect. pow. 6078.7 3568.39 1793.06 1139.74 **Resp. freq./min. 11.8 3.2 107.4 14.4Counted Fr. resp. 14.77 5.37 13.9 6.84Fig. 7Frequency and amplitude changes in respiratory bound vagus activity in frequency zone HF during respiration frequencyof 12 cycles/min., 15 cycles/min., 12 cycles/min. and in frequency zone LF during respiration 6 cycles/min.Influence of respirationrhythmicity on positionchanges of respiratorybound vagal activity inspectral analysis of heartrate variability.SUPINEint. T4 – T612/minSUPINE – STANDING – SUPINEint. T1 int. T2 int. T36/min15/min12/min12/minPosition of respiratory boundfrequency component mostprobably vagus related ismodulated frequencyrespiration, its amplitude inrelation to breathing capacity.tude of this frequency, modulated by respiratoryvolume, exhibit exponential character.2.4 Alternating breathing through right and left nostrilsand spontaneous respiration (TABLE 4, Fig. 5, 6)During alternating respiration through the right andleft nostrils (interval T8) the enhancement of total spectralpower happened compared with previous positionswith spontaneous respiration (interval T7), and theresulting changes were not significant. In the followingposition T9 during spontaneous respiration, a reductionin the total spectral power at the starting levelT7 occurred. During this technique of respiration,a significant reduction in the spectral power of frequencycomponent VLF, in enhancement of activity
Acta Univ. Palacki. Olomuc., Gymn. 2004, vol. 34, no. 2 55in the LF zone and non-significant enhancement inthe HF zone, occurred. A similar reaction can befound in relative spectral powers. Similar trends canalso be found in CCVLF and CCVHF parameters.Interpretation of frequency and amplitude changesduring the use of this respiratory technique is unclear.Enhancement of activity in the dominantfrequency in the LF zone is partially influenced byvariation in individual respiratory frequency values.It is not clear why simultaneous enhancement of activityin the HF zone happens. The question raisedhere is whether partial enhancement of respiratoryresistance in upper airways during blockage of onenostril does not have any relation to increased vagusactivity.2.5 Rapid rhythmic diaphragm breathing (kapalabhaty)and spontaneous respiration (TABLE 5, Fig. 5, 6)At interval T10 as compared to the T9 interval, therewas a distinct reduction of total spectral power and asimultaneous decline of spectral power in all partialfrequency components. These changes of spectralpowers create a functional picture of a stress situation.During use of this technique of respiration shift of frequencybound on respiration frequency happened inthe sphere of frequency that is above the frequencyfield of 0.4 Hz, which is the upper frequency zoneregistered by the diagnostic system Vario TF4 andother variants of the device. Respiratory boundvagus activity is thus out of the frequency zone ofthe HF frequency component. In the zone of thisHF frequency component (0.2–0.4 Hz) we find adominant frequency that is not bound to respiratoryfrequency and its source is unclear. If we regard theHF zone as total parasympathetic activity, then itis possible to consider these frequencies in the HFzone as a source of parasympathetic activity originatingin the inner organs innervated by the nervusvagus.DISCUSSIONThe relationship between rhythmised respiratory frequencyand spontaneous respiratory frequency while lying, andobserved SAHRV changesIt is essential to regard respiratory pattern as a fundamentalfactor in modulating the actual functionalactivity of the autonomous nervous system. Rhytmisationof respiratory frequency stabilises the positionof respiratory bound frequency regarded to be a basicfunctional component linked to parasympathetic activity.We found the relationship of respiratory frequencyto respiratory bound frequency as determined by thenumeric relation RvFr (mHz) = 0.0167 (Hz) × Rf/min.described in the works of Kolisko, Salinger, Opavský etal. (1997) in the sample of examined people during theuse of a standardly rhythmised respiratory frequency of12 cycles/min. while standing and also in the lying position.Also, Brown et al. (1993) arrived at similar resultson the relationship between respiratory frequency andR-R interval fluctuation.Under these conditions we can unambiguously assessthe activity in the HF zone in the output listing ofSAHRV as total parasympathetic activity. If we regardrespiratory frequency in harmony with Paleček et al.(1999), and Ganong (1999) as an ergonomically optimalfunctional coalition of respiratory frequency, respiratoryvolume and muscle tone of the inspiratory andexpiratory muscles, we did not find during rhythmisedrespiratory frequency any significant decrease in totalspectral power that would signal rhythmised respiratoryfrequency to be perceived by the body refl ectively asa specific kind of load.At intervals with spontaneous respiration, a considerablevariability of individual respiratory frequencyoccurred within the observed sample. It is very probablethat the changes in spectral powers and in the relativespectral powers of LF and HF frequency componentsduring spontaneous respiration, when compared torhythmised respiratory frequency are modulated by theinfluence of value variability in individual respiratoryfrequency during measured intervals.The relationship between the change from the lying to thesitting position during the use of spontaneous respiratoryfrequency and the observed SAHRV changesThe change from a lying to a sitting position duringspontaneous respiration is perceived reflexively in thebody as a specific type of postural load when reductionof total spectral power and a signifi cant reduction ofactivity in the zone of the HF frequency component occurin comparison to the lying position. Since sitting isunderstoood by us to be partial orthostasis, changes inANS reactivity are not so typical compared to stan dingand lying positions. The sitting position is, however,functionally suitable for more effective engagement ofrespiratory muscles during inspiration and the facilitationof a respiratory pattern with prevailing diaphragmrespiration. Apparently for this reason, the oriental techniquesof respiratory exercises recommend sitting withcrossed legs or sitting on one’s heels as basic positionsduring autoregulative exercises emphasising an uprighttrunk position.The relationship among spontaneous respiration frequency,selected respiration techniques and observed SAHRV parametersIntensifi ed respiration with continual engagementof inspiration and expiration muscles (the so-calledtechnique of full yoga respiration) is characterised byintensifi cation of respiration volume, a decrease in
56 Acta Univ. Palacki. Olomuc., Gymn. 2004, vol. 34, no. 2respiration frequency and a higher level of inspirationand expiration muscle activation. Decrease of respiratoryfrequency led to a shift of frequency componentbound to respiration that we regard as vagus activity inthe spectral field in the sphere of LF frequency component.According to Paleček et al. (1999), intensifyingrespiratory volume infl uences pressure proportion inthe lungs and reflectively stimulates total vagus activity.When compared to spontaneous respiration, we foundsignifi cant enhancement of total spectral power, thatwe regard as the demonstration of total activity of theautonomous nervous system. Respiratory bound vagusactivity moved during bradypnoe into the sphere ofthe LF frequency component, mainly participating inthe enhancement of total spectral power. Respiratorybound vagus activity, respectively frequency and amplitudechanges are influenced by the relationship betweenrespiratory frequency and volume. Their dominant frequencyin the zone of the HF frequency componentwas not bound in this case to respiration and its sourceis still unclear. The influence of the activity of other innerorgans, parasympathetically directed, comes underconsideration. There is also the probability that thedominant frequency in the HF zone is a harmonic frequencyinfluenced by a frequency shift of the dominantfrequency bound to respiration.Respiring alternatively through the right and leftnostrils (the technique of anuloma viloma) was linkedwith a decrease in respiratory frequency, enhancementof respiratory volume and partial enhancement of upperairways resistance when compared to spontaneousrespiration. According to empirical experience, this respiratorytechnique is regarded as a so-called harmonisedrespiration technique, leading to a subjective feeling ofmental calming when applied. This technique presenteditself within the results of the spectral analysis of heartrate variability as a non-significant enhancement of totalspectral power, a decrease in spectral power in the zoneof the VLF frequency component and, at the same time,an enhancement of spectral power in the sphere of LFand HF frequency components. The spectral power ofthe LF frequency component was very probably modulatedby a shift of respiratory bound parasympatheticactivity during the slowing of respiratory frequency toless than 9 cycles/min. from the HF zone during spontaneousrespiration into the LF zone during applicationof this technique. Compared to spontaneous respirationit is possible to understand this technique specifically asrelaxation and as a regenerative technique that increasesthe share of parasympathetic activity in the total ANSactivity.The kapalabhaty technique consists of shallowrapid diaphragm breathing with a frequency of about120 cycles/min. During this respiratory technique we observeda significant reduction in the total spectral powerand a concurrent reduction in the spectral powers in allthree partial spectral components. Respiratory boundvagus activity shifted during the use of this techniqueabove the upper frequency zone of 0.4, respectively0.5, Hz and its frequency, we suppose, regarding theaverage respiration frequency of 107.4 cycles/min. in theproximity of 1.79 Hz. The picture of SAHRV changesduring this technique is a reflection of a specific stresssituation characterised by a higher share of sympatheticactivity regulating cardiac activity. The origin of lurkingfrequency activity in the zone of HF frequency componentthat is not bound to respiration is still unclear. Theorigin of these frequencies in the HF zone we probablysee as activity that is modulated by signals from otherinner organs innervated by the vagus nerve.CONCLUSIONS• Respiratory pattern is a fundamental factor that objectivelyinfluences the actual functional activity ofthe autonomous nervous system and increases theextent of vagus activity in its total activity.• Respiration frequency actually influences the positionof respiratory bound frequency that we regardas vagus activity. The position of respiratory boundvagus activity can be expressed by the numericrelation RvFr (mHz) = 0.0167 × Rf/min. duringexamination by SAHRV method. (Question no. 1,confirmation of hypothesis no. 1.)• Rhythmisation of respiration, respectively stabilityof respiratory frequency and stability of respiratoryvolume, stabilises the frequency and amplitude ofrespiratory bound vagus activity.• During bradypnoe with a respiratory frequency ofless than 9 cycles/min., a shift of respiratory boundactivity happens, from the HF frequency componentinto the zone of the LF frequency component. Respiratorybound vagus activity, under these conditions,becomes the dominant frequency in the zone of theLF component. (Confirmation of hypothesis no. 3.)• An increase in respiratory volume during the useof the bradypnoe technique of full yoga breathincreases signifi cantly the amplitude modulation(spectral power in ms 2 ) of respiratory bound vagusactivity. Enhancement of ANS activity with a higherdominance of parasympathetic activity is the effectof this type of respiration. (Confirmation of hypothesesno. 2, 4.)• The so-called technique of kapalabhaty (tachypnoe)can be regarded as a specific type of physical loadthat decreases markedly the variability of R-R intervals.• Frequency activity in the zone of the HF frequencycomponent during use of the kapalabhaty techniquewhen the frequency shift of respiratory bound vagus
Acta Univ. Palacki. Olomuc., Gymn. 2004, vol. 34, no. 2 57activity out of the registered frequency spectrum isregarded as activity in the HF zone that is not boundto respiration as an activity originating probablyfrom parasympathetically directed signals from innerorgans. (Confirmation of hypothesis no. 5.)REFERENCESAkselrod, S., Gordon, D., Madwed, J. B., Snidman, N.C., Shannon, D. C., & Cohen, R. J. (1985). Hemodynamicregulation: Investigation by spectral analysis.American Journal of Physiology, 18, 867–875.Akselrod, S., Gordon, D., Ubel, F. A., Shannon, D. C.,& Cohen, R. J. (1981). Power spectrum of heart ratefluctuations: A quantitative probe of beat-to-beat cardiovascularcontrol. Science, 213, 220–223.Baštecký, J., Šavlík, J., & Šimek, J. (1993). Psychosomatickámedicína. Praha: Grada – Avicenum.Benson, H., & Starková, M. (1997). Moc a biologievíry v uzdravení (Černý, V. A., Trans). Praha: Práh.(Original work published 1996).Brown, T. E., Beightol, L. A., Koh, J., & Eckberck, D. L.(1993). The important infuence of respiratorion onhuman R-R interval power spectra is largely ignored.Journal of Applied Physiology, 75, 2310–2317.Cacioppo, J. T., Bernston, G. G., Binkley, P. F., Quigley,K. S., Uchino, B. N., & Fieldstone, A. (1994).Autonomic cardial control. II. Basal response,noninvasive indices, and autonomic space as revealedby autonomic blockades. Psychophysiology,31, 586–598.Dostálek, C. (1996). Hathajóga. Praha: Karolinum.Dostálek, C., & Krása, H. (1976). Vliv dechovéfáze na tvorbu podmíněného refl exu u člověka.Československá psychologie, 18, 401–410.Dylevský, I., Druga, R., & Mrázková, O. (2000). Funkčníanatomie člověka. Praha: Grada.Fabián, Z., Lepičovská, V., & Dostálek, C. (1982). Onthe analysis of quasiperiodical changes in EEC andrespiration during breathing exercises. Acta Nerv.Super., 24(3), 173–174.Frostel, C., Pande, J. N., & Hedenstierna, G. (1983).Effects of high-frequency breathing on pulmonaryventilation and gas exchange. Journal of AppliedPhysiology, 55(6), 1854–1861.Ganong, W. F. (1999). Přehled lékařské fyziologie. (J.Berger a kolektiv, Trans.). Praha: H & H. (Originalwork published 1961).Goldberger, A. L., Findley, L. J., Blackburn, M. R., &Mandell, J. A. (1984). Nonlinear dynamics in heartfailure: Implications of longwavelength cardiopulmonaryoscillations. American Heart Journal, 107,612–615.Goldberger, J. J., Ahmed, M. W., Parker, M. A., & Kadish,A. H. (1994). Dissociation of heart rate variabilityfrom parasympathetic tone. American Journal ofPhysiology, 266, H2152–H2157.Gore, M. M., & Gharote, M. L. (1987). Intermediateeffect of a minute of kapalabhati on respiratory functions.Yoga Mimamsa, 35(3–4), 14–23.Grossman, P. (1992a). Breathing rhythms of the heart ina world with no steady state: A comment on Weber,Molenaar, and van der Molen. Psychophysiology, 29,66–72.Grosmann, P. (1992b). Respiratory and cardiac rhythmsas a window to central and autonomic behavioralregulation: Selection frames, keeping the panes cleanand viewing neural topography. Biological Psychology,34, 131–161.Grossman, P., Karemaker, J., & Wieling, W. (1991).Prediction of tonic parasympathetic cardiac controlusing respiratory sinus arrytmhia: The need for respiratorycontrol. Psychophysiology, 28, 201–216.Grossman, P., & Kollai, M. (1993). Respiratory sinus arrythmia,cardiac vagal tone and respiration: Withinand between-subject relations. Psychophysiology, 30,486–495.Grossman, P., van Beek, J., & Wietjes, C. (1990) A comparisonof three quantification methods for estimationof respiratory sinus arrythmia. Psychophysiology,27, 702–714.Hayano, J., Sakakibara, Y., Yamada, A. et al. (1991).The accuracy of the assessment of cardiac vagal toneby heart rate variability in normal subjects. AmericanJournal of Cardiology, 67, 199–204.Ježek, M. (2001). Vliv jógových dechových technik nafunkční změny autonomního nervového systému.Diplomová práce, Univerzita Palackého, Fakultatělesné kultury, Olomouc.Katona, P. G., & Jih, F. (1975). Respiratory sinus arrythmia:A noninvasive measure of parasympatheticcardiac control. Journal of Applied Physiology, 39,801–805.Kolisko, P., Salinger, J. et al. (1997). Jógová cvičení a diagnostikafunkčních změn autonomního nervovéhosystému pomocí diagnostického systému TF 3, 4.Olomouc: Fakulta tělesné kultury.Kolisko, P., Salinger, J., Opavský, J., Stejskal, P., Jandová,D., Slováček, K., & Ježek, M. (2001). Vliv řízenéhoa spontánního dýchání na změny funkčního stavuautonomního nervového systému. In H. Válková &Z. Hanelová (Eds.), Pohyb a zdraví (pp. 269–275).Olomouc: Vydavatelství Univerzity Palackého.Kollai, M., & Mizsei, G. (1990). Respiratory sinus arrythmiais a limited measure of cardiac parasympatheticcontrol in humans. Journal of Physiology, 424,329–342.Lepičovská, V., & Dostálek, C. (1981). ECG changesproduced by some hathayogic exercies. Acta Nerv.Super., 23, 539–552.
58 Acta Univ. Palacki. Olomuc., Gymn. 2004, vol. 34, no. 2Meyer, J. S., & Gotoh, F. (1960). Metabolic andelectroencephalographic effects of hyperventilation.Acta neurologica, 3, 539–552.Miles, W. R. (1964). Oxygen comsumption during thepractice of three yoga type breathing patterns. J.Appl. Physiol., 19(1), 75–82.Malik, M. (1998). Clinical guide to cardiac autonomicstests. Dortrecht: Klewer.Míček, L. (1984). Duševní hygiena. Praha: Státní pedagogickénakladatelství.Ornish, D. (1991). Reversing heart disease. London:Random Century Ltd.Patel, C. H. (1978). Yoga and biofeedback in themanagement of hypertension. Lancet II, 7837,1053–1056.Paleček, F. et al. (1999). Patofyziologie dýchání. (2nded.) Praha: Akademia.Raghujar, P., & Telles, S. (2003). Effect of yoga-basedand forced uninostril breathing on the autonomicnervous system. Perceptual & Motor skills, 96(1),79–80.Saul, J. P., Berger, H. D., Chen, M. H., & Cohen, R.J. (1989). Transfer function analysis of autonomicregulation: II. Respiratory sinus arrythmia. AmericanJournal of Physiology, 256, 153–161.Saul, J. P., Kaplan, D. T., & Kitney, R. I. (1988). Nonlinearinteractions between respiration and heartrate: A phenomenon common to multiple physiologicstates. Computer in Cardiology, 15, 299–302.Souček, M., Kára, T. et al. (2002). Klinická patofyziologiehypertenze. Praha: Grada.Stejskal, P., Šlachta, R., Elfmark, M. et al. (2002).Nová metoda hodnocení spektrální analýzy variabilitysrdeční frekvence. Acta Univ. Palacki. Olomuc.,Gymn., 32(2), 13–18.Salinger, J., Vychodil, R., Novotný, J. et al. (1995). Telemetriccomputer-aided system for the non-invasiveexaminition of heart rate variability, type Varia PulseTF3. In A. Murray & R. Arzbaecher (Eds.), Computersin Cardiology 1995 (pp. 437–440). Los Alamitos:The Institute of Electrical and Electronics Engineer(IEEE) Computer Society Press.Salinger, J., Pumpla, J., Vychodil, R. et al. (1999).A microcomputer system for the telemetric assessmentof short term heart rate variability in time andfrequency domains type Varia Cardio TF4. In A.Murray & S. Swiryu (Eds.), Computers in Cardiology1999 (pp. 599–602). Los Alamitos: The Institute ofElectrical and Electronics Engineer (IEEE) ComputerSociety Press.Šlachta, R., Stejskal, P., & Elfmark, M. (2002). Age andheart rate variability. Acta Univ. Palacki. Olomuc.,Gymn., 32(1), 59–67.Véle, F. (1997). Kineziologie pro klinickou praxi. Praha:Grada – Avicenum.Yamamoto, Y., & Hughson, R. L. (1991). Coarse-grainingspectral analysis: A new method for study ing heartrate variability. J. Appl. Physiol., 71, 1143–1150.VYUŽITÍ METODY SPEKTRÁLNÍ ANALÝZYVARIABILITY SRDEČNÍ FREKVENCEPŘI HODNOCENÍ EFEKTU VYBRANÝCHDECHOVÝCH TECHNIK NA AKTUÁLNÍFUNKČNÍ ZMĚNY AUTONOMNÍHONERVOVÉHO SYSTÉMU(Souhrn anglického textu)Dýchání je jeden ze základních faktorů, které ovlivňujíaktuální funkční stav autonomního nervového systému.V naší výzkumné studii jsme se pokusili objasnits využitím diagnostického systému Varia Cardio TF4a metody spektrální analýzy variability srdeční frekvencevliv volní regulace dechového vzoru na aktuální funkčnízměny variability R-R intervalů, které úzce souvisís vlivem regulace n. vagus na změny variability R-Rintervalů. Sledovali jsme tak vliv vybraných jógovýchtechnik dýchání na frekvenční a amplitudové změny vesledovaném frekvenčním spektru 0,02–0,4 Hz, kterésouvisí s aktivitou autonomního nervového systému.Jednu z frekvenčních komponent v tomto pásmu tvořírespiračně vázaná aktivita vagu. Tato frekvence a jejíamplituda se výrazně stabilizuje při rytmizaci dechovéfrekvence. U dechových technik s prohloubeným dýchánímdochází k výraznému zvýšení celkového spektrálníhovýkonu, na kterém se podílí především frekvenčníkomponenta, kterou považujeme za respiračně vázanouaktivitu vagu. Amplituda této frekvence je modulovánadechovým objemem a aktivitou inspiračních svalů, jejífrekvence se v závislosti na rytmicitě dýchání měnío 0,0167 Hz/1 dechový cyklus. Během rytmizovanédechové frekvence 12 cyklů/min. a poměru rychlostiinspiria k expiriu 2 : 3 nacházíme tuto frekvenční komponentustabilizovanou v pásmu 0,2 Hz.Klíčová slova: variabilita srdeční frekvence, autonomnínervový systém, regulované/spontánní dýchání.
Acta Univ. Palacki. Olomuc., Gymn. 2004, vol. 34, no. 2 59PaedDr. Petr Kolisko, Ph.D.Palacký UniversityFaculty of Physical Culturetř. Míru 115771 11 OlomoucCzech RepublicEducation and previous work experienceUniversity education, teacher at basic school, secondaryschool and Palacký University.Scientific orientationPhysical education and sport for people with chronichealth conditions, nonpharmacological and alternativemethods of the treatment, spa culture.First-line publicationsKolisko, P. (2000). Vliv a využití pohybové aktivity a některýchdalších nefarmakologických metod podporyzdraví v primární a sekundární prevenci rizikovýchfaktorů ischemické choroby srdeční. Disertační práce,Univerzita Palackého, Fakulta tělesné kultury, Olomouc.Kolisko, P., Stejskal, P., Dittmar, R., & Opletal, V.(2002). Cesty zdraví. Olomouc: Press Artis.Kolisko, P. (2003). Integrační přístupy v prevenci vadnéhodržení těla a poruch páteře u dětí školního věku. Olomouc:Univerzita Palackého.Kolisko, P., & Fojtíková, M. (2003). Prevence vadnéhodržení těla na základní škole. Ostrava: PRO prints.r.o.
Acta Univ. Palacki. Olomuc., Gymn. 2004, vol. 34, no. 2 61THE AGILITY TEST IN FUNCTIONAL DIAGNOSTICS OF ATHLETESErika Zemková, Dušan HamarInstitute of Sport Sciences, Faculty of Physical Education and Sports, Comenius University, Bratislava, SlovakiaSubmitted in August, 2003The paper deals with the agility test as a diagnostic method for the assessment of the multi choice reaction time ofthe lower limbs. A group of 236 athletes (mean age 21.5 ± 2.9 years, height 178.1 ± 8.1 cm, and weight 72.2 ± 9.4 kg)performed an agility test. They had to touch with either the left or right lower extremity one of the four pads locatedin four corners inside of a 80 cm square. Pads had to be touched in accordance with the location of a stimulus generatedin one of the corners of the screen. The computer based system FiTRO Agility Check was used to generate thestimuli and measure corresponding reaction times. The results showed better agility of lower limbs in adults than inchildren. Cross sectional tests revealed that competitors in table tennis, fencing, karate, ice hockey, soccer, basketball,volleyball, and aikido performed significantly better than physical education students, judokas and wrestlers. In a groupof eight 15-yr old female volleyball players, a repeated test after 6 weeks of training aimed at reaction and speed abilitiesshowed a significantly shorter reaction time as compared to general training. A one-year training period in volleyballled to a significant improvement of the agility skills of athletes related to their actual ranking. The results obtainedindicate that the agility test allows talent identification, differentiation of athletes with different performance levels inagility skills as well as changes of these abilities during short and long term training periods.Keywords: Agility test, multi choice reaction time, sport motor testing, talent identification, training.INTRODUCTIONMulti choice reaction time and movement velocityare the most principal capabilities to be measured inmany sports, such as tennis, fencing, karate, ice hockey,soccer, basketball, volleyball, aikido, etc. For their assessmenta computer based portable device was developedin a laboratory of the Institute of Sport Sciencesby Hamar et al. (1997). The main task of subjects is totouch the contact switch pad in one of four directionsaccording to the position of the stimulus on the screen(Fig. 1a and 1b). As a result the reaction time in eachdirection is displayed (TABLE 1). Its advantage is thatit provides laboratory accuracy in field-testing, which isnecessary, especially these days, when many of the testsare done out in the playing field or gym.Therefore, the aim of the study was to present resultsand experiences with the agility test in the functionaldiagnosis of athletes.MATERIAL AND METHODSAltogether 236 subjects (mean age 21.5 ± 2.9 years,height 178.1 ± 8.1 cm, and weight 72.2 ± 9.4 kg) performedan agility test. They had to touch, as fast aspossible, with either left or right lower extremity, oneof the four pads located in four corners inside of an80 cm square. Pads had to be touched in accordancewith the location of a stimulus in one of the corners ofthe screen. The computer based system FiTRO AgilityCheck was used to generate the stimuli and measure thereaction times (Hamar & Zemková, 1998).In the previous study the reliability of the test procedurewas verified and the protocol standardized by theexamination of 196 persons. Analysis of the repeatedmeasures showed a measurement error of 7.1%, which isin the range comparable to common motor tests (Hamar& Zemková, 1998). The mean of the best 8 reactiontimes to each direction proved to be the most reliableparameter of the test consisting of 3 sets of 60 stimuli(15 in each direction) with a random generation of theirlocalization (Zemková & Hamar, 1998).RESULTS AND DISCUSSIONThe results showed various possibilities of applicationof the agility test in sport motor testing ofathletes:Differentiation of groups of athletes with different demandson the agility of the lower extremitiesCross sectional tests revealed (Zemková & Hamar,1999) that table tennis players (326.1 ± 16.0 ms), fenc-
62 Acta Univ. Palacki. Olomuc., Gymn. 2004, vol. 34, no. 2Fig. 1a and 1bFiTRO Agility check for the assessment of multi choicereaction time of the lower extremitiesing performers (336.6 ± 17.4 ms), karate performers(339.4 ± 33.4 ms), ice hockey players (352.1 ± 28.9 ms),soccer players (364.0 ±33.8 ms), basketball players(369.3 ± 26.3 ms), volleyball players (370.6 ± 32.1 ms),and aikido performers (389.1 ± 38.4 ms) achieved asignifi cantly shorter reaction time in the agility testthan physical education students (398.8 ± 40.9 ms), judoperformers (400.3 ± 27.7 ms), and wrestlers (497.6 ± 20.9 ms)(Fig. 2). These results indicate that the test allows fordifferentiation of athletes with different performancelevels in agility skills.Talent identificationReaction and speed influence performance in manysports. However, these abilities considerably depend ongenetic dispositions and may be improved only by about15 to 25%. Therefore, information about the values ofreaction time in children of different ages is in sportpractice useful for talent identifi cation. On the otherhand, it has to be pointed out that the accuracy ofmeasurements of sensomotor parameters is influencedby many factors including motivation, incentive, attentiveness,etc., which are difficult to control in youngersubjects. Therefore, one has to be careful using thesevalues for selection of young sports talent.Such a cross-sectional study showed (Zemková& Hamar, 2001) that reaction time in the agility testwas 815.7 ± 100.9 ms for 7 and 8 year old children,649.6 ± 95.2 ms for 9 and 10 year olds, 604.9 ± 97.7 msfor 11 and 12 year olds, 467.5 ± 77.6 ms for 13 and 14year olds, 453.3 ± 38.6 ms for 14 and 15 year old youth,and 398.8 ± 40.9 ms for adults age from 20 to 26 yearsold (Fig. 3). This fi nding is in agreement with thereports of several authors (e.g. Thomas et al., 1981)who found that reaction time linearly decreased withincreased age up to early maturity.TABLE 1An example of the results of the agility testName: P. K. Date: 5. 5. 1998 Time: 16:21:34Test Setup: trial 1 Yellow Circle on Black BackgroundComment: hockeyMOVEMENT N BEST WORST AVERAGE SDDIRECTION (#) (ms) (ms) (ms) (ms)rear left 15 299 2092 661.4 582.3rear right 15 271 2017 561.1 433.4front left 15 309 1220 448.4 220.6front right 15 256 1340 522.3 345.2TOTAL 60 256 2092 548.3 423.8
Acta Univ. Palacki. Olomuc., Gymn. 2004, vol. 34, no. 2 63Fig. 2The results of the agility test in various sports (n = 193)600500p
64 Acta Univ. Palacki. Olomuc., Gymn. 2004, vol. 34, no. 2Fig. 4 and 5The results of the agility test after six weeks of general training and training focused on the improvement of the agilityof the lower extremities (n = 8)450450TIME (ms)400373.24393.71TIME (ms)TIME(400395.03350350329.74n.s.p
Acta Univ. Palacki. Olomuc., Gymn. 2004, vol. 34, no. 2 65limbs was evaluated. After exercise of moderate intensitythere was a significant improvement (p < 0.05) of meanresponse time from 369.3 ± 38.6 ms to 339.6 ± 24.3 ms(Fig. 7). On the other hand, after exercise above theanaerobic threshold, there was a signifi cant increase(p < 0.05) from 338.3 ± 43.9 ms to 412.5 ± 47.0 ms(Fig. 8) indicating that multiple reaction time of thelower limbs depends on the type of fatigue.Such a phenomenon was observed in several studies.McMorris & Keen (1994) have demonstrated thatsimple reaction time after maximally fatiguing exercisewas significantly slower than after moderate exercise.Similarly, during exercise with increasing intensity upto exhaustion it was found that the multiple reactiontime decreased until the intensity exceeded the lactatethreshold by approximately 25%, and then rapidly increased(Chmura et al., 1994). However, it has beenreported that young athletes are able to maintain for arelatively long time, or even increase, their psychomotorperformance during exercise not only below but alsoabove the lactate threshold (Chmura et al., 1998). Forsuch a positive effect of exercise on cognitive functioningan enhanced activation is very probably responsible(Hogervorst et al., 1996) and both the peripheralcomponent (muscle contraction) and central nervoussystem integrity, primarily reflect cognitive processingspeed (Birren et al., 1980).Aside from diagnostics, the test may be applied forthe purpose of the development of agility skills in varioussports. Subjects may react from a position in themiddle of the square of four pads or from the location ofthe last stimuli. In addition, the device offers a variety oftest settings, i.e. time generation (constant or random),number, form, and color of the stimulus, and color ofthe background.The test setting can be adjusted in accordance witha sport specific task, i.e. either four or two pads for karate(Zemková & Hamar, 1998) and fencing performers ortennis players (Psalman, 2002) in accordance with theirmovements on the field. In addition, a longer distancebetween mats (5 m) for basketball, hockey, soccer orvolleyball players (Zemková et al., 2003) may be used totest multi choice reaction times in the lower extremitiesas well as sprint performance (Fig. 1b). For these sportssuch a modified version of the test is considered to bea more specific and hence more suitable alternative forthe assessment of agility abilities.CONCLUSIONIt may be concluded that by means of the contactmats used, the multi choice reaction times and movementspeed in a variety of agility skills may be evaluated.The test allows talent identification, differentiation ofgroups of athletes with different demands on agility oflower extremities, assessment of the effect of specifi ctraining focused at the improvement of these abilitiesas well as development of agility skills in various sports(tennis, fencing, karate, ice hockey, soccer, basketball,volleyball, aikido, etc.).REFERENCESBirren, J. E., Woods, A. M., & Williams, M. V. (1980).Behavioral slowing with age: Causes, organization,and consequences. In L. W. Poon (Ed.), Aging in the1980s: Psychological issues (pp. 293–308). Washington,DC: American Psychological Association.Hamar, D. et al. (1997). Test agility. Bratislava: Oddelenietelovýchovného lekárstva Ústavu vied o športeFTVŠ UK.Hamar, D., & Zemková, E. (1998). Test disjunktívnychreakčno-rýchlostných schopností dolných končatín.Med Sport Boh Slov, 7(3), 74–78.Hogervorst, E., Riedel, W., Jeukendrup, A., & Jolles,J. (1996). Cognitive performance after strenuousexercise. Percept Mot Skills, 83(2), 479–488.Chmura, J., Nazar, K., & Kaciuba-Uscilko, H. (1994).Choice reaction time during graded exercise in relationto blood lactate and plasma catecholaminethresholds. Int J Sports Med., 15(4), 172–176.Chmura, J., Krysztofi ak, H., Ziemba, A. W., Nazar,K., & Kaciuba-Uscilko, H. (1998). Psychomotorperformance during prolonged exercise above andbelow the blood lactate threshold. Eur J Appl PhysiolOccup Physiol., 77(1–2), 77–80.Luknárová, A., & Zemková, E. (1997). Dynamikaz mien reakčných a rýchlostných schopností dolnýchkončatín v teste agility v juniorskej reprezentácii vovolejbale. In Hry v programech tělovýchovných procesů(pp. 87–90). Plzeň: Pedagogická fakulta ZČU.Luknárová, A., Zemková, E., Hamar, D., & Červeň, Ľ.(1998). Zmeny disjunktívnych reakčno-rýchlostnýchschopností dolných končatín v priebehu ročnéhotréningového cyklu. In Zborník z odborného seminárak 760. výročiu založenia mesta Trnavy (pp. 56–62).Trnava: Katedra telesnej výchovy a športu MtF STU.McMorris, T., & Keen, P. (1994). Effect of exercise onsimple reaction times of recreational athletes. PerceptMot Skills, 78(1), 123–130.Psalman, V. (2002). Reakčné a reakčno-rýchlostnéschopnosti tenistov. In Vedecký seminár Optimalizáciazaťaženia v telesnej a športovej výchove (pp. 100–104).Bratislava: Katedra telesnej výchovy SjF STU.Thomas, J. R., Gallagher, J. D., & Purvis, G. J. (1981).Reaction time and anticipation time: Effects of development.Research Quarterly for exercise and sport,52(3), 359–367.
66 Acta Univ. Palacki. Olomuc., Gymn. 2004, vol. 34, no. 2Zemková, E., Hamar, D., & Argaj, G. (2003). Rozdielnypodiel motorickej zložky a parametre disjunktívnychreakčno-rýchlostných schopností u basketbalistov.Tel. Vých. Šport, 13(2), 10–12.Zemková, E., & Hamar, D. (1999). Disjunktívnereakčno-rýchlostné schopnosti u športovcov rôznychšpecializácií. Slovenský lekár, 9(4–5), 145.Zemková, E., & Hamar, D. (1998). Disjunktívnereakčno-rýchlostné schopnosti v úpolových športoch.In Zborník z vedeckej konferencie Súčasný stav a perspektívaSokola (pp. 112–117). Košice: Technickáuniverzita.Zemková, E., & Hamar, D. (2001). Posudzovanie disjunktívnychreakčno-rýchlostných schopností. Bratislava:Oddelenie telovýchovného lekárstva Ústavu viedo športe Fakulty telesnej výchovy a športu UK.Zemková, E., & Hamar, D. (1998). Test disjunktívnychreakčno-rýchlostných schopností dolných končatín.In Sborník z celostátní studentské vědecké konferences mezinárodní účastí v oboru kinantropologie (pp.178–181). Olomouc: Univerzita Palackého.Zemková, E., Hamar, D., Luknárová, A., & Červeň, Ľ.(1998). Zmeny disjunktívnych reakčno-rýchlostnýchschopností dolných končatín pri rozdielnom zameraníšportovej prípravy u mladých volejbalistiek. InSborník z 2. mezinárodního vědeckého semináře Žákv současném pojetí tělesné výchovy (pp. 76–82). Olomouc:Univerzita Palackého.Zemková, E., Hamar, D., Schickhofer, P., & Gažovič,O. (1998). Disjunktívne reakčno-rýchlostné schopnostiv stave únavy po rôznych formách zaťaženia.In Abstrakta z Národního sjezdu České společnostitělovýchovného lékařství Pohybová aktivita ve zdravía nemoci. Med Sport Boh Slov, 7(3), 111.TEST AGILITY VE FUNKČNÍ DIAGNOSTICESPORTOVCŮ(Souhrn anglického textu)Na základě dosavadních zkušeností je možnétest agility považovat za vhodný způsob posuzovánídisjunkčních reakčně-rychostních schopností a protocílem práce bylo poukázat na některé z možností jehovyužití v praxi. Celkem bylo vyšetřeno 236 sportovců(stolní tenisté, šermíři, karatisté, hokejisté, fotbalisté,basketbalisté, volejbalisté, aikidisté, judisté, zápasnícia studenti FTVŠ) průměrného věku 21,5 ± 2,9 roku,výšky 178,1 ± 8,1 cm a hmotnosti 72,2 ± 9,4 kg. Úlohoutestovaných jedinců bylo reagovat na vizuálnípodnět na monitoru počítače a podle jeho lokalizacevykonat pohybovou odpověď příslušným směrem. Přigenerování podnětů a měření času reakcí bylo použitozařízení FiTRO Agility check. Výsledky poukázaly nakratší reakční čas u dospělých než u dětí. Průřezovévyšetření ukázalo, že stolní tenisté, šermíři, karatisté,hokejisté, fotbalisté, basketbalisté, volejbalisté a aikidistédosáhli významně lepšího výsledku než studenti,judisté a zápasníci. Opakované vyšetření u volejbalistekneukázalo významné změny po 6týdenním všeobecnězaměřeném mezocyklu, k významnému zlepšení došloaž po tréninku zaměřeném speciálně na rozvoj rychlostipohybových reakcí dolních končetin. Výsledkyukazují, že test agility kromě zaznamenávání rozdílůmezi jedinci rozdílného věku a výkonosti, umožňujei poskytování užitečných informací o změnách těchtoschopností v různém období sportovní přípravy, čímž pomáháobjektivizovat efekt tréninku speciálně zaměřenéhona jejich rozvoj. Podle předběžných sledování je vhodnévyužívat test zejména ve sportovních hrách, úpolovýchsportech a ve sportech s krát kodobým výkonem, kde jedůležitá rychlost pohybových reakcí a také jako součástkomplexního posuzování úrovně tělesné zdatnosti u běžnépopulace. Navíc je možné zařízení využívat i v samotnémtréninkovém procesu na rozvoj disjunkčních reakčně-rychlostníchschopností.Klíčová slova: diagnostika, disjunkční reakčně-rychlostníschopnosti, test agility, sportovní příprava, výběr talentů.Mgr. Erika Zemková, Ph.D.Comenius UniversityFaculty of Physical Educationand SportsSvobodovo nábrežie 9814 69 BratislavaSlovakiaEducation and previous work experienceEducation: Faculty of Physical Education and Sports,Comenius University, 1994 Master degree (PhysicalEducation and Sport), 1998 Philosophiae Doctor(Sports Kinantropology).Work: since 1997 Department of Sport Medicine, Instituteof Sport Sciences – Assistant Professor; Functionalassessment of athletes and teaching universitycourses.First-line publicationResearch activities are focused on elaboration ofmethods and sport specific norms for the evaluationof agility, anaerobic capabilities, explosive power, andpostural sway.
Acta Univ. Palacki. Olomuc., Gymn. 2004, vol. 34, no. 2 67MOTOR SKILLS IN MENTALLY RETARDED CHILDRENIrena Momola, Regina MarszałekInstitute of Physical and Health Education, Rzeszów University, Rzeszów, PolandSubmitted in December, 2003The definition of aptitude takes into account functional effectiveness, as well as the quality and speed of reactions observedin an individual. Personal aptitude comprises certain abilities that are in part genetically formulated. The scopeand level of these abilities vary for different individuals. Global abilities are vital for one’s survival and development,whereas particular abilities are crucial for defining one’s individuality, both physical and psychological. The researchwhose results are described in this work emphasized motor skills of mentally retarded children. The examinationswere conducted among 49 children aged 10–19 attending the Special Education Centre in Mrowla in the Podkarpaciecountry and made use of the Ozierecki test. The level of the mental retardation of the test subjects was either moderateor substantial. The classification of the motor skills of the tested individuals was based on the work by Barański.According to the test results, the children with substantial mental retardation had more difficulties in performing thetasks. These children were most impaired with respect to the speed and precision of their reactions.Keywords: Abilities, motor skills, mental retardation.INTRODUCTIONTo maintain an optimal level of physical and mentalfitness is one of the elementary needs of a human being,especially under the circumstances of our civilisation.Shaping and perfecting motor activities is of particularimportance in the case of people with disabilities,including mentally disadvantaged people. This type ofdisability occurs in every society and its incidence oscillatesaround 2–3% of the human population (Eider,1988; Kościelska, 1995; Lausch-Żuk, 1999; Wyczesany,1999).Mental retardation involves two main aspects: oneof them is prevention, regardless of origin, the otheris related to the improvement of an already existingmental disability condition (Clarke & Clarke, 1971;Lausch-Żuk, 1999).The most important mental feature common toall the mentally retarded individuals is an intelligencelevel below the standard. However, this insufficiency ofthe intellect is not the only difference between normaland impaired individuals. Very frequently – althoughnot always – such individuals show a difference in respectto body height and weight, psycho-motor skills,way of thinking, temperament, as well as other mentalfunctions (Clarke & Clarke, 1971; Doroszewska, 1989;Lausch-Żuk, 1999; Olechnowicz, 1994; Polkowska,1994). In the literature concerned with this subject,there are titles whose authors most frequently comparethe physical qualities of normal individuals with thoseof individuals with a small degree of mental disability(Clarke & Clarke, 1971). However, studies of more seriouslyincapacitated children are not so numerous, whichmay result from the substantial difficulties with the organisationof such studies. Seriously retarded childrenvery frequently show deep distrust towards unknownpeople. The high level of concentration disorders whileperforming the required tasks constitutes a substantialobstacle to conducting any research.Although motor skills in mentally impaired peoplewere studied as early as before the First World War, notmuch research has been conducted in this field for thelast 30 years (Clarke & Clarke, 1971; Mleczkowska &Frańczak, 1968; Wyczesany, 1999).Following an analysis of various tests intended formotor skills assessment, the modified Ozierecki scaleseems to be the most appropriate to the subject. Thisscale makes it easier to diagnose neurological and motordisorders, as well as making it possible to determinethe current development level of motor skills in the individualexamined (Barański, 1963; Clarke & Clarke,1971; Mleczkowska & Frańczak, 1968).The objective of this paper is to determine the motoraptitude of children with a serious mental disabilityand to find out whether pedagogical forecasts may begenerated on the basis of the degree of the developmentof their motor skills.RESEARCH MATERIALS AND METHODSThe examinations of the motor skills in mentallyretarded children were conducted in the Special Schooland Upbringing Centre in Mrowla near Rzeszów. Theresearch comprised 49 people aged 10–16, including
68 Acta Univ. Palacki. Olomuc., Gymn. 2004, vol. 34, no. 2TABLE 1General characteristics of the research subjectsSex N Age [years] AgeLevel of mental retardation[x] mild moderate severe10 11 12 13 14 15 16 N % N % N %Girls 21 0 1 4 8 2 4 2 13.47 1 4.76 15 71.42 5 21.80Boys 28 1 4 6 3 7 3 4 13.46 1 3.57 23 82.14 4 14.2821 girls and 28 boys. This group was subdivided intothree subgroups. The 1 st subgroup comprised thosewith a mild level of mental retardation; the 2 nd subgroup– those with a moderate level; the 3 rd subgroup – thosewith a severe level of mental retardation (TABLE 1).Some of the children also have various dysfunctions intheir motor organs (scoliosis, paraplegia, hemiplegia,torticollis, club-foot), but in most cases (85.7%) mentalretardation was the only observed dysfunction (TABLE 2).TABLE 2Dysfunctions in motor organsSexMental retardationWith dysfunctions Without dysfunctionsN % N %Girls 5 23.8 16 76.2Boys 2 7.1 26 92.9The Special School and Upbringing Centre inMrowla near Rzeszów can ensure good conditions forhelping children to achieve suitable motor skills comparableto those of others. There are two halls: one gymand one for correction exercise, and two fields: one forsport and one for recreation where physical educationtraining is held 3–4 times a week and corrective gymtraining is also held (4 hours per week). Children alsohave the opportunity to participate in training in theswimming pool 2 hours per week. All examined childrenattend sporting exercises that improve their motor skills(Momola & Marszałek, 1997).The examinations were carried out in the correctionexercise gym, separately for each individual child. Theexamination was interrupted in case of the physical ormental tiredness of a given child.Tests of motor ability were prepared according tothe Ozierecki method with a Barański modification. Theexercise set for a given calendar age, from 4–16 years ofage, included 6 groups of different motor tasks:– static co-ordination,– dynamic co-ordination,– hand co-ordination,– movement speed,– simultaneous movement performance,– movement precision.The set of tests was held separately in each group.The number of tasks is large and their level of difficultiesincreases with age and that makes the comparisonbetween age groups difficult and the examination timeconsuming.The evaluation is based on pointing out the agegroup in which the child completes all tasks and thosein which the child doesn’t complete any of them. Thusthe range of “motor ability” can be estimated and lateron–according to special rules – the “motor ability age”can be estimated. Based on the Barański classificationone can say whether the child is at a normal level ofdevelopment, backwardness or precociousness in comparisonwith the whole population.The basis for starting the test is estimation of a registeredcalendar age – that is the difference between thedate of research and the date of birth. The next step is– knowing the motor ability age and basis for conductedtasks – an estimation of the difference between the registeredand motor ability age that lets us classify the childinto one of the following categories:– precociousness [+D, +C, +B, +A],– backwardness [–A, –B, –C, –D],– the norm [0].The norm of motor skills is the difference betweenthe registered calendar age and the motor ability ageand varies from 0 to +18 months. In case the differenceis greater than +18 months, motor skills are classifiedat the precocious development level. In case the differenceis below 0 one can say that this is backwardness ofmotor skills (Barański, 1963; Olszowski, 1973; Szopa,Mleczko, & Żak, 1996).RESEARCH RESULTS AND DISCUSSIONOn the basis of the examinations conducted, themotor skills index in the 1 st subgroup was determinedto amount to –24 months in a girl, and –60 months ina boy. It must be mentioned that the boy’s result mayhave been influenced by his excessive obesity (his bodyweight was 96 kg at the body height of 145 cm).The 2 nd subgroup, in which 71% of the girls werecharacterised by a moderate degree of mental retardation,showed the average motor skills index of –57months. The participation of boys in this group was
Acta Univ. Palacki. Olomuc., Gymn. 2004, vol. 34, no. 2 69TABLE 3Results of research on motor skills of children with mental retardation (according to Baranski)SexLevelof NCalendarageMotor skilldevelopmentLevel of motorSymbolmental retardation[x] index–MSDI*[months]skill developmentMild 1 12.00 –24 Moderate level of retardation –BGirls Moderate 15 13.73 –57 Very high level of retardation –DSevere 1 11.00 –72 Very high level of retardation –D4 13.50 – Measureless –Mild 1 13.00 –60 Very high level of retardation –DBoys Moderate 23 13.69 –51 Very high level of retardation –DSevere 4 12.25 – Measureless –MSDI – the difference between motor skills age and calendar agegreater by 11.72%, whereas the average index amountedto –51 months.The 3 rd group consisted of seriously impaired children,including 21% girls and 14% boys. In this group,only one girl managed to complete a test for 5-year-olds,and single tasks for 6-, 7-, and 8-year-olds. The motorskills index for this child was –72 months. The otherchildren in this subgroup were able to complete onlysingle motion tasks in a test, hence they did not reachthe level of the motor skills development characteristicof a 4-year-old child (TABLE 3).An analysis of the degree of acceleration or retardationof motor skills in more seriously impaired childrenpoints to a very high level of retardation. In light of theresults obtained, the requirements of the Ozierecki scaleseem to be too difficult for children with a substantiallevel of mental incapacity.Moreover, the research results served the purpose ofdetermination of the difficulty degree while performingrespective tests. The easiest of the tests proved to be Test2, evaluating dynamic hand co-ordination. The secondeasiest was Test 1, evaluating static co-ordination. Test3, evaluating the level of whole body co-ordination,proved to be more difficult. The most difficult tasks tocomplete of those required were, consecutively, the following:Test 4, evaluating the speed of movements, Test5, of simultaneous movement performance, and Test6, which evaluated movement precision. The obtaineddegree of difficulty in performing the tests points to thenecessity for more lax requirements while performingtasks for the purpose of the assessment of precisionand speed of movements, as well as simultaneous movementperformance. The above-mentioned observationsconcerning the degree of the difficulty of respective testsprove the results of the research by Eider (1988).Examinations – with the use of the Ozierecki test, asmodified by Barański – of the motor skills in childrenwith neurotic disorders, were conducted by Mleczkowskaand Frańczak (1968). They claim that 28 % of thechildren examined showed retardation of motor skillsdevelopment.The level of physical development of children witha partial loss of sight was studied by Pielecki (1994). Accelerationof motor skills development was not found inthose children. The majority of the children were characterisedby a moderate level of motor skills retardation,whereas the least frequent disorders were those of movementprecision, in contrast to the examination resultsobtained in more seriously impaired children.CONCLUSIONS1. The Ozierecki scale offers a very high degree of difficultyfor children with substantial mental retardation.2. Despite the difficulties in performing the test, motorskills in children with slight mental incapacityshould be developed.3. Children with a substantial mental disability showa very high level of motor skills retardation. In thisgroup, the most disturbed are movement precisionand speed, as well as the ability to perform simultaneousmovements.REFERENCESBarański, A. (1963). Charakterystyka zdolności ruchowychdzieci ośmioletnich na podstawie badań testowych.Rozprawy Naukowe WSWF Wrocław, 2.Clarke, A. M., & Clarke, A. D. B. (1971). Upośledzeniaumysłowe. Warszawa: PWN.
70 Acta Univ. Palacki. Olomuc., Gymn. 2004, vol. 34, no. 2Doroszewska, J. (1989). Pedagogika specjalna. Wrocław:Ossolineum.Eider, J. (1988). Uzdolnienia ruchowe w terapii i praktycewychowania fizycznego i sportu. Sczecin: UniwersytetSzczeciński.Kościelska, M. (1995). Oblicza upośledzenia. Warszawa:PWN.Lausch-Żuk, J. (1999). Dzieci głębiej upośledzoneumysłowo. In I. Obuchowska (Ed.), Dziecko niepełnosprawnew rodzinie. Warszawa: WSiP.Mleczkowska, Z., & Frańczak, W. (1968). Badania zdolnościruchowych u dzieci z zaburzeniami nerwicowymitestem Oziereckiego w modyfikacji Barańskiego.Wychowanie Fizyczne i Sport, 8.Momola, I., & Marszałek, R. (1997). Sprawność fizycznadzieci upośledzonych umysłowo a ich aktywnośćruchowa. In Sport szansą życia niepełnosprawnych.Kraków: PSON.Olechnowicz, H. (1994). Wyzwalanie aktywności dziecigłębiej upośledzonych umysłowo. Warszawa: WSiP.Olszowski, A. (1973). Zdolności ruchowe dzieci upośledzonychumysłowo. Szkoła Specjalna, 2.Pielecki, H. (1994). Poziom rozwoju fizycznego dzieciniedowidzących oraz zaburzenia w zachowaniu. InZ. Sękowska (Eds.), Problemy pedagogiki specjalnejw badaniach empirycznych. Lublin: UMCS.Polkowska, I. (1994). Proces rewalidacyjny z dziećmiupośledzonymi umysłowo w szkole życia. Warszawa:WSiP.Szopa, J., Mleczko, E., & Żak, S. (1996). Podstawy antropomotoryki.Warszawa: PWN.Wyczesany, J. (1999). Pedagogika upośledzonych umysłowo.Wybrane zagadnienia. Kraków: OW Impuls.MOTORICKÉ DOVEDNOSTIU MENTÁLNĚ RETARDOVANÝCH DĚTÍ(Souhrn anglického textu)Definice vlohy bere v úvahu funkční efektivitu, kvalitua rychlost reakcí pozorovanou u jednotlivce. Osobnívloha zahrnuje určité schopnosti, které jsou částečněgeneticky podmíněny. Rozsah a úroveň těchto schopnostíje u jednotlivců rozdílná. Globální schopnosti jsoudůležité pro přežití a vývoj jednotlivce, kdežto jednotlivéschopnosti jsou rozhodující pro určení individuality jedince,a to jak fyzické, tak psychologické. Výzkum, jehožvýsledky jsou popsány v této práci, zdůrazňuje motorickédovednosti mentálně retardovaných dětí. Výzkum bylproveden mezi 49 dětmi ve věku od 10 do 19 let, kterénavštěvují Speciální vzdělávací centrum v Mrowle v krajipolské Podkarpacie, a využil Ozereckého test. Úroveňmentální retardace testovaných subjektů byla buď mírnánebo střední. Klasifikace motorických dovedností testovanýchjednotlivců byla založena na práci Barańského.Vzhledem k výsledkům testu měly děti s hlubší mentálníretardací větší problémy provést úkoly. Tyto děti dosáhlyhorších výsledků, byly hodně slabší s ohledem na přesnosta rychlost jejich reakce.Klíčová slova: schopnosti, motorické dovednosti, mentálníretardace.Irena Momola, Ph.D.Institute of Physical andHealth EducationRzeszów UniversityRzeszówPolandEducation and previous work experienceGraduate of Academy of Physical Education in Cracow,currently she is a director of the Institute of PhysicalCulture and Economy of the State Higher VocationalSchool in Krosno and she works at the position of an associateprofessor in the Institute of Physical and HealthEducation of University of Rzeszów.Scientific orientationConcerns body posture, its defects and ways of correctingin children and teenagers, designed a specialqualifying course on corrective gymnastics for teachers,which was approved by the Ministry of National Educationand Sport 2002, deal with mentally and physicallydisabled children, their physical proficiency and socialbackground.First-line publicationAuthor of 4 compact items and 20 original, publishedones.
Acta Univ. Palacki. Olomuc., Gymn. 2004, vol. 34, no. 2 71PROGRAMMED LEARNING IN THE PROCESS OF MOTOR LEARNINGHalina Guła-Kubiszewska, Marta WieczorekUniversity School of Physical Education, Wrocław, PolandSubmitted in January, 2004Programmed learning is a specified learning procedure with its material organized into sequences and little units(Dembo, 1997). In education, programmed learning serves to facilitate learning in a school class, for it allows forthe presentation of even the most difficult issues in little portions, and students may acquire them at their own pace(Kruszewski, 1972). The aim of the present work was to define motor effects in the process of learning new motoractivities with the use of two different forms of programmed learning in conjunction with other methods: a linearprogram for learning “juggling with balls” connected with the analytic method (learning by parts) – a chart (large scaleillustration) program (Wieczorek, 1999) and a branched program for learning “the Tai-chi system” connected witha synthetic method (whole learning/learning by wholes) – computer-aided programmed learning (Guła-Kubiszewska,2000). Research was carried out among adults – altogether 183 people (3 groups). The average age was 19–24 years.We obtained, in our research, positive results, indicatiing the high effectiveness of this method in the process of motoractivity learning and teaching. In the three groups, an average level of mastering a new motor activity prevails, whichmay be interpreted as a very satisfactory result for more than half of the learners who achieved the planned result.This was the group, in which the program for learning a new motor activity not only gave us some feedback on theexecution level, it was a computer-aided program, which confirmed the thesis on the possibility of a more effective usein it of regularities which constitute the basis of programmed learning (Dembo, 1997).Keywords: Motor learning, programmed learning.INTRODUCTIONProgrammed learning is a specifi ed learning procedurewith its material organized into sequences andlittle units (Dembo, 1997). It acts as a self-education setwhich presents its material in a carefully-planned orderand requires reacting through gap-filling and choosinganswers by students. Each answer is followed by immediatefeedback. Programmed learning is used mostfrequently as a linear or branched program.In a linear program the material is presented in sucha manner so that all students would familiarize themselveswith the program in the same order. In a branchedprogram the programmed material includes numerousand varied possibilities of going through the content.In education, programmed learning serves to facilitatelearning in a school class, for it allows to presenteven the most diffi cult issues in little portions, andstudents may acquire them at their rate. In such formof teaching, the teacher, via the program, may give thelearning activity the desired structure and direction; intothis structure, the teacher introduces changes whichguarantee previously empirically defi ned high andrelatively permanent probability of achieving plannedresults by students (Kruszewski, 1972).A program is a task giving the activity of learninga defined structure. The structure consists of elementarytasks the system of which, established or changing accordingto a set of rules, assures such a direction of theactivity of learning so that the planned result would bereached with expected high probability (Kupisiewicz,1991; Kruszewski, 1972; Słomkiewicz, 1972).Programmed learning represents certain features, vitalfor the process of education: the material is dividedinto doses being interconnected as regards essence andlogic; students work actively; they may proceed to thenext dose after the work with the previous dose has beencompleted, student’s answers are compared with the correctanswer; the rate of learning is subject to individualization;the program undergoes empirical verification(to establish its usefulness for a given group of studentsand to assess the effectiveness of the program).According to Rothrock (Dembo, 1997), research onprogrammed learning did not give any positive results,for it did not fulfi ll the hopes placed in it. Computeraidedteaching turned out to be more effective and stillbased on those same regularities of learning. A com puterplays the role of a teacher since it provides information,and enables students to exercise, evaluates achievementsof students, and gives them additional possibilities forlearning. Computer-aided teaching gives us an opportunityto use more effectively the regularities which are thebasis of programmed learning (Dembo, 1997).
72 Acta Univ. Palacki. Olomuc., Gymn. 2004, vol. 34, no. 2Programmed learning was especially accepted inrelation to more theoretical subjects, however, between1969 and 1970, the possibilities of using this methodin the process of physical education began to be studied.Motor tasks which are the object of learning arepresented by the use of a properly-prepared program(booklets and boards with relevant instructions). Theprogram for learning a new motor activity/function isa precisely-ordered linear sequence of methodical exercisesand activities leading via the shortest way towardsmastering new movement skills (Strzyżewski, 1986).The program is equipped with objects playing the roleof a regulator of movements produced by exercisingstudents and a measure of a well- or badly- done motortask. They allow students an individual assessment oftheir work directly after completion of an exercise andthe adequate management of further steps in the courseof learning.The most widespread form of programmed learningin physical education are programmed cards (Czabański,1991; Czabański & Guła-Kubiszewska, 1993; Wieczorek,1999). One should separate subsequent sensomotoric sequenceswithin the motor activity which is being taughtand then present them in a graphic form with verbalinstruction. Often, programmed teaching is employedin conjunction with other methods (e.g. in Germanyand Austria).The aim of the present work was to define motor effectsin the process of learning new motor activities withthe use of two different forms of programmed learningin conjunction with other methods:1. A linear program for learning “juggling with balls”connected with the analytic method (learning byparts) – a chart (large scale illustration) program(Wieczorek, 1999).2. A branched program for learning “the Tai-chi system”connected with a synthetic method (wholelearning/learning by wholes) – computer-aidedprogrammed learning (Guła-Kubiszewska, 2000).In the linear program, developed as large-scale illustrations(charts), students engage in self-regulatingactivities after each step and they receive feedback onthe level of execution of a given motor sequence withoutdelay. In the computer-aided program self-regulating activitiesare connected with regulation of the representationof a plan and program of a motor activity.The received feedback informs the learner about theprecision of representation of the course of movement,whereas a motor activity is performed as a whole. Theexecutive control allows further facilitation of motorrepresentation programming. In programmed learning,Internal Programming Strategy was employed in theform of a cognitive strategy as well as a metacognitiveone (Guła-Kubiszewska, 2002).The following research questions have been formulated:1. What level of motor effects has been reached by theuse of the classic programmed learning and computer-aidedteaching?2. Was the manner of performing executive control(whole or part) related to the effectiveness of motorlearning?MATERIAL AND METHODS OF RESEARCHResearch was carried out in the years 2000–2003among: the soldiers of Basic Military Service in Koszalin(60 people), female students of Higher VocationalSchool in Legnica as well as the employees of DPSDom Pomocy Społecznej [Social Assistance Home]in Legnickie Pole (30 people) as well as students ofthe first year of Wrocław University School of PhysicalEducation (group I – 46 people, group II – 47 people).The average age of both groups was 19–24 years.The method of research was the pedagogical experiment.The examined learners after having familiarizedthemselves with the aim of learning as well as havingperformed motivational activities encouraging learningtook up activities in compliance with the foundationsof the program. They took the decision concerning thecompletion of learning on their own.RESULTSIn the process of motor learning using the classicprogrammed learning, motor effects were measuredby the number of steps which the examined learnersmastered over the course of time. The other measure– called the Learning Speed Index (LSI) – was calculatedbased upon the rate of increase of skills in thesubsequent stages of learning (Wieczorek, 1998).This value is proportional to the area under thecurve of learning, where on the axis of ordinates thenext steps of learning have been marked and on theaxis of abscissae where the next stages of learning havebeen marked. This enables the division of the learningstudents into groups of slow, medium and fast rate resultincrease.Among the examined soldiers the highest percentagewas reached as regards step three (38.1%) and stepfour (31.2%). Of the examined soldiers, 29.7% werecompletely successful in learning, meaning that step sixwas achieved. Within the group of female students andemployees the scope of mastering the program is verysimilar. Most of the examined learners mastered themotor activity at the level of step four (43.3%) and stepthree (26.7%). Only 10% of the examined learners masteredthe motor task well, however the soldiers obtainedbetter effects of learning a motor activity (Fig. 1).
Acta Univ. Palacki. Olomuc., Gymn. 2004, vol. 34, no. 2 73Fig. 1Percentage of the level relating to mastering the program by the examined learners (effects)454035302520151050step 1 step 2 step 3 step 4 step 5 step 6ZWSWSZ+DPS(ZWS – soldiers, WSZ+DPS – female, students and employees)Fig. 2Percentage of motor learning speed (based on LSI) achieved by the examined learners80706050403020100slowly medium fastZWSWSZ+DPS(ZWS – soldiers, WSZ+DPS – female, students and employees)Almost 3/4 (73.4%) of the examined soldiers mastereda new motor activity which resulted in an increasein motor learning at a medium level. The maximum limitof executing the activity for themselves was reached; ata fast rate – only 12.5% of the examined soldiers, similarlyto the group of slow-learners (14.1%).Also almost 3/4 of the examined female studentsof the Higher Vocational School (WSZ) as well asthe employees of the Social Assistance Home (DPS)(73.4%) reached their optimum level of task executionindicating a medium level of motor effects increase. Ofthe examined learners, 23.3% were fast learners, whereasonly 3.3% learned slowly (Fig. 2).To sum up the effectiveness of motor learning by employingclassic programmed learning, one can state thatthe examined groups reached mainly a medium level oflearning effects at an average rate of result increase.By using r-Pearson’s test the correlation between theachieved step of the program (learning effect) and thespeed of learning (WSU/ LSI) for & = 0.05 was shown.Within the group of examined female students ofthe University School of Physical Education in Wrocław
74 Acta Univ. Palacki. Olomuc., Gymn. 2004, vol. 34, no. 2Fig. 3Percentage of regulating activities level among students of the University School of Physical Education in Wrocław50454035302520151050no low medium highgroup Igroup IIFig. 4Percentage of motor learning effectiveness level among the students of University School of Physical Education inWrocław6050403020group Igroup II100low medium highwhere computer-aided motor learning was employed,learning effects were assessed on the basis of the levelof mastering a new motor task as well as by the levelof regulating activities. Group I followed the programwhich aimed at learning through programming of motorrepresentation, whereas group II through self-regulationof the representation. The executive control related tothe whole execution (execution by wholes) of activitiesprovided new information which again supported regulatingactivities of the motor representation.Within the group of students programming motorrepresentation a low level of these activities (47.82% ofthe examined) or lack of such activities (26.09%) prevails.Only 35% of the examined learners executed regulationprogramming activities at a higher level: 17.39%at a medium level and 8.70% at a high level.The situation was different in the group of examinedlearners who used motor representation ina self-regulating skills developing program. Almost halfof the examined learners reached a high level (46.80%),similarly to a medium level (42.56% of the examined).Approximately 10% of the examined learners did notprogram any self-regulating activities (low level 6.38%and 4.26% none) (Fig. 3).
Acta Univ. Palacki. Olomuc., Gymn. 2004, vol. 34, no. 2 75In the first group examined learners mastered a newmotor activity mainly at an average level (41.30%). Only19.57% of the examined students succeeded in masteringthe new motor skill, and 39.13% did not master thisskill. Some very good effects of motor learning may beobserved in the second group. More than half of theexamined students learned a new motor activity verywell (55.32%), 1/4 well (27.66%), whereas only 17.02%did not master the new task (Fig. 4).The Pearson Chi Square Test (p = 0.00) and ChiSquare of Highest Credibility (p = 0.00) for & = 0.05showed that dependencies exist between the level of selfregulationand the effectiveness of motor learning. Thehigher the self-regulating control, the better commandof a motor task there is.SUMMARY AND CONCLUSIONSNumerous experimental investigations concerningthe use of programmed learning in physical educationpractice usually showed positive results, which indicatesthe high effectiveness of this method in the process ofmotor activity learning and teaching (Strzyżewski, 1986;Czabański, 1991; Nowak, 1985, 1989).The results obtained in our research partly confirmthis assumption. In the three groups, an average level ofmastering a new motor activity prevails, which may beinterpreted as a very satisfactory result for more thanhalf of the learners who achieved the planned result.This was the group, in which the program for learninga new motor activity not only provided some feedbackon the execution level, but also it stimulated self-regulatingactivities as an element of the learning program.Additionally, it was a computer-aided program, whichconfirmed the thesis on the possibility of a more effectiveuse in it of regularities which constitute the basis ofprogrammed learning (Dembo, 1997).CONCLUSION1. The use of programmed learning in the processof motor learning in both a classic and computeraidedform results in similar didactic effects whenthe structure of the program is focused on masteringthe taught content.2. The best results were achieved in computer-aidedlearning when the structure of the program developedregulating skills of the learner.3. The manner of executive control in the form oflearning by wholes (whole learning) or learning byparts (partial learning) did not directly show effectsof motor learning.REFERENCESCzabański, B., & Guła–Kubiszewska, H. (1993). Kartonprogramowany jako pomoc dydaktyczna. WychowanieFizyczne i Zdrowotne, 2, 52–55.Czabański, B. (1991). Wybrane zagadnienia uczenia sięi nauczania techniki sportowej. Wrocław: AWF.Dembo, M. H. (1997). Stosowana psychologia wychowawcza.Warszawa: WSiP.Guła-Kubiszewska, H. (2000). Komputerowa animacjamotoryki człowieka. Opracowanie programu do naukiczynności ruchowych. [CD]. Wrocław: AWF.Guła-Kubiszewska, H. (2002). Edukacja przyszłości– uczenie się motoryczne samoregulowane czyregulowane z zewnątrz? In W. Kojs, E. Piotrowski,& T. Zimny (Eds.), Edukacja jutra. VIII TatrzańskieSeminarium Naukowe. Częstochowa.Kruszewski, K. (1972). Nauczanie programowane w systemiedydaktycznym. Warszawa: PWN.Kupisiewicz, C. (1971). Nauczanie programowane w praktyceszkoły podstawowej. Warszawa: PZWS.Nowak, A. (1985). Nauczanie programowane jako metodaindywidualizacji nauczania czynności sportowych.Zeszyty Naukowe, AWF Wrocław, 50, 169–178.Nowak, A. (1989). Karty programowane w nauczaniuczynności pływackich dzieci ośmioletnich. ZeszytyNaukowe, AWF Wrocław, 37, 89–97.Słomkiewicz, S. (1972). Nauczanie algorytmiczne a psychologicznateoria czynności. Warszawa: PZWS.Strzyżewski, S. (1986). Proces wychowania w kulturzefizycznej. Warszawa: WSiP.Wieczorek, M. (1998). Pomiar i ocena szybkości uczeniasię czynności ruchowych. In J. Ślężyński (Ed.),Efekty kształcenia i wychowania w kulturze fi zycznej(pp. 175–179). Katowice: AWF.Wieczorek, M. (1999). Uczymy się żonglowania. WychowanieFizyczne i Zdrowotne, 2, 9–43 (wkładkametodyczna).PROGRAMOVANÉ UČENÍ V PROCESUMOTORICKÉHO UČENÍ(Souhrn anglického textu)Programované učení je specifický postup učení s materiály,které jsou posloupně uspořádány do malýchjednotek (Dembo, 1997). Ve vyučování programovanéučení slouží k usnadnění výuky ve školní třídě, protožedovoluje prezentovat dokonce i nejtěžší učivo v malýchdávkách a studenti si je mohou osvojit podle svéhotempa (Kruszewski, 1972). Cílem předložené prácebylo určit motorické výsledky v procesu učení nových
76 Acta Univ. Palacki. Olomuc., Gymn. 2004, vol. 34, no. 2motorických akivit s použitím dvou rozdílných foremprogramovaného učení ve spojení s dalšími metodami:lineární program na učení “žoglování s balónky” spojenýs analytickou metodou (učení po částech) – tabulkovýprogram (ilustrace velkého formátu) (Wieczorek, 1999)a odborný program na učení “Tai-chi systém” spojený sesyntetickou metodou (učení po celcích) – programovanéučení pomocí počítače (Guła-Kubiszewska, 2000).Výzkum byl proveden mezi 183 dospělými lidmi (3skupiny). Průměrný věk byl 19–24 let.Výsledky získané v našem výzkumu ukázaly pozitivnívýsledky, které dokazují vysokou efektivitu tétometody v procesu vyučování a učení motorickýchaktivit. Ve třech skupinách převažuje průměrná úroveňzvládnutí nových motorických činností, což můžeme interpretovatjako velmi uspokojivý výsledek, protože vícenež polovina zúčastněných členů dosáhla plánovanýchvýsledků. Toto byla skupina, ve které program na učenínových motorických aktivit nejenom že dal nějakouzpětnou vazbu na úrovni provedení, ale byl to programtzv. programovaného učení pomocí počítače, kterýpotvrdil hypotézy o svých možnostech při efektivnějšíma pravidelném používání, což stanoví základy pro programovanéučení (Dembo, 1977).Klíčová slova: motorické učení, programované učení.Halina Guła-Kubiszewska, Ph.D.Academy of PhysicalEducationInstitute of Didactics ofPhysical Educationul. Witelona 2551-617 WroclawPolandEducation and previous work experience1974–1978 – Studies at University School of PhysicalEducation.1978–1991 – work as a physical education teacher ina primary school.1991–1995 – an assistant in the Institute of methodologyof Physical Education.1995 – passing doctoral exams.1995 – an adjunct in the Institute of methodology ofPhysical Education.First-line publicationThe self-regulation process of a motoric learning.
Acta Univ. Palacki. Olomuc., Gymn. 2004, vol. 34, no. 2 77INSTRUCTIONS FOR MANUSCRIPTFOR THE <strong>ACTA</strong> UPO <strong>GYMNICA</strong>The magazine Acta Universitatis Palackianae OlomucensisGymnica is an independent professional magazine. The con tentof the magazine is focused on presentation of research notificationsand theoretical studies connected with the prob lems ofkinanthropology. The Editorial Board is look ing forward to allmanuscripts written on the above subject.General instructionsThe text of the contribution is in English. The con tributionis not to exceed a maximum limit of 15 pages (including tables,pictures, summaries and appendices). A summary will be inthe Czech language, and by rule 1 page at the most.The text is to be presented in MS Word editor on a disketteand also as a printout.All contributions are reviewed anonymously.Interface of the contributionTitle of the contribution, name(s) of its author(s), workplace,date of handing in the contribution, summary of the textin English, key words.Text of the contributionNames of individual chapters are to be written in capital letterfrom the left margin. References to quoted authors see a brieffrom the publication manual http://www.gymnica.upol.cz.Epilogue of the contributionA reference summary, (see a brief from the publicationmanual http://www.gymnica.upol.cz), address of the mainauthor, summary including the key words.Tables, pictures, graphs, appendicesTo be written on separate pages. A table is to be marked asTABLE 1 with its name below, write on the left margin abovethe table (the same applies for appendices). A picture is to bemarked as Fig. 1, write from the left above the picture (thesame applies for a graph).All contributions to Acta UPO Gymnica must have beencorrected by an English expert before being submitted to us.Please enclose an official confirmation of this correction. If possiblewe would appreciate the text in the original language.We look forward to our further cooperation!Doc. PhDr. Vlasta Karásková, CSc.Executive EditorDoc. MUDr. Pavel Stejskal, CSc.Chairman of the Editorial BoardPOKYNY PRO PŘÍPRAVU RUKOPISUDO ČASOPISU <strong>ACTA</strong> UPO <strong>GYMNICA</strong>Časopis Acta Universitatis Palackianae Olomucensis Gym nicaje nezávislý odborný časopis. Svým obsahem je za mě řenna presentaci původních výzkumných sdělení a teoretickýchstudií, které se vztahují k vědecké problematice ki nan tro pologie. Redakce vítá všechny rukopisy zpracované v tomtoduchu.Obecné pokynyText příspěvku v jazyce českém (1×) odevzdejte laskavěvýkonnému redaktorovi. Na základě doporučující recenzeupraví autor příspěvek k publikaci.Text příspěvku je v jazyce anglickém. Rozsah příspěvkuje max. 15 stran (včetně tabulek, obrázků, souhrnu a pří loh).Souhrn je v jazyce českém max. 1 strana.Odevzdává se text v editoru Word na disketě a 1× výtisktextu.Všechny příspěvky jsou anonymně recenzovány.Úvod příspěvkuNázev příspěvku, plná jména autorů, pracoviště, datumodevzdání příspěvku, krátký souhrn textu, klíčová slova.Text příspěvkuNázvy jednotlivých kapitol velkými písmeny píšeme zleva.Odkazy jen na citované autory, uvedené v referenčnímse zna mu.Závěr příspěvkuReferenční seznam, adresa hlavního autora, souhrn v češtině,včetně názvu a klíčových slov.Tabulky, obrázky, grafy, přílohyPíšeme na samostatné stránky. Tabulku označíme TABLE 1,obrázek nebo graf Fig. 1, přílohu Appendix 1. Název je podoznačením, píšeme zleva.Všechny příspěvky musí být před odevzdáním opra ve nyznalcem anglického jazyka (nejlépe rodilým mluvčím). Pro ve deníkorektury je nutno doložit oficiálním potvrzením. Příspěvekje třeba odevzdat taktéž v originální ja zy ko vé ver zi.Děkujeme Vám za spolupráci.Doc. PhDr. Vlasta Karásková, CSc.výkonný redaktorDoc. MUDr. Pavel Stejskal, CSc.vědecký redaktorAddress:Palacký UniversityFaculty of Physical Culturetř. Míru 115771 11 OlomoucCzech RepublicAdresa:Univerzita PalackéhoFakulta tělesné kulturytř. Míru 115771 11 OlomoucPhone: +420 585 636 357E-mail: aupo@ftknw.upol.czTelefon: 585 636 357E-mail: aupo@ftknw.upol.cz
<strong>ACTA</strong><strong>UNIVERSITATIS</strong> <strong>PALACKIANAE</strong> <strong>OLOMUCENSIS</strong><strong>GYMNICA</strong>Vol. 34 No. 2Published by Palacký University, Olomouc 2004Preparation and arrangement before print: Mgr. Zuzana HanelováTechnical Editor and graphic arrangement: RNDr. Miroslava KouřilováElectronic form available on address: http://www.gymnica.upol.czISBN 80-244-0898-8ISSN 1212-1185
EFACULTY OF PHYSICAL CULTUROLO M O UC4th International Conference on Movement and HealthPreliminary InformationWelcome!The Faculty of Physical Culture is hosting, for the 4th time so far, the international conference called Movement andHealth, which has already become a tradition. Every two years scientific workers and the scholarly public meet inorder to discuss issues for which the common denominator is the term health in relation to human movement activity.Evolutionary trends leading to the continuous decrease in the amount and intensity of movement in human livesshould warn us and the solution of these problems represents, from the point of view of the entire society, a serioushealth, social and economic difficulty. If you are interested in the issue to which we are referring, your participation inour conference will provide you with a very broad and deep look into the many-faceted complex of questions havingto do with our central theme. The traditionally high-quality and hospitable atmosphere of conference proceedings atour Faculty, together with the architectural and historical attractiveness of Olomouc, all of this combines to create anintricate framework for the pleasant and scientifically interesting atmosphere to which our regular participants gladlyand repeatedly return. We are looking forward to seeing everybody, both those who have participated in the past aswell as newcomers and we will be very glad to welcome you to Olomouc.Topics• Somatic and motoric problems associated withphysical activities• Social, philosophical and psychological determinantsof life style• Biomechanical and physiotherapeutical aspects ofthe human movement system• Optimization of the load and minimization of healthrisks of physical activities• Physical activities in school• Quality of life and sport activities of persons withspecial needs• Women and sport• Outdoor, tourism and new age activities• Management and marketing of sport and physicalactivities• Research methods in physical activitiesConference venuePalacký University, Faculty of Physical Culturetř. Míru 115, 771 11 Olomouc, Czech RepublicDateNovember 23–25, 2005LanguageCzech, English, Polish, SlovakPresentation will be published in English in the conferenceproceedings.Forms of presentationkeynote lecture, oral, poster, workshopConference fee150 EUR, 60 EUR (student, Ph.D. student)The conference fees cover all academic activities,refreshments during the conference, proceedings andsocial programme.Important datesOctober 2004, First AnnouncementJanuary 2005, Deadline for abstract submissionMarch 2005, Notification to authorsMay 2005, Application and conference feeJuly 2005, Deadline for papers submissionSeptember 2005, Second AnnouncementContact personZuzana HanelováPalacký University, Faculty of Physical Culturetř. Míru 115, 771 11 Olomouc, Czech Republictel.: +420 585 636 352, fax: +420 585 412 899e-mail: zuzana.hanelova@upol.czFrantišek VaverkaChairman of the scientific committeeMiroslav JanuraChairman of the organizing committee