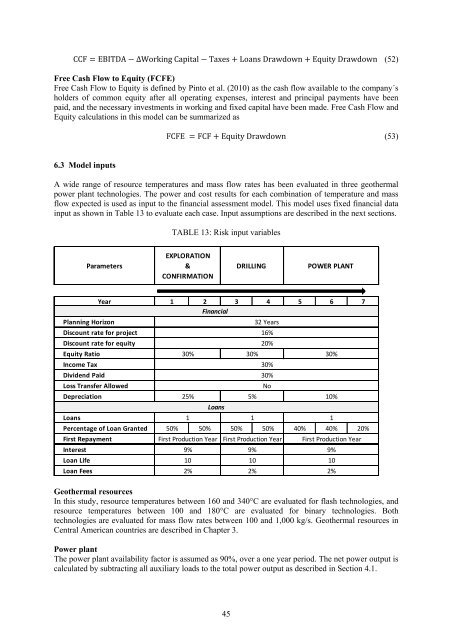
CCF = EBITDA − ∆Work<strong>in</strong>g Capital − Taxes + Loans Drawdown + Equity Drawdown (52)Free Cash Flow to Equity (FCFE)Free Cash Flow to Equity is def<strong>in</strong>ed by P<strong>in</strong>to et al. (2010) as the cash flow available to the company´sholders of common equity after all operat<strong>in</strong>g expenses, <strong>in</strong>terest and pr<strong>in</strong>cipal payments have beenpaid, and the necessary <strong>in</strong>vestments <strong>in</strong> work<strong>in</strong>g and fixed capital have been made. Free Cash Flow andEquity calculations <strong>in</strong> this model can be summarized asFCFE = FCF + Equity Drawdown (53)6.3 Model <strong>in</strong>putsA wide range of resource temperatures and mass flow rates has been evaluated <strong>in</strong> three <strong>geothermal</strong><strong>power</strong> <strong>plant</strong> technologies. The <strong>power</strong> and cost results for each comb<strong>in</strong>ation of temperature and massflow expected is used as <strong>in</strong>put to the f<strong>in</strong>ancial assessment model. This model uses fixed f<strong>in</strong>ancial data<strong>in</strong>put as shown <strong>in</strong> Table 13 to evaluate each case. Input assumptions are described <strong>in</strong> the next sections.TABLE 13: Risk <strong>in</strong>put variablesParametersEXPLORATION&CONFIRMATIONDRILLINGPOWER PLANTYear 1 2 3 4 5 6 7F<strong>in</strong>ancialPlann<strong>in</strong>g HorizonDiscount rate for projectDiscount rate for equity32 Years16%20%Equity Ratio30% 30% 30%Income TaxDividend PaidLoss Transfer Allowed30%30%NoDepreciation25% 5% 10%LoansLoans11 1Percentage of Loan Granted 50% 50% 50% 50% 40% 40% 20%First RepaymentInterestLoan LifeLoan FeesFirst Production Year9%102%First Production Year9%102%First Production Year9%102%Geothermal resourcesIn this study, resource temperatures between 160 and 340°C are evaluated for flash technologies, andresource temperatures between 100 and 180°C are evaluated for b<strong>in</strong>ary technologies. Bothtechnologies are evaluated for mass flow rates between 100 and 1,000 kg/s. Geothermal resources <strong>in</strong>Central American countries are described <strong>in</strong> Chapter 3.Power <strong>plant</strong>The <strong>power</strong> <strong>plant</strong> availability factor is assumed as 90%, over a one year period. The net <strong>power</strong> output iscalculated by subtract<strong>in</strong>g all auxiliary loads to the total <strong>power</strong> output as described <strong>in</strong> Section 4.1.45
MarketIn this study, the average price of 115 USD/MWh for the year 2010 was assumed for the wholesalemarket <strong>in</strong> Central American countries with an expected growth rate of 5%. Electricity market researchis described <strong>in</strong> Section 2.2.8.Capital costThe <strong>geothermal</strong> development capital cost <strong>in</strong>cludes exploration and confirmation, drill<strong>in</strong>g and <strong>power</strong><strong>plant</strong>. Capital cost is calculated as described <strong>in</strong> Chapter 5.Operation and ma<strong>in</strong>tenance costO&M cost is assumed as 2.8 UScents/kWh with an expected growth rate of 4 %. The cost of O&M fora <strong>power</strong> <strong>plant</strong> and for a steam field is described <strong>in</strong> Section 5.5.Structure of <strong>geothermal</strong> f<strong>in</strong>anc<strong>in</strong>gThe literature review (Battocletti, 1999; Hance, 2005; Rodríguez and Henríquez, 2007; Long, 2009;Salmon et al., 2011) illustrates values between 15% and 50% for the equity component <strong>in</strong> f<strong>in</strong>anc<strong>in</strong>g<strong>geothermal</strong> development. Lenders will normally require an equity percentage to ensure the sponsor’scont<strong>in</strong>ued commitment. For the exploration phase of the project, it is frequently used as the developerrisks his own money on an <strong>in</strong>direct assessment of resource potential. Based on a survey of theliterature, this analysis assumes 30% equity.Discount ratesElíasson and Valdimarsson (2005) argued that the <strong>in</strong>terest rate required from a <strong>geothermal</strong> project<strong>in</strong>vestment, often referred to as MARR, is def<strong>in</strong>ed by the company <strong>in</strong> order to undertake a project. It issimilar to WACC if the project bears <strong>in</strong> itself the same or similar risk as the average risk from thenormal operation of the company. The MARR can be <strong>in</strong> the range of 5-25% depend<strong>in</strong>g on the risk ofthe project. Ormat, a lead<strong>in</strong>g player <strong>in</strong> the <strong>geothermal</strong> market uses 12-18% as their target for a feasibleproject <strong>in</strong> develop<strong>in</strong>g countries (as cited <strong>in</strong> Broniki, 2004). Accord<strong>in</strong>g to Gordon (2009) risk capitalcomes at a high cost, and most <strong>in</strong>vestors require a 20% return on <strong>in</strong>vestment, depend<strong>in</strong>g on the projectand perceived risk.In the Central American region, J. A. Rodríguez expla<strong>in</strong>ed that the MARR for an <strong>in</strong>vestor <strong>in</strong> the<strong>geothermal</strong> development has <strong>in</strong>creased <strong>in</strong> the last couple of years, <strong>in</strong> response to the jurisdiction andpersonal <strong>in</strong>securities of these countries. The m<strong>in</strong>imum IRR used to be 10% or 11% but is now 15%or 16%. The ROE (or equity IRR) that is normal requested is usually around 20% (personalcommunication, November 14, 2011). In Honduras, the second largest country of Central America,accord<strong>in</strong>g to C.A. Lagos, from the po<strong>in</strong>t of view of private <strong>geothermal</strong> developers, the commonly usedvalue (like MARR) for a project is between 10% to 14% and the MARR for equity is between 12% to18%, both consider<strong>in</strong>g a period of 20 years (personal communication, November 11, 2011).The Central American region’s values are <strong>in</strong> contrast with that of other develop<strong>in</strong>g countries such asIndonesia and Kenya. An Indonesia project appraisal document from World Bank (2008) po<strong>in</strong>ted outthat various reports and discussions with <strong>in</strong>vestors <strong>in</strong>dicated that the capital cost for a <strong>geothermal</strong>Independent Power Producer is somewhere between 14 to 16%. In Kenya, the Government requires aROE of 15%, while private <strong>in</strong>vestors would normally ask between 18% and 23% but it is not unusualto get higher requests (Ngugi, 2012). These figures vary with respect to the data from developedcountries such as Iceland. Accord<strong>in</strong>g to B. M. Júlíusson, the m<strong>in</strong>imum WACC that is used for<strong>geothermal</strong> <strong>projects</strong> <strong>in</strong> Iceland is 8% and the m<strong>in</strong>imum rate of return on equity is 12%. The expectedrate of return on equity for Landsvirkjun on new <strong>projects</strong> is 12 - 15% (personal communication,November 11, 2011).Hance (2005) has drawn attention to the fact that <strong>in</strong> case of project failure, the <strong>geothermal</strong> equityholders are the last to recover their <strong>in</strong>vestment, therefore, to recompense risk they expect high rates ofreturn from 16 to 20%. Based on the above <strong>in</strong>formation, 16% is used as the MARR for <strong>projects</strong> and20% is used as the MARR for equity.46
- Page 1 and 2:
GEOTHERMAL TRAINING PROGRAMMEHot sp
- Page 3 and 4:
This MSc thesis has also been publi
- Page 5 and 6: ACKNOWLEDGEMENTSMy gratitude to the
- Page 7 and 8: TABLE OF CONTENTSPage1. INTRODUCTIO
- Page 9 and 10: PageAPPENDIX A: FINANCIAL MODEL ...
- Page 12 and 13: 1. INTRODUCTIONRecent research on r
- Page 14 and 15: 2. CENTRAL AMERICAN DATA2.1 Power p
- Page 16 and 17: 2.2.3 HondurasThe Honduran electric
- Page 18 and 19: NET INJECTION BY SOURCE (2010)INSTA
- Page 20 and 21: income taxes for a period of 10 yea
- Page 22 and 23: annual temperature ranges from 17 t
- Page 24 and 25: egional reconnaissance in 1981ident
- Page 26 and 27: 4. GEOTHERMAL ELECTRICAL POWER ASSE
- Page 28 and 29: The net contribution of that power
- Page 30 and 31: Introducing , = , and , = ,
- Page 32 and 33: 9ProductionWellBoiler5Turbine~1046P
- Page 34 and 35: TABLE 3: Parameters and boundary co
- Page 36 and 37: eaches the maximum limit, and for h
- Page 38 and 39: 160180140160tc vap[i], th vap[i]120
- Page 40 and 41: average results, and combining them
- Page 42 and 43: The base cost ( ) can be calculate
- Page 44 and 45: calculation for another separator c
- Page 46 and 47: mass flow rate (kg/s) on the plant
- Page 48 and 49: Table 11 shows a summary of costs f
- Page 50 and 51: 5.6.4 Comparison of capital costs b
- Page 52 and 53: 6. FINANCIAL FEASIBILITY ASSESSMENT
- Page 54 and 55: 6.2 Model structureThe financial fe
- Page 58 and 59: Interest on loansFleischmann (2007)
- Page 60 and 61: IRR30%25%IRR CapitalIRR Equity20%Si
- Page 62 and 63: FIGURE 42: Allocation of funds for:
- Page 64 and 65: 340IRR Free Cash Flow to Equity [ %
- Page 66 and 67: flash technology is between 0.3 and
- Page 68 and 69: Energy Price Availability Factor O&
- Page 70 and 71: FIGURE 50: Density and cumulative p
- Page 72 and 73: In Chapter 6, Figure 44 illustrated
- Page 74 and 75: The internal rate of return is offs
- Page 76 and 77: Cengel, Y. and Tuner, R., 2005: Fun
- Page 78 and 79: IEAb, 2011: Technology roadmap: Geo
- Page 80 and 81: Salmon, J., Meurice, J., Wobus, N.,
- Page 82 and 83: APPENDIX A: SUMMARY OF FINANCIAL MO
- Page 84 and 85: APPENDIX C: INVESTMENT AND FINANCIN
- Page 86 and 87: APPENDIX E: BALANCE SHEETBALANCE SH