Cation-exchange capacity (cec) of zeolitic - Clay Minerals Society
Cation-exchange capacity (cec) of zeolitic - Clay Minerals Society
Cation-exchange capacity (cec) of zeolitic - Clay Minerals Society

You also want an ePaper? Increase the reach of your titles
YUMPU automatically turns print PDFs into web optimized ePapers that Google loves.
694 Kitsopoulos <strong>Clay</strong>s and <strong>Clay</strong> <strong>Minerals</strong><br />
z<br />
240<br />
210<br />
I80<br />
i 150<br />
9 ~ 120<br />
<<br />
"~ 90<br />
~ 6o<br />
E<br />
~ 30<br />
= . x-<br />
SANTORINI - POLYEGOS<br />
30 60 90 120 150 180 210<br />
CEC (meq/100 g): Ammonia Electrode Technique (10% NaCI)<br />
I<br />
240<br />
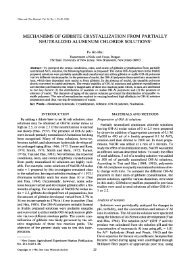
Figure 4. CEC values (meq/100 g) obtained using the am-<br />
monia electrode technique with the NH~ + solutions obtained<br />
by washing the NH4+-saturated samples <strong>of</strong> zeolites with 10%<br />
NaC1 vs. CEC values (meq/100 g) obtained using the Kjeldahl<br />
ammonia distillation technique with the same NH4 + solutions.<br />
The correlation coefficient is 0.999 for the regression analy-<br />
sis.<br />
by treatment with 10% NaC1. The results are presented<br />
in the same way as for Table 2. The mean values <strong>of</strong><br />
CEC range from 111.35 to 202.01 meq/100 g for the<br />
Santorini samples, and from 1.70 to 159.68 meq/100<br />
g for Polyegos; values all much larger than the vari-<br />
ation (0.07 0.06 and 0.08 0.07) between the pair<br />
<strong>of</strong> measurements. The results obtained using the stan-<br />
dard 1 M NH4C1 solutions were very satisfactory<br />
(mean value 0.999, s.d. 0.019). Figure 4 shows the<br />
data <strong>of</strong> Tables 2 and 3 and indicates that the two tech-<br />
niques give similar results. However, the ammonia<br />
electrode technique can dramatically reduce the time<br />
<strong>of</strong> performing a CEC measurement,<br />
The CEC values in Table 4 were obtained with an<br />
ammonia electrode directly with the NH4+-saturated<br />
samples, but the samples were not treated with 10%<br />
NaC1. The results are presented following the format<br />
<strong>of</strong> Table 2. The mean values <strong>of</strong> CEC range from<br />
126.58 to 221.60 meq/100 g for the Santorini samples,<br />
and from 1.71 to 188.00 meq/100 g for the Polyegos<br />
samples; values all much larger than the variation<br />
(0.06 0.05 and 0.05 0.05) between the pair <strong>of</strong><br />
measurements. The results obtained using the standard<br />
1 M NHaC1 solutions were very satisfactory (mean<br />
value 1.000, s.d. 0.017).<br />
The results shown in Tables 3 and 4 indicate that<br />
the CEC values obtained from the NH4+-saturated<br />
samples were generally higher than those obtained<br />
from the NH4 + solutions obtained after washing with<br />
10% NaC1. Differences to 72.36 meq/100 g were re-<br />
corded for the Santorini samples and to 59.27 meq/<br />
Table 4. CEC values (meq/100 g) <strong>of</strong> zeolitized volcaniclas-<br />
tics from Santorini (S) and Polyegos (P) Islands, Greece. The<br />
CEC values were obtained using the ammonia electrode tech-<br />
nique directly with the NH4+-saturated samples <strong>of</strong> zeolites (no<br />
prior washing with 10% NaC1).<br />
Sample X Y Mean [(Y - X)/2]<br />
Sant<strong>of</strong>iniIsland<br />
$103 186.05 186.14 186.09 0.04<br />
S104 131.62 131.86 131.74 0.12<br />
S105 126.52 126.65 126.58 0.07<br />
S106 192.92 193.12 193.02 0.10<br />
S108 132.27 132.27 132.27 0.00<br />
Sll0 165.64 165.79 185.71 0.08<br />
Sl13 131.11 131.11 131.11 0.00<br />
Sl15 137.87 138.14 138.00 0.13<br />
Sl16 197.71 197.73 197.72 0.01<br />
$117 151.60 151.92 151.76 0.16<br />
Sl19 217.57 217.80 217.68 0.12<br />
$120 189.81 189.95 189.88 0.07<br />
$121 178.81 179.07 178.94 0.13<br />
S124 214.59 214.78 214.68 0.09<br />
S126 197.56 197.56 197.56 0.00<br />
$130 221.60 221.60 221.60 0.00<br />
S132 130.34 130.50 130.42 0.08<br />
S137 180.48 180.49 180.48 0.01<br />
S139 182.40 182.52 182.46 0.06<br />
S140 153.21 153.24 153.22 0.02<br />
S141 186.82 186.82 186.82 0,00<br />
S142 183.02 183.22 183.12 0.10<br />
$145 161.44 161.49 161.44 0.03<br />
$146 134.41 134.42 134.41 0.00<br />
tMean 0.06<br />
Polyegos Island<br />
P2 113.01 113.16 113.08 0.07<br />
P4 170.03 170.33 170.18 0.15<br />
P5 139.58 139.70 139.64 0.06<br />
P6 114.89 114.90 114.89 0.01<br />
P8 148.63 148.70 148.66 0.03<br />
P10 116.07 116.11 116.09 0.02<br />
Pll 187.90 188.11 188.00 0.11<br />
P13 161.73 161.75 161.74 0.01<br />
P14 150.92 151.15 151.04 0.12<br />
P17 179.59 179.59 179.59 0.00<br />
P19 169.01 169.14 169.07 0.06<br />
P21 33.29 33.39 33.34 0.05<br />
P23 1.66 1.76 1.71 0.05<br />
P27 2.46 2.46 2.46 0.00<br />
P30 2.38 2.39 2.38 0.01<br />
P34 160.02 160.02 160.02 0.00<br />
ZMean 0.05<br />
Standard deviation: 0.05.<br />
2 Standard deviation: 0.05.<br />
100 g for the Polyegos samples. Figure 5 is the plot<br />
<strong>of</strong> Table 4 vs. Table 3.<br />
It is unlikely that these differences in the CEC are<br />
related to laboratory or experimental conditions or in-<br />
terference problems from the electrode. Care was tak-<br />
en that a) the starting samples were well homogenized,<br />
b) duplicate measurements were randomly taken for<br />
all samples, c) NH4 § was treated by a strong alkali to<br />
ensure complete conversion to NH 3, and d) the accu-<br />
racy <strong>of</strong> the experiments was determined by using stan-