Designing and Commissioning an Ultraviolet Light Disinfection ...
Designing and Commissioning an Ultraviolet Light Disinfection ...
Designing and Commissioning an Ultraviolet Light Disinfection ...
- No tags were found...

You also want an ePaper? Increase the reach of your titles
YUMPU automatically turns print PDFs into web optimized ePapers that Google loves.
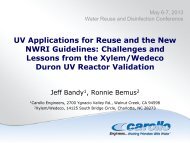
DESIGNING & COMMISSIONING AN ULTRAVIOLETLIGHT DISINFECTION SYSTEM TO MEET NWRIGUIDELINES AT WARDEN, WASHINGTON26 th Annual WateReuse SymposiumPhoenix, ArizonaSeptember 12, 2011Ken Alex<strong><strong>an</strong>d</strong>er, P.E.Gray <strong><strong>an</strong>d</strong> Osborne, Inc.V<strong>an</strong>couver, WA
AcknowledgmentsCOAUTHORS / TEST DESIGNERS• Bruno Ferr<strong>an</strong>, Degremont Technologies• Dave V<strong>an</strong>Cleve, P.E., Gray & Osborne• Jay Swift P.E., Gray & OsborneTEST TEAM• Sus<strong>an</strong> Well<strong><strong>an</strong>d</strong>, Gray & Osborne• Steve Maddox & Donnie Edson, City of Warden• Mark Siegenthaler, WSU Water Research Center• TEK Construction
Presentation Outline• Background• UV <strong>Disinfection</strong> Design St<strong><strong>an</strong>d</strong>ards for Reuse• Checkpoint Bioassay• Review <strong><strong>an</strong>d</strong> Accept<strong>an</strong>ce of Checkpoint Bioassay
• Project DriversBackground• No surface water discharge availablea ab • Discharge to USBR c<strong>an</strong>al not allowed• Year round agronomic m<strong>an</strong>agement infeasible• Regulatory Issues with Groundwater Discharge• Groundwater degradation with existing facilities• <strong>Disinfection</strong> byproducts to groundwater• Previous Design of UV <strong>Disinfection</strong> for Reusewith Groundwater Recharge• Ephrata, WA• Royal City, WA
Water Reclamation Facilities Warden, WAWaterReclamationFacilityGroundwaterRechargeBasin 4Short TermStorage BasinUSBR C<strong>an</strong>alFlows Apr - OctGroundwaterRechargeBasins 1 - 3
Water Reclamation Facilities Warden, WASecondaryClarifiersFilter / UV RoomAnoxicBasinOxidationDitch
Warden, WashingtonUV
Warden, WashingtonWarden UV <strong>Disinfection</strong> SystemMaximum Month Average Flow 0.474 mgdMaximum Day Flow0.60 mgdPeak Hour Flow1.2 mgdUV Design Flow0.60 mgdUV Tr<strong>an</strong>smitt<strong>an</strong>ce for Design Flow 55 %UV Lamp TypeLow PressureHigh IntensityLamp OrientationVerticalNumber of B<strong>an</strong>ks Total 6Number of Redund<strong>an</strong>t B<strong>an</strong>ks 1Lamps Per B<strong>an</strong>k 40Total Lamps 240Ch<strong>an</strong>nel Width (less baffle width) 4 ftCh<strong>an</strong>nel Depth6 ftCh<strong>an</strong>nel Length33.83 ftTotal Reactor Volume6,065 galReactor Water Depth5 ftEffective Reactor Volume5,054 galUV Model/M<strong>an</strong>ufacturerAquaRay 40 HO
Warden, WashingtonWarden UV <strong>Disinfection</strong> System• Beg<strong>an</strong> Operation June 2009• Typically 2 Modules On• Daily Total Coliform (TC) Testsmet st<strong><strong>an</strong>d</strong>ards continuously:< 2.2 TC/100 mL 7 day medi<strong>an</strong>< 23 TC/100 mL single sample• Continuous UVT Monitoring> 65 % UVT nearly continuously
UV <strong>Disinfection</strong> Design St<strong><strong>an</strong>d</strong>ardsDesign Requirement(Media Filtration)Ephrata <strong><strong>an</strong>d</strong> Royal City (1)(pre-2000)Warden (2)(after 2005)Microorg<strong>an</strong>ism Coliform Bacteria VirusMeasure of MicrobialInactivationTurbidity Entering UV Reactor< 2.2 total coliform/100 mL 7-daymedi<strong>an</strong>< 23 total coliform/100 mL singlesample< 2 NTU monthly average< 5 NTU at all times< 2.2 total coliform/100 mL 7-daymedi<strong>an</strong>5-log Virus Inactivation< 2 NTU 24-hour average< 5 NTU at all timesUV Dose at Maximum Day Flow 100 mJ/cm 2 100 mJ/cm 2UV Tr<strong>an</strong>smitt<strong>an</strong>ce (UVT) 65 percent 55 percentContinuous UVT Tr<strong>an</strong>smitt<strong>an</strong>ceMonitoringField Verification of DesignNoComply with Coliform Density Criteriafor Reclaimed WaterYesCheckpoint Bioassay (3)(1) Class “A” Reclaimed Water <strong>Disinfection</strong> St<strong><strong>an</strong>d</strong>ards for the State of Washington(2) May 2003 NWRI Guidelines for Drinking Water <strong><strong>an</strong>d</strong> Water Reuse(3) Although the 2003 NWRI Guidelines include velocity profiling instead of checkpoint bioassays for field verification, checkpointbioassays are the current de facto st<strong><strong>an</strong>d</strong>ard.
Checkpoint BioassayWarden WRF Checkpoint Bioassay – Target Test ConditionsFlow,No. Lamp LoadingRun Flow, % of UVT,Modules rate,ID mgd Design%On gpm/lampFlowA 0.07 5.8 % 55 2.0 0.61B 060 0.60 50.00 % 55 20 2.0 347 3.47C 0.86 71.2 % 55 3.0 3.73D 1.20 100 % 65 4.0 5.21Note: Low flow (0.07 mgd) set by influent pump station VFD
Checkpoint BioassayWRF Checkpoint Bioassay - Test Data SummaryMS-2 ModuleTest Power No.Avg. MS-2Test RunFlowRED Avg. MS-2UVT Draw ModulesREDDate ID(mgd)Stdev RED(%) (kW) ON(mJ/cm )(mJ/cm 2 ) (mJ/cm 2 )10-13-09 A 56.5 13.8 2.0 0.074 n/a n/a n/a10-13-09 B 56.6 20.8 3.0 0.60 134.3 2.13 44.810-12-09 C 56.1 27.9 4.0 0.87 122.3 3.24 30.610-12-09 D 65.5 23.7 3.4 1.19 103.1 1.60 30.3
Checkpoint Bioassay Test Flow Scheme
Checkpoint Bioassay Test SetupUV Reactor
Checkpoint Bioassay Test Setup
Checkpoint Bioassay Test ResultsRED = Reduction Equivalent Dose
Checkpoint Bioassay Test Results
Checkpoint Bioassay Test Results• Runs B, C & D Successful• Validated UV Perform<strong>an</strong>ce per Original Bioassay• Run A Inconclusive• Phage Concentration at Inlet ≈ Outlet• Low Phage Concentration at UV Reactor Inlet• Poor Dispersion Suspected ** In Spite of Dispersion Test Prior to Checkpoint Bioassay Test• Regulatory Agencies Request Hydraulic Analysis
Accept<strong>an</strong>ce of Checkpoint BioassayVelocity Measurements at Low Flow (Run A)• Hired WSU Water Research Center Researchers• Acoustic Doppler Velocimeter Measurements• Tests Designed per NWRI Guidelines• 0.3 m upstream of first b<strong>an</strong>k• 0.3 m downstream of last b<strong>an</strong>k• Cross-sections equally spaced• Not less th<strong>an</strong> 3 x 3 grid per cross-section• Measurements 6 – 12 cm apart
Accept<strong>an</strong>ce of Checkpoint BioassayVelocity Profile Measurement Selected Locations
Accept<strong>an</strong>ce of Checkpoint BioassayActual VelocityActual VelocityTest Results
Accept<strong>an</strong>ce of Checkpoint BioassayIssues• Non-ideal hydraulics evident from velocity testing• Successful checkpoint bioassays at 3 higher flows• Achievement of Class A Coliform Levels > 2 year• > 65% UVT typical for Warden WRF filtered effluentexceeds NWRI test conditions (55% UVT)• Reactor hydraulic residence time higher at low flows• Comparison to UV reactors at other Class A WRFs• ~10 x larger (8,423 gal/mgd vs 860-940 gal/mgd)• ~3 x power draw (33.0 kW/mgd vs 10-12 kW/mgd)
Accept<strong>an</strong>ce of Checkpoint BioassayExtrapolating from Successful Test (Run B)• Run B (0.6 mgd)• Average velocity = 26.7 mm/sec• Validated UV dose = 115 mJ/cm 2 @ 55% UVT• Three UV modules achieved validated dose• Run A (0.07 mgd)• Highest measured velocity = 19.2 mm/sec• Reactor residence time Run A > Run B
Accept<strong>an</strong>ce of Checkpoint BioassayConclusions• Run A UV dose > 115 mJ/cm 2 @ 55% UVT• Typical UVT in Warden UV Reactor > 65% UVT• Three modules delivers > 115 mJ/cm 2 @ 55% UVT• Three modules on at all times will deliver a validatedUV dose at flows up to 0.6 mgdWarden agreed to operate a minimum of three UVmodules at all times to ensure validated dose isdelivered at all times
Questions