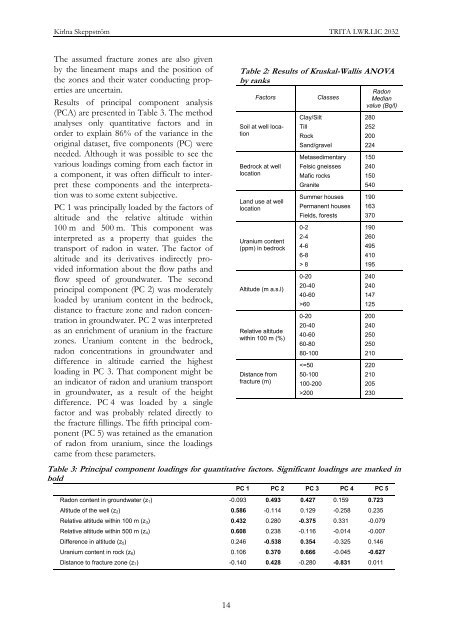
Radon <strong>in</strong> <strong>groundwater</strong> - Influenc<strong>in</strong>g factors and prediction methodology for a Swedish environmentStatistical analyses of data - InterpretationsUnivariate analysis us<strong>in</strong>g the method ofKruskal-Wallis ANOVA by ranks was successful<strong>in</strong> evaluat<strong>in</strong>g the relative <strong>in</strong>fluence ofthe subclasses of factors <strong>in</strong>vestigated <strong>in</strong>relation to the <strong>radon</strong> concentration <strong>in</strong><strong>groundwater</strong>. Compared to visual data m<strong>in</strong><strong>in</strong>g,quantitative units (median <strong>radon</strong> concentrations)could be computed for thevarious classes (Table 2), as a result of whichit was easier to <strong>in</strong>terpret the factors. Classselection was based on expert judgementand the different median values were computedwith an appreciable significance level.For the bedrock variable, granitic rocks wereassociated with a much higher <strong>radon</strong> concentration(540 Bq/l) than the other rocktypes. This observation tallies very well withprevious studies on <strong>radon</strong> and its relationshipwith geological materials (Choubey andRamola, 1997; Knutsson and Olofsson,2002; Przylibski et al., 2004). Granite conta<strong>in</strong>son average a higher concentration ofuranium, the parent element of <strong>radon</strong>, and <strong>in</strong>Sweden, granitic rocks can conta<strong>in</strong> morethan 5 ppm of uranium (Åkerblom andL<strong>in</strong>dgren, 1997). The content of uranium <strong>in</strong>bedrock computed by flight measurementsprovided a rough prediction for <strong>radon</strong> concentrations<strong>in</strong> <strong>groundwater</strong>. As can be observed<strong>in</strong> Table 2, <strong>radon</strong> concentration <strong>in</strong><strong>groundwater</strong> <strong>in</strong>creases with <strong>in</strong>creas<strong>in</strong>g uraniumcontent <strong>in</strong> the bedrock. However, ananomaly was encountered for the highesturanium class (> 8 ppm), s<strong>in</strong>ce the observed<strong>radon</strong> concentration was low. One possibleexplanation could be that the uranium m<strong>in</strong>eralsare not always located very near to<strong>groundwater</strong>-bear<strong>in</strong>g fractures and hencecannot contribute to <strong>in</strong>creas<strong>in</strong>g the <strong>radon</strong>concentration <strong>in</strong> the <strong>groundwater</strong>.There exists a relationship between thealtitude of the well and the correspond<strong>in</strong>g<strong>radon</strong> concentration <strong>in</strong> <strong>groundwater</strong>. Radonconcentrations were relatively higher at lowaltitudes than at high altitudes. This observationcould be clarified by the fact that any<strong>radon</strong> emanated at high altitude flows togetherwith the <strong>groundwater</strong> by convectionto lower terra<strong>in</strong>s, provided the travell<strong>in</strong>gdistance is short and the <strong>radon</strong> does notdecay (with<strong>in</strong> 3.8 days). Alternatively, itcould <strong>in</strong>stead be argued that parent elementsof 222 Rn ( 238 U and 226 Ra) leach <strong>in</strong>to <strong>groundwater</strong>at high altitudes, get transported bythe water and re-deposit on the surfaces ofthe fracture at lower altitudes and cont<strong>in</strong>ueto decay from these spots to <strong>in</strong>crease concentrationof <strong>radon</strong> <strong>in</strong> <strong>groundwater</strong>. It wasdifficult to <strong>in</strong>terpret the factor of relativealtitude with<strong>in</strong> 100 m, s<strong>in</strong>ce vary<strong>in</strong>g <strong>radon</strong>concentrations were observed at differentslopes.Another result related to geological propertiesrevealed that the type of soil overly<strong>in</strong>gthe bedrock could have some importance.One plausible explanation could be the<strong>in</strong>fluence of the permeability property of thesoils. Permeable soils allow <strong>in</strong>filtration readilyand this leads to a dilution of the <strong>radon</strong>concentration <strong>in</strong> <strong>groundwater</strong> <strong>in</strong> the subsurface.It could therefore be observed thatsand and gravel are associated with slightlylower <strong>radon</strong> concentrations than clay andsilt. Another observation made possiblethrough univariate statistical analysis relatesthe land use factor to the <strong>radon</strong> concentrationof the wells. The orig<strong>in</strong>al land use datawere classified <strong>in</strong>to summer houses, permanenthouses and other land uses, such asforests and fields. In the latter a small waterusage was assumed and it was observed that<strong>radon</strong> concentrations had a tendency to berelatively low when water was <strong>in</strong> cont<strong>in</strong>uouscirculation, such as <strong>in</strong> permanent houses. Asimilar observation was made by Knutssonand Olofsson (2002). Regard<strong>in</strong>g the factorof distance from a fracture l<strong>in</strong>e or zone, theresults of univariate statistical analysis weredifficult to <strong>in</strong>terpret. On the other hand, the<strong>in</strong>fluence of that factor could be observed <strong>in</strong>visual data m<strong>in</strong><strong>in</strong>g on 3D images. Fracturesmight be filled with m<strong>in</strong>erals conta<strong>in</strong><strong>in</strong>guranium and therefore the nearer a well islocated to a fracture zone, the higher theprobability of the <strong>groundwater</strong> conta<strong>in</strong><strong>in</strong>g an<strong>in</strong>creased concentration of <strong>radon</strong>. The reasonwhy statistical analysis was less successfulat show<strong>in</strong>g the relationship might beattributed to the class selections of distance.13
Kirlna Skeppström TRITA LWR.LIC 2032The assumed fracture zones are also givenby the l<strong>in</strong>eament maps and the position ofthe zones and their water conduct<strong>in</strong>g propertiesare uncerta<strong>in</strong>.Results of pr<strong>in</strong>cipal component analysis(PCA) are presented <strong>in</strong> Table 3. The methodanalyses only quantitative factors and <strong>in</strong>order to expla<strong>in</strong> 86% of the variance <strong>in</strong> theorig<strong>in</strong>al dataset, five components (PC) wereneeded. Although it was possible to see thevarious load<strong>in</strong>gs com<strong>in</strong>g from each factor <strong>in</strong>a component, it was often difficult to <strong>in</strong>terpretthese components and the <strong>in</strong>terpretationwas to some extent subjective.PC 1 was pr<strong>in</strong>cipally loaded by the factors ofaltitude and the relative altitude with<strong>in</strong>100 m and 500 m. This component was<strong>in</strong>terpreted as a property that guides thetransport of <strong>radon</strong> <strong>in</strong> water. The factor ofaltitude and its derivatives <strong>in</strong>directly provided<strong>in</strong>formation about the flow paths andflow speed of <strong>groundwater</strong>. The secondpr<strong>in</strong>cipal component (PC 2) was moderatelyloaded by uranium content <strong>in</strong> the bedrock,distance to fracture zone and <strong>radon</strong> concentration<strong>in</strong> <strong>groundwater</strong>. PC 2 was <strong>in</strong>terpretedas an enrichment of uranium <strong>in</strong> the fracturezones. Uranium content <strong>in</strong> the bedrock,<strong>radon</strong> concentrations <strong>in</strong> <strong>groundwater</strong> anddifference <strong>in</strong> altitude carried the highestload<strong>in</strong>g <strong>in</strong> PC 3. That component might bean <strong>in</strong>dicator of <strong>radon</strong> and uranium transport<strong>in</strong> <strong>groundwater</strong>, as a result of the heightdifference. PC 4 was loaded by a s<strong>in</strong>glefactor and was probably related directly tothe fracture fill<strong>in</strong>gs. The fifth pr<strong>in</strong>cipal component(PC 5) was reta<strong>in</strong>ed as the emanationof <strong>radon</strong> from uranium, s<strong>in</strong>ce the load<strong>in</strong>gscame from these parameters.Table 2: Results of Kruskal-Wallis ANOVAby ranksFactorsSoil at well locationBedrock at welllocationLand use at welllocationUranium content(ppm) <strong>in</strong> bedrockAltitude (m a.s.l)Relative altitudewith<strong>in</strong> 100 m (%)Distance fromfracture (m)Clay/SiltTillRockClassesSand/gravelMetasedimentaryFelsic gneissesMafic rocksGraniteSummer housesPermanent housesFields, forests0-22-44-66-8> 80-2020-4040-60>600-2020-4040-6060-8080-100200RadonMedianvalue (Bq/l)280252200224150240150540190163370190260495410195240240147125200240250250210220210205230Table 3: Pr<strong>in</strong>cipal component load<strong>in</strong>gs for quantitative factors . Significant load<strong>in</strong>gs are marked <strong>in</strong>boldPC 1 PC 2 PC 3 PC 4 PC 5Radon content <strong>in</strong> <strong>groundwater</strong> (z 1 ) -0.093 0.493 0.427 0.159 0.723Altitude of the well (z 2 ) 0.586 -0.114 0.129 -0.258 0.235Relative altitude with<strong>in</strong> 100 m (z 3 ) 0.432 0.280 -0.375 0.331 -0.079Relative altitude with<strong>in</strong> 500 m (z 4 ) 0.608 0.238 -0.116 -0.014 -0.007Difference <strong>in</strong> altitude (z 5 ) 0.246 -0.538 0.354 -0.325 0.146Uranium content <strong>in</strong> rock (z 6 ) 0.106 0.370 0.666 -0.045 -0.627Distance to fracture zone (z 7 ) -0.140 0.428 -0.280 -0.831 0.01114