radon in groundwater - Mark- och vattenteknik - KTH
radon in groundwater - Mark- och vattenteknik - KTH
radon in groundwater - Mark- och vattenteknik - KTH
- No tags were found...
You also want an ePaper? Increase the reach of your titles
YUMPU automatically turns print PDFs into web optimized ePapers that Google loves.
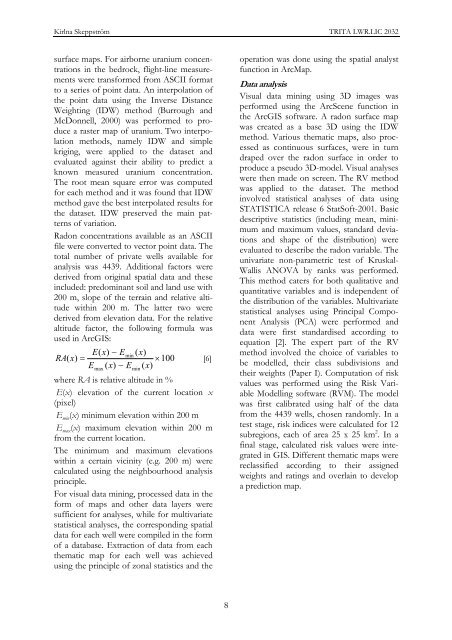
Kirlna Skeppström TRITA LWR.LIC 2032surface maps. For airborne uranium concentrations<strong>in</strong> the bedrock, flight-l<strong>in</strong>e measurementswere transformed from ASCII formatto a series of po<strong>in</strong>t data. An <strong>in</strong>terpolation ofthe po<strong>in</strong>t data us<strong>in</strong>g the Inverse DistanceWeight<strong>in</strong>g (IDW) method (Burrough andMcDonnell, 2000) was performed to producea raster map of uranium. Two <strong>in</strong>terpolationmethods, namely IDW and simplekrig<strong>in</strong>g, were applied to the dataset andevaluated aga<strong>in</strong>st their ability to predict aknown measured uranium concentration.The root mean square error was computedfor each method and it was found that IDWmethod gave the best <strong>in</strong>terpolated results forthe dataset. IDW preserved the ma<strong>in</strong> patternsof variation.Radon concentrations available as an ASCIIfile were converted to vector po<strong>in</strong>t data. Thetotal number of private wells available foranalysis was 4439. Additional factors werederived from orig<strong>in</strong>al spatial data and these<strong>in</strong>cluded: predom<strong>in</strong>ant soil and land use with200 m, slope of the terra<strong>in</strong> and relative altitudewith<strong>in</strong> 200 m. The latter two werederived from elevation data. For the relativealtitude factor, the follow<strong>in</strong>g formula wasused <strong>in</strong> ArcGIS:E(x)− Em<strong>in</strong>( x)RA ( x)=× 100 [6]E ( x)− E ( x)maxm<strong>in</strong>where RA is relative altitude <strong>in</strong> %E(x) elevation of the current location x(pixel)E m<strong>in</strong> (x) m<strong>in</strong>imum elevation with<strong>in</strong> 200 mE max (x) maximum elevation with<strong>in</strong> 200 mfrom the current location.The m<strong>in</strong>imum and maximum elevationswith<strong>in</strong> a certa<strong>in</strong> vic<strong>in</strong>ity (e.g. 200 m) werecalculated us<strong>in</strong>g the neighbourhood analysispr<strong>in</strong>ciple.For visual data m<strong>in</strong><strong>in</strong>g, processed data <strong>in</strong> theform of maps and other data layers weresufficient for analyses, while for multivariatestatistical analyses, the correspond<strong>in</strong>g spatialdata for each well were compiled <strong>in</strong> the formof a database. Extraction of data from eachthematic map for each well was achievedus<strong>in</strong>g the pr<strong>in</strong>ciple of zonal statistics and theoperation was done us<strong>in</strong>g the spatial analystfunction <strong>in</strong> ArcMap.Data analysisVisual data m<strong>in</strong><strong>in</strong>g us<strong>in</strong>g 3D images wasperformed us<strong>in</strong>g the ArcScene function <strong>in</strong>the ArcGIS software. A <strong>radon</strong> surface mapwas created as a base 3D us<strong>in</strong>g the IDWmethod. Various thematic maps, also processedas cont<strong>in</strong>uous surfaces, were <strong>in</strong> turndraped over the <strong>radon</strong> surface <strong>in</strong> order toproduce a pseudo 3D-model. Visual analyseswere then made on screen. The RV methodwas applied to the dataset. The method<strong>in</strong>volved statistical analyses of data us<strong>in</strong>gSTATISTICA release 6 StatSoft-2001. Basicdescriptive statistics (<strong>in</strong>clud<strong>in</strong>g mean, m<strong>in</strong>imumand maximum values, standard deviationsand shape of the distribution) wereevaluated to describe the <strong>radon</strong> variable. Theunivariate non-parametric test of Kruskal-Wallis ANOVA by ranks was performed.This method caters for both qualitative andquantitative variables and is <strong>in</strong>dependent ofthe distribution of the variables. Multivariatestatistical analyses us<strong>in</strong>g Pr<strong>in</strong>cipal ComponentAnalysis (PCA) were performed anddata were first standardised accord<strong>in</strong>g toequation [2]. The expert part of the RVmethod <strong>in</strong>volved the choice of variables tobe modelled, their class subdivisions andtheir weights (Paper I). Computation of riskvalues was performed us<strong>in</strong>g the Risk VariableModell<strong>in</strong>g software (RVM). The modelwas first calibrated us<strong>in</strong>g half of the datafrom the 4439 wells, chosen randomly. In atest stage, risk <strong>in</strong>dices were calculated for 12subregions, each of area 25 x 25 km 2 . In af<strong>in</strong>al stage, calculated risk values were <strong>in</strong>tegrated<strong>in</strong> GIS. Different thematic maps werereclassified accord<strong>in</strong>g to their assignedweights and rat<strong>in</strong>gs and overla<strong>in</strong> to developa prediction map.8


