radon in groundwater - Mark- och vattenteknik - KTH
radon in groundwater - Mark- och vattenteknik - KTH
radon in groundwater - Mark- och vattenteknik - KTH
- No tags were found...

You also want an ePaper? Increase the reach of your titles
YUMPU automatically turns print PDFs into web optimized ePapers that Google loves.
Kirlna Skeppström TRITA LWR.LIC 2032ii
Radon <strong>in</strong> <strong>groundwater</strong> -Influenc<strong>in</strong>g factors and prediction methodology for a Swedish environmentACKNOWLEDGEMENTSWithout fund<strong>in</strong>g, there is no prospect of do<strong>in</strong>g any research. I therefore wish to firstly acknowledgethe Swedish Geological Survey (SGU) and Lars Erik Lundbergs Stipendiestiftelse for provid<strong>in</strong>gf<strong>in</strong>ancial support for this project. I am also thankful to the various municipalities andcounty council <strong>in</strong> Stockholm that provided data for the project.My heartfelt gratitude to my ma<strong>in</strong> supervisor, Bo Olofsson for giv<strong>in</strong>g me the opportunity to workwith such an <strong>in</strong>terest<strong>in</strong>g project. Thank you for all feedback, support and lively discussions. Iwould also like to seize the opportunity to acknowledge Gert Knutsson who, together with BoOlofsson, <strong>in</strong>itiated the work on <strong>radon</strong> <strong>in</strong> <strong>groundwater</strong>. Furthermore, I would like to acknowledgePer Erik Jansson and Jon Peter Gustafsson, my co-supervisors for critiqu<strong>in</strong>g part of the work andpropos<strong>in</strong>g <strong>in</strong>terest<strong>in</strong>g suggestions. Thanks must go to Per Erik for fitt<strong>in</strong>g me <strong>in</strong> his busy timeschedule- I really appreciate it. I acknowledge my reference group. Special thanks to GustavÅkerblom, work<strong>in</strong>g at Swedish Radiation Protection Agency (SSI) for all your help. Thank youfor driv<strong>in</strong>g to Ljusterö on a Sunday to teach me and other students how to proceed with radiometricmeasurements. Thank you also for read<strong>in</strong>g the papers and provid<strong>in</strong>g useful suggestions.I wish to acknowledge all my colleagues (especially those <strong>in</strong> my corridor) at the department formak<strong>in</strong>g the work<strong>in</strong>g environment feel like a second home. Bijan- your lively discussions <strong>in</strong> thefield of research and others help to develop a critical m<strong>in</strong>d. You are a real driv<strong>in</strong>g force. I amalso thankful to Aira, Britt and Hans for all the help and advice. Muluneh and Tomo- thank youguys for all your support. I always get <strong>in</strong>spired (and sometimes stress- positive of course!!!!!) towork even harder after a talk to you. Muluneh and Joanne-thank you for help<strong>in</strong>g out with formatt<strong>in</strong>gat the last m<strong>in</strong>ute. Thank you Urska for your contribution <strong>in</strong> our collaborative study andthanks also for all your support. I am thankful to Jerzy for help with software and my computer.I acknowledge the help provided by Ann Fylkner and Monika Lowen <strong>in</strong> the laboratory. I amthankful to all my friends who drove me to Ljusterö and made it pleasant to go on site dur<strong>in</strong>gweekends. Thanks to Anders and L<strong>in</strong>da for perform<strong>in</strong>g the geological study required for theproject.How can I thank the ones who have been a constant source of encouragement and support s<strong>in</strong>cethe very beg<strong>in</strong>n<strong>in</strong>g of this work? My thoughts go to my family <strong>in</strong> Mauritius. Special thanks tomum and dad for constant motivation. F<strong>in</strong>ally, to the most important person <strong>in</strong> my life who hashelped me <strong>in</strong> numerous ways dur<strong>in</strong>g the course of this research, provided me with moral supportand who has believed <strong>in</strong> me all the time, I say ‘ Tack så mycket Svante- Du är den bästa av allt ’Stockholm, November 2005Kirlna Skeppströmiii
Kirlna Skeppström TRITA LWR.LIC 2032iv
Radon <strong>in</strong> <strong>groundwater</strong> -Influenc<strong>in</strong>g factors and prediction methodology for a Swedish environmentTABLE OF CONTENTSACKNOWLEDGEMENTS.................................................................................................. IIILIST OF PAPERS ................................................................................................................ VIIABSTRACT............................................................................................................................... 1INTRODUCTION .................................................................................................................. 1Hypothesis .............................................................................................................................. 3Objectives ............................................................................................................................... 3BACKGROUND....................................................................................................................... 3Pr<strong>in</strong>cipal Component Analysis (PCA)...................................................................................... 4Risk Variable Methodology...................................................................................................... 4Visual Data M<strong>in</strong><strong>in</strong>g.................................................................................................................. 5DESCRIPTION OF STUDY AREA ...................................................................................... 6DATA AND METHODS......................................................................................................... 6Data used ................................................................................................................................7Methods .................................................................................................................................. 7RESULTS AND DISCUSSIONS.......................................................................................... 11Visual data m<strong>in</strong><strong>in</strong>g ................................................................................................................. 11Statistical analyses of data - Interpretations............................................................................ 13Radon prediction us<strong>in</strong>g Risk Variable Modell<strong>in</strong>g.................................................................... 15A prediction map <strong>in</strong> GIS ....................................................................................................... 15Detailed study on Ljusterö..................................................................................................... 18CONCLUSIONS .................................................................................................................... 19FUTURE WORK.................................................................................................................... 19REFERENCES ...................................................................................................................... 20v
Kirlna Skeppström TRITA LWR.LIC 2032vi
Radon <strong>in</strong> <strong>groundwater</strong> -Influenc<strong>in</strong>g factors and prediction methodology for a Swedish environmentLIST OF PAPERSI. Skeppström, K. and Olofsson, B. 2005. A prediction method for <strong>radon</strong> <strong>in</strong> <strong>groundwater</strong> us<strong>in</strong>gGIS and multivariate statistics (Submitted to Science of the Total Environment).II. Demšar, U. and Skeppström, K. 2005. Use of GIS and 3D visualisation to <strong>in</strong>vestigate <strong>radon</strong>problem <strong>in</strong> <strong>groundwater</strong>. In: H. Hauska and H. Tveite (editors), 10 th Scand<strong>in</strong>avian ResearchConference on Geographical Information Science, Scangis, Stockholm, Sweden,June13-15, pp. 39-51.III. Skeppström, K. and Olofsson, B. 2005. Uranium and <strong>radon</strong> <strong>in</strong> <strong>groundwater</strong>- An overview ofthe problem, presented at the 6 th EWRA <strong>in</strong>ternational conference on water resources(under peer review).vii
Kirlna Skeppström TRITA LWR.LIC 2032water conta<strong>in</strong><strong>in</strong>g 1000 Bq/l. Groundwater isextracted from different sources and<strong>groundwater</strong> from bedrock aquifers (drilledwells) has a greater potential of conta<strong>in</strong><strong>in</strong>gan enhanced concentration of 222 Rn than<strong>groundwater</strong> extracted from soil aquifers <strong>in</strong>dug wells (Åkerblom and L<strong>in</strong>dgren, 1997).In bedrock aquifers, <strong>groundwater</strong> occurs andflows <strong>in</strong> fractures. Radium-rich m<strong>in</strong>eralspresent along the surfaces of fractures decayand release 222 Rn atoms <strong>in</strong>to <strong>groundwater</strong>.S<strong>in</strong>ce the recoil distance as well as the diffusionlength of 222 Rn is small (Tanner, 1980),it is widely accepted that only those m<strong>in</strong>eralsly<strong>in</strong>g on the surfaces of fractures, <strong>in</strong> directcontact with the <strong>groundwater</strong>, contribute to<strong>in</strong>creased 222 Rn levels <strong>in</strong> the water. Changes<strong>in</strong> <strong>groundwater</strong> chemistry can lead to differentm<strong>in</strong>eral fluid <strong>in</strong>teractions (Siegel andBryan, 2004). 238 U is affected by redox conditions.When an oxidis<strong>in</strong>g environmentprevails, 238 U enters solution and is transportedalong with the water and is eventuallyprecipitated <strong>in</strong> a reduc<strong>in</strong>g environment(Schumann and Gundersen, 1996). 226 Raoccurrence and distribution <strong>in</strong> <strong>groundwater</strong>is guided by its production from its immediateparent isotope thorium ( 230 Th) and itsremoval from solution is governed by theadsorption or cation exchange properties(Herczeg et al., 1988). The re-deposition of238 U and 226 Ra along the walls of a fracture isknown as secondary m<strong>in</strong>eral enrichment andcontributes to significantly <strong>in</strong>creas<strong>in</strong>g theconcentration of222 Rn <strong>in</strong> <strong>groundwater</strong>(Åkerblom and L<strong>in</strong>dgren, 1997).The above-mentioned microscopic processescomb<strong>in</strong>ed with the heterogeneity offractures <strong>in</strong> a rock matrix often make itdifficult to quantify transport of radioactiveelements <strong>in</strong> a bedrock aquifer. Not all fracturesare hydraulically significant - only a feware hydraulic conductors and facilitate fluidflow (NRC, 1996; Olofsson et al., 2001).However, despite the complexity of thebedrock aquifer system, there is still a needto predict <strong>radon</strong> potential <strong>in</strong> <strong>groundwater</strong>. InSweden and other countries, a large numberof people depend on <strong>groundwater</strong> extractedfrom bedrock aquifers for their daily waterneeds, imply<strong>in</strong>g long-term exposure to radioactive222 Rn <strong>in</strong> some cases. At municipallevel, prediction of <strong>radon</strong> potential <strong>in</strong><strong>groundwater</strong> is important for the plann<strong>in</strong>gof new hous<strong>in</strong>g areas, as well as the considerationof remediation measures for exist<strong>in</strong>ghouses. In order to make realistic predictionof 222 Rn levels <strong>in</strong> <strong>groundwater</strong>, <strong>in</strong>fluenc<strong>in</strong>gfactors should be studied <strong>in</strong> a holistic way.Many studies conducted on <strong>radon</strong> <strong>in</strong> thenatural environment are pr<strong>in</strong>cipally surveysand <strong>in</strong>volve sampl<strong>in</strong>g and measurements of<strong>radon</strong> <strong>in</strong> <strong>groundwater</strong>. Such studies areperformed for different reasons, <strong>in</strong>clud<strong>in</strong>gsearch<strong>in</strong>g for uranium deposits, search<strong>in</strong>gfor thrust and faults, search<strong>in</strong>g for seismicrelatedchanges and also for better knowledgeof the spatial distribution of <strong>radon</strong>(Monn<strong>in</strong> and Seidel, 1992; Choubey et al.2001; Porsani et al., 2005; Schubert et al.,2005; Ishikawa et al., 2005). Such surveys arenecessary steps <strong>in</strong> the reconnaissance of anarea prior to more detailed analyses regard<strong>in</strong>g<strong>in</strong>fluenc<strong>in</strong>g factors. Other studies focusma<strong>in</strong>ly on geological aspects, such as bedrockcomposition and uranium occurrenceand distribution <strong>in</strong> bedrock. Åkerblom andL<strong>in</strong>dgren (1997) <strong>in</strong>vestigated bedrock andsoil data <strong>in</strong> Sweden with the aim of mapp<strong>in</strong>gthe <strong>groundwater</strong> <strong>radon</strong> potential. Choubeyet al. (2000) <strong>in</strong>vestigated hydrogeology andfound that the <strong>groundwater</strong> flow characteristics<strong>in</strong>fluence the concentration of <strong>radon</strong> <strong>in</strong>spr<strong>in</strong>gs. Other studies related to bedrockand distribution of uranium <strong>in</strong>clude thework of Lidén et al. (1995), Ståhl (1997),Choubey and Ramola (1997) and Salih et al.(2002). Studies on temporal variations <strong>in</strong><strong>radon</strong> <strong>in</strong> <strong>groundwater</strong> are few. Knutsson(1977) studied seasonal fluctuations for dugwells and found large variations depend<strong>in</strong>gon type of soil aquifer. Nilssen (2001) observedlarge fluctuations <strong>in</strong> 222 Rn concentration<strong>in</strong> drilled wells from granite rocks.Regard<strong>in</strong>g <strong>radon</strong> and <strong>groundwater</strong> chemistry,only a few correlation studies have beenperformed (Lew<strong>in</strong> Pihblad, 1998; Lew<strong>in</strong> andSimeonidis, 1998; Salih et al., 2004). Most ofthe research work related to <strong>groundwater</strong>chemistry focuses pr<strong>in</strong>cipally on the parentelements of 238 U and 226 Ra (Waite et al.,1994; Schumann and Gundersen, 1996;2
Kirlna Skeppström TRITA LWR.LIC 2032gations of various <strong>in</strong>fluenc<strong>in</strong>g factors affect<strong>in</strong>g222 Rn <strong>in</strong> <strong>groundwater</strong> can be based onmultivariate statistical analyses. In the follow<strong>in</strong>gsection, the underly<strong>in</strong>g pr<strong>in</strong>ciples ofpr<strong>in</strong>cipal component analysis, visual datam<strong>in</strong><strong>in</strong>g (3D visualisation) and the risk variablemethod (the RV method) are outl<strong>in</strong>ed.Pr<strong>in</strong>cipal Component Analysis (PCA)Pr<strong>in</strong>cipal Component Analysis (PCA) is amultivariate statistical technique that <strong>in</strong>volvesthe computation and analysis of thevariance-covariance structure of a set ofvariables through a few l<strong>in</strong>ear comb<strong>in</strong>ationsof these variables (Davis, 2002; Johnson andWichern, 2002). The method often highlights<strong>in</strong>formation that is not easily decipheredus<strong>in</strong>g univariate statistics. PCA hasoften been conducted for the follow<strong>in</strong>gpurposes (Johnson and Wichern, 2002):• Data reduction and structural simplificationto make <strong>in</strong>terpretation easier• Sort<strong>in</strong>g and group<strong>in</strong>g whereby groupsof similar variables are created• Investigation of the dependenceamong variables• To predict relationships among variables• For hypothesis construction and test<strong>in</strong>gFew attempts were made <strong>in</strong> previous studiesto <strong>in</strong>vestigate <strong>radon</strong> problems us<strong>in</strong>g multivariatetechniques. In a recent study, a multivariateanalysis technique based on partialleast squares was used by Salih (2003) andSalih et al. (2004) to evaluate the impact offluoride and other water components on<strong>radon</strong> concentration. In order to makeproper <strong>in</strong>terpretations, there is a need tounderstand the underly<strong>in</strong>g pr<strong>in</strong>ciples of themethod and also understand its strengthsand weaknesses.In algebraic terms, pr<strong>in</strong>cipal components arel<strong>in</strong>ear comb<strong>in</strong>ations of p random variablesX 1 , X 2 ,…….X p . Translated <strong>in</strong>to geometricterms, these l<strong>in</strong>ear comb<strong>in</strong>ations representthe selection of a new coord<strong>in</strong>ate systemobta<strong>in</strong>ed by rotat<strong>in</strong>g the orig<strong>in</strong>al system withX 1 , X 2 , ……..X p as the coord<strong>in</strong>ate axes. Thenew axes represent the orientations withmaximum variability and provide a simplerdescription of the covariance structure(Johnson and Wichern, 2002).As stated above, PCA <strong>in</strong>volves the formationof l<strong>in</strong>ear comb<strong>in</strong>ations, which are referredto as pr<strong>in</strong>cipal components, and muchof the variability <strong>in</strong> the orig<strong>in</strong>al data can beaccounted for by a first few pr<strong>in</strong>cipal components(Thalib et al., 1999; Johnson andWichern, 2002). S<strong>in</strong>ce PCA is applied to asample, l<strong>in</strong>ear comb<strong>in</strong>ations expla<strong>in</strong> maximumsample variance.If S = {S ik } is a p x p sample covariancematrix with eigenvalue-eigenvector pairs (λ 1 ,e 1 ), (λ 2 , e 2 ),………………..(λp, e p ), k is thenumber of pr<strong>in</strong>cipal components and the i thsample pr<strong>in</strong>cipal component is given by:Y i = e i x = e i1 x 1 + e i2 x 2 +…..+ e ip x p [1]where x = any observation on the variablesX 1 , X 2 ,…..X pi = 1, 2,………pAdditional details on PCA pr<strong>in</strong>ciples can befound <strong>in</strong> Davis (2002) and Johnson andWichern (2002). Only quantitative variablescan be analysed us<strong>in</strong>g PCA. Prior to analysis,standardisation of the various data accord<strong>in</strong>gto equation [2] is necessary to ensure thateach variable has the same <strong>in</strong>fluence <strong>in</strong> theanalysis.Z( X − µ )i i= [2]iσiiwhere Z i = standardised variable,X i = orig<strong>in</strong>al variableµ i = meanσ ii = varianceRisk Variable MethodologyThe risk variable methodology (RV method)is a structurised variable-based method foridentify<strong>in</strong>g <strong>in</strong>dependent variables and theirimportance for a dependent variable. It haspreviously been used for analysis of variablesaffect<strong>in</strong>g the sal<strong>in</strong>ity of <strong>groundwater</strong> <strong>in</strong>coastal areas (L<strong>in</strong>dberg et al, 1996; L<strong>in</strong>dbergand Olofsson, 1997), vulnerability assessmentfor drawdown of <strong>groundwater</strong> due to4
Radon <strong>in</strong> <strong>groundwater</strong> - Influenc<strong>in</strong>g factors and prediction methodology for a Swedish environmenttunnell<strong>in</strong>g at Hallandsås, SW Sweden(Olofsson, 2000) and vulnerability assessmentfor contam<strong>in</strong>ation of <strong>groundwater</strong>along roads (Gontier and Olofsson, 2003). Itcomprises statistical analysis of various variablesus<strong>in</strong>g e.g. PCA and ANOVA (analysisof variance) for a suitable selection of <strong>in</strong>fluenc<strong>in</strong>gvariables, sub-group<strong>in</strong>g of the variablesbased on univariate statistics and f<strong>in</strong>allyformulation of a variable-based model.The latter is usually based on the statisticalmethod of regression analysis. The methodpredicts values of one or more response(dependent) variables from a collection ofpredictor (<strong>in</strong>dependent) variable values. Aclassical l<strong>in</strong>ear regression model takes thefollow<strong>in</strong>g form (Johnson and Wichern,2002):Y = β 0 + β 1 Z 1 + β 2 Z 2 +…+ β r Z r + ε [3][Response] = [mean (depend<strong>in</strong>g on Z 1 , Z 2 ,…Z r )] + [Error]where Z 1 , Z 2 ,… Z r are predictor variablesY = response variableε = random errorSimilarly, the RV method, which ends as asimplified regression model, generates anumerical <strong>in</strong>dex that is derived from rat<strong>in</strong>gsand weights assigned to each significantmodel parameters. The RV <strong>in</strong>dex takes theform:n∑i=1V iR i= FRV (F<strong>in</strong>al risk value) [4]where V i = a risk value for a specific variableclass (-2 to +2)R i = the weight of the variable (1 to 3)The RV method also permits calculation ofan uncerta<strong>in</strong>ty <strong>in</strong>dex, which can be computedas:n∑i=1U iR i= FUV (F<strong>in</strong>al uncerta<strong>in</strong>ty value) [5]where U i = the uncerta<strong>in</strong>ty (negative values<strong>in</strong>dicate high uncerta<strong>in</strong>ty)R i = the weight<strong>in</strong>g of the variable.The RV method generates risk values, whichshould not be confused with the risks def<strong>in</strong>ed<strong>in</strong> traditional risk analysis studies,mean<strong>in</strong>g that the RV method does not <strong>in</strong>cludethe consequences of the <strong>in</strong>creased<strong>radon</strong> concentrations.All significant factors (qualitative as well asquantitative) are subdivided <strong>in</strong>to classes, andthese are rated from (–2) to (+2), based onhow they <strong>in</strong>fluence <strong>radon</strong> concentration <strong>in</strong>water. Negative rat<strong>in</strong>gs (or risk values) imply<strong>in</strong>creased probability of <strong>groundwater</strong> conta<strong>in</strong><strong>in</strong>ghigh <strong>radon</strong> concentrations, whilepositive values mean that this probability isdecreased. Each variable is then evaluatedwith respect to the others <strong>in</strong> order to determ<strong>in</strong>ethe relative importance of each variableand is assigned a relative weight, rang<strong>in</strong>gfrom 1 to 3. The most significant variablesare given a weight of 3, while the least significantones receive a weight of 1. Theweights can be set either from the operator’sexpert knowledge and experience or, if thereare enough data available, on a statisticalbasis.Visual Data M<strong>in</strong><strong>in</strong>gData m<strong>in</strong><strong>in</strong>g is the process of identify<strong>in</strong>g ordiscover<strong>in</strong>g useful and as yet undiscoveredstructure <strong>in</strong> the data (Demšar, 2004). Largedatasets are usually exam<strong>in</strong>ed <strong>in</strong> data m<strong>in</strong><strong>in</strong>gand s<strong>in</strong>ce the project targets 4439 wells, datam<strong>in</strong><strong>in</strong>g is considered to be an appropriatetool. The underly<strong>in</strong>g pr<strong>in</strong>ciple of visual datam<strong>in</strong><strong>in</strong>g is the presentation of data <strong>in</strong> somevisual form, allow<strong>in</strong>g the user (human) to get<strong>in</strong>sight <strong>in</strong>to the data, draw conclusions anddirectly <strong>in</strong>teract with the data (Fayyad et al.,2002). Visual data m<strong>in</strong><strong>in</strong>g <strong>in</strong> the form of 3Dvisualisation helps the viewer to easily ga<strong>in</strong>knowledge of the relative layout and distancesbetween objects (Fayyad et al., 2002;Burrough and McDonnell, 2000; Gahegan etal., 2002). A general approach to produce a3D surface from geographical <strong>in</strong>formation isto map the two basic geographical dimensions,longitude and latitude, to the x and y-axis respectively and to show the variable of<strong>in</strong>terest on the z-axis. The process of visualdata m<strong>in</strong><strong>in</strong>g is often promoted as a hypothesisgenerat<strong>in</strong>g process; the user generates ahypothesis about the relationships and patterns<strong>in</strong> a dataset after first ga<strong>in</strong><strong>in</strong>g <strong>in</strong>sight<strong>in</strong>to the data (Demšar, 2004). When the5
Kirlna Skeppström TRITA LWR.LIC 2032hypothesis is already formulated, visual datam<strong>in</strong><strong>in</strong>g is nevertheless considered to be anexcellent exploratory technique that canpotentially reveal other new structures orconfirm the formulated hypothesis.DESCRIPTION OF STUDY AREAThis study of <strong>radon</strong> problems <strong>in</strong> <strong>groundwater</strong>was conducted <strong>in</strong> east-central Sweden.There are more than 500 000 drilled wells <strong>in</strong>Sweden (SOU, 1994), about half of whichare used on a permanent basis. High concentrationsof 222 Rn are a concern <strong>in</strong> many ofthese drilled wells s<strong>in</strong>ce the predom<strong>in</strong>antgeology <strong>in</strong> Sweden is Precambrian bedrock,consist<strong>in</strong>g of granites, acid gneisses and acidvolcanics with a high content of uranium(Knutsson and Olofsson, 2002). More specifically,analyses of data were made for theCounty of Stockholm (Fig. 1). A total of4439 private wells located outside StockholmCity were used. The spatial coord<strong>in</strong>atesof the study region are: north m<strong>in</strong>-6507719,north max-6691319, east m<strong>in</strong>-1582230, eastmax-1725680. The altitude varies between 0and 70 m above sea level. The geology isvariable <strong>in</strong> the Stockholm County; old granitoidsexist along the coastal zone and northernregion, together with stretches ofmetavolcanites and a local massif of maficrocks. The central part consists ma<strong>in</strong>ly ofgneiss-granites and gneiss, while the southernpart consists of Precambrian metasedimentaryrocks. Field measurements wereconducted on Ljusterö, an island <strong>in</strong> theStockholm archipelago on which 1700 peopleare permanent residents and where <strong>radon</strong>concentrations show extreme variations,with very high peaks and low values <strong>in</strong> almostthe same vic<strong>in</strong>ity.DATA AND METHODSThe methodology pr<strong>in</strong>cipally <strong>in</strong>volved thedevelopment of a prediction approach for<strong>radon</strong> levels <strong>in</strong> <strong>groundwater</strong> on a generalscale (an area of approximately 185 x 145km 2 ). For that purpose, large amounts ofdata were collected and processed, literaturereviews were performed and data were statisticallyand visually analysed. The literaturereviews had three ma<strong>in</strong> objectives: First, tounderstand the processes guid<strong>in</strong>g the formationand migration of 222 Rn and to determ<strong>in</strong>ehow 222 Rn is coupled to its parent elementsIsland ofLjusteröFig. 1: Location o f the wells <strong>in</strong>vestigated <strong>in</strong> Stockholm County.6
Radon <strong>in</strong> <strong>groundwater</strong> - Influenc<strong>in</strong>g factors and prediction methodology for a Swedish environment( 226 Ra and 238 U) <strong>in</strong> both geological materialsand <strong>groundwater</strong>; second, to analyse approachesthat have been used <strong>in</strong> the predictionof 222 Rn <strong>in</strong> <strong>groundwater</strong>; and third, towells were provided by Stockholm Countyand various municipalities. Table 1 providesadditional <strong>in</strong>formation about the data used.Elevation is an important variable s<strong>in</strong>ce itTable 1 Data used <strong>in</strong> analyses, their sources and formatsData Units Orig<strong>in</strong>al format Desired formatRadon concentration Bq/l ASCII xyz Shape files - Po<strong>in</strong>tsElevation m a.s.l Standard ASCII fileRaster file50 m x 50 m pixel sizeSoil -Shape files- polygonsScale: 1:50 000Raster file50 m x 50 m pixel sizeUraniumppmASCII fileRaster file50 m x 50 m pixel sizeLand use -Bedrock -Fracture distribution -Shape files – polygonsScale: 1:50 000Shape files- polygonsScale: 1:50 000Shape files- l<strong>in</strong>es1:50 000Raster file50 m x 50 m pixel sizeRaster file50 m x 50 m pixel sizeShape files- L<strong>in</strong>esreview some important concepts <strong>in</strong> the fieldof spatial data analysis s<strong>in</strong>ce the project<strong>in</strong>volved the treatment of different spatialdata. A field study <strong>in</strong>volv<strong>in</strong>g sampl<strong>in</strong>g andanalysis of <strong>groundwater</strong> from 38 privatewells was performed on Ljusterö island <strong>in</strong>the Stockholm archipelago. Whether on ageneral scale or a detailed scale, the datacollected necessitated pre-process<strong>in</strong>g. In thefollow<strong>in</strong>g sections, clarifications on dataused and the specific methods adopted forthe various analyses are presented. A flowchartof the methodology is illustrated <strong>in</strong>Fig. 2.Data usedFor analyses on a general scale (Papers I andII, the same data were used as <strong>in</strong>put. Dataobta<strong>in</strong>ed from the Geological Survey ofSweden (SGU) consisted of soil, bedrock,fracture distribution (derived from a l<strong>in</strong>eamentmap) and airborne radiometric measurementsof uranium along flight l<strong>in</strong>esspaced at 200 m and with measurementsevery 40 m. Elevation data and land use datawere obta<strong>in</strong>ed from the Swedish NationalLand Survey (Lantmäteriet). Radon concentrations<strong>in</strong> <strong>groundwater</strong> for 4439 privateprovides a gross <strong>in</strong>dication of the flow of<strong>groundwater</strong> <strong>in</strong> the subsurface. Bedrock dataprovide <strong>in</strong>formation on the average uraniumconcentrations that different rock types canpotentially conta<strong>in</strong>, as well as the flow possibilitiesgiven by the l<strong>in</strong>eament pattern, thehydraulic conductivity and the k<strong>in</strong>ematicporosity. Soils overly<strong>in</strong>g bedrock provide an<strong>in</strong>dication of recharge potential. Fracturezones are often enriched e.g. <strong>in</strong> uraniumconta<strong>in</strong><strong>in</strong>gm<strong>in</strong>erals. Proximity to such fracturescan result <strong>in</strong> high <strong>radon</strong> concentrations<strong>in</strong> <strong>groundwater</strong> and thus distance to mappedl<strong>in</strong>eaments, such as fracture zones, was also<strong>in</strong>vestigated as an <strong>in</strong>fluenc<strong>in</strong>g factor.MethodsData pre-process<strong>in</strong>gAnalyses of the various spatial data (exceptfor the distribution of fracture zones and<strong>radon</strong> concentrations) required that the databe <strong>in</strong> raster format, with a spatial resolutionof 50 m. As observed <strong>in</strong> Table 1, not all datawere acquired <strong>in</strong> that format. A preprocess<strong>in</strong>gof data was performed us<strong>in</strong>g theArcGIS software. Soil maps, bedrock data,topography and land use obta<strong>in</strong>ed as shapefiles were rasterised to produce cont<strong>in</strong>uous7
Kirlna Skeppström TRITA LWR.LIC 2032surface maps. For airborne uranium concentrations<strong>in</strong> the bedrock, flight-l<strong>in</strong>e measurementswere transformed from ASCII formatto a series of po<strong>in</strong>t data. An <strong>in</strong>terpolation ofthe po<strong>in</strong>t data us<strong>in</strong>g the Inverse DistanceWeight<strong>in</strong>g (IDW) method (Burrough andMcDonnell, 2000) was performed to producea raster map of uranium. Two <strong>in</strong>terpolationmethods, namely IDW and simplekrig<strong>in</strong>g, were applied to the dataset andevaluated aga<strong>in</strong>st their ability to predict aknown measured uranium concentration.The root mean square error was computedfor each method and it was found that IDWmethod gave the best <strong>in</strong>terpolated results forthe dataset. IDW preserved the ma<strong>in</strong> patternsof variation.Radon concentrations available as an ASCIIfile were converted to vector po<strong>in</strong>t data. Thetotal number of private wells available foranalysis was 4439. Additional factors werederived from orig<strong>in</strong>al spatial data and these<strong>in</strong>cluded: predom<strong>in</strong>ant soil and land use with200 m, slope of the terra<strong>in</strong> and relative altitudewith<strong>in</strong> 200 m. The latter two werederived from elevation data. For the relativealtitude factor, the follow<strong>in</strong>g formula wasused <strong>in</strong> ArcGIS:E(x)− Em<strong>in</strong>( x)RA ( x)=× 100 [6]E ( x)− E ( x)maxm<strong>in</strong>where RA is relative altitude <strong>in</strong> %E(x) elevation of the current location x(pixel)E m<strong>in</strong> (x) m<strong>in</strong>imum elevation with<strong>in</strong> 200 mE max (x) maximum elevation with<strong>in</strong> 200 mfrom the current location.The m<strong>in</strong>imum and maximum elevationswith<strong>in</strong> a certa<strong>in</strong> vic<strong>in</strong>ity (e.g. 200 m) werecalculated us<strong>in</strong>g the neighbourhood analysispr<strong>in</strong>ciple.For visual data m<strong>in</strong><strong>in</strong>g, processed data <strong>in</strong> theform of maps and other data layers weresufficient for analyses, while for multivariatestatistical analyses, the correspond<strong>in</strong>g spatialdata for each well were compiled <strong>in</strong> the formof a database. Extraction of data from eachthematic map for each well was achievedus<strong>in</strong>g the pr<strong>in</strong>ciple of zonal statistics and theoperation was done us<strong>in</strong>g the spatial analystfunction <strong>in</strong> ArcMap.Data analysisVisual data m<strong>in</strong><strong>in</strong>g us<strong>in</strong>g 3D images wasperformed us<strong>in</strong>g the ArcScene function <strong>in</strong>the ArcGIS software. A <strong>radon</strong> surface mapwas created as a base 3D us<strong>in</strong>g the IDWmethod. Various thematic maps, also processedas cont<strong>in</strong>uous surfaces, were <strong>in</strong> turndraped over the <strong>radon</strong> surface <strong>in</strong> order toproduce a pseudo 3D-model. Visual analyseswere then made on screen. The RV methodwas applied to the dataset. The method<strong>in</strong>volved statistical analyses of data us<strong>in</strong>gSTATISTICA release 6 StatSoft-2001. Basicdescriptive statistics (<strong>in</strong>clud<strong>in</strong>g mean, m<strong>in</strong>imumand maximum values, standard deviationsand shape of the distribution) wereevaluated to describe the <strong>radon</strong> variable. Theunivariate non-parametric test of Kruskal-Wallis ANOVA by ranks was performed.This method caters for both qualitative andquantitative variables and is <strong>in</strong>dependent ofthe distribution of the variables. Multivariatestatistical analyses us<strong>in</strong>g Pr<strong>in</strong>cipal ComponentAnalysis (PCA) were performed anddata were first standardised accord<strong>in</strong>g toequation [2]. The expert part of the RVmethod <strong>in</strong>volved the choice of variables tobe modelled, their class subdivisions andtheir weights (Paper I). Computation of riskvalues was performed us<strong>in</strong>g the Risk VariableModell<strong>in</strong>g software (RVM). The modelwas first calibrated us<strong>in</strong>g half of the datafrom the 4439 wells, chosen randomly. In atest stage, risk <strong>in</strong>dices were calculated for 12subregions, each of area 25 x 25 km 2 . In af<strong>in</strong>al stage, calculated risk values were <strong>in</strong>tegrated<strong>in</strong> GIS. Different thematic maps werereclassified accord<strong>in</strong>g to their assignedweights and rat<strong>in</strong>gs and overla<strong>in</strong> to developa prediction map.8
Radon <strong>in</strong> <strong>groundwater</strong> - Influenc<strong>in</strong>g factors and prediction methodology for a Swedish environmentDetailed Study on LjusteröFor analyses on a detailed scale (Paper III),<strong>groundwater</strong> samples from 38 private wellswere collected dur<strong>in</strong>g summer 2004 on theisland of Ljusterö, Stockholm archipelago(Fig. 1). Several areas on the island exhibitwide variations <strong>in</strong> <strong>radon</strong> concentrations(very low concentrations and very highconcentrations <strong>in</strong> the same neighbourhood)and these areas were del<strong>in</strong>eated <strong>in</strong> a priorstep us<strong>in</strong>g GIS. Whereas it was easily decidedwhich areas would be sampled, it wasdifficult to determ<strong>in</strong>e which specific wellswould be the subject of <strong>in</strong>vestigation becausethe consent of the private well ownerswas needed prior to any sampl<strong>in</strong>g. It wasensured that sampl<strong>in</strong>g was carried out only ifwater had been <strong>in</strong> circulation for a satisfactoryperiod of time, hence the water wasdirectly extracted from the bedrock. Sampleswere sent to an accredited laboratory for themeasurement of 222 Rn, 226 Ra and 238 U <strong>in</strong>solution. 222 Rn was measured us<strong>in</strong>g a Lucascell (ZnS sc<strong>in</strong>tillation cell). It should, however,be mentioned that only prelim<strong>in</strong>aryresults of chemical analyses are presented <strong>in</strong>this thesis. Ge<strong>och</strong>emical modell<strong>in</strong>g to understandthe <strong>in</strong>fluence of chemical processes isto be conducted <strong>in</strong> future work. In thisdetailed study, <strong>in</strong> addition to analysis ofairborne uranium measurements collectedfrom the Geological Survey of Sweden (witha scale of 1:50 000), measurements ofequivalent uranium (via gamma radiationmeasurements) were performed on outcrops(Emell and Moen, 2005). The <strong>in</strong>strumentsused were a sc<strong>in</strong>tillation counter, a gammaspectrometer counter and a gamma spectrometerwith a Bismuth Germanate crystal,GR-130BGO.9
Kirlna Skeppström TRITA LWR.LIC 2032GENERAL SCALESpatial data(Orig<strong>in</strong>al dataset)Radon data(Orig<strong>in</strong>al dataset)Cleaned data on <strong>radon</strong>(Removal of outliers)Visual datam<strong>in</strong><strong>in</strong>g <strong>in</strong>GIS- New hidden patterns?- Detection of relationships?Preprocessed such as:- Interpolation,- Rasterisation,- ReclassificationPr<strong>in</strong>cipalComponentAnalysisStatisticalanalysesAnalysis ofvarianceInterpretations of pr<strong>in</strong>cipalcomponents from PCARisk variable model<strong>in</strong>gL<strong>in</strong>ear regression(calibration and validation)DETAILED SCALEImplementation of results <strong>in</strong> GISSelection of site <strong>in</strong> GISSampl<strong>in</strong>g and analysis of <strong>groundwater</strong><strong>in</strong> 38 private wellsData on 222 Rn, 226 Raand U <strong>in</strong> solutionData collectionStatistical analysisof data and <strong>in</strong>terpretationsDetailed field data ongamma measurements <strong>in</strong>outcropsFig. 2: Flowchart of methodology.10
Radon <strong>in</strong> <strong>groundwater</strong> - Influenc<strong>in</strong>g factors and prediction methodology for a Swedish environmentRESULTS AND DISCUSSIONSThe 4439 private drilled wells analysed <strong>in</strong>this study were found to be irregularly distributed<strong>in</strong> Stockholm County, with relativelyfew wells <strong>in</strong> the middle and southernparts of the county as shown <strong>in</strong> Fig. 1. Ananalysis of the data revealed that for themajority of the wells (73%), 222 Rn concentrationsvaried between 0 and 500 Bq/l and11% of all wells exceeded 1000 Bq/l, theSwedish regulatory limit for <strong>radon</strong> concentration<strong>in</strong> dr<strong>in</strong>k<strong>in</strong>g water. The maximumconcentration recorded was 63 560 Bq/lwhile the m<strong>in</strong>imum was 4 Bq/l. Two otherwells also had very high <strong>radon</strong> concentrations<strong>in</strong> the order of 14 000 Bq/l and 15 000Bq/l. The geometrical mean was found to be230 Bq/l and a standard deviation of 1227Bq/l was computed. The distribution of<strong>radon</strong> values, viewed on a histogram, waspositively skewed and removal of outlierswas necessary (except for visual data m<strong>in</strong><strong>in</strong>g)to avoid bias <strong>in</strong> statistical analyses. Outlierswere case-specifically def<strong>in</strong>ed as <strong>radon</strong> concentrationsexceed<strong>in</strong>g 5000 Bq/l and removed.The traditional def<strong>in</strong>ition of outliers<strong>in</strong> the one-dimensional case that a po<strong>in</strong>t isan outlier if its distance from the mean isgreater than some factor times the standarddeviation (usually ± 2 standard deviations)was not considered, s<strong>in</strong>ce its application didnot improve the skewedness of the dataset.Radon concentration values exceed<strong>in</strong>g 5000Bq/l were observed <strong>in</strong> 21 wells, constitut<strong>in</strong>gless than 0.5% of total available wells. High<strong>radon</strong> concentrations can be encountered <strong>in</strong>wells drilled from granite rocks with anenriched content of uranium deposited onthe <strong>in</strong>ner surfaces of fractures.Visual data m<strong>in</strong><strong>in</strong>gThe visual analysis of 3D images was appropriatefor the problem s<strong>in</strong>ce all of the variables<strong>in</strong>vestigated could either be convertedto surface maps or visualised <strong>in</strong> GIS. It waspossible to detect visually whether a relationshipexisted between a thematic map andthe <strong>radon</strong> concentration <strong>in</strong> <strong>groundwater</strong>. Asmentioned <strong>in</strong> the methodology section, a<strong>radon</strong> surface needed to be built from po<strong>in</strong>tdata prior to visualisation. In the project,<strong>radon</strong> measurements were not sufficient tobuild a representative surface over the wholearea. Interpolation of all po<strong>in</strong>t data to produceone surface was found to produce lotsof ‘U’ effects (sharp edges) around extremevalues and this was <strong>in</strong>evitable because visualdata m<strong>in</strong><strong>in</strong>g <strong>in</strong>volves analysis of all data,without the removal of outliers. Therefore,only a small sample of the study with anacceptable distribution of wells was subjectedto <strong>in</strong>vestigation.In the various visualisations, the follow<strong>in</strong>gwere observed:1) High <strong>radon</strong> values occurred predom<strong>in</strong>antlyon low elevations and vice versa2) Areas overla<strong>in</strong> with till or clay had high<strong>radon</strong> concentrations <strong>in</strong> the bedrock<strong>groundwater</strong>3) Peaks of high <strong>radon</strong> concentrations werenot always located <strong>in</strong> regions where highuranium content <strong>in</strong> bedrock had been recorded<strong>in</strong> airborne measurements.4) Radon concentrations from steep terra<strong>in</strong>were generally not high but no clear-cutconclusions could be drawn from the thematicmap of relative altitude5) Granitic rocks were associated with high<strong>radon</strong> values6) The shorter the distance between a fracturezone and the bedrock well, the higherthe concentration of <strong>radon</strong> <strong>in</strong> <strong>groundwater</strong>.A multi-dimensional visualisation (Fig. 3)<strong>in</strong>volv<strong>in</strong>g five different variables was an<strong>in</strong>terest<strong>in</strong>g example of how the effects ofpeaks and depressions <strong>in</strong> a surface comb<strong>in</strong>edwith colour effects allowed the observer toget <strong>in</strong>sight <strong>in</strong>to the data, draw conclusionsand directly <strong>in</strong>teract with the data. In thatvisualisation, the two-dimensional geographicalextent and the <strong>radon</strong> concentrationsconstitute three spatial dimensions.The bedrock surface draped over the <strong>radon</strong>surface is the fourth variable and f<strong>in</strong>ally thefracture l<strong>in</strong>es constitute a fifth variable andare draped over the last surface produced.11
Kirlna Skeppström TRITA LWR.LIC 2032NFig. 3: A detailed view of the bedrock-fracture l<strong>in</strong>es-<strong>radon</strong> visualisation. The red arrows <strong>in</strong>dicatethe peaks with high <strong>radon</strong> values that are situated near or on fracture l<strong>in</strong>es.12
Radon <strong>in</strong> <strong>groundwater</strong> - Influenc<strong>in</strong>g factors and prediction methodology for a Swedish environmentStatistical analyses of data - InterpretationsUnivariate analysis us<strong>in</strong>g the method ofKruskal-Wallis ANOVA by ranks was successful<strong>in</strong> evaluat<strong>in</strong>g the relative <strong>in</strong>fluence ofthe subclasses of factors <strong>in</strong>vestigated <strong>in</strong>relation to the <strong>radon</strong> concentration <strong>in</strong><strong>groundwater</strong>. Compared to visual data m<strong>in</strong><strong>in</strong>g,quantitative units (median <strong>radon</strong> concentrations)could be computed for thevarious classes (Table 2), as a result of whichit was easier to <strong>in</strong>terpret the factors. Classselection was based on expert judgementand the different median values were computedwith an appreciable significance level.For the bedrock variable, granitic rocks wereassociated with a much higher <strong>radon</strong> concentration(540 Bq/l) than the other rocktypes. This observation tallies very well withprevious studies on <strong>radon</strong> and its relationshipwith geological materials (Choubey andRamola, 1997; Knutsson and Olofsson,2002; Przylibski et al., 2004). Granite conta<strong>in</strong>son average a higher concentration ofuranium, the parent element of <strong>radon</strong>, and <strong>in</strong>Sweden, granitic rocks can conta<strong>in</strong> morethan 5 ppm of uranium (Åkerblom andL<strong>in</strong>dgren, 1997). The content of uranium <strong>in</strong>bedrock computed by flight measurementsprovided a rough prediction for <strong>radon</strong> concentrations<strong>in</strong> <strong>groundwater</strong>. As can be observed<strong>in</strong> Table 2, <strong>radon</strong> concentration <strong>in</strong><strong>groundwater</strong> <strong>in</strong>creases with <strong>in</strong>creas<strong>in</strong>g uraniumcontent <strong>in</strong> the bedrock. However, ananomaly was encountered for the highesturanium class (> 8 ppm), s<strong>in</strong>ce the observed<strong>radon</strong> concentration was low. One possibleexplanation could be that the uranium m<strong>in</strong>eralsare not always located very near to<strong>groundwater</strong>-bear<strong>in</strong>g fractures and hencecannot contribute to <strong>in</strong>creas<strong>in</strong>g the <strong>radon</strong>concentration <strong>in</strong> the <strong>groundwater</strong>.There exists a relationship between thealtitude of the well and the correspond<strong>in</strong>g<strong>radon</strong> concentration <strong>in</strong> <strong>groundwater</strong>. Radonconcentrations were relatively higher at lowaltitudes than at high altitudes. This observationcould be clarified by the fact that any<strong>radon</strong> emanated at high altitude flows togetherwith the <strong>groundwater</strong> by convectionto lower terra<strong>in</strong>s, provided the travell<strong>in</strong>gdistance is short and the <strong>radon</strong> does notdecay (with<strong>in</strong> 3.8 days). Alternatively, itcould <strong>in</strong>stead be argued that parent elementsof 222 Rn ( 238 U and 226 Ra) leach <strong>in</strong>to <strong>groundwater</strong>at high altitudes, get transported bythe water and re-deposit on the surfaces ofthe fracture at lower altitudes and cont<strong>in</strong>ueto decay from these spots to <strong>in</strong>crease concentrationof <strong>radon</strong> <strong>in</strong> <strong>groundwater</strong>. It wasdifficult to <strong>in</strong>terpret the factor of relativealtitude with<strong>in</strong> 100 m, s<strong>in</strong>ce vary<strong>in</strong>g <strong>radon</strong>concentrations were observed at differentslopes.Another result related to geological propertiesrevealed that the type of soil overly<strong>in</strong>gthe bedrock could have some importance.One plausible explanation could be the<strong>in</strong>fluence of the permeability property of thesoils. Permeable soils allow <strong>in</strong>filtration readilyand this leads to a dilution of the <strong>radon</strong>concentration <strong>in</strong> <strong>groundwater</strong> <strong>in</strong> the subsurface.It could therefore be observed thatsand and gravel are associated with slightlylower <strong>radon</strong> concentrations than clay andsilt. Another observation made possiblethrough univariate statistical analysis relatesthe land use factor to the <strong>radon</strong> concentrationof the wells. The orig<strong>in</strong>al land use datawere classified <strong>in</strong>to summer houses, permanenthouses and other land uses, such asforests and fields. In the latter a small waterusage was assumed and it was observed that<strong>radon</strong> concentrations had a tendency to berelatively low when water was <strong>in</strong> cont<strong>in</strong>uouscirculation, such as <strong>in</strong> permanent houses. Asimilar observation was made by Knutssonand Olofsson (2002). Regard<strong>in</strong>g the factorof distance from a fracture l<strong>in</strong>e or zone, theresults of univariate statistical analysis weredifficult to <strong>in</strong>terpret. On the other hand, the<strong>in</strong>fluence of that factor could be observed <strong>in</strong>visual data m<strong>in</strong><strong>in</strong>g on 3D images. Fracturesmight be filled with m<strong>in</strong>erals conta<strong>in</strong><strong>in</strong>guranium and therefore the nearer a well islocated to a fracture zone, the higher theprobability of the <strong>groundwater</strong> conta<strong>in</strong><strong>in</strong>g an<strong>in</strong>creased concentration of <strong>radon</strong>. The reasonwhy statistical analysis was less successfulat show<strong>in</strong>g the relationship might beattributed to the class selections of distance.13
Kirlna Skeppström TRITA LWR.LIC 2032The assumed fracture zones are also givenby the l<strong>in</strong>eament maps and the position ofthe zones and their water conduct<strong>in</strong>g propertiesare uncerta<strong>in</strong>.Results of pr<strong>in</strong>cipal component analysis(PCA) are presented <strong>in</strong> Table 3. The methodanalyses only quantitative factors and <strong>in</strong>order to expla<strong>in</strong> 86% of the variance <strong>in</strong> theorig<strong>in</strong>al dataset, five components (PC) wereneeded. Although it was possible to see thevarious load<strong>in</strong>gs com<strong>in</strong>g from each factor <strong>in</strong>a component, it was often difficult to <strong>in</strong>terpretthese components and the <strong>in</strong>terpretationwas to some extent subjective.PC 1 was pr<strong>in</strong>cipally loaded by the factors ofaltitude and the relative altitude with<strong>in</strong>100 m and 500 m. This component was<strong>in</strong>terpreted as a property that guides thetransport of <strong>radon</strong> <strong>in</strong> water. The factor ofaltitude and its derivatives <strong>in</strong>directly provided<strong>in</strong>formation about the flow paths andflow speed of <strong>groundwater</strong>. The secondpr<strong>in</strong>cipal component (PC 2) was moderatelyloaded by uranium content <strong>in</strong> the bedrock,distance to fracture zone and <strong>radon</strong> concentration<strong>in</strong> <strong>groundwater</strong>. PC 2 was <strong>in</strong>terpretedas an enrichment of uranium <strong>in</strong> the fracturezones. Uranium content <strong>in</strong> the bedrock,<strong>radon</strong> concentrations <strong>in</strong> <strong>groundwater</strong> anddifference <strong>in</strong> altitude carried the highestload<strong>in</strong>g <strong>in</strong> PC 3. That component might bean <strong>in</strong>dicator of <strong>radon</strong> and uranium transport<strong>in</strong> <strong>groundwater</strong>, as a result of the heightdifference. PC 4 was loaded by a s<strong>in</strong>glefactor and was probably related directly tothe fracture fill<strong>in</strong>gs. The fifth pr<strong>in</strong>cipal component(PC 5) was reta<strong>in</strong>ed as the emanationof <strong>radon</strong> from uranium, s<strong>in</strong>ce the load<strong>in</strong>gscame from these parameters.Table 2: Results of Kruskal-Wallis ANOVAby ranksFactorsSoil at well locationBedrock at welllocationLand use at welllocationUranium content(ppm) <strong>in</strong> bedrockAltitude (m a.s.l)Relative altitudewith<strong>in</strong> 100 m (%)Distance fromfracture (m)Clay/SiltTillRockClassesSand/gravelMetasedimentaryFelsic gneissesMafic rocksGraniteSummer housesPermanent housesFields, forests0-22-44-66-8> 80-2020-4040-60>600-2020-4040-6060-8080-100200RadonMedianvalue (Bq/l)280252200224150240150540190163370190260495410195240240147125200240250250210220210205230Table 3: Pr<strong>in</strong>cipal component load<strong>in</strong>gs for quantitative factors . Significant load<strong>in</strong>gs are marked <strong>in</strong>boldPC 1 PC 2 PC 3 PC 4 PC 5Radon content <strong>in</strong> <strong>groundwater</strong> (z 1 ) -0.093 0.493 0.427 0.159 0.723Altitude of the well (z 2 ) 0.586 -0.114 0.129 -0.258 0.235Relative altitude with<strong>in</strong> 100 m (z 3 ) 0.432 0.280 -0.375 0.331 -0.079Relative altitude with<strong>in</strong> 500 m (z 4 ) 0.608 0.238 -0.116 -0.014 -0.007Difference <strong>in</strong> altitude (z 5 ) 0.246 -0.538 0.354 -0.325 0.146Uranium content <strong>in</strong> rock (z 6 ) 0.106 0.370 0.666 -0.045 -0.627Distance to fracture zone (z 7 ) -0.140 0.428 -0.280 -0.831 0.01114
Radon <strong>in</strong> <strong>groundwater</strong> - Influenc<strong>in</strong>g factors and prediction methodology for a Swedish environmentRadon prediction us<strong>in</strong>g Risk VariableModell<strong>in</strong>gThe RV modell<strong>in</strong>g, which was based onl<strong>in</strong>ear regression, generated risk values associatedwith each group of <strong>radon</strong> concentrations.Calibration of the model was based onhalf of the wells compris<strong>in</strong>g the database(2209 wells) and the result is presented <strong>in</strong>the form of a boxplot (Fig. 4).Radon concentrations were classified <strong>in</strong>todifferent concentration ranges based on theregulatory limits applicable <strong>in</strong> Sweden. It wasobserved that risk values became more negativewith <strong>in</strong>creas<strong>in</strong>g <strong>radon</strong> concentrations,although the standard deviations of thegroups were considerable.A test (or validation) of the Risk VariableModel was conducted on the other half ofthe dataset, compris<strong>in</strong>g 2209 wells and distributed<strong>in</strong> 12 subareas. Risk values associatedwith correspond<strong>in</strong>g <strong>radon</strong> concentrationswere computed. The results arepresented <strong>in</strong> the form of a scatterplot(Fig. 5), <strong>in</strong> which the median <strong>radon</strong> concentrationprevail<strong>in</strong>g <strong>in</strong> each area was plottedaga<strong>in</strong>st the correspond<strong>in</strong>g median risk value<strong>in</strong> that area. As can be observed <strong>in</strong> Fig. 5, ahigh negative correlation (-0.87) existedbetween the two plotted quantities, imply<strong>in</strong>gthat the higher the <strong>radon</strong> concentration, themore negative the risk value. A similar trendwas observed <strong>in</strong> the calibration stage.A prediction map <strong>in</strong> GISRaster maps of elevation, bedrock, soil, landuse and uranium concentration <strong>in</strong> bedrockwere reclassified and the different classeswere assigned their correspond<strong>in</strong>g rat<strong>in</strong>gs.An overlay operation was performed to get af<strong>in</strong>al risk map. Each pixel represents a f<strong>in</strong>alrisk value equivalent to the sum of the riskvalues. The factor distance to fracture zonewas not <strong>in</strong>cluded <strong>in</strong> the map productions<strong>in</strong>ce it was not a surface map. Differentwater bodies (e.g. lakes, rivers) were thenadded to the f<strong>in</strong>al map. Three categories ofrisk areas were def<strong>in</strong>ed: Low risk for all f<strong>in</strong>alrisk values, FRV > 0; medium risk for all,–5 < FRV < 0; high risk for all, FRV < -5.The risk map <strong>in</strong> a sample study area isshown <strong>in</strong> Fig. 6.In Paper I, the prediction map based on theRV method was compared to the map of<strong>in</strong>terpolated airborne uranium concentrations<strong>in</strong> the bedrock. It was observed thatsome regions with low to moderate uraniumconcentrations <strong>in</strong> the bedrock were def<strong>in</strong>edas high-risk areas <strong>in</strong> the correspond<strong>in</strong>g RVmap. However, such observations need tobe compared with field measurements <strong>in</strong>future work. It should also be mentionedthat geological materials (bedrock and uraniumdistribution) used <strong>in</strong> the various analysesand available on a scale of 1:50 000 donot always reflect the geological conditionsthat prevail at a specific site.15
Kirlna Skeppström TRITA LWR.LIC 2032Fig. 4: Boxplot show<strong>in</strong>g ranges of risk values for different <strong>radon</strong> concentrations (model calibration,based on 2209 wells). SE=Standard error, SD=Standard deviation.Fig. 5: Scatterplot show<strong>in</strong>g the relationship between median risk values and median <strong>radon</strong> valuesfor 12 test areas with<strong>in</strong> the study region (total n = 2209).16
Radon <strong>in</strong> <strong>groundwater</strong> - Influenc<strong>in</strong>g factors and prediction methodology for a Swedish environmentFig. 6: Example of a <strong>radon</strong> prediction map based on the RV method.17
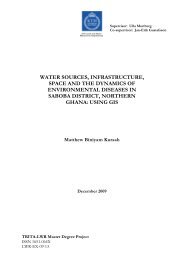
Kirlna Skeppström TRITA LWR.LIC 2032Detailed study on LjusteröThe results of the detailed study are presented<strong>in</strong> Fig.7. The observed concentrationof 222 Rn <strong>in</strong> <strong>groundwater</strong> tended to <strong>in</strong>creasewith <strong>in</strong>creas<strong>in</strong>g concentration of uranium(total U) and radium ( 226 Ra) <strong>in</strong> the solution.However, the correlations were weak, 0.16and 0.18 for 238 U and 226 Ra respectively. Thisobservation supports the concept that <strong>radon</strong>concentration <strong>in</strong> <strong>groundwater</strong> pr<strong>in</strong>cipallycomes from its parent elements ( 238 U and226 Ra) deposited on the surfaces of fractures(Åkerblom and L<strong>in</strong>dgren, 1997). Regard<strong>in</strong>gground measurements of equivalent uranium(eU) made directly on outcrops, it could beobserved that high <strong>radon</strong> concentrationscould occur <strong>in</strong> bedrock of low to moderateuranium content. It was also observed thatthe <strong>radon</strong> concentration <strong>in</strong> <strong>groundwater</strong> didnot <strong>in</strong>crease with <strong>in</strong>creas<strong>in</strong>g content of uranium<strong>in</strong> the bedrock. The same observationwas made for the analysis of 222 Rn <strong>in</strong><strong>groundwater</strong> and airborne uranium measurements.These observations could beexpla<strong>in</strong>ed by the fact that the bedrock identifiedby visual <strong>in</strong>spection above the groundsurface might not be the same <strong>in</strong> the subsurfacewhere <strong>groundwater</strong> is extracted. Anotherplausible argument relates to the migrationof radionuclides (ma<strong>in</strong>ly 226 Ra and238 U) <strong>in</strong> <strong>groundwater</strong> flow. The bedrockmight orig<strong>in</strong>ally conta<strong>in</strong> low concentrationsof act<strong>in</strong>ide but transportation of 238 U and226 Ra can contribute to <strong>in</strong>creas<strong>in</strong>g the <strong>radon</strong>concentration <strong>in</strong> the <strong>groundwater</strong>. The localconditions are difficult to identify <strong>in</strong> reality.The activity ratio of 226 Ra/ 238 U <strong>in</strong> solutionvaried between 0 and 12, which clearly <strong>in</strong>dicatesa state of disequilibrium <strong>in</strong> the<strong>groundwater</strong> system.(a)(b)(c)Fig. 7: (a) Relationship between 222 Rn anduranium <strong>in</strong> <strong>groundwater</strong>; (b) Relationshipbetween 222 Rn and radium <strong>in</strong> <strong>groundwater</strong>;(c) Relationship between 222 Rn <strong>in</strong> <strong>groundwater</strong>and measured uranium <strong>in</strong> bedrock outcrops.18
Radon <strong>in</strong> <strong>groundwater</strong> - Influenc<strong>in</strong>g factors and prediction methodology for a Swedish environmentCONCLUSIONS• Radon concentration <strong>in</strong> <strong>groundwater</strong>was successfully analysed throughmultivariate statistical analyses. Therisk variable method was useful toidentify areas with <strong>in</strong>creased <strong>radon</strong>concentrations <strong>in</strong> the <strong>groundwater</strong>.• Factors of significance for the predictionof <strong>radon</strong> <strong>in</strong> <strong>groundwater</strong> were:type of bedrock, type of soil, altitude,distance to a fracture zone and the distributionof uranium <strong>in</strong> the bedrock.• Visual data m<strong>in</strong><strong>in</strong>g revealed correlationpatterns <strong>in</strong> a prelim<strong>in</strong>ary stage ofdata analysis but were not useful as an<strong>in</strong>dependent method to draw conclusionsregard<strong>in</strong>g <strong>radon</strong> concentrations<strong>in</strong> <strong>groundwater</strong>. The 3D visualisationsof the dataset did not show any newpattern but <strong>in</strong>stead confirmed the correlationsgiven from statistical analyses.• A weak correlation existed between222 Rn and 226 Ra or 238 U <strong>in</strong> the <strong>groundwater</strong>,<strong>in</strong>dicat<strong>in</strong>g that the ma<strong>in</strong> sourceof 222 Rn <strong>in</strong> <strong>groundwater</strong> was not orig<strong>in</strong>at<strong>in</strong>gfrom its parent elements (asions) <strong>in</strong> solution.FUTURE WORKThe present research evaluated differentspatial data for the purpose of develop<strong>in</strong>g a222prediction methodology for Rn <strong>in</strong><strong>groundwater</strong> on a general scale. However,the dynamics of subsurface processes, whichprobably have a strong <strong>in</strong>fluence on theoccurrence and migration of radionuclides( 222 Rn, 226 Ra and 238 U), were not studied. Thegoals for future work would thus <strong>in</strong>clude thefollow<strong>in</strong>g issues:1. Clarification of <strong>groundwater</strong> chemistry<strong>in</strong> connection with high natural radioactivity<strong>in</strong> <strong>groundwater</strong>. Ge<strong>och</strong>emicalmodell<strong>in</strong>g will be carried out<strong>in</strong> order to identify and quantify ge<strong>och</strong>emicalprocesses govern<strong>in</strong>g uraniummobilisation and fixation and to developan understand<strong>in</strong>g of the longtermeffects of oxidation-reduction onact<strong>in</strong>ide (uranium) behaviour. Additionalchemical data are needed forthat purpose and a sampl<strong>in</strong>g programmeconsist<strong>in</strong>g of water sampl<strong>in</strong>gand chemical analyses of <strong>groundwater</strong>needs to be carried out.2. The variation <strong>in</strong> radionuclides <strong>in</strong><strong>groundwater</strong> over time and season willalso be <strong>in</strong>vestigated. For that purpose,about five wells will be sampledmonthly over a period of one year.3. The transport mechanisms of 222 Rnand its parent elements ( 226 Ra and238 U) are highly relevant subsurfaceprocesses that need to be studied. Exist<strong>in</strong>gtransport models for these radionuclideshave previously been developed<strong>in</strong> connection with <strong>in</strong>vestigationsregard<strong>in</strong>g repository sites fornuclear waste. These models are oftenvery detailed and their applications ona general scale have not been tested.The goal is to evaluate these modelsand formulate a simplified processbasedtransport model for <strong>radon</strong> <strong>in</strong><strong>groundwater</strong>.4. In a f<strong>in</strong>al stage, an operative methodfor vulnerability assessment of <strong>radon</strong>content <strong>in</strong> wells based on the outcomeof the modell<strong>in</strong>g and previous generalisedstudies <strong>in</strong> GIS will be formulated.Such a tool will be helpful <strong>in</strong> decisionmak<strong>in</strong>gprocesses concern<strong>in</strong>g plann<strong>in</strong>gof new wells or effective remediationmeasures.19
Kirlna Skeppström TRITA LWR.LIC 2032REFERENCESÅkerblom, G. and L<strong>in</strong>dgren, J. 1997. Mapp<strong>in</strong>g of <strong>groundwater</strong> <strong>radon</strong> potential. European Geologist5: 13-22.Åkerblom, G., Falk, R., L<strong>in</strong>dgren, J., Mjönes, L., Östergren, I., Söderman, A.L., Nyblom, L.,Möre, H., Hagberg, N.M., Andersson, P. and Ek, B.M. 2005. Natural radioactivity <strong>in</strong>Sweden, exposure to <strong>in</strong>ternal radiation, Radiological Protection <strong>in</strong> Transition. Proceed<strong>in</strong>gsof the XIV Regular Meet<strong>in</strong>g of the Nordic Society for Radiation Protection, NSFS, Rättvik,Sweden, pp. 211-214.Axelson, O. 1984. Room for a role for <strong>radon</strong> <strong>in</strong> lung cancer causation? Medical Hypotheses13(1): 51-61.Bonham-Carter, G.F. 1998. Geographic Information Systems for Geoscientists: Modell<strong>in</strong>g withGIS. Elsevier Science Ltd, UK.Bowr<strong>in</strong>g, C.S and Banks, D. 1995. Radon <strong>in</strong> private water supplies <strong>in</strong> SW England. Journal ofRadiological Protection, 15(1): 73 -76.Burrough, P.A. and McDonnell, R.A.. 2000. Pr<strong>in</strong>ciples of Geographical Information Systems.Oxford University Press, United States, 1 - 330 pp.Chen, J.P. and Yiacoumi, S. 2002. Model<strong>in</strong>g of depleted uranium transport <strong>in</strong> subsurface systems.Water, Air, and Soil Pollution 140: 173-201.Choubey, V.M. and Ramola, R.C. 1997. Correlation between geology and <strong>radon</strong> levels <strong>in</strong><strong>groundwater</strong>, soil and <strong>in</strong>door air <strong>in</strong> Bhilangana Valley, Garhwal Himalaya, India. EnvironmentalGeology 32(4): 258-262.Choubey, V.M., Bartarya, S.K. and Ramola, R.C. 2000. Radon <strong>in</strong> Himalayan spr<strong>in</strong>gs: A geohydrologicalcontrol. Environmental Geology 39(6): 523-530.Choubey, V.M., Bartarya, S.K., Sa<strong>in</strong>i, N.K. and Ramola, R.C. 2001. Impact of geohydrology andneotectonic activity on <strong>radon</strong> concentration <strong>in</strong> <strong>groundwater</strong> of <strong>in</strong>termontane Doon Valley,Outer Himalaya, India. Environment Geology 40: 257-266.Davis, J.C. 2002. Statistics and Data Analysis <strong>in</strong> Geology. John Wiley & Sons, Inc.Demšar, U. 2004. Explor<strong>in</strong>g Geographical Metadata by Automatic and Visual Data M<strong>in</strong><strong>in</strong>g.Licentiate thesis, TRITA-INFRA 04-010, <strong>KTH</strong>, Stockholm, 1-92 pp.Emell, A. and Moen, L. 2005. The Relationship Between Uranium, Radon and the Geology ofthe Island of Ljusterö <strong>in</strong> the Stockholm Archipelago. Master's Thesis TRITA-LWR 05:17,Division of Land and Water Resources Eng<strong>in</strong>eer<strong>in</strong>g, <strong>KTH</strong>, Stockholm.Fayyad, U., Gr<strong>in</strong>ste<strong>in</strong>, G.G. and Wierse, A. 2002. Information Visualization <strong>in</strong> Data M<strong>in</strong><strong>in</strong>g andKnowledge Discovery. Morgan Kaufmann, San Francisco: 1-407.Gahegan, M., Takatsuka, M., Wheeler, M. and Hardisty, F. 2002. Introduc<strong>in</strong>g GeoVISTA Studio:An <strong>in</strong>tegrated suite of visualization and computational methods for exploration andknowledge construction <strong>in</strong> geography. Computers, Environment and Urban Systems 26:267-292.Geiger, C. and Barnes, K. 1994. Indoor <strong>radon</strong> hazard: A geographical assessment and case study.Applied Geography 14: 350-371.Glaus, M.A., Hummel, W. and Van Loon, L.R. 2000. Trace metal-humic <strong>in</strong>teractions. I. Experimentaldeterm<strong>in</strong>ation of conditional stability constants. Applied Ge<strong>och</strong>emistry 15: 953-973.Gontier, M. and Olofsson, B. 2003. Areell sårbarhetsbedömn<strong>in</strong>g för grundvattenpåverkan avvägföroren<strong>in</strong>gar. TRITA-LWR.REPORT 3011, Kungliga Tekniska Högskolan (<strong>KTH</strong>),Stockholm.20
Radon <strong>in</strong> <strong>groundwater</strong> - Influenc<strong>in</strong>g factors and prediction methodology for a Swedish environmentHerczeg, A., Simpson, J.H., Anderson, R., Trier, R., Mathieu, G.G. and Deck, B. 1988. Uraniumand radium mobility <strong>in</strong> <strong>groundwater</strong>s and br<strong>in</strong>es with<strong>in</strong> the Delaware Bas<strong>in</strong>, SoutheasternNew Mexico, USA. Chemical Geology (Isotioe Geoscience Section) 72: 181-196.Ishikawa, T., Yosh<strong>in</strong>aga, S. & Tokonami, S. 2005. Airborne and waterborne <strong>radon</strong> concentrations<strong>in</strong> houses with the use of <strong>groundwater</strong>. International Congress Series 1276: 301-302.Johnson, R. and Wichern, D. 2002. Applied Multivariate Statistical Analysis. Prentice Hall, NewJersey, 426-476 pp.Kendall, G.M. 2004. Controls on radioactivity <strong>in</strong> water supplies <strong>in</strong> England and Wales, with especialreference to <strong>radon</strong>. Journal of Radiological Protection 24: 409-412.Kim, J.H., Kim, R.H., Lee, J., Cheong, T.J., Yum, B.W. and Chang, H.W. 2004. Multivariatestatistical analysis to identify the major factors govern<strong>in</strong>g <strong>groundwater</strong> quality <strong>in</strong> thecoastal area of Kimje, South Korea. Hydrological Processes 19: 1261-1276.Knutsson, G. 1977. Radon Content <strong>in</strong> Various Types of Groundwater <strong>in</strong> South-eastern Sweden:A Prelim<strong>in</strong>ary Report. Striae, pp. 55-59.Knutsson, G. and Olofsson, B. 2002. Radon content <strong>in</strong> <strong>groundwater</strong> from drilled wells <strong>in</strong> theStockholm region of Sweden. NGU-bullet<strong>in</strong>, pp. 79-85.Kohli, S., Sahlén, K., Löfman, O., Sivertun, Å., Foldevi, M., Trell, E. and Wigertz, O. 1997. Individualsliv<strong>in</strong>g <strong>in</strong> areas with high background <strong>radon</strong>: A GIS method to identify populationsat risk. Computer Methods and Programs <strong>in</strong> Biomedic<strong>in</strong>e 53: 105-112Kraak, M.J. and Koussoulakou, A. 2004. A visualization environment for the space-time cube. In:P.F Fisher (Editor), Developments <strong>in</strong> Spatial Data Handl<strong>in</strong>g, 11 th International Symposiumon Spatial Data Handl<strong>in</strong>g, Spr<strong>in</strong>ger Verlag, Berl<strong>in</strong> Heidelberg, pp. 189-200.Lew<strong>in</strong> Pihblad, L. 1998. The relationship between the contents of <strong>radon</strong>, fluoride and heavymetals <strong>in</strong> drilled wells and geological and technical factors (<strong>in</strong> Swedish), Miljökontoret,Uppsala Kommun, Uppsala.Lew<strong>in</strong>, L. and Simeonidis, A. 1998. A survey of Radon, Fluoride and Heavy Metals <strong>in</strong> DrilledWells <strong>in</strong> Uppsala Municipality (<strong>in</strong> Swedish), Miljökontoret, Uppsala Kommun, Uppsala.Lidén, E., L<strong>in</strong>dén, A., Andersson, A., Åkerblom, G. and Åkesson, T. 1995. Radon i vatten frånbergborrade brunnar. Resultat från en undersökn<strong>in</strong>g i Örebro kommun (<strong>in</strong> Swedish).Statents Strålskydds<strong>in</strong>stitut, SSI-rapport 95:18.L<strong>in</strong>dberg, J., Olofsson, B. and Gumbricht, T. 1996. Risk mapp<strong>in</strong>g of <strong>groundwater</strong> sal<strong>in</strong>izationus<strong>in</strong>g Geographical Information Systems, 14 th Salt Water Intrusion Meet<strong>in</strong>g (SWIM), 16-21 June 1996, Malmö, Sweden. SGU Rapporter <strong>och</strong> Meddelanden no 87, pp 188-197.L<strong>in</strong>dberg, J. and Olofsson, B. 1997. Risk for Salt Water Intrusion (<strong>in</strong> Swedish), Report fromNorrtälje municipality, SGU (Geological Survey of Sweden) and <strong>KTH</strong>. Norrtälje municipality,32 pp.Monn<strong>in</strong>, M. and Seidel, J.L. 1992. Radon <strong>in</strong> soil-air and <strong>in</strong> <strong>groundwater</strong> related to major geophysicalevents: A survey. Nuclear Instruments and Methods <strong>in</strong> Physics Research A314:316-330.Nilssen, R.S.A. 2001. Radon <strong>in</strong> Groundwater from Drilled Wells <strong>in</strong> Hard Rock. Studies from FiveLocalities <strong>in</strong> Bergen and Os. (<strong>in</strong> Norwegian). MSc. thesis, Geologisk Institutt - Universiteti Bergen, 1-92 pp.NRC:National Resource Council (USA). 1996. Rock Fractures and Fluid Flow. National AcademyPress, Wash<strong>in</strong>gton, D.C.Olofsson, B. 2000. Prediction of the impact on <strong>groundwater</strong> <strong>in</strong> soil by tunnel construction <strong>in</strong>hard rocks us<strong>in</strong>g GIS. In: T. Nilsson (Editor), Nordic Hydrological Conference. NordicAssociation for Hydrology, Uppsala, Sweden, pp. 441-448.21
Kirlna Skeppström TRITA LWR.LIC 2032Olofsson, B., Jacks, G., Knutsson, G. and Thunvik, R. 2001. Groundwater <strong>in</strong> hard rock (chapter4). In: SOU (Editor), Excerpt from Nuclear waste. Swedish Government Official reports,SOU 2001:35, Stockholm., pp. 1-77.Östergren, I., Åkerblom, G. and Ek, B.M. 2005. Mätn<strong>in</strong>gar av naturlig radioaktivitet i <strong>och</strong> frånfilter vid några vattenverk (<strong>in</strong> Swedish). SSI Rapport 2005:14, Swedish Radiation ProtectionAuthority, Stockholm.Petersen, W., Bert<strong>in</strong>o, L., Callies, U. and Zorita, E. 2001. Process identification by pr<strong>in</strong>cipal componentanalysis of river water-quality data. Ecological Modell<strong>in</strong>g 138: 193-213.Porsani, J.L., Elis, V.R. and Hiodo, F.Y. 2005. Geophysical <strong>in</strong>vestigations for the characterizationof fractured rock aquifers <strong>in</strong> Itu, SE Brazil. Journal of Applied Geophysics 57: 119-128.Przylibski, T.A., Cies´la, K., Kusyk, M., Dorda, J. and Kozlowska, B. 2004. Radon concentrations<strong>in</strong> <strong>groundwater</strong>s of the Polish part of the Sudety Mounta<strong>in</strong>s (SW Poland). Journal of EnvironmentalRadioactivity 75(2): 193-209.Salih, M.I., Pettersson, H.B.L., Sivertun, Å. and Lund, E. 2002. Spatial correlation between <strong>radon</strong>( 222 Rn) <strong>in</strong> <strong>groundwater</strong> and bedrock uranium ( 238 U): GIS and geostatistical analyses. Journalof Spatial Hydrology 2(2): 1-10.Salih, M.I. 2003. Radon <strong>in</strong> Natural waters. Doctoral thesis Thesis, L<strong>in</strong>köp<strong>in</strong>g University,L<strong>in</strong>köp<strong>in</strong>g, 1-46 pp.Salih, M.I., Bäckström, M., Karlsson, S., Lund, E. and Pettersson, H.B.L. 2004. Impact of fluorideand other aquatic parameters on <strong>radon</strong> concentration <strong>in</strong> natural waters. Applied Radiationand Isotopes 60: 99 - 104.Schubert, M., Peňa, P., Balcázar, M., Meissner, R., Lopez, A. and Flores, J.H. 2005. Determ<strong>in</strong>ationof <strong>radon</strong> distribution patterns <strong>in</strong> the upper soil as a tool for the localization of subsurfaceNAPL contam<strong>in</strong>ation (article <strong>in</strong> press). Radiation Measurements.Schumann, R. and Gundersen, L.C.S. 1996. Geologic and climatic controls on the <strong>radon</strong> emanationcoefficient. Environment International 22: 439-446.Siegel, M.D. and Bryan, C.R. 2004. Environmental Ge<strong>och</strong>emistry of Radioactive Contam<strong>in</strong>ation.Treatise on Ge<strong>och</strong>emistry. Available onhttp://www.sciencedirect.com/science/referenceworks/0080437516, pp. 205-262.S<strong>in</strong>gh, K., Malik, A., Mohan, D. and S<strong>in</strong>ha, S. 2004. Multivariate statistical techniques for theevaluation of spatial and temporal variations <strong>in</strong> water quality of Gomti River (India)- acase study. Water Research 38: 3980-3992.SOU. 1994. Regler<strong>in</strong>g av vattenuttag ur enskilda brunnar (<strong>in</strong> Swedish). Swedish GovernmentOfficial reports, SOU 1994:97, Stockholm.SSI. 1998. Radon i vatten (<strong>in</strong> Swedish). Rapport, SSS, Livsmedelsverket, Boverket, Socialstyrelsen,SSI <strong>in</strong>formation, i98: 3.Stetzenbach, K., Farnham, I., Hodge, V. and Johannesson, K. 1999. Us<strong>in</strong>g multivariate statisticalanalyisis of <strong>groundwater</strong> major cation and trace element concentrations to evaluate<strong>groundwater</strong> flow <strong>in</strong> a regional aquifer. Hydrological Processes 13: 2655-2673.Ståhl, B. 1997. Radon i enskilda dricksvattenbrunnar på Örnö <strong>och</strong> Utö (<strong>in</strong> Swedish). Han<strong>in</strong>gekommun, Miljökontoret, Miljö & Stadsbyggnad, Rapport 1997:1.Tanner, A.B. 1980. Radon migration <strong>in</strong> the ground: A supplementary review. In T.F. Gessell andW.M. Lowder (editors). Proc. Natural Radiation Environment III. Report CONF-780422, Department of Energy, Wash<strong>in</strong>gton, D.C.Thalib, L., Kitch<strong>in</strong>g, R.L. and Bhatti M, I. 1999. Pr<strong>in</strong>cipal component analysis for grouped data- acase study. Environmetrics 10: 565-574.22
Radon <strong>in</strong> <strong>groundwater</strong> - Influenc<strong>in</strong>g factors and prediction methodology for a Swedish environmentVega, M., Pardo, R., Barrado, E. and Debán, L. 1998. Assessment of seasonal and pollut<strong>in</strong>g effectson the quality of river water by exploratory data analysis. Water Research 32(12):3581-3592.Waite, T.D., Davis, J.A., Payne, T.E., Waychunas, G.A. and Xu, N. 1994. Uranium(VI) adsorptionto ferrihydrite: Application of a surface complexation model. Ge<strong>och</strong>imica et Cosm<strong>och</strong>imicaActa 58: 5465-5478.23