WSM Reference Guide - WatchGuard Technologies
WSM Reference Guide - WatchGuard Technologies
WSM Reference Guide - WatchGuard Technologies
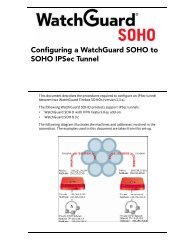
- No tags were found...

You also want an ePaper? Increase the reach of your titles
YUMPU automatically turns print PDFs into web optimized ePapers that Google loves.
Traffic LogsAlarm logsAlarm logs are sent when an alarm condition is met. The Firebox sends the alarm to the Traffic Monitorand Log Server and triggers the specified action.Some alarms are set in your Firebox configuration. For example, you can use Policy Manager to configurean alarm to occur when a certain threshold is met. Other alarms are set by default. The Firebox sendsan alarm log when a network connection on one of the Firebox interfaces fails. This cannot be changedin your configuration. The Firebox never sends more than 10 alarms in 15 minutes for the same set ofconditions.There are eight categories of alarm logs: System, IPS, AV, Policy, Proxy, Probe, Denial of service, and Traffic.Event logsEvent logs are created because of Firebox user activity. Events that cause event logs include:• Firebox start up/shut down• Firebox and VPN authentication• Process start up/shut down• Problems with the Firebox hardware components• Any task done by the Firebox administratorDiagnostic logsDiagnostic logs are more detailed log messages sent by the Firebox that you can use to help troubleshootproblems. You can select the level of diagnostic logging to see in your traffic monitor, or write toyour log file. You can configure the diagnostic log level from Policy Manager > Setup > Logging >Advanced Diagnostics. The available levels are off, low, medium, high, and advanced. We do not recommendthat you set the logging level to advanced unless you are working with a technical supportteam to diagnose a problem, as it can cause the log file to fill up very quickly.Traffic LogsMost of the logs shown in Traffic Monitor are traffic logs. Traffic logs show the traffic that moves throughyour Firebox and how the packet filter and proxy policies were applied. Traffic Monitor shows all of thelog messages from the Firebox that are recorded in your log file.Packet Filter LogsPacket filter logs contain a set number of fields. Here is an example of the XML output of a packet filterlog message. The information will look different when you see the same log message in Traffic Monitoror LogViewer. Below the example, there is an explanation for each field that appears.FWAllow d="2005-01-25T23:12:12" orig="HQFirebox" disp="Allow" pri="1" policy="SSH-outgoing-05"src_ip="192.168.130.59" dst_ip="10.10.171.98"pr="ssh" src_port="56952" dst_port="22" src_intf="1-Trusted" dst_intf="0-External" rc="100" msg="firewall pass, mss not exceeding 1460, idle timeout=43205sec" pckt_len="60" ttl="63" log_type="tr"/28 <strong>WatchGuard</strong> System Manager