MEWAH INTERNATIONAL INC. Unaudited ... - Mewah Group
MEWAH INTERNATIONAL INC. Unaudited ... - Mewah Group
MEWAH INTERNATIONAL INC. Unaudited ... - Mewah Group
- No tags were found...

Create successful ePaper yourself
Turn your PDF publications into a flip-book with our unique Google optimized e-Paper software.
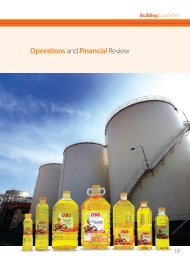
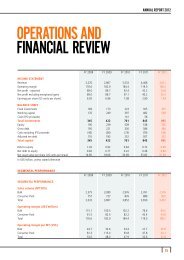
<strong>MEWAH</strong> <strong>INTERNATIONAL</strong> <strong>INC</strong>.(Incorporated in the Cayman Islands. Registration Number: CR-166055)<strong>Unaudited</strong> Financial Statements For The Second Quarter and Half Year Ended 30 June 2011The following table summarises the sales volume, sales revenue and OM:Total Bulk Consumer PackQ2 2011 Q2 2010 Inc/(Dec) Q2 2011 Q2 2010 Inc/(Dec) Q2 2011 Q2 2010 Inc/(Dec)Sales volume (M.T.'000) 981.2 948.7 3.4% 753.1 740.1 1.8% 228.2 208.6 9.4%Sales revenue (US$'million) 1,247.4 823.1 51.5% 905.1 606.4 49.3% 342.2 216.7 57.9%Average selling prices (US$) 1,271.2 867.6 46.5% 1,201.9 819.4 46.7% 1,500.0 1,038.9 44.4%OM (US$'million) 22.6 31.2 -27.4% 13.4 18.3 -26.9% 9.3 12.9 -28.1%OM per M.T. (US$) 23.1 32.9 -29.8% 17.8 24.7 -28.1% 40.6 61.8 -34.3%Total Bulk Consumer PackH1 2011 H1 2010 Inc/(Dec) H1 2011 H1 2010 Inc/(Dec) H1 2011 H1 2010 Inc/(Dec)Sales volume (M.T.'000) 1,837.6 1,909.1 -3.7% 1,413.0 1,483.6 -4.8% 424.6 425.5 -0.2%Sales revenue (US$'million) 2,362.7 1,623.3 45.6% 1,729.4 1,181.3 46.4% 633.3 442.0 43.3%Average selling prices (US$) 1,285.7 850.3 51.2% 1,223.9 796.2 53.7% 1,491.6 1,038.7 43.6%OM (US$'million) 59.2 69.8 -15.2% 34.9 41.2 -15.2% 24.3 28.6 -15.1%OM per M.T. (US$) 32.2 36.6 -12.0% 24.7 27.8 -11.0% 57.2 67.2 -14.9%Sales volumeFor the second quarter ended 30 Jun 2011 (“Q2 2011”), the <strong>Group</strong> achieved total sales volume of 981.2thousand M.T., 3.4% up from corresponding quarter last year (“Q2 2010”). Sales volume for Bulksegment was increased by 1.8% to 753.1 thousand M.T. and for Consumer Pack segment, the salesvolume increased by 9.4% to 228.2 thousand M.T.. Bulk segment and Consumer Pack segmentcontributed 76.7% and 23.3% of total sales volume respectively (Q2 2010: 78.0% and 22.0%respectively).For the half year ended 30 Jun 2011 (“H1 2011”), total sales volume was 1,837.6 thousand M.T., 3.7%lower than the corresponding period last year (“H1 2010”). Sales volume for Bulk segment declined by4.8% to 1,413.0 thousand M.T. and for Consumer Pack segment, the sales volume declined by 0.2% to424.6 thousand M.T.. Bulk segment and Consumer Pack segment contributed 76.9% and 23.1% of totalsales volume respectively (H1 2010: 77.7% and 22.3% respectively).RevenueFor Q2 2011, revenue increased by 51.5% to US$1,247.4 million on the back of higher average sellingprice. For Bulk segment, revenue increased by 49.3% to US$905.1 million and for Consumer Packsegment, revenue increased by 57.9% to US$342.2 million. Bulk segment and Consumer Pack segmentcontributed 72.6% and 27.4% of total revenue respectively. (Q2 2010: 73.7% and 26.3% respectively).For H1 2011 revenue increased by 45.6% to US$2,362.7 million. For Bulk segment, revenue increased by46.4% to US$1,729.4 million and for Consumer Pack segment, revenue increased by 43.3% to US$633.3million. Bulk segment and Consumer Pack segment contributed 73.2% and 26.8% of total revenuerespectively (H1 2010: 72.8% and 27.2% respectively).13