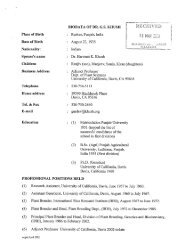
ASM Science Journal, Volume 7(1), 2013during that temperature, all pre-asphaltene and asphaltenewere converted into lighter molecular components ofoil+gas. Therefore, it was definitive that the coal extractiontended to pre-dominate at lower liquefaction temperature,with radical reaction which started to occur at liquefactiontemperature at or above 400ºC. According to Prasassarakichet al. (2007), increasing the temperature above 410ºC willcause a decrease in liquid yield. This was because whenusing high reaction temperature, the liquid was fragmentedand formed free radicals and was stabilized by hydrogento form the gas phase. However, further increasing of thetemperature would result in more gas formation and lessoil. Hence, it was suggested that 420ºC was the optimumtemperature which resulted the high coal conversion andoil yield.Effect of reaction time. The effect of reaction time oncoal conversion and product yields of MB coal was alsoinvestigated and the results are shown in Figure 4 andTable 2. Apparently, the percentages of coal conversion ateach different reaction time were relatively the same. Therewas a slight difference in the oil+gas yield as the reactiontime increased. The data indicated that the reaction timeaffected only a little in enhancing the total conversion.A fair amount of coal conversion and oil+gas yield wereobserved with the lesser amount of reaction time whichalso could be improve by the introduction of catalyst in theliquefaction process. The less reaction time also meant lesssolvent used which is economical compared to the amountof solvent used with a longer reaction time.Effect of solvent flow-rate. Another significant parameterthat could improve in the development of coalliquefaction process is solvent flow-rate. In an attemptto achieve high coal conversion and oil+gas yield, it isimportant to ensure that enough fresh solvent is presentduring the extraction process. One option is by providingsolvent into the reactor continuously during the liquefactionprocess. The effects of solvent flow-rate are shown inFigure 5 and Table 2. Generally, the coal conversions forthree different flow-rates were relatively the same. Thepercentage of asphaltene increased while the percentage ofpre-asphaltene was found to decrease with the increasingof solvent flow-rate.These results indicated that by enabling the solvent toflow during liquefaction process, it was possible to extractmore components out of the coal with high percentage ofcoal conversion (~80%) regardless of the different flowrateof the solvent used. Furthermore, the presence offresh hydrogen-donor solvent during the reaction processstabilized most of reactive radical species to form lowmolecular weight products such as asphaltene and preasphaltene,and also the light products of oil+gas. In otherword, with a sufficient supply of fresh donor solvent duringcoal liquefaction, most of the asphaltene and pre-asphaltenewere converted into oil+gas.Similar results for the amount of solvent on coalconversion were reported by Simsek et al. (2001), wherethe extent of conversion of coal depends on how the radicalsare being stabilized. Thus, the liquefaction yield would behigh if there was sufficient hydrogen available, while theliquefaction yields would be low if there was insufficientavailability of hydrogen which would cause the radicals toundergo re-polymerisation. The liquefaction performed witha high solvent flow-rate produced a low percentage of oilyield and a high percentage of asphaltene+pre-asphaltene.This might be due to the extraction during liquefactionwhich only dissolved, due to the less time, for the solventto fully interact with the coal radical. In other words, lesshydrogen was transferred during the liquefaction process,thus resulting in higher molecular weight compounds,which in this case is asphaltene and pre-asphaltene. Hence,more extensive formation of extractable materials wasobtained at a lower solvent flow-rate.Liquefaction Using Two-stage Solvent Flow ReactorSystemThe two-stage reactor was introduced to increase thepercentage of oil yield. The second reactor was filled withNiSiO 2 as the liquid tar passed through after the extractionprocess in the first reactor. In order to maintain the conditionfor both reactors, several parameters in the second reactorsuch as temperature, pressure and solvent flow-rate werefixed at 420ºC, 4 MPa and 1 ml/min, respectively. Theeffects of Ni loading on the product distribution yieldsare shown in Figure 6. From Figure 6, it was clear that theoil+gas yield increased as the percentage of Ni loadingincreased. Higher molecular weight compounds such as preasphalteneand asphaltene decreased and were convertedinto lower molecular weights compound, that is, oil+gas.The second reactor did not affect the total conversion,thus, there was no difference in the total conversion of thecatalyst.Liquefaction was also conducted isothermally for aspecific duration of time. Using the two-stage reactorsystem, the percentage of asphaltene and pre-asphaltenedecreased and this correlated with the increased oil+gasyield. The assumption was that both asphaltene and preasphaltenehave been converted into oil+gas. Generally,with the sufficient amount of hydrogen available, these freeradical species generated from the coal cracking processcombined with hydrogen to yield stable species such asasphaltene, pre-asphaltene and oil. The asphaltene and preasphaltenewould further fragment to smaller molecularweight radical species, and then the hydrogenation processstabilized it to form oil+gas, a light molecular weightproduct.The use of catalyst also increased the oil+gas yield.Both the hydrogenation reaction and hydrocracking ofcoal molecule occurred with the availability of catalyst.12
Conversion (% (% daf) daf)909080807070606050504040303020201010001 31Solvent flow-rate3(ml/min)Solvent flow-rate (ml/min)55TotalTotal Oil+gasOil+gas PASPASASFigure 5. Effect of solvent flow-rate on product distribution yields.Conversion (% (% daf) daf)909080807070606050504040303020201010001 35 71 3 Ni loading (wt%) 5 7Ni loading (wt%)Figure 6. Effect of Ni loading on product distribution yields.TotalTotal Oil+gasOil+gas PASPASAS
- Page 1 and 2: ContentsASM Sc. J.Volume 7(1), 2013
- Page 3 and 4: INTERNATIONAL ADVISORY BOARDAhmed Z
- Page 5: The Academy of SciencesMalaysia (AS
- Page 8 and 9: NEWS FOCUSBio-Jet Fuel — Challeng
- Page 10 and 11: ASM Science Journal, Volume 7(1), 2
- Page 12 and 13: NitrogengasAcetylene gasFume hoodGa
- Page 14 and 15: ASM Science Journal, Volume 7(1), 2
- Page 16 and 17: ASM Science Journal, Volume 7(1), 2
- Page 18 and 19: ControllerN 2N 2ValveValvePreheater
- Page 22 and 23: ASM Science Journal, Volume 7(1), 2
- Page 24 and 25: ASM Science Journal, Volume 7(1), 2
- Page 26 and 27: ASM Sci. J., 7(1), 18-22Electron-ph
- Page 28 and 29: v I= v MthASM Science Journal, Volu
- Page 30 and 31: ASM Science Journal, Volume 7(1), 2
- Page 32 and 33: ASM Science Journal, Volume 7(1), 2
- Page 34 and 35: ASM Science Journal, Volume 7(1), 2
- Page 36 and 37: ASM Science Journal, Volume 7(1), 2
- Page 38 and 39: ASM Science Journal, Volume 7(1), 2
- Page 40 and 41: 4.2 × 10 -5Magnetic energy (Em) Ma
- Page 42 and 43: 2.0 × 10 -5Inductance (L)Magnetic
- Page 44 and 45: ASM Science Journal, Volume 7(1), 2
- Page 46 and 47: addition, examination of the freque
- Page 48 and 49: equipped with a computer image anal
- Page 50 and 51: Storage modulus (Pa)1.80E+101.60E+1
- Page 52 and 53: (a)(b)(c)Figure 6. Micrographs: (a)
- Page 54 and 55: 0 20 40 60 80 100 120 140 160 180 2
- Page 56 and 57: 0.00 20 40 60 80 100 120 140 160180
- Page 58 and 59: 0 20 40 60 80 100 120 140 160Temper
- Page 60 and 61: 2.0100.00 20 40 60 80 100 120 140 1
- Page 62 and 63: 3.02.53.02.02.5CB10TSSAlbipoxTimber
- Page 64 and 65: Figure 18. SEM micrographs of the f
- Page 66 and 67: Crawford, E & Lesser, AJ 1998, ‘T
- Page 68 and 69: ASM Science Journal, Volume 7(1), 2
- Page 70 and 71:
ASM Science Journal, Volume 7(1), 2
- Page 72 and 73:
ASM Science Journal, Volume 7(1), 2
- Page 74 and 75:
ASM Science Journal, Volume 7(1), 2
- Page 76 and 77:
ASM Science Journal, Volume 7(1), 2
- Page 78 and 79:
ASM Science Journal, Volume 7(1), 2
- Page 80 and 81:
ASM Science Journal, Volume 7(1), 2
- Page 82 and 83:
Climate Change — Environment andI
- Page 84 and 85:
ASM Science Journal, Volume 7(1), 2
- Page 86 and 87:
ASM Science Journal, Volume 7(1), 2
- Page 88 and 89:
ASM Science Journal, Volume 7(1), 2
- Page 90 and 91:
Announcements!!!!!!!!!!!!!!!!!!!!!!
- Page 93 and 94:
ASM PublicationsMosquitoes and Mosq
- Page 95 and 96:
ASM PublicationsEnhancing Animal Pr
- Page 97 and 98:
ASM PublicationsThe Red Jungle Fowl
- Page 99 and 100:
Vol. 3, No. 1, June : 1823-6782ASM
- Page 101 and 102:
ASM PublicationsIn Pursuit of Excel
- Page 103 and 104:
ASM PublicationsASM Lecture SeriesW
- Page 105 and 106:
ASM PublicationsA Nobel Trip to Lin
- Page 107 and 108:
Vol. 6, No. 2, December 2012 • IS
- Page 109 and 110:
About the JournalMission StatementT
- Page 111:
ASM SCIENCE JOURNAL(ASM Sc. J.)ORDE
- Page 114:
NEWS FOCUSBio-Jet Fuel — Challeng