Investors' Clinic Presentation - The Nigerian Stock Exchange
Investors' Clinic Presentation - The Nigerian Stock Exchange
Investors' Clinic Presentation - The Nigerian Stock Exchange

You also want an ePaper? Increase the reach of your titles
YUMPU automatically turns print PDFs into web optimized ePapers that Google loves.
NSE Investor <strong>Clinic</strong>February 2012Michael Anekwe, Head of Nigeria Coverage, MorganStanley Private Wealth Management
Topics to be covered Investing in a Bearish Market– Example DiscretionaryPortfolios Optimizing Asset Allocation
Session OneInvesting in a Bearish Market
IntroductionStay the course, cautious for nowMarket OutlookAlthough most risky assets have gained ground over the past few months we remain cautious withour investment outlook. Economic data suggests Europe is already in recession and the US couldhead the same way within the next year. Despite challenges in the developed markets, we expectcontinued growth in emerging markets driven by domestic demand.Developed market equities started 2012 strongly with investors reacting to positive news byadding risk to their portfolios aggressively. This positive sentiment could continue to driveequities higher but we are not at the start of a multi-year bull market yet. We believe it makessense to have exposure to equities but investors should be ready to turn more bearish if risks to therally increase.Recent macroeconomic data suggests the US economy is continuing to improve slightly and thatthe risks of a recession owing to economic problems in other parts of the world have recededfurther. Europe’s economy is likely to contract in 2012 owing to the deleveraging process in itsbanking system and further austerity measures throughout the region.4
Introduction (cont’d)Stay the course, cautious for nowInvestment Opportunities Given current valuations we believe investment grade credit will outperform cash andgovernment bonds in 2012 A combination of tight fiscal and loose monetary policy is likely to keep the euro underpressureCommodity-related currencies are best placed to benefit from the pro-growth polices in Chinaand the US We continue to overweight global macro strategies because owing to the uncertain outlook forthe global economy With interest rates at low levels around the world, we favour stocks of companies with bothlarge share buybacks and high dividend yields5
Introduction (cont’d)Stay the course, cautious for nowCommodities and InflationInflation is less of a concern with commodity prices falling700600ThomsonReuters/Jefferies CRB Raw Industrials IndexThomsonReuters/Jefferies CRB Futures Price Index5004003002001001992 1994 1996 1998 2000 2002 2004 2006 2008 20106
Asset Class LevelCatalystsBearish Factors Progress on Eurozone integration is too slow Deleveraging is disorderly Fiscal tightening slows US growth EM impaired by deleveraging China policy constraintBullish Factors ECB more aggressive at supporting sovereigns and banksCoordinated global monetary policyIncreased stimulus and long- term budget cuts in USSource: Source: Morgan Stanley Research7
Asset Class Level (cont’d)Our Current Asset AllocationSafe havens would have less vulnerability in the likely challenging economic periodahead. At a high level, our asset allocation models overweight global cash, marketweightglobal bonds and alternative/absolute return investments, and underweightglobal equities.Source: Global Investment Committee, Morgan Stanley Smith Barney8
Asset Class Level (cont’d)Global Investment CommitteeOverweightsShort Duration: given risk of recession, we favour this safe-haven asset classInvestment-Grade Corporates: these offer relative safety and quality; above average yield spreadsvs. TreasuriesU.S. Equities: favour large-cap stocks and growth stocksEmerging Markets Equities: favourable fundamental factors, government balance sheets and policy supportManaged Futures: perform well during extended periods of adverse equity market conditionsUnderweightsGovernment Bonds: historical low yields and elevated perceived risks of defaultHigh Yield Bonds: yield spreads likely to widen in recessionary environmentsDeveloped Market ex US Equities: underweight Europe and Japan; market-weight Canada and Asia PacificREITs: due to lack of relative-valuation advantage and a recessionary backdropCommodities: demand will be negatively affected in a recessionary environmentInflation-Linked Securities: see better valuation elsewhere as peak in inflation expectations has likely passedSource: Global Investment Committee, Morgan Stanley Smith Barney9
Investment Ideas for 2012Maintain our current defensive positioningLong APxJ Over DM EquitiesSimilar PE to DM, but a higher ROE.Face less of a European deleveraging drag than CEE and LatAm.Long ‘Dividend Aristocrats’High-quality dividend paying stocks should outperform in 2012.<strong>The</strong>se tend to generate higher returns.Long ‘Global Gorillas’Capture growth from large DM companies with outsized EM exposures.Long Short-Duration BondsFavourable yields relative to cash.Reduces volatility in diversified portfolios during turbulent periods.Invest in WaterDeclining supply and rising demand.Economic constraint due to freshwater scarcity, most acute in Africaand western Asia.Long Investment Grade CreditBetter withstand slowdown in economic growth due to strongerbalance sheets.Historically wide yield advantage.Long Managed FuturesLow correlations of returns with stocks, bonds, and other alternativeasset classes.Performed well during adverse equity markets.Long Real RatesInflation expectations should rise on back of QE3.Real rates likely to fall more in the back end.Long USD, JPY / Short EURUS$ and JP¥ should show strength on slower global growth anddeleveraging stress.Bearish EUR outlook on more dovish ECB.Short CommoditiesSlowing global growth will weigh on industrial metals, whereasincreased supply and falling demand will weigh on oil.Source: Global Investment Committee, Morgan Stanley Smith Barney; Morgan Stanley Research10
Investment Ideas for 2012 (cont’d)Maintain our current defensive positioningTactical Asset Class ViewsAsset Class View (3–6 Months View)JPYUSDGoldUS CreditEurope CreditEM EquitiesGerman BundsEM ratesEM CurrenciesUS TreasuriesEurope EquitiesEM CreditOilCommoditiesUS EquitiesJapan EquitiesEURGBP–+11
STEP US Dividend PortfolioPortfolio Characteristics Objective: Aim for long term capital appreciation through a portfolio of high quality US equities with above average yield. Seek to outperform the S&P 500Index on a total and risk adjusted basis over a 12-month time horizon. Benchmark: S&P 500 Index Holdings: Max 20 Tracking Error: 5.2%* Annual Turnover: expected range 30–50% (2011: 48%)Standard Deviation:Portfolio: 15.6%; Benchmark: 18.7%*Example Holdings Microsoft Chevron General Electric McDonalds PfizerKey Features Investment in high quality US equities with above average yield <strong>The</strong> current average 3.4% yield is 54% above the S&P 500 yield of 2.2%* Relative outperformance in 2011 of 4.4% (net of fees) with lower volatility <strong>The</strong> strategy may benefit from increased demand for high yielding equities as populations age and fixed income yields remain near to historic lowsSource: Morgan Stanley, as of 31 December 2011 *3 year rolling statistics as of 31 December 2011 *Asof 31 December 2011. This information does not constitute an offer, solution or recommendation for thepurchase or sale of securities or other financial instruments, nor does the information constitute adviceor an expression of our view as to whether a particular security or financial instrument is appropriate.Past performance is no guide to future performance and the value of investments and income from themcan fall as well as rise. Clients of PWM and Global Investment Solutions only have a relationship withMorgan Stanley Private Wealth Management Limited. <strong>The</strong> investment managers to this portfolio will bethe London based GIS managers, Chris Wood and Wouter Volckaert12
STEP US Dividend Portfolio (cont’d)Process<strong>The</strong> Strategic Equity Portfolio Team starts with three primary “hard andfast” criteria:Overweight and Equal-weight rated stocks by Morgan Stanley &Co. Inc’s North American Research teamA minimum dividend yield equal to the lesser of the S&P 500 Indexaverage dividend yield or the stock’s average Sector yield S&P Investment grade credit rating of “A” or better for theportfolio, with a maximum of 10% of the portfolio below investmentgradeIn addition, other key metrics are considered such as dividend history, freecash flow and EPS (Earnings Per Share) growth, ROE (Return on Equity),stable financial leverage, operating efficiency and the company’s overallability to grow the dividend over time. <strong>The</strong> team then monitors the STEPmodel portfolios on an ongoing basisAnalyst Level“Triple Screen”• Close Interaction with industry analysts• 750+ equities under coverage• High correlation with Analysts Top PicksStrategy Level• Directional consistency with strategy / macro themes and sectorpreferences• Use quantitative screens and MS & Co.’s Modelware• Technical analysisStep Team• Final decision making responsibility• Real-World analysis (with MS & Co.’s perspective)Source: Morgan Stanley, as of 31 December 2011 *3 year rolling statistics as of 31 December 2011 *Asof 31 December 2011. This information does not constitute an offer, solution or recommendation for thepurchase or sale of securities or other financial instruments, nor does the information constitute adviceor an expression of our view as to whether a particular security or financial instrument is appropriate.Past performance is no guide to future performance and the value of investments and income from themcan fall as well as rise. Clients of PWM and Global Investment Solutions only have a relationship withMorgan Stanley Private Wealth Management Limited. <strong>The</strong> investment managers to this portfolio will bethe London based GIS managers, Chris Wood and Wouter Volckaert13
STEP US Dividend Portfolio (cont’d)Performance2011201020092008200720062005*S.I (Ann.)S.I (Cum.)Portfolio (Net)6.5%12.5%18.4%-33.1%10.4%20.5%1.1%3.9%27.7%Benchmark2.1%15.1%26.5%-37.0%5.5%15.8%3.3%2.6%18.1%Relative4.4%-2.6%-8.0%3.9%4.9%4.7%-2.2%1.2%9.6%Inception: 11 July 2005Index: S&P 500 Index in USDSource: Morgan Stanley, as of 31 December 2011 *3 year rolling statistics as of 31 December 2011 *Asof 31 December 2011. This information does not constitute an offer, solution or recommendation for thepurchase or sale of securities or other financial instruments, nor does the information constitute adviceor an expression of our view as to whether a particular security or financial instrument is appropriate.Past performance is no guide to future performance and the value of investments and income from themcan fall as well as rise. Clients of PWM and Global Investment Solutions only have a relationship withMorgan Stanley Private Wealth Management Limited. <strong>The</strong> investment managers to this portfolio will bethe London based GIS managers, Chris Wood and Wouter Volckaert14
GIS Fixed Income PortfoliosInvestment Philosophy and ApproachEach fixed income portfolio is a bespoke creation, tailored to suit each clientspreferences and circumstances. Nonetheless the investment process remainsthe same, with a focus on generating alpha whilst maintaining disciplinedrisk management.<strong>The</strong> investment managers seek to maximise performance through takingpositions that play their views across a variety of sources, including:interest rate/credit carry/duration/swap spreads/curve shapeTo capture alpha through disciplined fundamental analysis on credit names,the team: Analyse company and peer group balance sheets Evaluate a range of internal and external researchDiscuss companies with rating agencies, trading desks and the internalequity teamEach portfolio is professionallytailored to meet a variety of clientspecific considerations, including Return / Yield targets Fund inclusion guidelines Exposure toEmerging Markets Allocation to High Yield Duration targets Credit rating limits Strategic asset allocation Issuer concentration Sector restrictions Currency & Hedging15
GIS Fixed Income Portfolios (cont’d)PerformanceAs each portfolio is bespoke, the strategy performancecomposites are shown below for reference, which provide anindication of the investment ability of Marco Antonioli(highlighted in blue), who has been managing these strategiessince 2009.Total Return Strategy €YTD20112010200920082007*20062005S.I (Ann.)S.I (Cum.)Portfolio2.2%0.7%1.4%7.3%-2.4%0.4%1.8%7.4%Benchmark0.2%1.8%0.6%1.3%4.5%0.3%2.1%8.7%Relative2.0%-1.1%0.8%6.1%-6.9%0.1%-0.3%-1.3%*Inception: 30 November 2007Index: ML Euro Government BondsCorporate Bond €YTD2011201020092008200720062005S.I (Ann.)S.I (Cum.)Portfolio2.9%0.2%7.0%22.7%-19.1%-4.9%2.5%1.7%2.0%20.5%Benchmark2.6%1.9%4.8%14.6%3.2%0.3%1.0%2.9%4.2%48.1%Relative0.3%-1.7%2.2%8.1%-15.9%-5.4%1.4%-1.2%-2.2%-27.7%*Inception: 30 June 2002Index: ML EMU Corporate 1-10 YrYTD data until 31 January 2012. Past performance is no guide to future performance and the value ofinvestments and income from them can fall as well as rise Allocations mentioned are for illustrativepurposes only and does not necessarily represent the current portfolio. <strong>The</strong> allocation is subject tochange without notice.16
<strong>The</strong> ‘Onyx’ Strategy (New for 2012)Strategy Characteristics Specifically selected 9 leading indicators believed to collectively provide the greater predictabilityin forecasting the direction of equity market movements 5 economic and 4 market indicators, undergo monthly dynamic analysis Sophisticated qualitative indicator assessments combined with rigorous proprietaryquantitative modelling Offers combination of long-term equity growth with protective management to mitigate downside High accuracy of downside protection during back-testing Tested by specialists from London School of Economics17
<strong>The</strong> ‘Onyx’ Strategy (New for 2012) (cont’d)ObjectiveAims for capital appreciation during rising equity market and capital protection during falling equity market<strong>The</strong> Onyx strategy aggressively tactically allocates between cash and equities according to the outcome of specially selected leadingindicatorsPrinciples and Methodology<strong>The</strong> major driver of equity market returns is the corporate earnings cycle, which is heavily influenced by the global economiccycleWe analysed 32 leading indicators against global equity market returns, from which we identified 9 indicators<strong>The</strong> strategy provides a forecast in the last week of the month for equity market returns in the following month. A negativestrategy result implies “hold cash”, a positive strategy result implies “hold equities”ETFsOnyx StrategyVarious ways to implement the strategyGIS US value equitiesRegional & Sector equitiesThird-party managed fundGIS active global equitiesSource: Morgan Stanley Private Wealth Management<strong>The</strong> allocation above is for illustrative purposes only and does not necessarily represent the currentportfolio. <strong>The</strong> allocation is subject to change without notice. <strong>The</strong> information above does not constitutean offer, solicitation or recommendation for the purchase or sale of securities or other financialinstruments nor does the information constitute advice or an expression of our view as to whether aparticular security or financial instrument is appropriate. Past performance is no guide to futureperformance and the value of investments and income from them can fall as well as rise.18
Session TwoOptimizing Asset Allocation
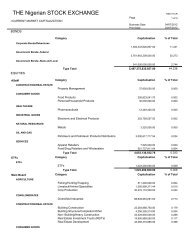
Asset Class Performance<strong>The</strong> Case for Diversification<strong>The</strong> performance of each asset class varies according to a number of factors rangingfrom central bank policy, to investor sentiment. An asset class when held alone, canpotentially create a very volatile portfolio.By combining a financial security with other financial instruments that do not performin exactly the same way (have a correlation of less than one), investors can seek toreduce the risk associated with a given return.Source: Global Investment Solutions, BloombergNotes1. Commodities: DJ UBS Commodities Index2. Real Estate: GPR 250 Property Index3. Bonds: JP Morgan 1-10 Global Government Bond Index4. Hedge Funds: HFRI Fund of Funds Index5. Equities: MSCI World Index20
Asset Class Performance (cont’d)2001 2002 2003 2004 2005 2006 2007 2008 2009 2010 20116%Bonds26%Commodities31%Real Estate33%Real Estate22%Real Estate37%Real Estate16%Commodities9%Bonds29%Real Estate19%Real Estate6%Bonds4%Real Estate9%Bonds25%Equities11%Equities21%Commodities16%Equities10%Hedge Funds-20%Hedge Funds26%Equities17%Commodities-5%Hedge Funds3%Hedge Funds1%Real Estate24%Commodities9%Commodities16%Equities10%Hedge Funds5%Equities-36%Commodities19%Commodities10%Equities-6%Equities-14%Equities1%Hedge Funds12%Hedge Funds6%Hedge Funds8%Hedge Funds2%Commodities3%Bonds-39%Equities12%Hedge Funds6%Hedge Funds-7%Real Estate-20%Commodities-24%Equities4%Bonds6%Bonds4%Bonds1%Bonds-12%Real Estate-45%Real Estate5.9%Bonds5.2%Bonds-12%CommoditiesSource: Global Investment Solutions, BloombergNotes1. Commodities: DJ UBS Commodities Index2. Real Estate: GPR 250 Property Index3. Bonds: JP Morgan 1-10 Global Government Bond Index4. Hedge Funds: HFRI Fund of Funds Index5. Equities: MSCI World Index21
Asset Class Performance (cont’d)DiversificationManaging risk is at the heart of the multi asset class portfolio construction process within GIS.Each portfolio is diversified across Asset class Region Sector Investment managers (through internal asset class specialists and best in class external funds)Global Investment Solutions (GIS) is the investment management arm of Morgan Stanley SmithBarney (MSSB) Consulting Group. GIS provides best in class actively managed solutions withstrong performance.Source: Global Investment Solutions, BloombergNotes1. Commodities: DJ UBS Commodities Index2. Real Estate: GPR 250 Property Index3. Bonds: JP Morgan 1-10 Global Government Bond Index4. Hedge Funds: HFRI Fund of Funds Index5. Equities: MSCI World Index22
Long Term Asset AllocationStrategic Asset Allocation (SAA)Strategic Asset Allocation is the process of identifying the optimal mix of broad asset classes to suitthe client’s long-term investment objectivesVariation of Portfolio Returns by FactorAsset AllocationSecurity SelectionMarket TimingOther Factors91%5%2%2%Source: Brinson, Beebower and Hood – Determinants of Portfolio Performance, FAJ 199523
Long Term Asset Allocation (cont’d)Strategic Asset Allocation In a multi-asset class portfolio, 91% of the variation is due to the asset allocation Strategic asset allocation is therefore a essential part of the investment process. AtMorgan Stanley, we devote significant resources towards establishing, andcontinually revising our strategic asset allocation processSource: Brinson, Beebower and Hood – Determinants of Portfolio Performance, FAJ 199524
<strong>The</strong> Efficient FrontierDiversification<strong>The</strong> efficient frontier is the collection of asset allocations that offer the highest possible return for each level of risk.<strong>The</strong> closer a portfolio lies to the efficient frontier, the better optimized it is given the level of risk.We offer a range of portfolios (represented by diamond shapes on the graph) to suit different investor risk appetites<strong>The</strong> Efficient Frontier with Multi Asset Class Portfolios(Expected Mean Returns)9.0%8.0%7.0%Inefficient PortfoliosUnobtainable PortfoliosEfficient FrontierConservativeConservative PlusModerateModerate PlusAggressive6.0%-1.0% -3.0% -4.0% -6.6% -7.0% -10.0% -9.2% -13.0%-12.2% -16.0% -16.6% -19.0%(Expected Tail Loss)Source: Morgan Stanley PWMAll data for illustrative purposes only. Past performance is no guide to future performance and thevalue of investments and income from them can fall as well as rise. Allocations mentioned are forillustrative purposes only and do not necessarily represent your current portfolio or our current views.Allocations are subject to change without notice. <strong>The</strong> modeling does not, and cannot, provide aprojection of future returns which are of course unknown. However, we believe it provides a valuablebasis for constructing a strategic allocation.25
MSSB Strategic Asset Allocation Modelling<strong>The</strong> Proprietary MSSB Strategic Asset Allocation SystemProvides the optimal investment allocation over the long runUses a ‘building block’ approach to estimated asset class returns, for example real cash rates are primarilydetermined by three components: I. Productivity growth II. Labour-force growth III. Long-term inflationHas been reviewed by academics from the Financial Markets Group of the London School of Economics, anddeemed “robust, coherent and intuitive”Contains a number of innovations on Markowitz portfolio theory, for example the model reflects non normalreturn distributions, meaning that it accounts for the reality that tail events (e.g. a 20%+ fall in the equitymarket in a month) occur once in every 13 years, not once in540 yearsSource: Morgan Stanley Smith Barney, Morgan Stanley ResearchFor further details on the SAA tool please contact your investment advisor.All data for illustrative purposes only. Past performance is no guide to future performance and thevalue of investments and income from them can fall as well as rise. Allocations mentioned are forillustrative purposes only and do not necessarily represent your current portfolio or our current views.Allocations are subject to change without notice. <strong>The</strong> modeling does not, and cannot, provide aprojection of future returns which are of course unknown. However, we believe it provides a valuablebasis for constructing a strategic allocation.Figures shown are gross figures of fees and taxes26
MSSB Strategic Asset Allocation Modelling (cont’d)Proprietary SAA Risk/Return Simulation [SAMPLE]Portfolio AllocationsPortfolio Annual StatisticsAssetClassesCash:USDDevelopedMarketWorld: GovtBonds (All)DevelopedMarketWorld: CorpBonds (All)DevelopedMarketWorld: HighYield CorpBonds (All)EmergingMarketWorld: GovtBonds (All)DevelopedMarketWorld:EquitiesEmergingMarketWorld:EquitiesCommodities:AllHedgeFund ofFundsMeanExpectedReturnExpectedRisk(ETL)ExpectedValue-at-RiskExpectedVolatilityDownside Risk Table(Time Horizon – 12 months)Upside PotentialReturn Table(Time Horizon – 12 months)MeanExpectedReturns4.2%5.4%7.0%7.6%8.6%8.9%11.6%7.9%8.7%ExpectedVolatility0.7%3.4%5.0%11.2%14.0%15.9%27.4%16.8%6.4%7%User Defined PorfoliosConservative10.0%40.0%21.0%2.0%0.0%16.0%2.0%2.0%7.0%6.6%-3.1%-1.5%4.3%0.0%0.2%5.5%87.1%64.7%38.3%ConservativePlus5.0%30.0%16.0%3.0%2.0%26.0%4.0%2.0%12.0%7.4%-6.8%-4.7%6.3%0.2%2.2%12.0%85.5%69.8%51.4%Moderate5.0%21.0%12.0%4.0%3.0%33.0%5.0%2.0%15.0%7.8%-9.6%-7.0%7.8%0.8%4.8%15.9%83.6%70.6%55.5%ModeratePlus5.0%13.0%8.0%5.0%4.0%42.0%6.0%2.0%15.0%8.1%-12.9%-9.8%9.5%2.4%7.9%19.7%81.2%70.1%57.6%Aggressive5.0%2.0%3.0%6.0%4.0%54.0%8.0%3.0%15.0%8.6%-17.6%-13.7%11.8%5.4%12.1%23.7%78.7%69.7%59.5%Source: Morgan Stanley Smith Barney, Morgan Stanley ResearchFor further details on the SAA tool please contact your investment advisor.All data for illustrative purposes only. Past performance is no guide to future performance and thevalue of investments and income from them can fall as well as rise. Allocations mentioned are forillustrative purposes only and do not necessarily represent your current portfolio or our current views.Allocations are subject to change without notice. <strong>The</strong> modeling does not, and cannot, provide aprojection of future returns which are of course unknown. However, we believe it provides a valuablebasis for constructing a strategic allocation.Figures shown are gross figures of fees and taxes27
MSSB Tactical Asset AllocationCapitalise on short-term market opportunities and manage short term risks.<strong>The</strong> MSSB Global Investment Committee (GIC) meets regularly to survey the economic landscape to update their base-case outlook,discuss the bullish and bearish scenarios thereof and to develop a tactical investment strategy to capitalize on short-term opportunities.Quantitative ModelsProprietary models help to identifyinvestment opportunities given a currentmarket environmentRisk ToolsA detailed set of risk metrics are used tomonitor and manage portfolio riskChart PackA comprehensive library of macroeconomicindicators and market data for all assetclassesMacroDedicated team that reviews the economicand political environment in the context offinancial markets from a top downperspectiveProprietaryfinancialmodelsResearchAccess to leading capital markets researchhouses such as, BCA Research, ISIStrategy, and Independent StrategyMicroDedicated equity and fixed income teamsthat focus on security selection by reviewingcompanies and economies from a bottomup prospectiveIn-houseintellectualcapitalGlobalInvestmentCommitteeExternalmarketintelligenceMarket IntelligenceRegular dialogue with external managersfrom our approved platform provides marketintelligence from specialised managersInvestment AdvisorsIndependent StrategistsParticipation of the Client’s seniorInvestment Advisors who provide feedbackfrom the Clients perspectiveLeverage the Morgan Stanley franchise byseeking the opinions of external,independent strategistsMacro Outlook28
Moderate Multi-Asset Class PortfolioExample As at 31 January 2011Four Layers of Alpha CaptureI. Strategic Asset AllocationTo maximise long run risk adjusted returnsII. Tactical Asset AllocationSeize near term opportunities as they present themselvesIII.ImplementationSelect the most compelling investment mechanism (e.g. the GIC is overweight high yield, inGIS this is implemented through a US high yield fund, given the strength of US companybalance sheets)IV.Portfolio ManagementActive management of the segregated component combined with selecting satellites tomaximise returns29
Moderate Multi-Asset Class Portfolio (cont’d)Example As at 31 January 2011Strategic Asset Allocation BenchmarkComposition by asset class (%)34152335Strategic Asset Allocation BenchmarkComposition by asset class (%)33181535526339Developed EquitiesEM EquitiesInvestment GradeHigh YieldEM BondsHedge FundsCommoditiesCashSource: Morgan Stanley Private Wealth ManagementDeveloped EquitiesEM EquitiesInvestment GradeHigh YieldEM BondsHedge FundsCommoditiesCashSource: Morgan Stanley Private Wealth ManagementImplementationInvestments in the multi-asset class portfolio (%)EquityCashTotalSegregated EquityAberdeen Global – World EquityMorgan Stanley Global BrandsOverstone Global EquitiesCapital Allocation ModelAberdeen Global EMDB Emerging MktsGlobal Emerging OpportunitiesFixed IncomeSegregated BondsCorporate BondsBluebay Inv Grade FundsNeuberger High Yield FundTotal Return BondsPictet EM Debt FundsHedge FundsLyxor FocusBluecrest All BlueACL FundBrevan Howard GlobalBrevan Howard MacroDB Systematic Alpha FundCommoditiesInvestment VehicleIn-house managedThird-party activeThird-party activeThird-party activeIn-house managedThird-party passiveThird-party passiveIn-house managedIn-house managedIn-house managedThird-party activeThird-party activeIn-house managedThird-party activeThird-party activeThird-party activeThird-party activeThird-party activeThird-party activeThird-party activeNote: <strong>The</strong> data are for illustrative purposes only. Past performance is no guide to future performance andthe value of investments and income from them can fall as well as rise. <strong>The</strong> allocation above is forillustrative purposes only and does not necessarily represent the current portfolio,. <strong>The</strong> information abovedoes not constitute an offer, solicitation or recommendation for the purchase or sale of securities or otherfinancial instruments nor does the information constitute advice or an expression of our view as to whether aparticular security or financial instrument is appropriate.Weights35.013.05.04.03.03.51.52.52.541.020.07.04.03.04.03.018.04.65.02.33.61.51.01.05.0100.030
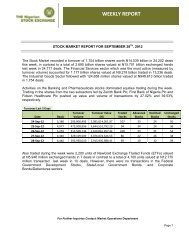
Global Investment Committee Asset Class BarometerKey GIC Investment ViewsInvestment grade corporate bonds <strong>The</strong>se bonds add yield to the portfolio but at the same timeoffer relative safety and quality. In the US, yield spreadsversus Treasuries are above averageEmerging market equity Fundamental factors such as economic and earnings growth,government balance sheets and indebtedness remain relativelyfavourable. Policymakers’ focus is shifting away fromcontaining inflation and toward supporting growth, and thereis more scope for policy support than in the developedeconomies.US equities We have a defensive stance that favours large-cap stocks at thecapitalization level and growth stocks at the style level.Relative-valuation readings also support this positioningEquitiesEmerging marketsEuropeJapanUKNorth AmericaAsia Pacific (ex Japan)Fixed incomeGovernment bondsInvestment grade creditHigh yield bondsEmerging market debtCommoditiesHedge fundsCashYenEuroSterlingDollars-3 -2 -1 0 1 2 3underweight neutral overweightSource: Morgan StanleyNotes:1. Currency positions in individual portfolios may vary depending on base currencyThis information is for illustrative purposes only. Past performance is no guide to future performanceand the value of investments and income from them can fall as well as rise. Allocation above is forillustrative purposes only and does not necessarily represent the current portfolio. Allocation is subjectto change without notice.31
Important InformationThis presentation was prepared by Morgan Stanley Private Wealth Management Limited, authorised and regulated in the United Kingdom by the FinancialServices Authority. This presentation is a marketing communication. It does not constitute investment research and is not a product of Morgan Stanley and /or itsaffiliates’ Research Department(s) and you should not regard it as a research report. This presentation has been prepared solely for informational purposes and isnot an offer to buy or sell any financial instrument or participate in any trading strategy.Past performance is no guide to future performance and the value of investments and income from them can fall as well as rise. You should note that highperformance targets can only be achieved through accepting higher risk to the portfolio. Where included, benchmark and index data included in this document areprovided for illustrative purposes only. <strong>The</strong> portfolio and / or services mentioned do not formally track any such benchmarks or indices and no representation ismade as to relative future performance or tracking deviation. You should note that investing in financial instruments carries with it the possibility of losses andthat a focus on above market returns exposes the portfolio to above average risk. Performance aspirations are not guaranteed and are subject to market conditions.High yield investments can produce income at the expense of capital growth or the capital value of the investment. High volatility investments may be subject tosudden and large falls in value, and there could be a large loss on realisation which could be equal to the amount invested. <strong>The</strong> investments discussed in this reportmay not be suitable for all investors. In some circumstances it may be difficult for the investor to sell or realise such investments or obtain reliable informationabout their value. Where an investment is denominated in a currency other than the investor’s currency, changes in rates of exchange may have an adverse effecton the value, price of, or income derived from the investment. This presentation should not be construed as legal, tax or accounting advice. Morgan StanleyPrivate Wealth Management Limited does not provide legal, tax or accounting advice – investors should consult their own tax advisers for guidance on suchmatters. <strong>The</strong> bases and levels of taxation can change, and are subject to individual client's circumstances. Terms and definitions in this presentation will beexplained by your Investment Advisor. Should you wish to receive further explanation or clarification on any of the content of this presentation please do nothesitate to ask your Investment Advisor.Morgan Stanley Private Wealth Management Limited and/or its affiliates and employees have or may have a long or short position or holding in the securities,options on securities, or other related investments of issuers mentioned herein and may be providing or may have provided significant advice or investmentservices, including investment banking services, for any company mentioned in this report.32