The Relationship Between Employee Engagement and Human ...
The Relationship Between Employee Engagement and Human ...
The Relationship Between Employee Engagement and Human ...
- No tags were found...

You also want an ePaper? Increase the reach of your titles
YUMPU automatically turns print PDFs into web optimized ePapers that Google loves.
<strong>The</strong> <strong>Relationship</strong> <strong>Between</strong> <strong>Employee</strong> <strong>Engagement</strong><strong>and</strong> <strong>Human</strong> Capital PerformanceSeptember 2012
Executive Summary<strong>The</strong> <strong>Relationship</strong> <strong>Between</strong> <strong>Employee</strong> <strong>Engagement</strong> <strong>and</strong> <strong>Human</strong> Capital Performance report summarizesfindings from the Ontario Hospital Association’s (OHA) exploratory research project conducted in 2012with three pilot hospitals (one acute teaching, one community, <strong>and</strong> one small). <strong>The</strong> project examinesthe relationship between employee engagement <strong>and</strong> several key human resources (HR) metrics. This isthe first attempt by the OHA to link data from two of its major HR data initiatives: the OHA-NRC Picker<strong>Employee</strong> Experience Survey <strong>and</strong> the OHA-PricewaterhouseCoopers (PwC) Saratoga HR BenchmarkingSurvey.<strong>The</strong> project developed a methodology for accurately comparing <strong>Employee</strong> Experience Surveyengagement data with human capital metrics from hospital administrative data at the department level.It also identified three HR metrics – the full-time resignation rate, average sick days per full-timeemployee, <strong>and</strong> management span of control – which do appear to be related to employee engagementlevels at the department level. This research will provide HR leaders with support to build the case formaking investments in employee engagement. It appears that there are real costs associated withhigher absence <strong>and</strong> resignation rates when engagement is low.<strong>The</strong> project revealed four major technical issues organizations must consider when conducting this typeof analysis. First, survey response rates affect the representativeness of the survey findings. Lowerresponse rates introduce greater potential for non-response bias. A reasonable response target is 50%across the organization. However, for this research it is important that response rates in each of thedepartments are above average as well. In one of the pilot hospitals, the department response ratesvaried between 27% <strong>and</strong> 70%. Second, the accuracy of administrative data <strong>and</strong> the HR metrics used inthe analysis is also a key consideration. Missing or inconsistently collected HR administrative dataaffects the accuracy of HR metrics, <strong>and</strong> therefore the accuracy of comparisons with engagement scores.<strong>The</strong> third technical issue is that small departments may not have sufficient numbers of survey responsesto report engagement scores or HR metrics. Finally, the impact of extraneous factors must beconsidered. <strong>The</strong>re are a number of factors not measured in an engagement survey or in other HRmetrics that could introduce errors. For example, one hospital was undergoing major organizationalchange during the survey period. Also, metrics such as turnover are influenced by a range of personal<strong>and</strong> contextual factors.<strong>The</strong> methodology employed for this project was to a) compare HR metrics for departments with thehighest <strong>and</strong> lowest engagement scores, b)combine all department engagement scores <strong>and</strong> associatedHR metrics, <strong>and</strong> c)calculate correlation coefficients for relevant indicators. [Correlation coefficientsrange from +/- 1 to 0. Zero means there is no relationship between the two variables, <strong>and</strong> 1 means thereis a perfect correlation so that if one increases (or decreases, if the correlation is negative), so does theother.] Observations from the pilot hospital with the most reportable results include:• A correlation of -.45 between engagement scores <strong>and</strong> sick days for full-time employees, which ismoderately strong <strong>and</strong> in the predicted direction (higher engagement is associated with fewer<strong>Engagement</strong> - <strong>Human</strong> Capital Performance Report2
sick days).• A correlation of -.03 between engagement scores <strong>and</strong> resignation rates for full-time employees,which is very weak <strong>and</strong> not in the predicted direction.• A correlation of -.68 between engagement scores <strong>and</strong> span of control for full-time employees,which is fairly strong (lower spans of control are related with higher engagement).<strong>Engagement</strong> - <strong>Human</strong> Capital Performance Report3
IntroductionAdvancing the analysis <strong>and</strong> application of human resources (HR) data across the healthcare system, isone of the key priorities identified in the Ontario Hospital Association’s (OHA) Provincial Health <strong>Human</strong>Resources Work Plan 2011-2013. Better HR data collection <strong>and</strong> analysis allows organizations todetermine their priorities for improvement <strong>and</strong> investment <strong>and</strong> to conduct strategic planning. To meetthis objective, the OHA engaged in a research project with three pilot hospitals examining the linkagesbetween employee engagement <strong>and</strong> key organizational metrics.For each of the pilot hospitals, the departmental results of the OHA-NRC Picker <strong>Employee</strong> ExperienceSurvey were analyzed against key HR metrics (sick leave, retention, <strong>and</strong> management span of control)from the PricewaterhouseCoopers (PwC) Saratoga HR Benchmarking Survey results – also at thedepartment level – to better underst<strong>and</strong> the impact of engagement on human capital performance.<strong>The</strong> following report is written by Dr. Graham Lowe, a workplace consultant who has advised the OHAon its <strong>Employee</strong> <strong>and</strong> Physician Experience Surveys <strong>and</strong> Quality Healthcare Workplace Awards. <strong>The</strong> OHAprovided data collection <strong>and</strong> analysis support as well as significant input into the development of thereport. <strong>The</strong> report outlines the findings of this exploratory look at the relationships between employeeengagement <strong>and</strong> key organizational metrics.With a methodology for accurately comparing <strong>Employee</strong> Experience Survey engagement data withhuman capital metrics from hospital administrative data, we have been able to identify three humancapital metrics that appear to be related to employee engagement levels at the department level. Wealso uncovered a number of technical issues that, in future, hospitals can take into account whencollecting <strong>and</strong> comparing <strong>Employee</strong> Experience Survey <strong>and</strong> HR data.ObjectivesThis report examines the relationship between employee engagement <strong>and</strong> several key human capitalmetrics. It is the OHA’s first attempt to systematically link data from two of its major human resourceinitiatives: the OHA-NRC Picker <strong>Employee</strong> Experience Survey (EES) <strong>and</strong> the PwC Saratoga HRBenchmarking (HRB) project. Each data source previously has been used independently to compareengagement levels <strong>and</strong> human capital performance across hospitals. This project is more ambitious,combining these two data sources <strong>and</strong> focusing on departments within hospitals as the unit of analysis.<strong>The</strong> project had four objectives:1. Develop a methodology for accurately comparing EES data with human capital metrics fromadministrative data.2. Identify <strong>and</strong> address technical issues related to departmental-level comparisons withinhospitals.3. Determine which human capital performance metrics are most related to employeeengagement.4. Offer recommendations for future actions that will help OHA members make better use ofcombined EES data <strong>and</strong> HR metrics for purposes of performance improvement.Three hospitals participated in the project: Hospital A, Hospital B, <strong>and</strong> Hospital C. <strong>The</strong>se hospitals<strong>Engagement</strong> - <strong>Human</strong> Capital Performance Report4
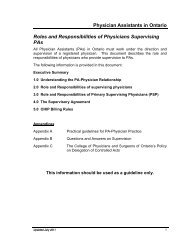
epresent three different OHA peer groups: small hospitals, teaching hospitals, <strong>and</strong> communityhospitals.<strong>The</strong> analysis presented in this report is guided by the OHA’s Quality Healthcare Workplace Model (seeFigure 1), which outlines how health system performance depends on a capable workforce in healthy<strong>and</strong> productive workplaces. <strong>The</strong> OHA’s model suggests that the quality of the work environment for staff<strong>and</strong> physicians is a key determinant of a high‐performing healthcare organization. By integrating healthyworkplace, human resource, quality <strong>and</strong> patient safety goals within a performance focused framework,the model offers a useful guide to research <strong>and</strong> practice.At the centre of the model is employee (<strong>and</strong> physician) engagement. <strong>The</strong> focus of the OHA’s employeeengagement <strong>and</strong> human capital performance project centred on the relationship between employeeengagement levels <strong>and</strong> several organizational outcomes related to human capital performance, asmeasured by administrative data.This research also follows the Healthcare Quarterly article, “How <strong>Employee</strong> <strong>Engagement</strong> Matters forHospital Performance”, which explores the OHA-NRC Picker <strong>Employee</strong> Experience Survey data (furtherdiscussed in the next section) <strong>and</strong> also written by Graham Lowe.Figure 1: Ontario Hospital Association Quality Healthcare Workplace Model<strong>Engagement</strong> - <strong>Human</strong> Capital Performance Report5
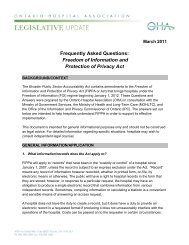
Figure 2: Work stress by level of engagementMost days at work are not at all/somewhat stressfulMost days at work are quite/extremely stressfulTotal59.1%40.9%Level of <strong>Engagement</strong>HighMediumLow36.9%65.6%75.6%63.1%34.4%24.4%0% 20% 40% 60% 80% 100%n = 10,123 (across the 16 hospitals)Work stressWe focus on two individual outcomes that measure different aspects of quality of work life. <strong>The</strong> first isself-reported work stress, using a measure adapted from Statistics Canada’s Canadian CommunityHealth Survey. Respondents were asked: “In the past 12 months, would you say that most days at workwere…not at all stressful, somewhat stressful, quite stressful, or extremely stressful?” Figure 2, above,combines these four response categories into two, showing that 4 in 10 of all respondents experiencemost days as quite or extremely stressful. However, those employees in the high-engagement group arefar less likely to experience stress (24%), especially compared with their coworkers who have lowengagement. Indeed, more than 6 out of 10 low-engagement employees experience most workdays asquite or extremely stressful.<strong>The</strong>se data sets do not reveal how engagement may contribute to stress. However, given theconsiderable costs that stress can impose on employers in the form of increased absenteeism <strong>and</strong>presenteeism, experts in the field could further probe such a relationship.<strong>Engagement</strong> - <strong>Human</strong> Capital Performance Report8
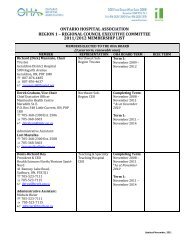
Injuries <strong>and</strong> illnessAn equally important concern for both employees <strong>and</strong> employers is the prevention of injuries <strong>and</strong>illnesses that may result from caring for patients. Figure 3 selects one indicator from the EES – havingbeen injured or felt unwell as a result of moving or h<strong>and</strong>ling patients in the past 12 months – to see ifbasic safety <strong>and</strong> health outcomes are in any way related to engagement. Examining this involved a lookonly at EES respondents who have frequent direct interaction or contact with patients, because thisgroup of employees is the most exposed to health <strong>and</strong> safety risks associated with patient care.Figure 3: Been injured or felt unwell as a result of moving <strong>and</strong>h<strong>and</strong>ling patients or clients in past 12 months by level of engagement*YesNoTotal35.8%64.2%Level of <strong>Engagement</strong>HighMediumLow19.8%32.3%50.1%80.2%67.7%49.9%0% 20% 40% 60% 80% 100%* Figure includes only respondents with frequent direct patient contact (n=5,000).Figure 3 documents that 64% of those providing direct patient care experienced no injuries or illness asa result of moving or h<strong>and</strong>ling patients. Interestingly, this increases to 80% among survey respondentswho are highly engaged, <strong>and</strong> falls to 50% among those with low levels of engagement. One could arguethat such injuries or illness contribute to disengagement. Yet by the same token, it also is possible thatthe same working conditions that contribute to engagement also enable patient care providers to bettermanage the risks inherent in that role.RetentionRegarding organizational outcomes, we focus on one of the major human resource goals of anyhealthcare organization: to retain competent staff (for a more detailed analysis of how engagement isrelated to a wider range of organizational outcomes, see the author’s recent Healthcare Quarterlyarticle 8 ). Turnover is costly. It is widely assumed that more engaged employees – who are more satisfied<strong>Engagement</strong> - <strong>Human</strong> Capital Performance Report9
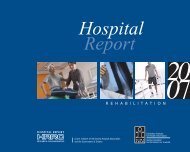
with their jobs <strong>and</strong> the organization – will stay <strong>and</strong> continue contributing. As Figure 4 shows, this iscertainly the case among the healthcare employees who responded to the EES. Indeed, there arestriking differences in intentions to look for a new job between the low <strong>and</strong> high engagement groups.While close to half of disengaged employees will be job-hunting in the next 12 months, only 1 in 10 ofthose who are highly engaged will be looking for a new job with a different employer. In other words,90% of highly engaged employees plan to stay with the organization, at least for the near future.Figure 4: Retention by level of engagementUnlikely to look for a new job in next 12 monthsLikely to look for a new job in next 12 monthsTotal73.6%26.4%Level of <strong>Engagement</strong>HighMediumLow52.1%79.7%89.7%47.9%20.3%10.3%0% 20% 40% 60% 80% 100%n = 10,053 (across the 16 hospitals)<strong>Engagement</strong> - <strong>Human</strong> Capital Performance Report10
Department-level variations in engagement, retention <strong>and</strong> job stressIs there evidence of department-level variations in engagement, retention <strong>and</strong> job stress? To answerthis question, we conducted more in-depth analysis using EES data from Hospital A, Hospital B, <strong>and</strong>Hospital C.Looking first at Hospital C, three of the four departments with the lowest engagement scores also havebetween 40% <strong>and</strong> 51% of their employees planning to look for another job in the next 12 months. All ofthe departments in which 75% or more of respondents plan to stay with Hospital C have average orabove-average numbers in the high-engagement group. <strong>The</strong>re also is a relationship betweenengagement <strong>and</strong> self-reported work stress. For example, three departments with high engagementscores have low work stress levels. And two of the lowest-scoring engagement departments have highstress levels.At Hospital B we find a broadly similar pattern. Three of the four departments with the lowestengagement scores have between 31% <strong>and</strong> 55% of their employees planning to look for another job inthe next 12 months. All but one of the departments in which 75% or more of survey respondents plan tostay with the hospital have higher than average engagement scores. <strong>The</strong> department with the highestengagement score also has the highest percentage of employees planning to stay (88%). In terms of jobstress, employees in the two departments with the highest engagement levels report the lowest stresslevels. And employees in the four departments with the lowest engagement scores have above-averagelevels of job stress.<strong>The</strong>re are some interesting exceptions to note. For example, at Hospital B, one department has onlyslightly above-average employee engagement, yet survey respondents from that department are amongthe most likely to be planning to stay with the hospital – perhaps a function of the local labour marketfor that area of work. Another department at Hospital B has a below-average engagement score, yet iswell above-average in terms of intention to remain with the hospital <strong>and</strong> has low job stress. Clearly,there likely are unique dynamics influencing these findings.In sum, this analysis provides Hospital C <strong>and</strong> Hospital B with an important diagnostic that can be used toplan interventions: departments that have the lowest engagement also tend to be more stressful placesto work <strong>and</strong> are at risk of high turnover. Similar analysis was attempted for Hospital A. However, this is asmall hospital with only 106 EES respondents. Consequently, three of the four departments have toofew respondents to permit an accurate analysis of the relationship between engagement <strong>and</strong>,respectively, retention <strong>and</strong> job stress. Furthermore, if we look just at each of these three measures –engagement, retention, <strong>and</strong> job stress – we do not find statistically significant differences bydepartment. Such a finding may not be surprising given that Hospital A rates very positively on all thesemeasures compared to the other 15 hospitals exampled in the author’s 2012 Healthcare Quarterlyarticle.<strong>Engagement</strong> - <strong>Human</strong> Capital Performance Report11
Factors affecting the comparability of survey <strong>and</strong> administrative dataAn employee survey provides a single data source that is ideally suited to examining the relationshipbetween engagement <strong>and</strong> HR-relevant outcomes. That is because the same people who answered theengagement questions also answered questions about stress <strong>and</strong> retention, so we are able to comparetheir responses on all these indicators. However, when different data sources are combined at thedepartment level, the analysis becomes more complicated. Four technical issues are relevant toconsider: survey response rates; accuracy of administrative data; small departments; <strong>and</strong> the impact ofextraneous factors.Survey response ratesSurvey response rates affect the representativeness of the survey findings. Lower response rates to thesurvey introduce greater potential for non-response bias. Low response rates result in inaccuratecomparisons with HR (administrative) databases, which typically include all employees. So the accuracyof the comparisons suffers. If the survey response rate is low, it is possible that HR metrics such asturnover, absenteeism, or overtime could include only or mostly employees who did not respond to theEES. In some departments, this is the majority of employees. Also possible is that the most engagedemployees are disproportionally represented among survey respondents.As recommended in the OHA’s Action Planning Guide for the <strong>Employee</strong> Experience Survey*, a reasonabletarget response rate is 50% across the organization. 9 Ideally, all departments should be achieving similarresponse rates, but as we can see from Appendices 1 <strong>and</strong> 2, there are often wide variations indepartment response rates. A low response rate for a department makes it difficult to accuratelyexamine the relationship between engagement (based on EES data) <strong>and</strong> human capital metrics.EES response rates for the three hospitals are close to, or exceeding, the OHA target of 50% (see top rowin Figure 5, below). This would be good news if our only purpose was to analyze the EES data.*For hospitals utilizing the OHA-NRC Picker <strong>Employee</strong> Experience Survey, contact OHA or NRC Picker to obtain a copy of theguide.Figure 5: EES response rate calculations for Hospital A, Hospital B, <strong>and</strong> Hospital CHospitalAHospitalBHospitalCTotal survey response rate as reported by NRC-Picker for the 16 59.7% 47.7% 48.7%hospital study reported in Healthcare QuarterlyTotal EES respondents identified as employed in the departmentsexamined for this project, using department headcount asdenominator (Total EES responses / Total headcount)73.3% 27.7% 48.2%<strong>Engagement</strong> - <strong>Human</strong> Capital Performance Report12
Because we are interested in linking EES <strong>and</strong> administrative data at the department level, werecalculated response rates using the more granular HR data for those departments included in the EES-HR metrics comparisons. Full details of these calculations are provided for Hospital A <strong>and</strong> Hospital C inAppendices 1 <strong>and</strong> 2 respectively. <strong>The</strong> second row in Figure 5, above, summarizes the response ratesusing total EES responses divided by total headcount from administrative data, for departments onwhich there is complete data available. Hospital C’s two response rate calculations are similar. <strong>The</strong>discrepancy in the two Hospital B response rates is because Hospital B used a sample for the EES, notthe entire population of employees. When total headcount is used as the denominator, this reduces theEES response rate. Hospital A’s response rate discrepancy results from the fact that there are fewer“headcounts” in the administrative data than the total number of EES questionnaires sent out (150versus 187) – a discrepancy for which there is no ready explanation.It also is instructive to briefly observe the departmental variations in response rates presented forHospitals A <strong>and</strong> C in Appendices 1 <strong>and</strong> 2. For example, among the 16 departments at Hospital Cresponse rates vary between 27% <strong>and</strong> 70%. As already noted, this may affect the accuracy ofdepartment—level analysis of EES data in departments with below-average response rates.Accuracy of administrative dataA further consideration is the accuracy of the HR metrics. While testing the quality of the HRadministrative data collected by hospitals is beyond the scope of this project, it is possible that errors orinconsistencies in data coding, data entry, or other features of the HRIS being used could impact thequality of the HR metrics overall. That said, that is a st<strong>and</strong>ard concern <strong>and</strong> potential problem with anyadministrative data.Missing or inconsistently collected data for HR metrics affects the accuracy of the indicator, <strong>and</strong>therefore the accuracy of any comparisons with engagement scores. In this regard, the issues identifiedin the three hospitals participating in this project are illustrative of more general challenges faced whencombining administrative <strong>and</strong> survey data. One common example is how hospitals record sicknessabsences for part-time employees, which varies due to differences in employment policies. For example,some part-time employees are not paid for sick time, so it is not officially recorded. <strong>The</strong> upshot of thesecomplications is that we excluded part-time employees from our analysis.Linking EES <strong>and</strong> administrative data at the department level requires hospitals to provide NRC-Pickereach employee’s department affiliation, otherwise it is not possible to calculate engagement scores forall respondents in a department. For example, Hospital B was unable to provide department designationfor 638 respondents. Furthermore, Hospital B was not able to provide HR data on resignations or sickleave for three of the departments due to organizational change. <strong>The</strong>se three departments account for176 survey respondents, substantially reducing the potential for cross-department comparisons with theEES data.<strong>Engagement</strong> - <strong>Human</strong> Capital Performance Report13
Small departmentsSmall departments may not have sufficient numbers of survey responses to report engagement scores.Furthermore, the frequency of some of the HR metrics decreases with department size. This makes itdifficult to statistically measure the relationship between infrequent events, such as turnover, <strong>and</strong>engagement. It also is difficult to discern statistical patterns if a number of departments have few or noincidents recorded, such as turnover. To address this issue for Hospital C we reduced the number ofdepartments from 33 to 16. This was accomplished by combining some smaller departments, whichfrom an HR perspective may be quite different. Each of the combined departments has a minimum of 30EES respondents, 20 of whom are full-time employees. So while this aggregation is necessary for dataanalysis, it may confound results by combining units with quite different employee experiences <strong>and</strong> HRmetrics.<strong>The</strong> impact of extraneous factorsExtraneous factors – those things which aren’t measured by HR metrics or the EES – can affect survey<strong>and</strong> administrative data, possibly introducing additional sources of error. For example, if majororganizational change is occurring during the time that an employee survey is in the field, respondents’answers likely will be influenced by the immediate changes they are experiencing. Organizationalrestructuring can affect administrative data by altering the reporting units. Such change also may affectstaffing numbers <strong>and</strong> turnover in certain departments, <strong>and</strong> not others.<strong>The</strong>se issues are visible in the Hospital B data. <strong>The</strong> hospital underwent leadership restructuring in Aprilof the calendar year for which administrative data are reported <strong>and</strong> in which the EES was conducted.This is the reason for missing HR data for some of the departments. It also explains why someadministrative reporting units for the HR metrics do not correspond with the departmental groupingused in the EES.Other extraneous factors can influence the comparison of EES data <strong>and</strong> certain HR metrics. <strong>The</strong>comparison is based on the assumption that both sets of data measure features of the workplace <strong>and</strong>workforce that management can influence. However, at least one of the HR metrics – turnover (i.e.,voluntary resignations) – is affected by a range of personal <strong>and</strong> contextual factors. <strong>The</strong>se include anemployee’s family situation, local labour market conditions, the overall dem<strong>and</strong> for their particular skills,their relationships with team members, <strong>and</strong> their social networks (an important source of informationabout new employment opportunities). <strong>The</strong>se factors account for a person’s degree of “jobembeddedness,” which can have an even greater influence on their decision to quit than their level ofengagement. 10 For example, the local labour market for healthcare professionals will provide far moreopportunities in large cities than in small communities. Hospitals need to consider these local contextualfactors when interpreting their turnover data in specific departments or specialties.<strong>Engagement</strong> - <strong>Human</strong> Capital Performance Report14
<strong>The</strong> comparative methodology<strong>The</strong> EES data for all three hospitals were good quality <strong>and</strong>, on their own, suitable for detailed analysis.However, attempting to link EES <strong>and</strong> HR data introduces new complexities as noted above. Wherepossible, we have attempted to address these challenges. Because this project is a first-time attempt tolink EES <strong>and</strong> HR administrative data, we took it one step at a time, beginning with an investigation of HRmetrics in departments scoring highest <strong>and</strong> lowest on the <strong>Engagement</strong> Scale. Note that for all of the EES– HR metrics comparisons reported below, we use the mean <strong>Engagement</strong> Scores at the departmentlevel for the six-item engagement scale described earlier (the scale scores range from 5 to 29). HospitalC is used to illustrate this because of the three hospitals in the study, both its EES <strong>and</strong> HR data are bestsuited for comparative analysis.Examining Hospital C departments with the lowest <strong>and</strong> highest engagementA preliminary step in our analysis of Hospital C was to compare the highest <strong>and</strong> lowest engagementdepartments, based on rank-ordered mean engagement scores (see Figure 6). For hospital leaders, thisis a useful exercise because it focuses attention on high-performing units that can provide lessons forthe rest of the organization, <strong>and</strong> at the same time identifies those units requiring remedial interventionsto improve a range of outcomes for both staff <strong>and</strong> patients/clients.Figure 6: Hospital C department categories by engagement scoresDEPARTMENT CATEGORIESMean<strong>Engagement</strong>ScorenStd.DeviationDepartment 9 23.3729 59 4.49865Department 5 23.3505 97 3.82438Department 15 22.3582 67 4.39939Department 14 22.0678 59 4.88440Department 10 21.9140 93 4.73345Department 12 21.8542 48 4.19721Department 4 21.7451 51 5.00337Department 1 21.4624 93 4.91351Department 6 21.3654 52 5.19815Total 21.1916 1117 5.01834Department 3 20.8718 78 4.13210Department 8 20.5741 54 6.12635Department 16 20.1032 126 4.85276Department 7 19.9000 50 5.36903Department 11 19.5529 85 5.23383Department 13 19.0513 39 5.95575Department 2 18.8615 65 5.31765<strong>Engagement</strong> - <strong>Human</strong> Capital Performance Report15
Figure 7: Comparison of Hospital C departments with lowest <strong>and</strong> highest engagement scores on keyHR metrics4 lowest engagement departments 4 highest engagementdepartmentsMETRICSManagement Span ofControlVoluntary SeparationRate (%)Full-time resignationrate (%)Learning &Development Hoursper FTEFull-Time Sick Days per<strong>Employee</strong> (Headcount)Department 2Department 7Department 11Department 13Low engagement means28.00 42.67 48.75 141.00 65.10 6.90 14.14 58.50 36.25 28.957.14 3.91 5.13 4.26 5.11 8.28 2.02 2.56 4.14 4.256.59 4.05 0 0 5.32 7.38 0 3.28 5.81 5.644.47 3.85 3.58 7.12 4.76 4.09 1.75 0.62 5.13 2.908.16 15.34 14.19 12.59 12.57 4.77 6.97 11.25 12.27 8.81Part-Time Sick Days 0.92 2.60 4.31 3.15 2.75 1.65 7.16 1.29 4.78 3.72per <strong>Employee</strong>(Headcount)Overtime Hours per 12.34 71.34 0.00 1.99 21.42 11.17 0.00 37.01 36.67 21.21FTEENGAGEMENT SCORES 18.86 19.9 19.55 19.05 19.34 23.35 23.37 22.07 22.36 22.79(out of 29)*Percent High30.8 30 30.6 30.8 30.5 64.6 61 54.2 53.7 58.4<strong>Engagement</strong> (%)Total EES Response 66 52 88 43 62 101 63 62 73 75NumbersTotal Headcount 140 128 195 141 151 145 99 117 145 127EES Response Rate (%) 47.1 40.6 45.1 30.5 40.9 69.7 63.6 53.0 50.3 59.2Department 5Department 9Department 14Department 15High engagement means*An explanation of the 29-point engagement score is provided on page 7.<strong>Engagement</strong> - <strong>Human</strong> Capital Performance Report16
<strong>The</strong>re are several important observations we can make about the Hospital C departments included inthe lowest <strong>and</strong> highest engagement groupings (see Figure 7):• <strong>The</strong> four lowest engagement departments are clinical units providing direct patient care. Thiscontrasts with the four high-engagement departments, three of which provide internal supportservices.• Response rates in the low-engagement group are considerably lower than in the highengagementgroup (41% vs. 59%).• Average head count is slightly higher among low-engagement departments.• <strong>The</strong> differences in engagement scores between the low <strong>and</strong> high engagement groups are clearlyreflected in the percentage of EES participants in each group that can be classified as “highengagement”,using the three-category engagement typology. In fact, the high-engagementdepartments have almost double the proportion of highly engaged employees (58% vs. 31%).Looking specifically at HR metrics, these high <strong>and</strong> low engagement department groupings are furtherdistinguished in the following ways:• <strong>The</strong> management span of control in the low-engagement group is more than double that in thehigh-engagement group (65 direct reports vs. 29).• Because we have maximized the differences between the low <strong>and</strong> high engagement comparisongroups, we can clearly see that high-engagement departments have lower voluntary separation<strong>and</strong> full-time employee absenteeism. This is an important finding, given the impact turnover <strong>and</strong>absenteeism has on costs <strong>and</strong> performance.• Learning <strong>and</strong> development hours per full-time equivalent (FTE) are slightly higher in the lowengagementgroup (4.7 vs. 2.9). This suggests that learning <strong>and</strong> development opportunities haveno direct positive association with employee engagement. This may reflect the occupationalcomposition of some of the low-engagement departments (e.g., nurses whose professionrequires them to take regular training may nonetheless be disengaged).• Sick days among part-time employees are slightly higher in the high-engagement group (3.7 vs.2.7). <strong>The</strong>re is no obvious explanation for this, other than the possibility that high-engagementdepartments more accurately track part-time employees’ absences.• Overtime does not vary across these two groups. One reason for this is the wide variation withinthe departments’ overtime use, reflecting the unique functions performed by differentdepartments (e.g., food services can plan its work load in advance, resulting in zero use ofovertime, while emergency relies on overtime to meet the unpredictable dem<strong>and</strong>s on itsservices).Hospitals considering conducting similar research should contact their employee engagementsurvey vendor to see if this type of analysis is possible. For tips on making linkages betweenemployee engagement <strong>and</strong> key organizational metrics, please refer to Appendix 3.<strong>Engagement</strong> - <strong>Human</strong> Capital Performance Report17
ConclusionThis project is an exploratory look at the relationships between employee engagement <strong>and</strong> keyorganizational metrics. It has been a learning experience for all involved. We have succeeded indeveloping a methodology for accurately comparing EES engagement data with human capital metricsfrom hospital administrative data. We also have been able to identify three human capital metrics – thefull-time employee resignation rate, average sick days per full-time employee, <strong>and</strong> management span ofcontrol – which appear to be related to employee engagement levels at the department level. Thisresearch will provide HR leaders with support to build the case for making investments in employeeengagement. It appears that there are real costs associated with higher absence <strong>and</strong> resignation rateswhen engagement is low. And finally, we also have been able to identify a number of technical issuesthat, in future, hospitals can take into account when collecting <strong>and</strong> comparing EES <strong>and</strong> HR data.Moving forward, the following points should be considered by hospitals as they plan further steps tobetter underst<strong>and</strong>ing how employee engagement is connected to organizational performance:• Hospitals can more fully mine their EES data to underst<strong>and</strong> the relationship betweenengagement levels at the department level <strong>and</strong> important individual <strong>and</strong> organizationaloutcomes. This work could be usefully done on a collaborative basis, involving several hospitals.As the EES is repeated in future years, it also will be important to track how engagement <strong>and</strong>these other outcomes change over time.• Small hospitals could benefit from a common, collaborative approach to linking EES <strong>and</strong> HRmetrics. <strong>The</strong> OHA’s small hospital peer group would be the ideal network for pursuing this work.It may require the use of common metrics <strong>and</strong> department classifications, issues that wouldneed to be worked out by participating hospitals. Also useful would be benchmarking thesemetrics across the small hospitals, which would complement department-level comparisons.• While hospitals require a range of HR metrics, for the purposes of underst<strong>and</strong>ing the influencesof engagement it is clear that focusing on full-time employees <strong>and</strong> just a few metrics –particularly resignations <strong>and</strong> sick days – may be the most useful approach.• <strong>The</strong> somewhat unexpected finding regarding management span of control requires furtherdiscussion since it could be an organizational influence on engagement levels that can beaddressed by hospital workforce plans.• Hospitals should take into account the influence of contextual factors on HR metrics <strong>and</strong>engagement levels. Organizational change can influence these measures <strong>and</strong> complicatereporting data at the department level. Ideally, linkage analysis should be conducted during arelatively stable period. Another contextual factor is the local labour market, which may affectresignation rates. So this too needs to be considered when interpreting correlations betweenengagement <strong>and</strong> retention.• Hospitals should strive for high department-level response rates with a minimum target of 50%.• Hospitals attempting the data linkage presented in this report must coordinate the dates ofwhen the EES is conducted with HR metrics. Ideally, survey data should be collected toward theend of the 12 month reporting period for the HR metrics.<strong>Engagement</strong> - <strong>Human</strong> Capital Performance Report20
Hospitals considering conducting similar research should contact their employee engagement surveyvendor to see if this type of analysis is possible. For tips on making linkages between employeeengagement <strong>and</strong> key organizational metrics, please refer to Appendix 3.<strong>Engagement</strong> - <strong>Human</strong> Capital Performance Report21
Acknowledgments<strong>The</strong> OHA appreciates the support <strong>and</strong> participation of the many individuals involved in this project.Specifically, the OHA wishes to thank:• <strong>The</strong> three pilot hospitals for their involvement <strong>and</strong> for sharing their results• Graham Lowe, PhD, for authoring the report• NRC Picker Canada (NRCC) for providing the OHA-NRC Picker <strong>Employee</strong> Experience Surveyresults for each of the three pilot sites• <strong>The</strong> OHA team members <strong>and</strong> leadership who provided data analysis <strong>and</strong> input toward thereport’s developmentDefinitions from the OHA-PwC Saratoga HR Benchmarking Survey were utilized for collecting the HRmetrics.<strong>Engagement</strong> - <strong>Human</strong> Capital Performance Report22
Appendix 2: Hospital C, engagement scores <strong>and</strong> selected HR metrics for full-time employees, by departmentDepartment 1Department 2Department 3Department 4Department 5Department 6JANUARY 1, 2011 TODECEMBER 31, 2011Full-Time Equivalent(FTE) Count 189.25 112.65 113.84 86.82 135.13 119.68 94.44 101.24 72.99 100.14 143.1 66.44 110.12 76.83 115.32 246.86Full-Time Headcount 126 91 72 62 122 100 74 79 31 84 106 50 64 61 86 188Full-Time Resignations 1 6 0 1 9 7 3 0 1 2 5 4Full-Time ResignationRate (%) 0.79 6.59 0.00 1.61 7.38 7.00 4.05 0.00 1.19 3.28 5.81 2.13Full-Time <strong>Employee</strong> SickDays 1115 743 977 721 582 1167 1135 673 216 612 1504 538 806 686 1055 2919Full-Time Sick Days per<strong>Employee</strong> (Headcount) 8.85 8.16 13.57 11.63 4.77 11.67 15.34 8.52 6.97 7.29 14.19 10.76 12.59 11.25 12.27 15.53Management Span ofControl 34.71 28.00 61.67 50.50 6.90 41.25 42.67 23.00 14.14 33.25 48.75 32.00 141.00 58.50 36.25 44.71ENGAGEMENT SCORES -Full-time EES21.45 18.74 21.29 21.50 23.42 20.89 21.06 21.21 23.79 21.44 20.13 21.65 17.96 21.72 22.19 20.10respondents only1. Full-time EESResponses (includingonly those whoanswered engagement 55 50 45 34 84 38 36 43 24 75 54 34 23 32 48 80items)2. Total EES Responses 108 66 84 55 101 53 52 57 63 95 88 52 43 62 73 1333. Total Headcount 243 140 185 101 145 165 128 115 99 133 195 96 141 117 145 3134. Response Rate based 44.4% 47.1% 45.4% 54.5% 69.7% 32.1% 40.6% 49.6% 63.6% 71.4% 45.1% 54.2% 30.5% 53.0% 50.3% 42.5%on Totals (2 & 3, above)Department 7Department 8Department 9Department 10Department 11Department 12Department 13Department 14Department 15Department 16<strong>Engagement</strong> - <strong>Human</strong> Capital Performance Report 24
Appendix 3: Tips to Making Linkages <strong>Between</strong> <strong>Employee</strong> <strong>Engagement</strong> <strong>and</strong> KeyOrganization Metrics1. Before beginning analysis, consider the following:a. An organization-wide response rate of at least 50% is recommended for the employeeexperience/ engagement survey. <strong>The</strong> survey should be a ‘census’ of all employees, not asample.b. Submit appropriate department identification for your employee population to your surveyprovider. Departments should be no smaller than 25 continuing employees (i.e., employeeswho would be included in your HR metrics) <strong>and</strong> should have a response rate of at least 40%(i.e., 10 completed surveys). Survey results <strong>and</strong> HR metrics for fewer than 10 employeesshould not be reported to protect confidentiality.c. Accurate HR metrics available over the same time period that your employee experience/engagement survey was conducted.2. Determine with your survey vendor the employee engagement measure that you will use in youranalysis (e.g. % high engagement per department or average departmental engagement score).Average scores on multi-item engagement scales is the recommended measure.3. For departments with employee experience/ engagement survey responses less than 10 people,consolidate like departments.4. Obtain employee experience/ engagement survey levels/ scores by department from your surveyvendor.5. Identify the key HR metrics that your organization will use. If the HR metrics are for full-timeemployees (e.g. full-time resignation rate, full-time sick days, etc.), you will need to use engagementscores for full-time survey respondents only.6. Collect data for the key HR metrics identified by department over the same time period that youremployee experience/ engagement survey was conducted. If your survey was conducted in Q1 of acalendar year, use the pervious calendar year’s HR metrics. Otherwise, use HR metrics from the yearin which the survey was conducted.7. Identify three or four departments with the highest engagement levels/ -scores <strong>and</strong> three or fourdepartments with the lowest engagement levels/ scores. Compare survey response rates,engagement scores <strong>and</strong> key HR metrics in each of the two groups. Try to identify lessons to shareacross the organization from the high-engagement departments (how do they achieve this?), <strong>and</strong>work with managers in low-engagement departments to design appropriate interventions toimprove engagement.8. Using all departments which meet above data reporting criteria, calculate correlations betweendepartment-level engagement scores <strong>and</strong> each of the key HR metrics. Combine data in Excelworksheets <strong>and</strong> calculate correlation coefficients for the relevant indicators (In Excel, under theFormulas tab, using the AutoSum menu, there is a list of different mathematical functions available.Select CORREL which returns the correlation coefficient between two data sets.)
9. If the above analysis is helpful to your organization, repeat the analysis with the most important HRmetrics when data from your next employee survey are available. This is how you can track changesover time, looking for positive trends in engagement <strong>and</strong> HR outcomes.1 Lowe, G. (2012). How employee engagement matters for hospital performance. Healthcare Quarterly15 (2):29-39.2 Gibbons, J. & Schutt, R. (2010). A Global Barometer for Measuring <strong>Employee</strong> <strong>Engagement</strong>. ResearchWorking Group Report 1460-09-RR. New York: Conference Board. Also see: Macey, W. H. & Schneider,B. (2008). <strong>The</strong> meaning of employee engagement. Industrial <strong>and</strong> Organizational Psychology, 3–30;Harter, J. K., Hayes, T. L., & Schmidt, F. L. (2002). Business-unit-level relationship between employeesatisfaction, employee engagement, <strong>and</strong> business outcomes: A meta-analysis. Journal of AppliedPsychology, 87, 268–79.3 Lowe, G. (2012). How employee engagement matters for hospital performance. Healthcare Quarterly15 (2):29-39.4 Factor loadings for the 6 items range between .77 <strong>and</strong> .89 (i.e., these items measure the sameunderlying concept – engagement) <strong>and</strong> the Cronbach’s reliability alpha is .92. <strong>The</strong> engagement scale hasa range of 6 to 29 (5 items are measured on 5-point ‘disagree-agree’ scales, <strong>and</strong> one item is measuredusing a 4-point scale), a mean of 20.4, <strong>and</strong> a st<strong>and</strong>ard deviation of 5.2.5 Tested using Cronbach’s alpha, a statistic that has a range of 0 to 1, with closer to 1 being better.6 Lowe, G. (2012). How employee engagement matters for hospital performance. Healthcare Quarterly15 (2):29-39.7 33% (n=3,323) of all respondents are in the low category, 39% (n=3,958) are in the medium <strong>and</strong> 29%(n=2,925) in the high engagement categories.8 Lowe, G. (2012). How employee engagement matters for hospital performance. Healthcare Quarterly15 (2):29-39.9 Ontario Hospital Association. (2010). OHA-NRC Picker <strong>Employee</strong> <strong>and</strong> Physician Experience SurveysAction Planning Guide, 3.10 Holtom, B.C., Mitchell, T.R., Lee, T.W., & Eberly, M.B.. (2008). Turnover <strong>and</strong> Retention Research: AGlance at the Past, a Closer Review of the Present, <strong>and</strong> a Venture into the Future. <strong>The</strong> Academy ofManagement Annals 2 (1):231-274.<strong>Engagement</strong> - <strong>Human</strong> Capital Performance Report26