High Throughput Screening Applications - Enzo Life Sciences
High Throughput Screening Applications - Enzo Life Sciences
High Throughput Screening Applications - Enzo Life Sciences

Create successful ePaper yourself
Turn your PDF publications into a flip-book with our unique Google optimized e-Paper software.
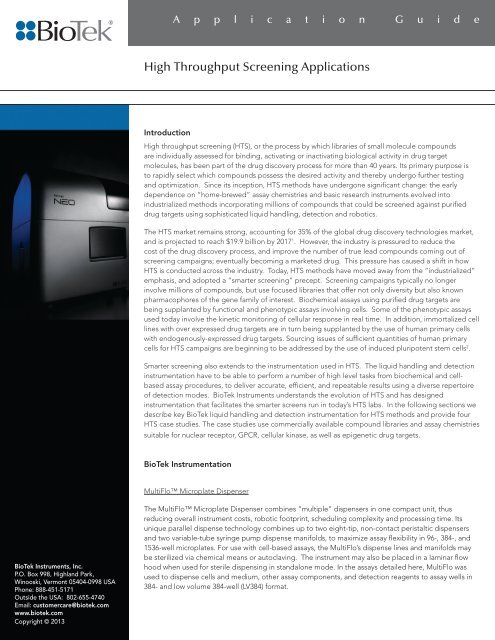
A p p l i c a t i o n G u i d e<strong>High</strong> <strong>Throughput</strong> <strong>Screening</strong> <strong>Applications</strong>Introduction<strong>High</strong> throughput screening (HTS), or the process by which libraries of small molecule compoundsare individually assessed for binding, activating or inactivating biological activity in drug targetmolecules, has been part of the drug discovery process for more than 40 years. Its primary purpose isto rapidly select which compounds possess the desired activity and thereby undergo further testingand optimization. Since its inception, HTS methods have undergone significant change: the earlydependence on “home-brewed” assay chemistries and basic research instruments evolved intoindustrialized methods incorporating millions of compounds that could be screened against purifieddrug targets using sophisticated liquid handling, detection and robotics.The HTS market remains strong, accounting for 35% of the global drug discovery technologies market,and is projected to reach $19.9 billion by 2017 1 . However, the industry is pressured to reduce thecost of the drug discovery process, and improve the number of true lead compounds coming out ofscreening campaigns; eventually becoming a marketed drug. This pressure has caused a shift in howHTS is conducted across the industry. Today, HTS methods have moved away from the “industrialized”emphasis, and adopted a “smarter screening” precept. <strong>Screening</strong> campaigns typically no longerinvolve millions of compounds, but use focused libraries that offer not only diversity but also knownpharmacophores of the gene family of interest. Biochemical assays using purified drug targets arebeing supplanted by functional and phenotypic assays involving cells. Some of the phenotypic assaysused today involve the kinetic monitoring of cellular response in real time. In addition, immortalized celllines with over expressed drug targets are in turn being supplanted by the use of human primary cellswith endogenously-expressed drug targets. Sourcing issues of sufficient quantities of human primarycells for HTS campaigns are beginning to be addressed by the use of induced pluripotent stem cells 2 .Smarter screening also extends to the instrumentation used in HTS. The liquid handling and detectioninstrumentation have to be able to perform a number of high level tasks from biochemical and cellbasedassay procedures, to deliver accurate, efficient, and repeatable results using a diverse repertoireof detection modes. BioTek Instruments understands the evolution of HTS and has designedinstrumentation that facilitates the smarter screens run in today’s HTS labs. In the following sections wedescribe key BioTek liquid handling and detection instrumentation for HTS methods and provide fourHTS case studies. The case studies use commercially available compound libraries and assay chemistriessuitable for nuclear receptor, GPCR, cellular kinase, as well as epigenetic drug targets.BioTek InstrumentationMultiFlo Microplate DispenserBioTek Instruments, Inc.P.O. Box 998, <strong>High</strong>land Park,Winooski, Vermont 05404-0998 USAPhone: 888-451-5171Outside the USA: 802-655-4740Email: customercare@biotek.comwww.biotek.comCopyright © 2013The MultiFlo Microplate Dispenser combines “multiple” dispensers in one compact unit, thusreducing overall instrument costs, robotic footprint, scheduling complexity and processing time. Itsunique parallel dispense technology combines up to two eight-tip, non-contact peristaltic dispensersand two variable-tube syringe pump dispense manifolds, to maximize assay flexibility in 96-, 384-, and1536-well microplates. For use with cell-based assays, the MultiFlo’s dispense lines and manifolds maybe sterilized via chemical means or autoclaving. The instrument may also be placed in a laminar flowhood when used for sterile dispensing in standalone mode. In the assays detailed here, MultiFlo wasused to dispense cells and medium, other assay components, and detection reagents to assay wells in384- and low volume 384-well (LV384) format.
Application GuideEL406 Microplate Washer DispenserThe EL406 Microplate Washer Dispenser combines fast, full microplate washing along with a single eight-tip, noncontactperistaltic dispenser and two variable-tube syringe pump dispense manifolds in one compact unit. Therefore,valuable bench space is saved and, by reducing the expense and maintenance of multiple dedicated instruments,plate scheduling routines are simplified and processes are run faster. The instrument is also ideal for use with cellbasedassays, affording the same sterilization capabilities and small footprint as the MultiFlo. In addition, the aspirationcapabilities of the wash manifold, combined with any of the three dispensers, provide for fast, accurate mediumexchanges and buffer washes. In the assays detailed here, the EL406 was used to dispense cells and medium, aspiratemedium and perform buffer washes, and dispense detection reagents to assay wells in 96- and 384-well formats.Precision Microplate Pipetting SystemThe Precision Microplate Pipetting System combines an 8-channel pipetting head and an 8-channel bulk reagentdispenser in one instrument. The use of sterile, disposable tips, combined with a small footprint, allows Precision to beinserted into biological safety cabinets and used with cell-based assays to perform routine procedures such as dilutionsor serial titrations. For the projects described here, the instrument was used to dilute library compounds, createcompound dose response curves for validation and secondary screening, and transfer all compounds to the 96- or 384-well assay plates.Synergy Multi-Mode Microplate ReadersBioTek’s Synergy Multi-Mode Microplate Reader family is ideally suited to the demands of today’s screeninglaboratories. For applications such as high throughput screening of small molecules, the Synergy NEO is the optimalchoice. For applications such as smaller small molecule library screens or biotherapeutics drug discovery, Synergy H1 isa more cost-effective choice. Both microplate readers use filter cubes and minimal optical components (no fiber optics)to ensure high light transmission and high sensitivity. They also incorporate BioTek’s patented Hybrid Technology,offering the flexible choice of detection with a monochromator system or a filter/dichroic mirror system.Synergy NEOSynergy NEO was designed specifically for ultra high performance detection from microplates required by today’s HTSlabs. For dual emission assays, such as time-resolved fluorescence resonance energy transfer (TR-FRET), the unit uses afilter cube design that allows simultaneous measurement of donor and acceptor fluorescence using dual photomultipliertubes (PMTs), one which is a red-shifted PMT with high sensitivity for far red spectral emissions (Figure 1A). Forluminescence, one side of the lower excitation cube is empty to allow transmission of the luminescent signal. The topemission cube contains a dichroic mirror to channel the signal to the low noise PMT (Figure 1B). Configurations for theTR-FRET and luminescent assays can be accomplished using the same excitation and emission filter cubes. The opticalpath is devoid of components that limit light transmission, such as fiber optic cables, therefore enabling high sensitivity.A. B.Figure 1. Schematic of the dual filter cubes in Synergy NEO used for the simultaneousdetection of donor and acceptor fluorescence from (A) TR-FRET or (B) luminescent assays.2
Application GuideSynergy H1Synergy H1 was designed to provide high sensitivity using a single filter block and PMT. Sequential detection of donorand acceptor fluorescence (Figure 2A) is therefore incorporated for TR-FRET assays, while luminescent signal detectionis as previously described. Similar to the Synergy NEO design, the optical path (Figure 2B) is devoid of components thatlimit light transmission, such as fiber optic cables, therefore enabling high sensitivity.A. B.Figure 2. (A) Exploded schematic of the Synergy H1 filter cube used for sequential detection of donor andacceptor fluorescence. (B) Synergy H1 filter cube. Filters and dichroic mirror removed from position 2 forluminescence detection.Application OverviewThe following biochemical or cell-based screening applications analyze the effect of small molecules on a variety ofcurrent popular drug discovery targets. The 76 compound Screen-Well ® Nuclear Receptor Ligand Library (Cat. No.BML-2802), 502 compound Screen-Well Natural Product Library (Cat. No. BML-2865), or 43 compound Screen-WellEpigenetics Library (Cat. No. BML-2836), donated by <strong>Enzo</strong> <strong>Life</strong> <strong>Sciences</strong>, Inc. (Farmingdale, NY), were used in eachapplication. The assay chemistries incorporated either HTRF ® (Cisbio Bioassays, Codolet, France) or luminescentdetection technologies. Each screen was automated using the liquid handling instruments previously referenced.Quantification of the emitted signals was accomplished using the appropriate Synergy microplate reader.Nuclear ReceptorsNuclear receptors make up a super family of signal mediating, intra-cellular receptors that are found in multiple speciesincluding insects and vertebrates such as humans. Being transcriptional regulators, they function as metabolic ligandactivated transcription factors, regulating a number of functions, including homeostasis, development, and metabolism,and also play a role in diseases such as cancer and diabetes. Additionally, they are shown to bind small moleculesmodified by drug design 3 . This combination makes nuclear receptors popular pharmacological targets. Approximately13% of drugs approved for sale in the United States are nuclear receptors with 15 of these drugs in the top 200prescribed medicines. These top drugs represented $27.5 billion of sales revenue in 2009 4 .3
Application GuideAndrogen Receptor Agonist/Antagonist Studies using a Cell-based Nuclear Receptor AssayThe nuclear receptor assay system from INDIGO Biosciences (State College, PA) utilizes proprietary, non-humanmammalian cells engineered to provide constitutive, high-level expression of a full length, unmodified nuclearreceptor of choice. INDIGO’s reporter cells include the luciferase reporter gene functionally linked to a bonafidenuclear receptor-responsive promoter. The readout from INDIGO’s reporter cells demands the same orchestration ofall intracellular molecular interactions and events that can be expected to occur in vivo. Thus, quantifying changes inluciferase expression in the treated reporter cells provides a sensitive surrogate measure of the changes in nuclearreceptor activity.The principle assay application is screening test samples to quantify the functional activities, either agonist orantagonist, that they may exert against the nuclear receptor. In the project described here, luciferase gene expressionoccurs after ligand-bound Androgen Receptor (AR) undergoes nuclear translocation, DNA binding, recruitment andassembly of the co-activators and accessory factors required to form a functional transcription complex, culminating inexpression of the target gene.A Z’-factor 5 test was performed to validate the automated 384-well AR assay (Figure 3A). 6α-Fluoro-testosterone (6α-FIT)was used as the control compound. Twenty-four replicates of 10 μM or 0 μM compound were used as the positiveand negative control, respectively. Dose response curves were also created using the control agonist, 6α-FIT, and thecontrol antagonist, Bicalutamide (BIC), to validate the ability of the automated assay to generate correct compoundpharmacology (Figure 3B).A.B.Figure 3. A. Z’-factor validation data. Z’-factor values ≥0.5 are indicative of anexcellent assay 5 . B. EC 50value of 71 pM for 6α-FIT, and IC 50value of 96 nM forBIC are equivalent to values previously generated using manual methods.4
Application GuideThe 76 member Screen-Well Nuclear Receptor Ligand Library, containing compounds with known bioactivity to nuclearreceptors, was used to validate the automated 384-well Human Androgen Receptor Assay setup for agonist andantagonist screening purposes (Figure 4).A.B.Figure 4. Human Androgen Receptor Assay Validation Screen. Test compounds were prepared at three intermediateconcentrations, then screened (n=6) at the following concentrations: • 10 µM, • 2.0 µM, and • 0.4 µM for either (A) agonistactivity or (B) antagonist activity. 0.1% DMSO was included as a vehicle control. For the antagonist assay, cells were pretreatedwith 200 pM (~EC 75) 6α-Fluoro-Testosterone as the challenge agonist. Fold activation is defined as [RLU Test Cmpd/RLU Vehicle Control]. Fold inhibition is defined as [RLU Vehicle Control/ RLU Test Cmpd].5
Application GuideThe luminescent signal from library compounds was compared to those generated from vehicle control wells containing0.1% DMSO only, to generate fold activation and fold-inhibition values. Hits were defined as compounds having foldvalues ≥3 for two of the three concentrations tested. Results from known AR agonists and antagonists, such as 6α–Fluoro-Testosterone and mifepristone, demonstrate the utility of the automated 384-well Human Androgen ReceptorAssay to accurately detect AR modulators.The 506 compound Screen-Well Natural Product Library was then screened using the automated 384-well HumanAndrogen Receptor Assay (Figure 5).A.B.Figure 5. Summary of (A) agonist positive and (B) antagonist positive compounds from Screen-Well Natural Product Library.Test compounds were prepared at three intermediate concentrations, then screened (n=1) at the following concentrations:• 1:1,000, • 1:5,000, and • 1:25,000. 0.1% DMSO was included as a vehicle control. Per the antagonist assay, cells werepre-treated with 200 pM (~EC 75) 6α-Fluoro-Testosterone as the challenge agonist.6
Application GuideFollowing tests to remove false agonists and antagonists (data not shown), full dose-response curves were generatedusing the confirmed positive AR agonists and antagonists to determine EC 50or IC 50values (Figure 6).A. B.C. D.Figure 6. Positive (A, B) agonist and (C, D) antagonist compound dose response test from the Screen-WellNuclear Receptor Ligand and Natural Product Libraries. Compound titrations were begun at 10 µM and a 1:1000dilution of the original stock concentration for the agonist and antagonist assays, respectively, with the exceptionsof 6α-Fluoro-Testosterone (Panel B, 33.3 nM) and Solasodine (4.8 µM). EC 50or IC 50values are reported for eachdose response curve.GPCRsG-protein-coupled receptors (GPCRs) are membrane proteins characterized by a seven-transmembrane α-helix structure.They constitute one of the largest and most diverse protein families, whose primary function is to transduce extracellularstimuli into intracellular signals 6 . GPCRs are involved in numerous physiological processes, such as behavior and moodregulation, immune response, autonomic nervous system transmission and tumor growth and metastasis. Abnormalsignal transduction is related to various serious conditions, such as allergy, heart trouble, cancer, high blood pressure,and inflammation 7 . Therefore they are one of the most popular drug targets, accounting for approximately one-third ofall approved drugs 8 . Continued growth in this market is expected, reaching approximately $122 billion by 2018 9 .7
Application GuideGLP-1 Ligand Binding Analysis using a Cell-Based HTRF Tag-lite ® AssayThe Glucagon GLP-1 Receptor Ligand Binding Assay from Cisbio Bioassays uses HEK293 cells transfected with thepSNAP-GLP-1 plasmid (PSNAPGLP1) for twenty-four hours, then subsequently labeled with the small fusion tag, SNAP-Lumi4 Tb (SSNPTBC) (Figure 7). The labeled cells are then frozen in liquid nitrogen and 10% DMSO. In the applicationdescribed here, the cells were dispensed into assay plates along with sequential additions of compounds to be testedand Exendin 4-red (L0030RED), a fluorescent derivative of Exendin 4. When the fluorescent ligand was bound to theGLP-1 receptor, a time-resolved fluorescence resonance energy transfer occurred between the Lumi4 Tb donor boundto the GPCR and the red emitting labeled ligand. Competition between non-labeled compounds and the Exendin 4-red(at 4 nM) diminished energy transfer, thus leading to a decrease in HTRF signal.Figure 7. Tag-lite system comprised of HTRF donor fluorophore labeled GPCR. GPCRwith SNAP-tag was cloned into the cell line, which can then be specifically labeled withdonor fluorophore.A total of 384 compounds from the Screen-Well Natural Product Library plates 1-4 were screened in duplicate.Compounds were pre-diluted 1:250 from the original 100% DMSO stocks and then screened at a final 1:1000 dilution.A no compound (0% inhibition) control was included as well as Exendin-4, the unlabeled GLP-1 receptor agonist, andthe known antagonists GLP-1 (9-36) and Exendin-3 (9-39). When plotting the compound percent inhibition data, adistribution profile similar to that seen in larger compound library primary screens was observed (Figure 8).Figure 8. Natural product compound library screen percent inhibition distribution.8
Application GuideMost compounds exhibited little to no inhibition, while a small percentage demonstrated high positive or negativeinhibition. The donor molecule fluorescent signal assessment may be used to ensure that compounds exhibited truepositive or negative red-labeled agonist binding inhibition (Figure 9). This control, inherent in HTRF technologies,provided a rapid method to remove false hits. An example of a false result is Chelerythrine.Figure 9. Representative GLP-1 receptor and assay inhibition data. Percent inhibition of red labeled Exendin-4agonist and percent of donor molecule fluorescent values from 0% inhibition wells shown for natural product librarycompounds 1-24.This compound exhibited high negative inhibition, but also decreased the donor molecule signal by approximately 50%.In contrast, Exendin-3, Exendin-4 and GLP-1 all showed high positive inhibition with no negative effect on the donormolecule’s fluorescent signal.Dose response curves were generated for those compounds exhibiting positive red agonist binding inhibition with noeffect on the donor molecule fluorescent signal in the primary compound library screen (Figure 10). Eight-point 1:10titration curves were created for each compound, starting with a 10 μM concentration. K idata were calculated from IC 50results using the Cheng-Prusoff equation 10 (Table 1).Figure 10. Dose response curves generated for positive inhibitorcompounds.9Table 1. K ivalues for positive inhibitor compounds.
Application GuideKinasesCellular kinases transfer phosphate groups from donors, such as ATP, to specific substrates through phosphorylation.As such, they play an important role in relaying signals from activated receptors residing at the cell membrane to thecell’s interior through signal transduction. The cellular processes in which they are associated include angiogenesis, cellgrowth, cell migration, and apoptosis. Overexpression of the kinase, or constitutive activity, is also linked to a numberof disease states, including vascular disease, bone disorders, and multiple forms of cancer. Therefore, cellular kinasescontinue to be an important target for drug development. Current global revenues for kinase inhibitors were nearly$29.1 billion in 2011 and are projected to reach nearly $40.3 billion in 2015 13 .Quantification of Endogenous Cellular Kinase Activity using a Cell-based HTRF ® Protein Kinase AssayThe HTRF cellular kinase assays from Cisbio Bioassays are designed to detect and study activated kinase directly inwhole cells. Upon receptor activation, the kinases are activated, leading to kinase phosphorylation. After cell membranelysis, phosphorylated kinase can be detected upon the addition of two monoclonal antibodies: an anti-total antibodylabeled with d2 and an anti-phospho-kinase antibody labeled with Eu 3+ -cryptate. The assay is based on a sandwichimmunoassay principle. In the presence of phosphorylated kinase, and upon excitation of the Eu 3+ -cryptate, energy istransferred to the d2 molecule, and emission at 665 nm is seen. In the absence of the phosphorylated kinase, no energyis transferred, and no 665 nm signal is detected (Figure 11).Figure 11. The HTRF Cellular Kinase assay principle. Upon receptor activation, kinases are activated, leading tokinase phosphorylation. After cell membrane lysis, phosphorylated kinase can be detected upon the addition of twomonoclonal antibodies: an anti-total antibody labeled with d2 and an anti-phospho-kinase antibody labeled withEu 3+ -cryptate.In the work described here, the phospho-STAT3 (Tyr705) assay was used to assess potential inhibitors of the EGFRsignaling pathway leading to phosphorylation of STAT3 kinase at the Tyr705 site using the human epithelial carcinomacell line, A431. Initial testing demonstrated that the automated assay procedure was accurate and robust, asdemonstrated by the EC 50value for EGF stimulation of 61.5 nM (compared to 180 nM previously generated by the assaymanufacturer), and a Z’-factor score of 0.79 (Figure 12).A. B.Figure 12. (A) EGF stimulation of STAT3(Tyr705) phosphorylation demonstrated as a full dose response; (B)Z’-factor score from 40 replicate measurements each at [EGF] of 600 nM and vehicle.10
Application GuideAn inhibitor screen was then performed using the Screen-Well Natural Product Library. Compounds were once againpre-diluted from the 100% DMSO stocks to three intermediate concentrations, and then screened at final concentrationsof 20, 4, and 0.8 µg/mL. All wells were stimulated with 200 nM EGF (1X). A no compound (0% inhibition) control wasincluded as well as three known inhibitors of STAT3 activation: SD 1008, stattic, and cryptotanshinone. When plottingthe compound percent inhibition data for each concentration screened, the following distribution profiles wereobserved (Figure 13).A. B. C.Figure 13. Percent inhibition distribution of natural product library compounds when screened at concentrations of (A) 0.8µg/mL, (B) 4.0 µg/mL, and (C) 20 µg/mL.Figure 14 shows the scatter plots generated for all three concentrations of compounds 385-502 from the natural productlibrary, as well as for the three control compounds. Percent inhibition of EGF stimulation was plotted on the left X-axis,and % negative control 620 signal plotted on the right Y-axis. The second calculation was once again included to helpdetermine true STAT3 signaling pathway inhibitors.Figure 14. Plate 5 and 6 % inhibition and % negative control 620 signal results from phospho-STAT3 (Tyr705) assay screenusing Screen-Well Natural Product Library.11
Application GuideIt is clear that many compounds demonstrate an effect on the 620 signal at higher concentrations, which may lead tofalse inhibition data. Further testing is necessary to determine any cytotoxic effects that potential library inhibitorycompounds might have on the A431 cells, and to determine each compound’s full inhibitory characteristics.Initial dose response studies were conducted on the three control compounds included in the screen. 11-point titrationswere created using a 1:2 dilution scheme starting at a 1X concentration of 100 µM (Figure 15). IC 50values (Table 2) werecalculated from each inhibition curve.Figure 15. Inhibition of EGF-induced STAT3(Tyr705) phosphorylationusing the small molecule inhibitors, SD 1008, stattic andcryptotanshinone.Table 2. IC 50values for known inhibitors of STAT3 activation.EpigeneticsThe DNA molecules in each cell are wrapped around histone proteins, and collectively referred to as chromatin.This serves to compact the DNA strand, and also controls gene expression. Changes to the chromatin structure arecontrolled by the addition or removal of epigenetic factors, such as methyl or acetyl groups, to histone tails. A relaxedchromatin structure allows for gene transcription, whereas the opposite silences that part of the genetic code. This isa normal process during cell differentiation. However, the loss of proper epigenetic control can lead to aberrant geneexpression and the development of multiple diseases, including diabetes, cancer, or neurological disorders. This has ledto much new research, and has made epigenetics one of the fastest growing drug discovery markets, with projectionsthat the worldwide market will reach $18.2 billion by 2015 17 .12Assessment of HDAC1 Inhibition using a Bioluminescent Histone Deacetylase I/II AssayThe HDAC-Glo I/II Assay from Promega Corporation (Madison, WI) is a single-reagent-addition, homogeneous,luminescent assay that measures the relative activity of histone deacetylase (HDAC) class I and II enzymes from cells,extracts or purified enzyme sources. The assay is broadly useful for class I and II enzymes, and uses an acetylated, livecell-permeant,luminogenic peptide substrate that can be deacetylated by HDAC activities (Figure 16). Deacetylationof the peptide substrate is measured using a coupled enzymatic system in which a protease in the developer reagentcleaves the peptide from aminoluciferin, which is quantified in a reaction using Ultra-Glo Recombinant Luciferase. TheHDAC-mediated luminescent signal is proportional to deacetlyase activity.
Application GuideFigure 16. HDAC-Glo I/II Assay Principle. All three enzymatic modifications of the substrateoccur in coupled, nearly simultaneous reactions upon addition of a single reagent.Here we used the HDAC-Glo I/II Assay to screen for HDAC1 inhibitors in a low volume 384-well format. Initialexperiments, using a pre-determined enzyme concentration of 10 ng/mL (data not shown), validated that the automatedassay procedure delivers accurate and robust results (Figure 17). The IC 50value for Trichostatin A of 1.04 nM agrees withpreviously published data 18 , and the Z’-factor score of 0.87 confirms its suitability for screening.A.B.Figure 17. (A) Dose response curve showing inhibition of HDAC1 enzyme activity by Trichostatin A; (B) Z’-factor score from24 replicate measurements each at [Trichostatin A] of 500 nM and vehicle.A compound screen was then performed using the Screen-Well Epigenetics Library. Five additional compounds werealso included which are shown to inhibit the activity of various epigenetic proteins. Compounds were diluted from the10 mM, 100% DMSO stock to three intermediate concentrations and then screened at final concentrations of 20, 2,and 0.2 µM. Percent inhibition (Figure 18) was calculated by comparing the luminescent values from each compoundconcentration tested to a no compound, uninhibited enzyme reaction control.13
Application GuideFigure 18. % Inhibition results from HDAC1 assay screen using Screen-Well Epigenetics Library.Compounds exhibiting greater than 50% inhibition of enzyme activity at any of the three concentrations tested,including known HDAC inhibitors, and the SIRT activators Resveratrol, Piceatannol, and Aminoresveratrol Sulfate, werecarried forward for dose response testing. Two different tests were completed. 12-point titrations were created for eachtest using a 1:4 dilution scheme starting at a 1X concentration of 100 µM. The first determined the specific inhibitorycharacteristics of each lead compound (Figure 19A). IC 50values were calculated from each inhibition curve. The secondtest determined the inhibitory potential of each compound on the components used in the detection step (Figure 19B).A nonacetylated HDAC-Glo I/II control substrate was added to the detection reagent. The control substrate does notrequire deacetylation to produce luminescence, and therefore is not affected by HDAC inhibitors.A. B.Figure 19. Dose response curves generated for “hit” compounds using (A) standard detection reagent components, or (B)detection reagent plus control substrate.14
Application GuideThe dose response tests confirmed that each known HDAC inhibitor demonstrated true HDAC1 activity inhibition, as nosignificant negative change in luminescent signal was seen when each compound was tested with the control substrate.This was in contrast to the three SIRT activator compounds, which showed evidence of a negative effect on thedetection reagent components at high compound concentration. Therefore these compounds should not be includedwith the others as actual inhibitors of HDAC1 activity.ConclusionsWhile the high throughput screening market continues to feel great pressure, leading to a number of changesin method and ways of thinking, the tools available for use in HTS also continue to adapt and evolve. New assaychemistries, both biochemical and cell-based, give more precise answers using increasingly in-vivo-like models.BioTek’s liquid handling and detection instrumentation also meets the new demands of the industry. The Precision,EL406 and MultiFlo can be used to automate numerous assay procedures, including intricate tasks such as mediumexchanges and buffer washes for cell-based assays. The appropriate Synergy Multi-Mode Microplate Reader can thenbe incorporated to detect the emission signal from the specific assay. Together, the combination of assay chemistry andinstrumentation create an ideal solution to meet the needs of today’s high throughput screening laboratory.References1. PRWeb. http://www.prweb.com/releases/high_throughput_screening/drug_discovery/prweb8512562.html (accessedDec 21, 2012). Global Industry Analysts, Inc., press release.2. Xiaohong, X.; Lei, Y.; Luo, J.; Wang, J.; Zhang, S.; Yang, X.; Sun, M.; Nuwaysir, E.; Fan, G.; Zhao, J.; Lei, L.; Zhong,Z. Prevention of β-amyloid induced toxicity in human iPS cell-derived neurons by inhibition of Cyclin-dependentkinases and associated cell cycle events. Stem Cell Res [In Press, Accepted Manuscript]. http://dx.doi.org/10.1016/j.scr.2012.11.005. Published Online: Dec 7, 2012. (accessed Dec 21, 2012).3. Robinson-Rechavi, M.; Garcia, H.; Laudet, V. The Nuclear Receptor Family. J Cell Sci. 2003, 116(4), 585-586.4. Via, M. Nuclear Receptors: The Pipeline Outlook; Market report, Insight Pharma Reports: Needham, MA, 2010.5. Zhang, J.; Chung, T.; Oldenburg, K. A Simple Statistical Parameter for Use in Evaluation and Validation of <strong>High</strong><strong>Throughput</strong> <strong>Screening</strong> Assays. J Biomol Screen. 1999, 4(2), 67-73.6. Kroeze, W.; Sheffler, D.; Roth, B. G-protein-coupled receptors at a glance. J Cell Sci. 2003, 116(24), 4867-4869.7. Suwa, M.; Sugihara, M.; Ono, Y. Functional and Structural Overview of G-Protein-Coupled ReceptorsComprehensively Obtained from Genome Sequences. Pharmaceuticals. 2011, 4(4), 652-664.8. Rubenstein, K. GPCRs: Dawn of a New Era?; Market report, Insight Pharma Reports: Needham, MA, 2008.9. G-Protein Coupled Receptors (GPCRs) Market - Global Industry Size, Market Share, Trends, Analysis and Forecast,2012 - 2018; Market report, Transparency Market Research: Albany, NY, 2012.10. Cheng, Y.; Prusoff, W. Relationship between the inhibition constant (K i) and the concentration of inhibitor whichcauses 50 percent inhibition (I 50) of an enzymatic reaction. Biochem Pharmacol. 1973, 22(23), 3099-3108.11. Jorgensen, R.; Martini, L.; Schwartz, T.; Elling, C. Characterization of Glucagon-Like Peptide-1 Receptor β-Arrestin 2Interaction: A <strong>High</strong>-Affinity Receptor Phenotype. Mol Endocrinol. 2005, 19(3), 812-823.12. Knudsen, L.; Pridal, L. Glucagon-like-peptide-1-(9-36) amide is a major metabolite of glucagon-like-peptide-1-(7-36)amide after in vivo administration to dogs, and it acts as an antagonist on the pancreatic receptor. Eur J Pharmacol.1996, 318(2-3), 429-435.15
Application Guide13. PR Newswire. http://www.prnewswire.com/news-releases/kinase-inhibitors-market-to-reach-116-billion-in-us-403-billion-globally-by-2016-161937715.html (accessed Dec 19, 2012). Global Information Inc., press release.14. Duan, Z.; Bradner, J.; Greenberg, E.; Mazitschek, R.; Foster, R.; Mahoney, J.; Seiden, M. 8-Benzyl-4-oxo-8-azabicyclo[3.2.1]oct-2-ene-6,7-dicarboxylic Acid (SD-1008), a Novel Janus Kinase 2 Inhibitor, Increases ChemotherapySensitivity in Human Ovarian Cancer Cells. Mol Pharmacol. 2007, 72(5), 1137-45.15. Schust, J.; Sperl, B.; Hollis, A.; Mayer, T.; Berg, T. Stattic: A Small-Molecule Inhibitor of STAT3 Activation andDimerization. Chem Biol. 2006, 13(11), 1235-42.16. Shin, D.; Kim, H.; Shin, K.; Yoon, Y.; Kim, S.; Han, D.; Kwon, B. Cryptotanshinone Inhibits Constitutive SignalTransducer and Activator of Transcription 3 Function through Blocking the Dimerization in DU145 Prostate Cancer Cells.Cancer Res. 2009, 69(1), 193-202.17. PR Newswire. http://www.prweb.com/releases/epigenetics/drug_discovery/prweb3553614.htm (accessed Dec 21,2012). Global Industry Analysts Inc., press release.18. Viqushin, D.; Ali, S.; Pace, P.; Mirsaide, N.; Ito, K.; Adcock, I.; Coombes, R. Trichostatin A is a histone deacetylaseinhibitor with potent antitumor activity against breast cancer in vivo. Clin Cancer Res. 2001, 7(4), 971-976.16Rev. 01/09/13