Report - UNDP Russia
Report - UNDP Russia
Report - UNDP Russia
Create successful ePaper yourself
Turn your PDF publications into a flip-book with our unique Google optimized e-Paper software.
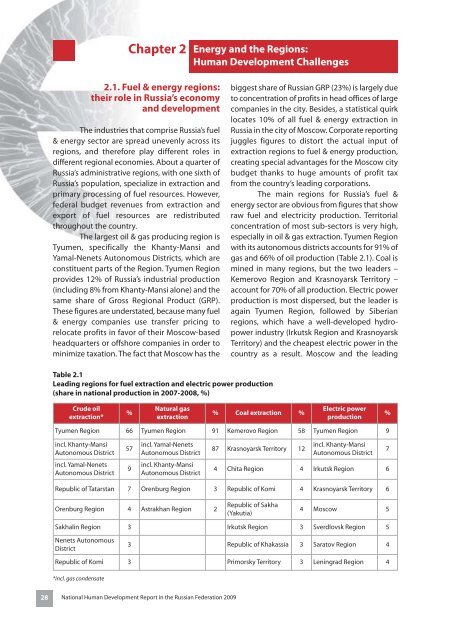
Chapter 2Energy and the Regions:Human Development Challenges2.1. Fuel & energy regions:their role in <strong>Russia</strong>’s economyand developmentThe industries that comprise <strong>Russia</strong>’s fuel& energy sector are spread unevenly across itsregions, and therefore play different roles indifferent regional economies. About a quarter of<strong>Russia</strong>’s administrative regions, with one sixth of<strong>Russia</strong>’s population, specialize in extraction andprimary processing of fuel resources. However,federal budget revenues from extraction andexport of fuel resources are redistributedthroughout the country.The largest oil & gas producing region isTyumen, specifically the Khanty-Mansi andYamal-Nenets Autonomous Districts, which areconstituent parts of the Region. Tyumen Regionprovides 12% of <strong>Russia</strong>’s industrial production(including 8% from Khanty-Mansi alone) and thesame share of Gross Regional Product (GRP).These figures are understated, because many fuel& energy companies use transfer pricing torelocate profits in favor of their Moscow-basedheadquarters or offshore companies in order tominimize taxation. The fact that Moscow has thebiggest share of <strong>Russia</strong>n GRP (23%) is largely dueto concentration of profits in head offices of largecompanies in the city. Besides, a statistical quirklocates 10% of all fuel & energy extraction in<strong>Russia</strong> in the city of Moscow. Corporate reportingjuggles figures to distort the actual input ofextraction regions to fuel & energy production,creating special advantages for the Moscow citybudget thanks to huge amounts of profit taxfrom the country’s leading corporations.The main regions for <strong>Russia</strong>’s fuel &energy sector are obvious from figures that showraw fuel and electricity production. Territorialconcentration of most sub-sectors is very high,especially in oil & gas extraction. Tyumen Regionwith its autonomous districts accounts for 91% ofgas and 66% of oil production (Table 2.1). Coal ismined in many regions, but the two leaders –Kemerovo Region and Krasnoyarsk Territory –account for 70% of all production. Electric powerproduction is most dispersed, but the leader isagain Tyumen Region, followed by Siberianregions, which have a well-developed hydropowerindustry (Irkutsk Region and KrasnoyarskTerritory) and the cheapest electric power in thecountry as a result. Moscow and the leadingTable 2.1Leading regions for fuel extraction and electric power production(share in national production in 2007-2008, %)Crude oilextraction*%Natural gasextraction% Coal extraction %Electric powerproduction%Tyumen Region 66 Tyumen Region 91 Kemerovo Region 58 Tyumen Region 9incl. Khanty-MansiAutonomous District57incl. Yamal-NenetsAutonomous District87 Krasnoyarsk Territory 12incl. Khanty-MansiAutonomous District7incl. Yamal-NenetsAutonomous District9incl. Khanty-MansiAutonomous District4 Chita Region 4 Irkutsk Region 6Republic of Tatarstan 7 Orenburg Region 3 Republic of Komi 4 Krasnoyarsk Territory 6Orenburg Region 4 Astrakhan Region 2Republic of Sakha(Yakutia)4 Moscow 5Sakhalin Region 3 Irkutsk Region 3 Sverdlovsk Region 5Nenets AutonomousDistrict3 Republic of Khakassia 3 Saratov Region 4Republic of Komi 3 Primorsky Territory 3 Leningrad Region 4*incl. gas condensate28 National Human Development <strong>Report</strong> in the <strong>Russia</strong>n Federation 2009


