

Report - UNDP Russia
Report - UNDP Russia
Report - UNDP Russia

You also want an ePaper? Increase the reach of your titles
YUMPU automatically turns print PDFs into web optimized ePapers that Google loves.
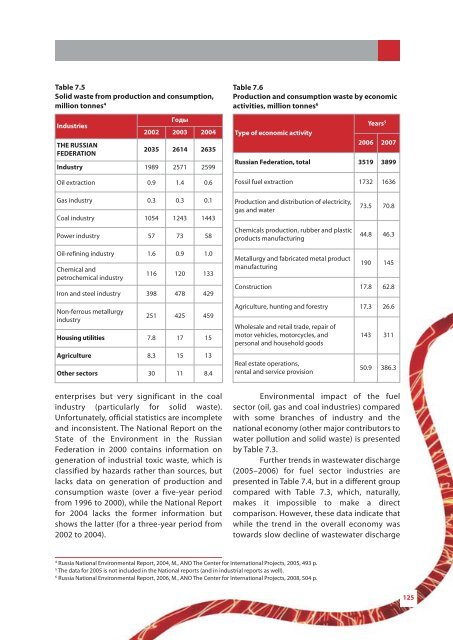
Table 7.5Solid waste from production and consumption,million tonnes 4IndustriesTHE RUSSIANFEDERATIONГоды2002 2003 20042035 2614 2635Industry 1989 2571 2599Oil extraction 0.9 1.4 0.6Table 7.6Production and consumption waste by economicactivities, million tonnes 6Type of economic activityYears 52006 2007<strong>Russia</strong>n Federation, total 3519 3899Fossil fuel extraction 1732 1636Gas industry 0.3 0.3 0.1Coal industry 1054 1243 1443Power industry 57 73 58Production and distribution of electricity,gas and waterChemicals production, rubber and plasticproducts manufacturing73.5 70.844.8 46.3Oil-refining industry 1.6 0.9 1.0Chemical andpetrochemical industry116 120 133Iron and steel industry 398 478 429Non-ferrous metallurgyindustry251 425 459Housing utilities 7.8 17 15Agriculture 8.3 15 13Other sectors 30 11 8.4Metallurgy and fabricated metal productmanufacturing190 145Construction 17.8 62.8Agriculture, hunting and forestry 17.3 26.6Wholesale and retail trade, repair ofmotor vehicles, motorcycles, andpersonal and household goodsReal estate operations,rental and service provision143 31150.9 386.3enterprises but very significant in the coalindustry (particularly for solid waste).Unfortunately, official statistics are incompleteand inconsistent. The National <strong>Report</strong> on theState of the Environment in the <strong>Russia</strong>nFederation in 2000 contains information ongeneration of industrial toxic waste, which isclassified by hazards rather than sources, butlacks data on generation of production andconsumption waste (over a five-year periodfrom 1996 to 2000), while the National <strong>Report</strong>for 2004 lacks the former information butshows the latter (for a three-year period from2002 to 2004).Environmental impact of the fuelsector (oil, gas and coal industries) comparedwith some branches of industry and thenational economy (other major contributors towater pollution and solid waste) is presentedby Table 7.3.Further trends in wastewater discharge(2005–2006) for fuel sector industries arepresented in Table 7.4, but in a different groupcompared with Table 7.3, which, naturally,makes it impossible to make a directcomparison. However, these data indicate thatwhile the trend in the overall economy wastowards slow decline of wastewater discharge4<strong>Russia</strong> National Environmental <strong>Report</strong>, 2004, M., ANO The Center for International Projects, 2005, 493 p.5The data for 2005 is not included in the National reports (and in industrial reports as well).6<strong>Russia</strong> National Environmental <strong>Report</strong>, 2006, M., ANO The Center for International Projects, 2008, 504 p.125


