Matth. Hohner AG
Matth. Hohner AG Matth. Hohner AG
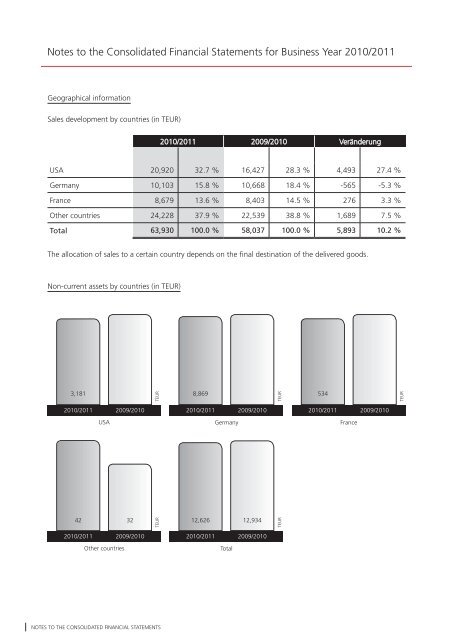
Notes to the Consolidated Financial Statements for Business Year 2010/2011 Geographical information Sales development by countries (in TEUR) 2010/2011 2009/2010 Veränderung USA 20,920 32.7 % 16,427 28.3 % 4,493 27.4 % Germany 10,103 15.8 % 10,668 18.4 % -565 -5.3 % France 8,679 13.6 % 8,403 14.5 % 276 3.3 % Other countries 24,228 37.9 % 22,539 38.8 % 1,689 7.5 % Total 63,930 100.0 % 58,037 100.0 % 5,893 10.2 % The allocation of sales to a certain country depends on the final destination of the delivered goods. Non-current assets by countries (in TEUR) 3,181 2010/2011 42 USA 2009/2010 2010/2011 2009/2010 Other countries TEUR TEUR 8,869 2010/2011 2010/2011 Germany 2009/2010 32 12,626 12,934 Total 2009/2010 TEUR TEUR 534 2010/2011 France 2009/2010 TEUR 24. Other financial obligations The table below shows other financial obligations: March 31, 2011 2011/2012 2012/2013 – 2015/2016 from 2016/2017 Total TEUR TEUR TEUR TEUR Rental agreements 165 36 0 201 Insurance policies 163 0 0 163 Maintenance agreements 17 1 0 18 Commitments 247 0 0 247 592 37 0 629 March 31, 2010 2010/2011 2011/2012 – 2014/2015 from 2015/2016 Total TEUR TEUR TEUR TEUR Rental agreements 169 46 0 215 Insurance policies 169 0 0 169 Maintenance agreements 21 3 0 24 Commitments 200 0 0 200 559 49 0 608 Payments from rental agreements recognized as expense in the business year 2010/2011 amounted to TEUR 396 (prior year: TEUR 438). We refer to our comments on leases in Note 2, Property, plant and equipment. For other financial obligations we refer to our comments on Note 10. Notes to the CoNsolidated FiNaNCial statemeNts Notes to the CoNsolidated FiNaNCial statemeNts 121
- Page 72: Notes to the Consolidated Financial
- Page 76: Notes to the Consolidated Financial
- Page 80: Notes to the Consolidated Financial
- Page 84: Notes to the Consolidated Financial
- Page 88: Notes to the Consolidated Financial
- Page 92: Notes to the Consolidated Financial
- Page 96: Notes to the Consolidated Financial
- Page 100: Notes to the Consolidated Financial
- Page 104: Notes to the Consolidated Financial
- Page 108: Notes to the Consolidated Financial
- Page 112: Notes to the Consolidated Financial
- Page 116: Notes to the Consolidated Financial
- Page 120: Notes to the Consolidated Financial
- Page 126: Notes to the Consolidated Financial
- Page 130: Statement of changes in Fixed Asset
- Page 134: Imprint Published by: Matth. Hohner
Notes to the Consolidated Financial Statements for Business Year 2010/2011<br />
Geographical information<br />
Sales development by countries (in TEUR)<br />
2010/2011 2009/2010 Veränderung<br />
USA 20,920 32.7 % 16,427 28.3 % 4,493 27.4 %<br />
Germany 10,103 15.8 % 10,668 18.4 % -565 -5.3 %<br />
France 8,679 13.6 % 8,403 14.5 % 276 3.3 %<br />
Other countries 24,228 37.9 % 22,539 38.8 % 1,689 7.5 %<br />
Total 63,930 100.0 % 58,037 100.0 % 5,893 10.2 %<br />
The allocation of sales to a certain country depends on the final destination of the delivered goods.<br />
Non-current assets by countries (in TEUR)<br />
3,181<br />
2010/2011<br />
42<br />
USA<br />
2009/2010<br />
2010/2011 2009/2010<br />
Other countries<br />
TEUR<br />
TEUR<br />
8,869<br />
2010/2011<br />
2010/2011<br />
Germany<br />
2009/2010<br />
32 12,626<br />
12,934<br />
Total<br />
2009/2010<br />
TEUR<br />
TEUR<br />
534<br />
2010/2011<br />
France<br />
2009/2010<br />
TEUR<br />
24. Other financial obligations<br />
The table below shows other financial obligations:<br />
March 31, 2011 2011/2012 2012/2013<br />
–<br />
2015/2016<br />
from<br />
2016/2017<br />
Total<br />
TEUR TEUR TEUR TEUR<br />
Rental agreements 165 36 0 201<br />
Insurance policies 163 0 0 163<br />
Maintenance agreements 17 1 0 18<br />
Commitments 247 0 0 247<br />
592 37 0 629<br />
March 31, 2010 2010/2011 2011/2012<br />
–<br />
2014/2015<br />
from<br />
2015/2016<br />
Total<br />
TEUR TEUR TEUR TEUR<br />
Rental agreements 169 46 0 215<br />
Insurance policies 169 0 0 169<br />
Maintenance agreements 21 3 0 24<br />
Commitments 200 0 0 200<br />
559 49 0 608<br />
Payments from rental agreements recognized as expense in the business year 2010/2011 amounted to<br />
TEUR 396 (prior year: TEUR 438). We refer to our comments on leases in Note 2, Property, plant and<br />
equipment.<br />
For other financial obligations we refer to our comments on Note 10.<br />
Notes to the CoNsolidated FiNaNCial statemeNts Notes to the CoNsolidated FiNaNCial statemeNts<br />
121


