Package 'metagenomeSeq' - Bioconductor
Package 'metagenomeSeq' - Bioconductor
Package 'metagenomeSeq' - Bioconductor
- No tags were found...

You also want an ePaper? Increase the reach of your titles
YUMPU automatically turns print PDFs into web optimized ePapers that Google loves.
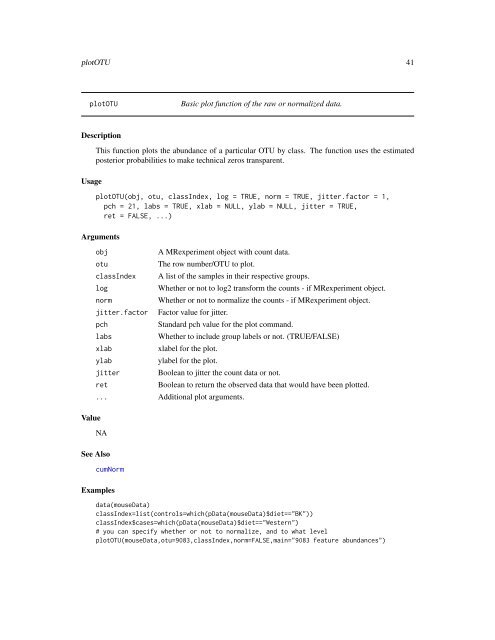
plotOTU 41plotOTUBasic plot function of the raw or normalized data.DescriptionThis function plots the abundance of a particular OTU by class. The function uses the estimatedposterior probabilities to make technical zeros transparent.UsageplotOTU(obj, otu, classIndex, log = TRUE, norm = TRUE, jitter.factor = 1,pch = 21, labs = TRUE, xlab = NULL, ylab = NULL, jitter = TRUE,ret = FALSE, ...)ArgumentsobjA MRexperiment object with count data.otuThe row number/OTU to plot.classIndex A list of the samples in their respective groups.logWhether or not to log2 transform the counts - if MRexperiment object.normWhether or not to normalize the counts - if MRexperiment object.jitter.factor Factor value for jitter.pchStandard pch value for the plot command.labsWhether to include group labels or not. (TRUE/FALSE)xlabxlabel for the plot.ylabylabel for the plot.jitter Boolean to jitter the count data or not.retBoolean to return the observed data that would have been plotted.... Additional plot arguments.ValueNASee AlsocumNormExamplesdata(mouseData)classIndex=list(controls=which(pData(mouseData)$diet=="BK"))classIndex$cases=which(pData(mouseData)$diet=="Western")# you can specify whether or not to normalize, and to what levelplotOTU(mouseData,otu=9083,classIndex,norm=FALSE,main="9083 feature abundances")