Package 'metagenomeSeq' - Bioconductor
Package 'metagenomeSeq' - Bioconductor
Package 'metagenomeSeq' - Bioconductor
- No tags were found...
You also want an ePaper? Increase the reach of your titles
YUMPU automatically turns print PDFs into web optimized ePapers that Google loves.
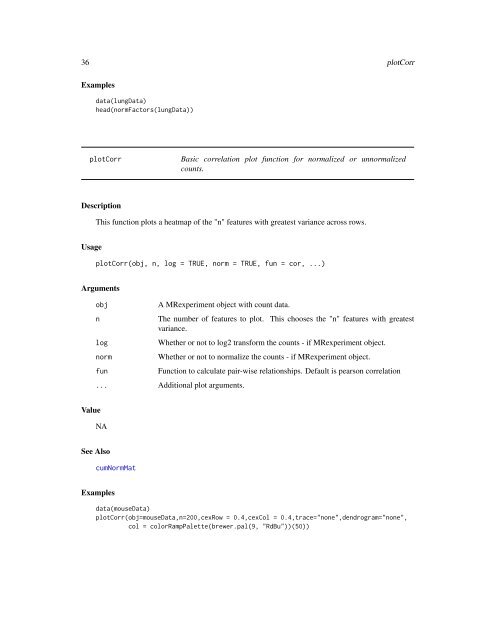
36 plotCorrExamplesdata(lungData)head(normFactors(lungData))plotCorrBasic correlation plot function for normalized or unnormalizedcounts.DescriptionThis function plots a heatmap of the "n" features with greatest variance across rows.UsageplotCorr(obj, n, log = TRUE, norm = TRUE, fun = cor, ...)ArgumentsobjnlognormfunA MRexperiment object with count data.The number of features to plot. This chooses the "n" features with greatestvariance.Whether or not to log2 transform the counts - if MRexperiment object.Whether or not to normalize the counts - if MRexperiment object.Function to calculate pair-wise relationships. Default is pearson correlation... Additional plot arguments.ValueNASee AlsocumNormMatExamplesdata(mouseData)plotCorr(obj=mouseData,n=200,cexRow = 0.4,cexCol = 0.4,trace="none",dendrogram="none",col = colorRampPalette(brewer.pal(9, "RdBu"))(50))


