The Untapped Power of Schools to Improve the Health of Teens
The Untapped Power of Schools to Improve the Health of Teens
The Untapped Power of Schools to Improve the Health of Teens
- No tags were found...
You also want an ePaper? Increase the reach of your titles
YUMPU automatically turns print PDFs into web optimized ePapers that Google loves.
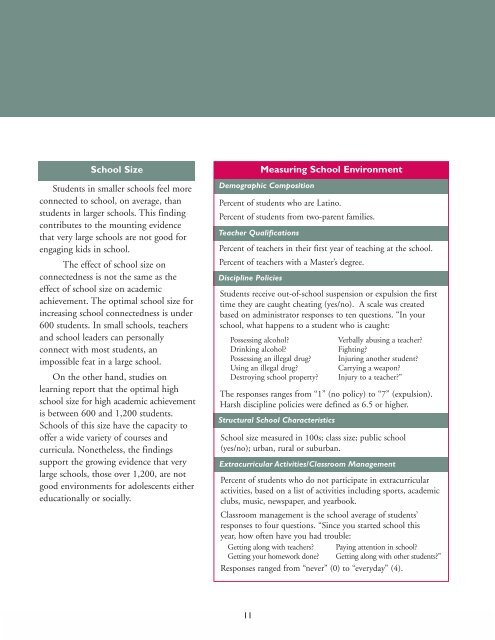
School SizeStudents in smaller schools feel moreconnected <strong>to</strong> school, on average, thanstudents in larger schools. This findingcontributes <strong>to</strong> <strong>the</strong> mounting evidencethat very large schools are not good forengaging kids in school.<strong>The</strong> effect <strong>of</strong> school size onconnectedness is not <strong>the</strong> same as <strong>the</strong>effect <strong>of</strong> school size on academicachievement. <strong>The</strong> optimal school size forincreasing school connectedness is under600 students. In small schools, teachersand school leaders can personallyconnect with most students, animpossible feat in a large school.On <strong>the</strong> o<strong>the</strong>r hand, studies onlearning report that <strong>the</strong> optimal highschool size for high academic achievementis between 600 and 1,200 students.<strong>Schools</strong> <strong>of</strong> this size have <strong>the</strong> capacity <strong>to</strong><strong>of</strong>fer a wide variety <strong>of</strong> courses andcurricula. None<strong>the</strong>less, <strong>the</strong> findingssupport <strong>the</strong> growing evidence that verylarge schools, those over 1,200, are notgood environments for adolescents ei<strong>the</strong>reducationally or socially.Percent <strong>of</strong> students who are Latino.Percent <strong>of</strong> students from two-parent families.Teacher QualificationsPercent <strong>of</strong> teachers in <strong>the</strong>ir first year <strong>of</strong> teaching at <strong>the</strong> school.Percent <strong>of</strong> teachers with a Master’s degree.Discipline PoliciesMeasuring School EnvironmentDemographic CompositionStudents receive out-<strong>of</strong>-school suspension or expulsion <strong>the</strong> firsttime <strong>the</strong>y are caught cheating (yes/no). A scale was createdbased on administra<strong>to</strong>r responses <strong>to</strong> ten questions. “In yourschool, what happens <strong>to</strong> a student who is caught:Possessing alcohol?Drinking alcohol?Possessing an illegal drug?Using an illegal drug?Destroying school property?<strong>The</strong> responses ranges from “1” (no policy) <strong>to</strong> “7” (expulsion).Harsh discipline policies were defined as 6.5 or higher.Structural School CharacteristicsVerbally abusing a teacher?Fighting?Injuring ano<strong>the</strong>r student?Carrying a weapon?Injury <strong>to</strong> a teacher?”School size measured in 100s; class size; public school(yes/no); urban, rural or suburban.Extracurricular Activities/Classroom ManagementPercent <strong>of</strong> students who do not participate in extracurricularactivities, based on a list <strong>of</strong> activities including sports, academicclubs, music, newspaper, and yearbook.Classroom management is <strong>the</strong> school average <strong>of</strong> students’responses <strong>to</strong> four questions. “Since you started school thisyear, how <strong>of</strong>ten have you had trouble:Getting along with teachers? Paying attention in school?Getting your homework done? Getting along with o<strong>the</strong>r students?”Responses ranged from “never” (0) <strong>to</strong> “everyday” (4).11


