Ashley Creek TMDL - Division of Water Quality
Ashley Creek TMDL - Division of Water Quality
Ashley Creek TMDL - Division of Water Quality

You also want an ePaper? Increase the reach of your titles
YUMPU automatically turns print PDFs into web optimized ePapers that Google loves.
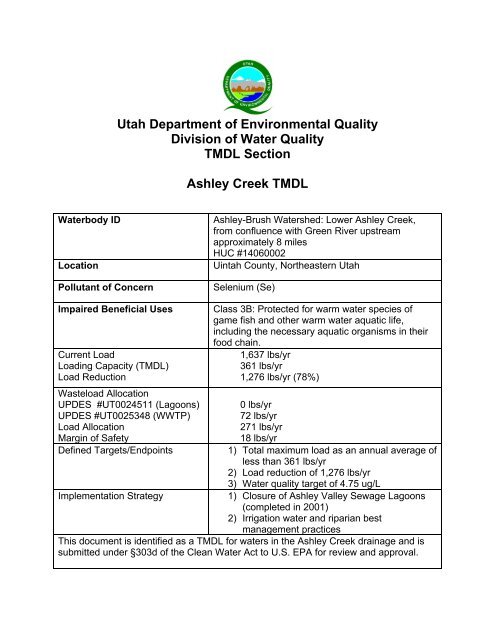
Utah Department <strong>of</strong> Environmental <strong>Quality</strong><strong>Division</strong> <strong>of</strong> <strong>Water</strong> <strong>Quality</strong><strong>TMDL</strong> Section<strong>Ashley</strong> <strong>Creek</strong> <strong>TMDL</strong><strong>Water</strong>body IDLocationPollutant <strong>of</strong> Concern<strong>Ashley</strong>-Brush <strong>Water</strong>shed: Lower <strong>Ashley</strong> <strong>Creek</strong>,from confluence with Green River upstreamapproximately 8 milesHUC #14060002Uintah County, Northeastern UtahSelenium (Se)Impaired Beneficial UsesCurrent LoadLoading Capacity (<strong>TMDL</strong>)Load ReductionWasteload AllocationUPDES #UT0024511 (Lagoons)UPDES #UT0025348 (WWTP)Load AllocationMargin <strong>of</strong> SafetyDefined Targets/EndpointsImplementation StrategyClass 3B: Protected for warm water species <strong>of</strong>game fish and other warm water aquatic life,including the necessary aquatic organisms in theirfood chain.1,637 lbs/yr361 lbs/yr1,276 lbs/yr (78%)0 lbs/yr72 lbs/yr271 lbs/yr18 lbs/yr1) Total maximum load as an annual average <strong>of</strong>less than 361 lbs/yr2) Load reduction <strong>of</strong> 1,276 lbs/yr3) <strong>Water</strong> quality target <strong>of</strong> 4.75 ug/L1) Closure <strong>of</strong> <strong>Ashley</strong> Valley Sewage Lagoons(completed in 2001)2) Irrigation water and riparian bestmanagement practicesThis document is identified as a <strong>TMDL</strong> for waters in the <strong>Ashley</strong> <strong>Creek</strong> drainage and issubmitted under §303d <strong>of</strong> the Clean <strong>Water</strong> Act to U.S. EPA for review and approval.
Utah Department <strong>of</strong> Environmental <strong>Quality</strong><strong>Division</strong> <strong>of</strong> <strong>Water</strong> <strong>Quality</strong><strong>TMDL</strong> Section<strong>Ashley</strong> <strong>Creek</strong> <strong>TMDL</strong><strong>Water</strong>body IDLocationPollutants <strong>of</strong> ConcernImpaired Beneficial UsesCurrent LoadingLoading Capacity (<strong>TMDL</strong>)Load ReductionWasteload AllocationUPDES #UT0024511 (Lagoons)UPDES #UT0025348 (WWTP)Load AllocationMargin <strong>of</strong> SafetyDefined Targets/Endpoints<strong>Ashley</strong>-Brush <strong>Water</strong>shed: Lower <strong>Ashley</strong> <strong>Creek</strong>, fromconfluence with Green River upstream approximately8 milesHUC #14060002Uintah County, Northeastern UtahTotal Dissolved Solids (TDS)Class 4: Protected for agricultural uses includingirrigation <strong>of</strong> crops and stock watering.36,247 tons/yr29,053 tons/yr7,194 tons/yr (20%)0 tons/yr3,794 tons/yr23,806 tons/yr1,453 tons/yr1) Total maximum load as an annual average <strong>of</strong>less than 29,053 tons/yr2) Load reduction <strong>of</strong> 7,194 tons/yr3) <strong>Water</strong> quality target <strong>of</strong> 1,140 mg/LImplementation Strategy1) Closure <strong>of</strong> <strong>Ashley</strong> Valley Sewage Lagoons(completed in 2001)2) Irrigation water and riparian best managementpracticesThis document is identified as a <strong>TMDL</strong> for waters in the <strong>Ashley</strong> <strong>Creek</strong> drainage and issubmitted under §303d <strong>of</strong> the Clean <strong>Water</strong> Act to U.S. EPA for review and approval.
<strong>Ashley</strong> <strong>Creek</strong> Selenium and Total Dissolved Solids <strong>TMDL</strong>sTable <strong>of</strong> Contents1.0 Background .............................................................................................................. 12.0 <strong>Water</strong> <strong>Quality</strong> Standards ........................................................................................ 122.1 Utah’s Listing Methodology................................................................................. 122.1.1 Selenium ...................................................................................................... 122.1.2 Total Dissolved Solids.................................................................................. 122.2 <strong>TMDL</strong> Endpoints ................................................................................................. 133.0 Data Inventory and Review .................................................................................... 143.1 Flow Data ........................................................................................................... 143.2 <strong>Water</strong> <strong>Quality</strong> Data ............................................................................................. 143.2 <strong>Water</strong> <strong>Quality</strong> Analysis........................................................................................ 173.2.1 Summary <strong>of</strong> Selenium and Total Dissolved Solids Concentrations.............. 173.2.2 Seasonal Effects on Se and TDS Concentrations....................................... 203.2.3 Flow Versus Se and TDS Concentrations.................................................... 213.3 Critical Conditions............................................................................................... 224.0 Source Assessment ............................................................................................... 254.1 Assessment <strong>of</strong> Point Sources............................................................................. 254.1.1 <strong>Ashley</strong> Valley Sewage Lagoons ................................................................... 254.2 Assessment <strong>of</strong> Non-Point Sources ..................................................................... 264.2.1 Irrigation Return Flows ................................................................................. 264.2.2 Streambank Erosion..................................................................................... 275.0 Technical Approach................................................................................................ 295.2 Estimation <strong>of</strong> Existing Loading............................................................................ 315.2.1 Selenium ...................................................................................................... 315.2.2 Total Dissolved Solids.................................................................................. 325.3 Comparison <strong>of</strong> Existing Loading and Loading Capacity...................................... 346.0 <strong>TMDL</strong> Allocation..................................................................................................... 366.1 Description <strong>of</strong> <strong>TMDL</strong> Allocation........................................................................... 366.2 Selecting a Margin <strong>of</strong> Safety ........................................................................... 366.3 Allocation Summary............................................................................................ 366.4 Pollutant Loading Scenarios ............................................................................... 386.4.1 Existing Conditions....................................................................................... 386.4.2 Loading Capacity ......................................................................................... 386.4.3 Waste Load Allocation ................................................................................. 406.4.4 Load Allocation............................................................................................. 417. Potential Control Options ......................................................................................... 428. Future Monitoring ..................................................................................................... 449. Public Participation................................................................................................... 4510. References............................................................................................................. 46
<strong>Ashley</strong> <strong>Creek</strong> Selenium and Total Dissolved Solids <strong>TMDL</strong>sList <strong>of</strong> FiguresFigure 1-1. Location <strong>of</strong> the <strong>Ashley</strong> <strong>Creek</strong> <strong>Water</strong>shed..................................................... 2Figure 1-2. Land Use Distribution within the <strong>Ashley</strong> <strong>Creek</strong> <strong>Water</strong>shed .......................... 4Figure 1-3. Geologic Formations <strong>of</strong> the <strong>Ashley</strong> <strong>Creek</strong> <strong>Water</strong>shed ................................. 7Figure 1-4. Average Annual Precipitation within the <strong>Ashley</strong> <strong>Creek</strong> <strong>Water</strong>shed .............. 8Figure 1-5. Vegetation Communities within the <strong>Ashley</strong> <strong>Creek</strong> <strong>Water</strong>shed ..................... 9Figure 1-6. Hydrology <strong>of</strong> the <strong>Ashley</strong> <strong>Creek</strong> <strong>Water</strong>shed ................................................ 11Figure 3-1. Location <strong>of</strong> <strong>Water</strong> <strong>Quality</strong> Monitoring and Flow Gauge Stations in Lower<strong>Ashley</strong> <strong>Creek</strong> <strong>Water</strong>shed ....................................................................................... 16Figure 3-2. Average monthly Se concentrations in <strong>Ashley</strong> <strong>Creek</strong> above confluence withthe Green River (Storet site 493721). .................................................................... 20Figure 3-3. Average monthly TDS concentrations in <strong>Ashley</strong> <strong>Creek</strong> above confluencewith the Green River (Storet site 493721). ............................................................. 20Figure 3-4. Plot <strong>of</strong> Se versus flow in <strong>Ashley</strong> <strong>Creek</strong> above confluence with the GreenRiver (Storet site 493721). ..................................................................................... 21Figure 3-4. Plot <strong>of</strong> TDS versus flow in <strong>Ashley</strong> <strong>Creek</strong> above confluence with the GreenRiver (Storet site 493721). ..................................................................................... 21Figure 3-5. Monthly distribution <strong>of</strong> Se concentrations at station 493721 (<strong>Ashley</strong> <strong>Creek</strong>above confluence with the Green River). ............................................................... 24Figure 3-6. Monthly distribution <strong>of</strong> TDS concentrations at station 493721 (<strong>Ashley</strong> <strong>Creek</strong>above confluence with the Green River). ............................................................... 24Figure 4-1. Extensive cut bank along <strong>Ashley</strong> <strong>Creek</strong>..................................................... 27Figure 4-2. Locations <strong>of</strong> Billings clay and Naples loam soils along <strong>Ashley</strong> <strong>Creek</strong> ........ 28Figure 5-1. Loading capacity <strong>of</strong> selenium for all observed flows in <strong>Ashley</strong> <strong>Creek</strong>. ....... 30Figure 5-2. Loading capacity <strong>of</strong> total dissolved solids for all observed flows in <strong>Ashley</strong><strong>Creek</strong>. .................................................................................................................... 31Figure 5-3. Existing Selenium loading by flow percentile for <strong>Ashley</strong> <strong>Creek</strong>.................. 32Figure 5-4. Existing Total Dissolved Solids loading by flow percentile for <strong>Ashley</strong> <strong>Creek</strong>................................................................................................................................ 34Figure 5-5. Existing Se loading and loading capacity for <strong>Ashley</strong> <strong>Creek</strong>. ...................... 35Figure 5-6. Existing TDS loading and loading capacity for <strong>Ashley</strong> <strong>Creek</strong>..................... 35Figure 6-1. Se and TDS loads and trends from 1998-2002........................................... 40
<strong>Ashley</strong> <strong>Creek</strong> Selenium and Total Dissolved Solids <strong>TMDL</strong>sList <strong>of</strong> TablesTable 1-1. <strong>Ashley</strong> <strong>Creek</strong> listed waterbody characteristics ............................................. 1Table 1-2. Land use distribution in the <strong>Ashley</strong> <strong>Creek</strong> watershed.................................... 3Table 1-3. Vegetation Communities within the <strong>Ashley</strong> <strong>Creek</strong> watershed ....................... 6Table 2-1. Applicable Utah <strong>Water</strong> <strong>Quality</strong> Criteria........................................................ 12Table 2-2. 303 (d) Criteria for Assessing Beneficial Use Support ................................ 13Table 3-1. Inventory <strong>of</strong> data used for the watershed source assessment .................... 14Table 3-2. USGS Flow Gages in the <strong>Ashley</strong> <strong>Creek</strong> <strong>Water</strong>shed.................................... 14Table 3-3. Inventory <strong>of</strong> Available Data in Lower <strong>Ashley</strong> <strong>Creek</strong> <strong>Water</strong>shed .................. 17Table 3-4. Summary <strong>of</strong> observed Se concentrations in <strong>Ashley</strong> <strong>Creek</strong> from July 1991 toSeptember 2001..................................................................................................... 18Table 3-5. Summary <strong>of</strong> observed TDS concentrations in <strong>Ashley</strong> <strong>Creek</strong> from July 1991to September 2001................................................................................................. 19Table 3-6. Se data results by flow percentile group ..................................................... 23Table 3-7. TDS data results by flow percentile group................................................... 23Table 5-1. Summary <strong>of</strong> flows by percentile at USGS Gage 9271550 (<strong>Ashley</strong> <strong>Creek</strong>below Union Canal diversion near Jensen)............................................................ 30Table 5-2. Selenium loading statistics for the <strong>Ashley</strong> <strong>Creek</strong> watershed. ...................... 32Table 5-3. Total Dissolved Solids loading statistics for the <strong>Ashley</strong> <strong>Creek</strong> watershed... 33Table 6-1. Summary <strong>of</strong> Se <strong>TMDL</strong> for <strong>Ashley</strong> <strong>Creek</strong> watershed.................................... 37Table 6-2. Summary <strong>of</strong> TDS <strong>TMDL</strong> for <strong>Ashley</strong> <strong>Creek</strong> watershed. ................................ 37Table 6-3. Se load capacity, existing load, and necessary reduction at various flows. 39Table 6-4. TDS load allocation, existing load, and necessary reduction at various flows................................................................................................................................ 39
<strong>Ashley</strong> <strong>Creek</strong> Selenium and Total Dissolved Solids <strong>TMDL</strong>sExecutive SummaryThis document addresses water quality impairments within the lower <strong>Ashley</strong><strong>Creek</strong> watershed through the establishment <strong>of</strong> Total Maximum Daily Loads (<strong>TMDL</strong>s) forSelenium (Se) and Total Dissolved Solids (TDS). The purpose <strong>of</strong> this <strong>TMDL</strong> is toimprove water quality and protect or restore designated beneficial uses. Lower <strong>Ashley</strong><strong>Creek</strong>, from the confluence with the Green River upstream approximately 8 miles, islisted on the State’s 303D list <strong>of</strong> impaired waters and has been designated as notmeeting its warm water fishery beneficial use (3B) due to high concentrations <strong>of</strong> Se andits agricultural beneficial use (4) due to high concentrations <strong>of</strong> TDS. The source <strong>of</strong>impairment originates primarily from seepage from the <strong>Ashley</strong> Valley Sewage Lagoonsthrough an outcrop <strong>of</strong> Mancos shale, a naturally occurring geologic formation thatborders the east side <strong>of</strong> <strong>Ashley</strong> <strong>Creek</strong>. Permitted point source discharges in thewatershed include the <strong>Ashley</strong> Valley <strong>Water</strong> Reclamation Facility, a mechanical wastewater treatment plant, and five oil wells in the <strong>Ashley</strong> Oil Field.The <strong>Ashley</strong> <strong>Creek</strong> <strong>Water</strong>shed is located in the northeast corner <strong>of</strong> the State <strong>of</strong>Utah and encompasses 393 square miles. Elevations range from over 9,500 feet in theUinta Mountains to the north, down to 5,000 feet at the confluence with the Green River.Vegetation types are characteristic <strong>of</strong> the Rocky Mountains and Colorado Plateau withconiferous forests dominating the high elevations, Pinyon-Juniper forests at midelevationsand sagebrush-grass and agricultural lands in the valley bottom. <strong>Ashley</strong><strong>Creek</strong> is the primary drainage in the watershed flowing from the Uinta Mountains in thenorth, through <strong>Ashley</strong> Valley and into the Green River forty-five miles to the southeast.Flows in <strong>Ashley</strong> <strong>Creek</strong> vary widely due to spring snow melt, irrigation diversions, andoccasional thunderstorms. During spring run<strong>of</strong>f stream flows average 195 cubic feetper second (cfs), 24 cfs during irrigation season and 34 cfs during the winter nearJensen above the confluence with the Green River.Approximately 12,000 people reside within the watershed with the majority livingin the city <strong>of</strong> Vernal. The economy <strong>of</strong> the watershed is based upon tourism, fossil fuelproduction and agriculture. Recreational opportunities abound on nearby NationalForest lands, Dinosaur National Monument and Green River.Because <strong>of</strong> the natural geologic sources <strong>of</strong> Se and TDS that underlie <strong>Ashley</strong>Valley there will always be some Se and TDS non-point source loading into <strong>Ashley</strong><strong>Creek</strong>. However, several projects currently underway within the watershed will improvethe water quality and riparian habitat <strong>of</strong> <strong>Ashley</strong> <strong>Creek</strong>. A locally led watershed planningeffort, the <strong>Ashley</strong> <strong>Creek</strong> Restoration and Stabilization Committee, is addressing chronicflooding, water quality and riparian habitat issues on <strong>Ashley</strong> <strong>Creek</strong>. The Army Corps <strong>of</strong>Engineers is about to begin implementation on a riparian restoration project on <strong>Ashley</strong><strong>Creek</strong> above the Steinaker diversion, the <strong>Ashley</strong> Valley Sewer Improvement District hasrecently constructed a new wastewater treatment plant, and the Uintah County <strong>Water</strong>Conservancy District, in cooperation with the Bureau <strong>of</strong> Reclamation and NaturalResources Conservation Service, is implementing salinity control projects on irrigatedlands throughout the watershed. It is important to recognize that data collection insupport <strong>of</strong> this <strong>TMDL</strong> is an ongoing effort and that as new data is collected this <strong>TMDL</strong>will be revised as needed.
<strong>Ashley</strong> <strong>Creek</strong> Selenium and Total Dissolved Solids <strong>TMDL</strong>s1.0 BackgroundEPA’s <strong>Water</strong> <strong>Quality</strong> Planning and Management Regulations (40 CFR 130) requirestates to develop Total Maximum Daily Loads (<strong>TMDL</strong>s) for waters that exceed waterquality standards. This document presents <strong>TMDL</strong>s for <strong>Ashley</strong> <strong>Creek</strong>, which is listed onUtah’s 2002 303(d) for impairments associated with excess concentrations <strong>of</strong> Selenium(Se) and Total Dissolved Solids (TDS).<strong>Ashley</strong> <strong>Creek</strong>, a tributary <strong>of</strong> the Green River, is located in the western portion <strong>of</strong> the<strong>Ashley</strong>-Brush hydrologic unit (HUC 14060002) on the southeastern slope <strong>of</strong> the UintaMountains in northeastern Utah (Figure 1-1). Utah’s <strong>Division</strong> <strong>of</strong> <strong>Water</strong> <strong>Quality</strong> (UDWQ)has assessed lower <strong>Ashley</strong> <strong>Creek</strong> (from the mouth <strong>of</strong> the river to the County Roadcrossing above the old Vernal Lagoons) and its tributaries and has determined that thissegment is not supporting its agricultural classification due to violations <strong>of</strong> the waterquality criterion for TDS and its warm water fisheries classification due to violations <strong>of</strong>the criterion for Se. This stream segment also has a fish consumption advisory on itbecause <strong>of</strong> elevated levels <strong>of</strong> Se found in fish tissue.<strong>Ashley</strong> <strong>Creek</strong> has a priority ranking <strong>of</strong> low. Although <strong>Ashley</strong> <strong>Creek</strong> has been listed as alow priority for <strong>TMDL</strong> development on the State’s 2002 303(d) list, the initiation <strong>of</strong> waterquality improvement projects directed by various federal, state and local agencies aswell as the voluntary support <strong>of</strong> local stewards to address water quality problems in thewatershed has elevated it to a higher priority. The development <strong>of</strong> this <strong>TMDL</strong> has notdisrupted the state’s scheduled completion <strong>of</strong> <strong>TMDL</strong>s for high priority waterbodies.Table 1-1 presents the 2002 303(d) list information for <strong>Ashley</strong> <strong>Creek</strong>.Table 1-1. <strong>Ashley</strong> <strong>Creek</strong> listed waterbody characteristics<strong>Water</strong>body NameHUC CodeDesignatedUses*Pollutants <strong>of</strong>Concern<strong>Ashley</strong> <strong>Creek</strong> 14060002 2B, 3B, 4 Total DissolvedSolids, SeleniumPrimary Source<strong>of</strong> ImpairmentSewage lagoonseepage,irrigation returnflows, naturalgeologicformations* 2B = Recreational use and aesthetics: secondary contact recreation;3B = Protected for warm water species <strong>of</strong> game fish and other warm water aquaticlife including the necessary aquatic organisms in their food chain4 = Agriculture: including irrigation <strong>of</strong> crops and stock watering1
<strong>Ashley</strong> <strong>Creek</strong> Selenium and Total Dissolved Solids <strong>TMDL</strong>sFigure 1-1. Location <strong>of</strong> the <strong>Ashley</strong> <strong>Creek</strong> <strong>Water</strong>shedN<strong>Ashley</strong> <strong>Creek</strong> <strong>Water</strong>shedDry ForkSpring <strong>Creek</strong>Steinaker ReservoirStream Beneficial Use SupportNot SupportingOwnershipForest ServiceBLMState <strong>of</strong> UtahPrivateState ParksState Wildlife Reserve<strong>Water</strong>#SMaeser(/ 44#S#SNaples.-, 40Vernal<strong>Ashley</strong> <strong>Creek</strong>Jensen40#S0 10 20 30 Miles2
<strong>Ashley</strong> <strong>Creek</strong> Selenium and Total Dissolved Solids <strong>TMDL</strong>sThe <strong>Ashley</strong> <strong>Creek</strong> watershed encompasses 251,817 acres and is encircled by the UintaMountains to the north, Asphalt Ridge to the west and the Buckskin Hills to the east.Vernal, the county seat, has the highest population within the watershed with anestimated 7,714 residents. Other communities within the watershed include Naples with1,300 residents and Maeser with 2,855 residents (2000 U.S. Census).Based on 1985 land use data from U.S. Geological Survey’s (USGS) GeographicInformation Retrieval Analysis System (GIRAS), the <strong>Ashley</strong> <strong>Creek</strong> watershed iscomposed primarily <strong>of</strong> rangeland and agricultural lands in the lower watershed withforest land dominating the upper watershed. Land use distribution in the watershedsbased on the general categories is listed in Table 1-2 and shown in Figure 1-2. Itshould be noted that the areal extent <strong>of</strong> these land use categories are approximate andwere derived from high altitude aerial photographs with a minimum unit size <strong>of</strong> 40 acresfor natural features. Natural land use features less than 40 acres in size were lumpedinto larger, adjoining land use categories so that the total size <strong>of</strong> small isolated featuressuch as wetlands is underestimated.Table 1-2. Land use distribution in the <strong>Ashley</strong> <strong>Creek</strong> watershedLand UseArea % <strong>of</strong> total area(acres)Residential/Urban 3,764 2%Agriculture 31,013 12%Rangeland 65,326 26%Forest 137,182 55%<strong>Water</strong> 712
<strong>Ashley</strong> <strong>Creek</strong> Selenium and Total Dissolved Solids <strong>TMDL</strong>sFigure 1-2. Land Use Distribution within the <strong>Ashley</strong> <strong>Creek</strong> <strong>Water</strong>shedNStreamsPerennial StreamIntermittent StreamDitch or CanalLand UseAgricultureBarrenForestRangelandResidential / UrbanTundra<strong>Water</strong>Wetland0 10 20 30 Miles4
<strong>Ashley</strong> <strong>Creek</strong> Selenium and Total Dissolved Solids <strong>TMDL</strong>sThe geology <strong>of</strong> the <strong>Ashley</strong> <strong>Creek</strong> watershed has a significant influence on thewatershed’s vegetation communities, land uses, and water quality. The upperwatershed within the Uinta Mountains is predominantly metamorphic quartzite,conglomerate and glacial deposits that have low concentrations <strong>of</strong> salts and metals(Figure 1-3). At mid-elevations, formations that contain high concentrations <strong>of</strong>phosphorus are exposed such as the Park City and Morrison formations. Within thelower watershed, including <strong>Ashley</strong> Valley, formations naturally high in salt and seleniumare found including the Mancos and Chinle Shales.Soils within <strong>Ashley</strong> Valley are formed from alluvial sediments that have beentransported into the valley from the Uinta Mountains and surrounding foothills. Themajority <strong>of</strong> irrigated soils west <strong>of</strong> <strong>Ashley</strong> <strong>Creek</strong> are mainly <strong>of</strong> medium texture and openstructure, with moderate permeability, good available moisture capacity, and relativelylow in soluble salt and alkalinity. Soils derived from Mancos shale, including Billingsclay and Naples loam, are poorly drained and high in soluble salts, selenium andalkalinity (see Figure 4-2, p.27).The climate <strong>of</strong> the <strong>Ashley</strong> <strong>Creek</strong> watershed is typified as temperate and arid in <strong>Ashley</strong>valley and mesic within the Uinta Mountains with rainfall averaging between 7 inchesper year in the valley and 30 inches within the high Uintas (Figure 1-4). The majority <strong>of</strong>precipitation is associated with frontal storms from the Pacific Northwest and falls assnow during the cold winter months. The remaining precipitation is associated withhighly variable thunderstorms originating from the Gulf <strong>of</strong> Mexico during the summerand early fall that can result in localized flash flooding.The vegetation types found within the <strong>Ashley</strong> <strong>Creek</strong> watershed are the result <strong>of</strong> theenvironmental factors discussed above, including agricultural and urban development.Vegetation types within the Uinta Mountains include coniferous forests, Aspen, andbrush types. On the foothills Pinyon pine, Juniper, and sagebrush are the dominantvegetation types. Within <strong>Ashley</strong> Valley, agricultural crops, urban development and saltdesert scrub predominate (Figure 1-5). The following Table 1-3 summarizes the totalarea and relative percentage <strong>of</strong> the different vegetative communities found with thewatershed.5
<strong>Ashley</strong> <strong>Creek</strong> Selenium and Total Dissolved Solids <strong>TMDL</strong>sTable 1-3. Vegetation Communities within the <strong>Ashley</strong> <strong>Creek</strong> watershedVegetation CommunityArea % <strong>of</strong> total area(acres)Lodgepole Pine 53,046 21%Spruce / Fir 40,657 16%Agriculture 34,645 14%Sagebrush 31,790 13%Salt Desert Scrub 26,261 10%Sagebrush / Perennial Grass 22,902 9%Pinyon Pine / Juniper 15,766 6%Alpine 6,627 3%Mountain Fir 6,039 2%Ponderosa Pine 2,959 1%Aspen 2,694 1%Barren 1,974 1%Urban 1,646 1%Pinyon Pine 1,248
<strong>Ashley</strong> <strong>Creek</strong> Selenium and Total Dissolved Solids <strong>TMDL</strong>sFigure 1-3. Geologic Formations <strong>of</strong> the <strong>Ashley</strong> <strong>Creek</strong> <strong>Water</strong>shedNLakesStreamsPerennial StreamIntermittent StreamDitch or CanalGeologic FormationsMancos ShaleChinle ShaleSurficial deposits-alluviumSurficial deposits-older alluviumSurfiical deposits-glacial depositsSurficial deposits-landslidesBishop ConglomerateDuchesne River Fm, Uinta FmGreen River FmMesaverde Group (coal)Dakota and Cedar Mountain FmsMorrison FmCurtis FmNugget SandstoneMoenkopi FmPark City FmWeber SandstoneMorgan FormationHumbug FmMadison LimestoneUinta Mountain Group<strong>Water</strong>0 10 20 30 Miles7
<strong>Ashley</strong> <strong>Creek</strong> Selenium and Total Dissolved Solids <strong>TMDL</strong>sFigure 1-4. Average Annual Precipitation within the <strong>Ashley</strong> <strong>Creek</strong> <strong>Water</strong>shedNLakesMajor StreamsPrecipitation (in.)791113151719212325272931333537Dry ForkSpring <strong>Creek</strong>SteinakerReservoir<strong>Ashley</strong> <strong>Creek</strong>0 10 20 30 Miles8
<strong>Ashley</strong> <strong>Creek</strong> Selenium and Total Dissolved Solids <strong>TMDL</strong>sFigure 1-5. Vegetation Communities within the <strong>Ashley</strong> <strong>Creek</strong> <strong>Water</strong>shedNLakesMajor StreamsGap vegetation<strong>Water</strong>Spruce/FirPonderosa PineLodgepoleMountain FirJuniperPinyonPinyon/JuniperAspenMountain ShrubSagebrushSagebrush/Perennial GrassAlpineDry MeadowWet MeadowBarrenPonderosa Pine/Mountain ShrubSpruce Fir/Mountain ShrubLowland RiparianAgricultureUrbanSalt Desert ScrubDesert GrasslandWetland0 10 20 30 Miles9
<strong>Ashley</strong> <strong>Creek</strong> Selenium and Total Dissolved Solids <strong>TMDL</strong>sThe hydrology <strong>of</strong> <strong>Ashley</strong> <strong>Creek</strong> has been significantly altered as the result <strong>of</strong> waterdevelopments designed to transport and store stream flows for agricultural andmunicipal use. The average annual streamflow <strong>of</strong> <strong>Ashley</strong> <strong>Creek</strong> is 119,400 acre-feet(ac/ft) while the presently developed water supply totals 88,840 ac-ft (Utah <strong>Division</strong> <strong>of</strong><strong>Water</strong> Resources, 1999). There are several diversions on <strong>Ashley</strong> <strong>Creek</strong> and itstributaries including a trans-basin diversion near the headwaters <strong>of</strong> Dry Fork into theMosby Canal, the <strong>Ashley</strong> Upper and Highline Canals and the Fort Thornburgh diversion(Figure 1-6).During low flows, <strong>Ashley</strong> <strong>Creek</strong> is completely diverted into Steinaker Reservoir via theFort Thornburgh Diversion. From this point downstream approximately 6.5 miles thechannel is generally dry during the summer until groundwater base flows, irrigationreturn flows and the outfall <strong>of</strong> the new <strong>Ashley</strong> Valley <strong>Water</strong> Reclamation Facility(AVWRF) re-enter the channel. The AVWRF was constructed in 2001 to replacesewage lagoons located on a bench <strong>of</strong> Mancos Shale above <strong>Ashley</strong> <strong>Creek</strong> that werecontributing high TDS and Se loads into <strong>Ashley</strong> <strong>Creek</strong>.Approximately 6 miles downstream <strong>of</strong> the AVWRF’s outfall is the <strong>Ashley</strong> Oil Field,where five permitted discharge facilities are located. All <strong>of</strong> the facilities are oil wells withwastewater treatment systems that consist <strong>of</strong> oil/water separator tanks and skimmerponds that discharge into the Union Canal. The discharge permits for these facilitiesstipulate the daily maximum concentration <strong>of</strong> TDS is not to exceed 2,200 mg/L.Analysis from two oil wells indicated TDS concentrations between 1,330-1,900 mg/Lwith no selenium detected (Stephens et al., 1992, p.77). The Union Canal is used toirrigate approximately 400 acres <strong>of</strong> alfalfa and grain during irrigation season and forstock watering during the winter. The canal ends below the confluence <strong>of</strong> <strong>Ashley</strong> <strong>Creek</strong>with the Green River. There may be the potential for Union Canal water to reach <strong>Ashley</strong><strong>Creek</strong> during the irrigation season via surface run<strong>of</strong>f, although salinity control efforts arecurrently underway that will line the canal and install improved irrigation methods in thisarea that will greatly reduce the potential for return flows to reach <strong>Ashley</strong> <strong>Creek</strong>.Selenium and TDS loading into <strong>Ashley</strong> <strong>Creek</strong> has been significantly reduced recentlywith the closing <strong>of</strong> the <strong>Ashley</strong> Valley Sewage Lagoons (Naftz, pers. comm.) andirrigation improvements associated with the Salinity Control Program. The remainingpoint source <strong>of</strong> Se and TDS loading into <strong>Ashley</strong> <strong>Creek</strong> includes the seepage from thesewage lagoons. Non-point sources include naturally occurring shallow groundwater,streambank erosion and irrigation return flows. These sources <strong>of</strong> Se and TDS aredescribed in greater detail in Section 3.0.10
<strong>Ashley</strong> <strong>Creek</strong> Selenium and Total Dissolved Solids <strong>TMDL</strong>sFigure 1-6. Hydrology <strong>of</strong> the <strong>Ashley</strong> <strong>Creek</strong> <strong>Water</strong>shedN$Z#Dry ForkMosby CanalDiversion#0 9267500<strong>Ashley</strong> <strong>Creek</strong> <strong>Water</strong>shed#0 USGS Gauges'] <strong>Ashley</strong> Oil Field SitesOld LagoonsStreamsPerennial StreamIntermittent StreamDitch or CanalLakesIrrigated lands<strong>Ashley</strong> Upper andHighline Canal Diversions#0 9266500# $Z#$ZFt. ThornburghDiversionSteinaker Res.Union Canal9271400#0 Old Vernal Lagoons###·<strong>Ashley</strong> <strong>Creek</strong><strong>Ashley</strong> Valley WWTP#0 9271450<strong>Ashley</strong> Oil Field']']'] ##0# 92715500 10 20 30 Miles11
<strong>Ashley</strong> <strong>Creek</strong> Selenium and Total Dissolved Solids <strong>TMDL</strong>s2.0 <strong>Water</strong> <strong>Quality</strong> StandardsUtah’s Standards <strong>of</strong> <strong>Water</strong> <strong>Quality</strong> for <strong>Water</strong>s <strong>of</strong> the State (Utah <strong>Division</strong> <strong>of</strong> <strong>Water</strong><strong>Quality</strong>, 2000) present the applicable water quality criteria for the state <strong>of</strong> Utah. Table2-1 presents Utah’s water quality criteria for the designated uses <strong>of</strong> <strong>Ashley</strong> <strong>Creek</strong>.Table 2-1. Applicable Utah <strong>Water</strong> <strong>Quality</strong> CriteriaParameterSelenium(Dissolved)Total DissolvedSolidsSecondary ContactRecreation (2B)Warm <strong>Water</strong> Aquatic Life (3B) Agriculture (4)- 4 day average (chronic): 5 ug/L Maximum: 50 ug/L1 hour average (acute): 20 ug/L- - 1,200 mg/L2.1 Utah’s Listing Methodology2.1.1 SeleniumTo evaluate attainment <strong>of</strong> water quality standards Utah uses the acute Seleniumcriterion <strong>of</strong> 20 micrograms per liter (ug/L) which is based upon a 1 hour average <strong>of</strong>samples. In the case <strong>of</strong> the UDWQ’s sampling methodology this typically entails asingle grab sample. However, the goal for this <strong>TMDL</strong> is based upon the chronicSelenium criterion <strong>of</strong> 5 ug/L, based upon a 4 day average <strong>of</strong> samples, which is moreapplicable to loading calculations based upon annual average loads. The 303(d) listingcriteria evaluates beneficial use support based on the number <strong>of</strong> violations <strong>of</strong> the waterquality criterion for toxic parameters as listed in Table 2-2. A minimum <strong>of</strong> four samplescollected at least once each season is required for assessment.2.1.2 Total Dissolved SolidsUtah uses the Total Dissolved Solids criterion <strong>of</strong> 1,200 milligrams per liter (mg/L) toevaluate attainment <strong>of</strong> water quality standards. The 303(d) listing criteria evaluatesbeneficial use support based on the number <strong>of</strong> violations <strong>of</strong> the water quality criterion forconventional parameters as listed in Table 2-2. A minimum <strong>of</strong> ten samples collectedthroughout the year (as in an intensive monitoring cycle) is required for assessment.12
<strong>Ashley</strong> <strong>Creek</strong> Selenium and Total Dissolved Solids <strong>TMDL</strong>sTable 2-2. 303 (d) Criteria for Assessing Beneficial Use SupportDegree <strong>of</strong>Use SupportFullPartialNon-supportToxic Parameters*(Se)For any one pollutant, no more thanone violation <strong>of</strong> criterion.For any one pollutant, two or moreviolations <strong>of</strong> the criterion, but violationsoccurred in less than or equal to 10%<strong>of</strong> the samples.For any one pollutant, two or moreviolations <strong>of</strong> the criterion, andviolations occurred in more than 10%<strong>of</strong> the samples.* Based on at least quarterly sampling** Based on at least 10 samples during an intensive monitoring cycleConventional Parameter**(TDS)Criterion exceeded in less than twosamples and in less than 10% <strong>of</strong> thesamples if there were two or moreexceedances.Criterion was exceeded two times, andcriterion was exceeded in more than10% but not more than 25% <strong>of</strong> thesamples.Criterion was exceeded two times, andcriterion was exceeded in more than25% <strong>of</strong> the samples.2.2 <strong>TMDL</strong> Endpoints<strong>TMDL</strong> endpoints represent water quality targets used in quantifying <strong>TMDL</strong>s and theirindividual components. Different <strong>TMDL</strong> endpoints are necessary for each impairmenttype (i.e., Se and TDS). Utah’s chronic numeric water quality criteria for Se and TDSwere used to identify endpoints for <strong>TMDL</strong> development. Based on water qualityobservations in lower <strong>Ashley</strong> <strong>Creek</strong> (see Section 3.3), the entire time period and allflows were assumed to be the critical conditions in the watershed for both Se and TDS.The <strong>TMDL</strong> endpoints applied were the chronic Warm <strong>Water</strong> Aquatic Life criteria for Se<strong>of</strong> 5 ug/L, and the Agriculture criteria for TDS <strong>of</strong> 1,200 mg/L, established in Utah’s waterquality standards (Utah <strong>Division</strong> <strong>of</strong> <strong>Water</strong> <strong>Quality</strong>, 2000).13
<strong>Ashley</strong> <strong>Creek</strong> Selenium and Total Dissolved Solids <strong>TMDL</strong>s3.0 Data Inventory and ReviewThe data used in the development <strong>of</strong> Se and TDS <strong>TMDL</strong>s for <strong>Ashley</strong> <strong>Creek</strong> includephysiographic data that describes the physical conditions <strong>of</strong> the watershed andenvironmental monitoring data that can be used to identify potential pollutant sources,their location, and their loading contribution. Table 3-1 presents the various data typesand data sources reviewed in the watershed.Table 3-1. Inventory <strong>of</strong> data used for the watershed source assessmentData Category Description Data Source(s)Land UseUtah <strong>Division</strong> <strong>of</strong> <strong>Water</strong> ResourcesStream Reach Coverage Utah <strong>Division</strong> <strong>of</strong> <strong>Water</strong> Resources, USGS 7.5” Quads<strong>Water</strong>shedUtah <strong>Division</strong> <strong>of</strong> <strong>Water</strong> ResourcesPhysiographic Stream CharacteristicsUtah <strong>Division</strong> <strong>of</strong> <strong>Water</strong> <strong>Quality</strong>DataSoilsNatural Resources Conservation Service, USGSGeologyUtah Geological Survey303(d) Listed <strong>Water</strong>s Utah <strong>Division</strong> <strong>of</strong> <strong>Water</strong> <strong>Quality</strong>Environmental <strong>Water</strong> <strong>Quality</strong> Data Utah <strong>Division</strong> <strong>of</strong> <strong>Water</strong> <strong>Quality</strong>Monitoring Data UPDES Facilities Utah <strong>Division</strong> <strong>of</strong> <strong>Water</strong> <strong>Quality</strong>Streamflow DataUSGS, Utah <strong>Division</strong> <strong>of</strong> <strong>Water</strong> <strong>Quality</strong>3.1 Flow DataFlow records available for USGS flow gages in <strong>Ashley</strong> <strong>Creek</strong> watershed are listed inTable 3-1 with their gage names, station IDs, and periods <strong>of</strong> record. Only those gageswith records <strong>of</strong> daily flows available for dates since 1970 are shown in Figure 3-1.Table 3-2. USGS Flow Gages in the <strong>Ashley</strong> <strong>Creek</strong> <strong>Water</strong>shedStation IDGage nameStartdateEnd date9266500 ASHLEY CREEK NEAR VERNAL, UT 10/1/14 9/30/019271550 ASHLEY CREEK BL UNION CANAL DIV NR JENSEN, UT 7/9/91 9/30/019271500 ASHLEY CREEK NEAR JENSEN, UTAH 10/1/46 10/1/839271450ASHLEY CREEK BL SADLIER DRAW, NEAR NAPLES,UT11/18/99 9/30/019271400 ASHLEY CREEK NEAR NAPLES, UT 11/23/99 9/30/013.2 <strong>Water</strong> <strong>Quality</strong> DataThe Utah <strong>Division</strong> <strong>of</strong> <strong>Water</strong> <strong>Quality</strong> (UDWQ) maintains a water quality database for 36sites within the <strong>Ashley</strong> <strong>Creek</strong> watershed, 7 <strong>of</strong> these are currently being monitored andare located within the lower watershed as defined by the purposes <strong>of</strong> this study (Table14
<strong>Ashley</strong> <strong>Creek</strong> Selenium and Total Dissolved Solids <strong>TMDL</strong>s3-3). The USGS is currently conducting a detailed study <strong>of</strong> selenium loading in <strong>Ashley</strong><strong>Creek</strong> in cooperation with the US Bureau <strong>of</strong> Reclamation (BOR). The objectives <strong>of</strong> theUSGS/BOR study are to: (1) Quantify the change in salinity and selenium loading to<strong>Ashley</strong> <strong>Creek</strong> that results from closure <strong>of</strong> the sewage lagoons. (2) Determine mobility <strong>of</strong>salinity and selenium under current hydrologic conditions. (3) Determine mobility <strong>of</strong>salinity and selenium under conditions present after closure <strong>of</strong> the sewage lagoons. (4)Examine the role <strong>of</strong> evaporation processes on selenium pathways. The study isanticipated to be completed in September <strong>of</strong> 2004. A summary <strong>of</strong> the data available atthe stations within the lower watershed is provided in Table 3-3, and station locationsare shown in Figure 3-1.15
Dry Fork<strong>Ashley</strong> <strong>Creek</strong> Selenium and Total Dissolved Solids <strong>TMDL</strong>sFigure 3-1. Location <strong>of</strong> <strong>Water</strong> <strong>Quality</strong> Monitoring and Flow Gauge Stations inLower <strong>Ashley</strong> <strong>Creek</strong> <strong>Water</strong>shed493772 #0 #S 9266500N<strong>Ashley</strong> <strong>Creek</strong>493771#S493748#S493744 #0#S 9271400#S UDWQ Monitoring Stations#0 USGS Gauges and Monitoring Sites<strong>Ashley</strong> Valley Sewage LagoonsBeneficial Use SupportFully SupportingNot SupportingStreamsPerennial StreamDitch or CanalIntermittent StreamLakes<strong>Ashley</strong> <strong>Creek</strong> <strong>Water</strong>shed493743#0#S9271450493742 #0 #S 9271500#0 9271550493721 #S0 5 10 15 Miles16
<strong>Ashley</strong> <strong>Creek</strong> Selenium and Total Dissolved Solids <strong>TMDL</strong>sTable 3-3. Inventory <strong>of</strong> Available Data in Lower <strong>Ashley</strong> <strong>Creek</strong> <strong>Water</strong>shedStation Location Type Start date End date CountData from Utah DWQ493772 <strong>Ashley</strong> Ck AB Cnfl / Dry Fork Ambient 6/2/87 5/23/01 43493771 Dry Fork AB Cnfl / <strong>Ashley</strong> Ck Ambient 3/30/95 6/6/01 28493748 <strong>Ashley</strong> Ck NE <strong>of</strong> Vernal at Diamond Mt Rd Xing Ambient 1/17/80 6/6/01 36493744 <strong>Ashley</strong> Ck AB Vernal Lagoons at County Rd Xing Ambient 1/17/80 11/12/97 36493743 <strong>Ashley</strong> Ck N <strong>of</strong> US 40 at County Rd Xing Ambient 7/28/76 6/6/01 27493742 <strong>Ashley</strong> Ck at US 40 Xing Ambient 2/4/75 4/18/96 84493721 <strong>Ashley</strong> Ck AB Cnfl / Green R Ambient 1/17/80 5/1/02 237Data from US Geological Survey9266500 ASHLEY CREEK NEAR VERNAL, UT Ambient 8/12/55 7/17/91 2119271400 ASHLEY CREEK NEAR NAPLES, UT Ambient 1/19/00 9/13/01 209271450ASHLEY CREEK BL SADLIER DRAW, NEARNAPLES, UTAmbient 1/19/00 9/13/01 209271500 ASHLEY CREEK NEAR JENSEN, UTAH Ambient 3/19/47 10/23/91 2079271550ASHLEY CREEK BL UNION CANAL DIV NRJENSEN, UTAmbient 4/6/88 9/26/01 733.2 <strong>Water</strong> <strong>Quality</strong> AnalysisThis section provides a summary <strong>of</strong> the Se and TDS data throughout the watershedcollected from July 1991 to September 2001, as well as discussions on the evaluation <strong>of</strong>any identifiable spatial or temporal patterns in Se and TDS data. The data set waslimited to this 10 year period because it was felt it would be more representative <strong>of</strong>current conditions than if older data were incorporated and is more consistent in terms<strong>of</strong> monitoring frequency and methodology. It is important to recognize that datacollection in support <strong>of</strong> this <strong>TMDL</strong> is an ongoing effort and that as new data is collectedthis <strong>TMDL</strong> will be revised accordingly.3.2.1 Summary <strong>of</strong> Selenium and Total Dissolved Solids ConcentrationsTable 3-4 is a summary <strong>of</strong> the Se data, including the number <strong>of</strong> samples collected at thesite (Count), a summary <strong>of</strong> exceedances <strong>of</strong> the chronic 5 ug/L water quality standard,and the average concentration (Mean).17
<strong>Ashley</strong> <strong>Creek</strong> Selenium and Total Dissolved Solids <strong>TMDL</strong>sTable 3-4. Summary <strong>of</strong> observed Se concentrations in <strong>Ashley</strong> <strong>Creek</strong> from July1991 to September 2001Station Location Count#Exceeding(5 ug/L)%Exceeding(5 ug/L)Mean(ug/L)*Data from UDWQ493772 <strong>Ashley</strong> Ck AB Cnfl / Dry Fork 11 0 0 0.5493771 Dry Fork AB Cnfl / <strong>Ashley</strong> Ck 9 0 0 0.5493748493744493743<strong>Ashley</strong> Ck NE <strong>of</strong> Vernal at DiamondMt Rd Xing<strong>Ashley</strong> Ck AB Vernal Lagoons atCounty Rd Xing<strong>Ashley</strong> Ck N <strong>of</strong> US 40 at County RdXing4 0 0 0.543 2 5 2.344 39 89 36.3493742 <strong>Ashley</strong> Ck at US 40 Xing 6 6 100 48.3493721 <strong>Ashley</strong> Ck AB Cnfl / Green R 49 49 100 39.7Data from USGS9266500 ASHLEY CREEK NEAR VERNAL, UT 1 0 0 0.59271400 ASHLEY CREEK NEAR NAPLES, UT 20 0 0 2.692714509271500ASHLEY CREEK BL SADLIERDRAW, NEAR NAPLES, UTASHLEY CREEK NEAR JENSEN,UTAH20 18 90 46.812 12 100 63.8ASHLEY CREEK BL UNION CANAL927155069 62 90 41.6DIV NR JENSEN, UT* For results with non-detect values ½ the reporting limit (1 ug/L) was used for mean <strong>of</strong> samplecalculationStations where water quality standards for Se are exceeded are all located downstreamfrom the old <strong>Ashley</strong> Valley Sewage Lagoons (see stations 493743 and 9271450 onFigure 3-1). The influence <strong>of</strong> lagoon seepage on Se loading to <strong>Ashley</strong> <strong>Creek</strong> has beenwell documented by USGS studies (Stolp, 1999). Potentiometric groundwater studieshave shown that ground-water flows away from the lagoons and toward <strong>Ashley</strong> <strong>Creek</strong>and Sadlier Draw. The sewage lagoons cover 76 acres and were built directly onMancos Shale derived soils and on the Mancos Shale itself. This Cretaceous formationcontains relatively high concentrations <strong>of</strong> Se. Three distinct areas <strong>of</strong> seepage from thelagoons to <strong>Ashley</strong> <strong>Creek</strong> have been identified in addition to the potential <strong>of</strong> moredispersed areas. In joint studies between the BOR and USGS they found that the “…selenium load in <strong>Ashley</strong> <strong>Creek</strong> that can be directly attributed to seepage from thesewage lagoons may be a high as 1 kilogram per day.” (Stolp 1999) and in anotherstudy stated that, “These seeps flow about 2.5 cubic feet per second (cfs) andcontribute approximately 9,000 tons <strong>of</strong> salt and 2,000 pounds <strong>of</strong> selenium per year to<strong>Ashley</strong> <strong>Creek</strong>.” (USDI, 1997).18
<strong>Ashley</strong> <strong>Creek</strong> Selenium and Total Dissolved Solids <strong>TMDL</strong>sTable 3-5 is a summary <strong>of</strong> the TDS data collected in the watershed, including thenumber <strong>of</strong> samples collected at the site (Count), a summary <strong>of</strong> exceedances <strong>of</strong> the1,200 mg/L water quality standard, and the average concentration (Mean).Table 3-5. Summary <strong>of</strong> observed TDS concentrations in <strong>Ashley</strong> <strong>Creek</strong> from July1991 to September 2001Station Location Count#Exceeding(1,200 mg/L)%Exceeding(1,200 mg/L)Mean(mg/L)Data from UDWQ493772 <strong>Ashley</strong> Ck AB Cnfl / Dry Fork 43 0 0 90493771 Dry Fork AB Cnfl / <strong>Ashley</strong> Ck 28 0 0 399493748493744493743<strong>Ashley</strong> Ck NE <strong>of</strong> Vernal at DiamondMt Rd Xing<strong>Ashley</strong> Ck AB Vernal Lagoons atCounty Rd Xing<strong>Ashley</strong> Ck N <strong>of</strong> US 40 at County RdXing36 1 3 40836 7 19 101824 18 75 1444493742 <strong>Ashley</strong> Ck at US 40 Xing 72 53 74 1604493721 <strong>Ashley</strong> Ck AB Cnfl / Green R 237 185 78 1735Data from USGS9266500 ASHLEY CREEK NEAR VERNAL, UT 1 0 0 939271400 ASHLEY CREEK NEAR NAPLES, UT 20 3 15 992927145092715009271550ASHLEY CREEK BL SADLIERDRAW, NEAR NAPLES, UTASHLEY CREEK NEAR JENSEN,UTAHASHLEY CREEK BL UNION CANALDIV NR JENSEN, UT20 16 80 15721 1 100 18902 2 100 2055Stations where water quality standards for TDS are consistently exceeded are locateddownstream from the old <strong>Ashley</strong> Valley Sewage Lagoons (see stations 493743 and9271450 on Figure 3-1). As with Se, the influence <strong>of</strong> lagoon seepage on TDS loadingto <strong>Ashley</strong> <strong>Creek</strong> has been well documented by BOR and USGS studies (Stolp 1999).Mancos shale, on which the lagoons are constructed, contains as much as 2 percentsoluble salts by weight. While inflow to the sewage lagoons has a dissolved-solidsconcentration <strong>of</strong> about 600 mg/L, as the wastewater seeps down and flows through andacross the Mancos Shale, salinity and selenium concentrations increase dramatically.TDS concentrations from the seeps have been measured as high as 25,000 milligramsper liter.19
<strong>Ashley</strong> <strong>Creek</strong> Selenium and Total Dissolved Solids <strong>TMDL</strong>s3.2.2 Seasonal Effects on Se and TDS ConcentrationsIn Figures 3-2 and 3-3, the average monthly Se and TDS values are plotted to show themonthly and seasonal patterns for <strong>Ashley</strong> <strong>Creek</strong> at its confluence with the Green River(Storet 493721). Because <strong>of</strong> the relationship between instream concentrations anddiluting flows, average monthly flows from the nearby USGS gauge (9271550, <strong>Ashley</strong><strong>Creek</strong> below Union Canal diversion) are also included.Figure 3-2. Average monthly Se concentrations in <strong>Ashley</strong> <strong>Creek</strong> aboveconfluence with the Green River (Storet site 493721).Se (ug/L)706050403020100Jan Feb Mar Apr May June July Aug Sept Oct Nov Dec350300250200150100500Flow (cfs)Avg FlowAvg SeFigure 3-3. Average monthly TDS concentrations in <strong>Ashley</strong> <strong>Creek</strong> aboveconfluence with the Green River (Storet site 493721).TDS (mg/L)24002000160012008004000Jan Feb Mar Apr May June July Aug Sept Oct Nov Dec350300250200150100500Flow (cfs)Avg FlowAvg TDS20
<strong>Ashley</strong> <strong>Creek</strong> Selenium and Total Dissolved Solids <strong>TMDL</strong>sThe relationship between flows and Se and TDS concentrations is readily apparent fromthe figures above. During spring run<strong>of</strong>f (May - June) concentrations are relatively low,gradually rising throughout the rest <strong>of</strong> the year. This pattern suggests that Se and TDSloading occurs throughout the year and that concentrations are primarily a function <strong>of</strong>the availability <strong>of</strong> diluting stream flows, or hydrology, rather than seasonality.3.2.3 Flow Versus Se and TDS ConcentrationsTo determine how much influence stream flow has on Se and TDS concentrations thetwo variables were plotted against each other and regression lines were calculated asshown in Figures 3-4 and 3-5. The coefficient <strong>of</strong> determination (R 2 ) indicates thestrength <strong>of</strong> the correlation between the two variables (Se or TDS versus flow).Figure 3-4. Plot <strong>of</strong> Se versus flow in <strong>Ashley</strong> <strong>Creek</strong> above confluence with theGreen River (Storet site 493721).Se (ug/L)1009080706050403020100R 2 = 0.50 50 100 150 200 250Flow (cfs)Figure 3-4. Plot <strong>of</strong> TDS versus flow in <strong>Ashley</strong> <strong>Creek</strong> above confluence with theGreen River (Storet site 493721).3500TDS (mg/L)30002500200015001000R 2 = 0.750000 50 100 150 200 250Flow (cfs)21
<strong>Ashley</strong> <strong>Creek</strong> Selenium and Total Dissolved Solids <strong>TMDL</strong>sThe plot <strong>of</strong> TDS versus flow shows a more identifiable trend (R 2 = 0.7) than the Se datashow (R 2 = 0.5). However, both plots show the general trend <strong>of</strong> decreasing Se andTDS concentrations with increased flow. Se and TDS concentrations are likely thehighest during baseflow conditions when groundwater with elevated concentrationsprovides the majority <strong>of</strong> the streamflow.3.3 Critical ConditionsThe critical condition represents the time <strong>of</strong> year or hydrologic event under which waterquality standards are exceeded. Analyzing the <strong>TMDL</strong> in consideration <strong>of</strong> the criticalcondition ensures that water quality standards are met under all conditions. When thesource <strong>of</strong> a pollutant is fairly constant in its frequency and magnitude, low flow (i.e., theperiod <strong>of</strong> minimum dilution) is typically the critical condition for the receiving water.When pollutant sources are driven by precipitation (e.g., run<strong>of</strong>f from urban oragricultural land), they affect a receiving water during or just following a storm event,making high flows the critical condition.Flow patterns and Se and TDS concentrations were reviewed to evaluate the criticalconditions for <strong>Ashley</strong> <strong>Creek</strong>. Flows in <strong>Ashley</strong> <strong>Creek</strong> were sorted by magnitude anddivided into percentiles that were matched with the associated Se and TDS dataincluding minimum, average, and maximum Se and TDS concentrations for each flowpercentile. This evaluation indicated that elevated Se concentrations and violations <strong>of</strong>water quality standards occurred in all flow percentiles while elevated TDSconcentrations and violations <strong>of</strong> water quality standards occurred up to the 90 th flowpercentile as shown in Tables 3-6 and 3-7.22
<strong>Ashley</strong> <strong>Creek</strong> Selenium and Total Dissolved Solids <strong>TMDL</strong>sTable 3-6. Se data results by flow percentile groupFlowSePercentileAvg.Flow(cfs)Maximum(ug/L)Mean(ug/L)Minimum(ug/L)StandardDeviationMean +DeviationMean -Deviation# <strong>of</strong>Obs.0-10% 1 47 26 13 15 41 11 410-20% 3 73 43 29 20 63 23 420-30% 7 101 52 30 25 77 27 730-40% 12 60 57 53 5 62 47 240-50% 17 80 50 22 23 73 27 550-60% 20 63 51 25 15 66 36 560-70% 23 70 45 16 27 72 18 370-80% 34 50 39 30 9 48 30 780-90% 81 33 18 6 12 30 6 590-100% 167 14 9 6 4 13 5 3Table 3-7. TDS data results by flow percentile groupFlowTDSPercentileFlow(cfs)Maximum(mg/L)Mean(mg/L)Minimum(mg/L)StandardDeviationMean +DeviationMean -Deviation# <strong>of</strong>Obs.0-10% 1 3104 1835 1038 794 2629 1041 710-20% 3 2484 2020 1632 332 2352 1688 820-30% 7 2464 1977 1408 315 2292 1662 1030-40% 12 2158 1958 1852 136 2094 1822 440-50% 17 2080 1732 1258 297 2029 1435 950-60% 20 2188 1853 1630 173 2026 1680 860-70% 24 2118 1880 1318 325 2205 1555 570-80% 32 2118 1564 852 341 1905 1223 1380-90% 72 1402 955 376 400 1355 555 990-100% 562 598 308 140 153 461 155 823
<strong>Ashley</strong> <strong>Creek</strong> Selenium and Total Dissolved Solids <strong>TMDL</strong>sFigures 3-5 and 3-6 present the Se and TDS data at station 493721 (<strong>Ashley</strong> <strong>Creek</strong>above confluence with Green River) and the water quality criterion <strong>of</strong> 5 ug/L and 1,200mg/L respectively.Figure 3-5. Monthly distribution <strong>of</strong> Se concentrations at station 493721 (<strong>Ashley</strong><strong>Creek</strong> above confluence with the Green River).120100Se (ug/L)8060402000 1 2 3 4 5 6 7 8 9 10 11 12 13MonthFigure 3-6. Monthly distribution <strong>of</strong> TDS concentrations at station 493721 (<strong>Ashley</strong><strong>Creek</strong> above confluence with the Green River).TDS (mg/L)360032002800240020001600120080040000 1 2 3 4 5 6 7 8 9 10 11 12 13MonthAs discussed in Section 3.2 and shown in Figure 3-5, violations <strong>of</strong> the Se water qualitystandard occurs during all months <strong>of</strong> the year. <strong>Water</strong> quality standards for TDS (Figure3-6) were also violated throughout the year. Since water quality standards areexceeded in all flows and throughout the year the critical condition is and the <strong>TMDL</strong>s willbe based on an analysis <strong>of</strong> all flow conditions and will not isolate specific time periods.24
<strong>Ashley</strong> <strong>Creek</strong> Selenium and Total Dissolved Solids <strong>TMDL</strong>s4.0 Source AssessmentThe evaluation <strong>of</strong> Se and TDS sources in the <strong>Ashley</strong> <strong>Creek</strong> watershed included pointand non-point sources. The source assessment is an important part <strong>of</strong> defining the<strong>TMDL</strong> for any pollutant. The data and the sources have to be understood to be able todistinguish between point and non-point source impacts. Typically, the point sourceimpacts can be quantified through permit limits and/or direct measurements at a certainlocation. A source assessment was performed on the <strong>Ashley</strong> <strong>Creek</strong> watershed todetermine the predominant sources <strong>of</strong> Se and TDS loading to the system. Se and TDSare related, so it is assumed that the sources contributing to high Se concentrations in<strong>Ashley</strong> <strong>Creek</strong> are the same sources that contribute to increased TDS concentrations.Datasets and references used in assessing the pollutant sources in the watershedinclude National Irrigation <strong>Water</strong> <strong>Quality</strong> Program Studies conducted by the BOR andthe USGS, USDA Salinity Control Program Reports, the Uintah Basin Area-wide <strong>Water</strong><strong>Quality</strong> Management Plan (Section 208), stream networks and characteristics,watershed boundaries, Utah Pollutant Discharge Elimination System (UPDES)permitted locations, and soil types and characteristics.4.1 Assessment <strong>of</strong> Point SourcesSix permitted discharge facilities are located within the <strong>Ashley</strong> <strong>Creek</strong> watershed. The<strong>Ashley</strong> Valley Sewage Lagoons (UPDES Permit #UT0024511) have recently beenreplaced by the <strong>Ashley</strong> Valley <strong>Water</strong> Reclamation Facility (AVWRF), a mechanicalwastewater treatment plant (UPDES Permit #UT0025348). Construction <strong>of</strong> the AVWRFbegan in May 1999 and was completed in May <strong>of</strong> 2001. Since this <strong>TMDL</strong> analysis isbased on data collected prior to the completion <strong>of</strong> the AVWRF, Se and TDS loadingfrom the lagoons will be included in the analysis. However, since the lagoons are nolonger in operation they will not be allocated any loading.The other five facilities are oil wells all located approximately seven miles southeast <strong>of</strong>Vernal within the <strong>Ashley</strong> Oil Field. All five facilities’ wastewater treatment systemsconsist <strong>of</strong> oil/water separator tanks which discharge to skimmer ponds and thence tothe Union Irrigation Canal which ends near the Green River downstream <strong>of</strong> <strong>Ashley</strong><strong>Creek</strong> (see Figure 1-6). The permits specify that discharge from these facilities mayreach <strong>Ashley</strong> <strong>Creek</strong>, presumably from irrigation return flows, however a salinity controlproject currently underway will line the canal and install improved irrigation systems thatwill greatly reduce the potential for return flows to reach <strong>Ashley</strong> <strong>Creek</strong>. Therefore the oilwells are not considered a significant source <strong>of</strong> Se or TDS loading into <strong>Ashley</strong> <strong>Creek</strong>.4.1.1 <strong>Ashley</strong> Valley Sewage LagoonsThe <strong>Ashley</strong> Valley Sewage Lagoons were constructed in 1981 to replace a trickling filterplant that discharged directly to <strong>Ashley</strong> <strong>Creek</strong>. The facility consists <strong>of</strong> 76 acres <strong>of</strong>treatment lagoons, a winter storage reservoir, and pumping facilities. After the facilitybegan operating, the lagoons began to leak at a high rate. Several seeps surfaced25
<strong>Ashley</strong> <strong>Creek</strong> Selenium and Total Dissolved Solids <strong>TMDL</strong>salong the bluff between <strong>Ashley</strong> <strong>Creek</strong> and the lagoons. In 1987, seepage from thelagoons was estimated at 3.3 cfs (Stephens et al., 1992, p. 73). As the water flowedthrough the soil, it dissolved and carried salts and selenium. High concentrations <strong>of</strong>selenium in <strong>Ashley</strong> <strong>Creek</strong> has had serious adverse environmental impacts on local fishand waterfowl populations. Because <strong>of</strong> the elevated levels <strong>of</strong> selenium, the Utah<strong>Division</strong> <strong>of</strong> <strong>Water</strong> <strong>Quality</strong> and the Tri-County Health Department issued a healthadvisory in 1991 cautioning people about consumption <strong>of</strong> fish or waterfowl from thearea.4.2 Assessment <strong>of</strong> Non-Point SourcesNon-point sources represent contributions from diffuse, non-permitted sources. Thepredominant land use in the <strong>Ashley</strong> <strong>Creek</strong> watershed is irrigated agriculture and grazinglands. Possible non-point sources <strong>of</strong> Se and TDS to <strong>Ashley</strong> <strong>Creek</strong> include irrigationreturn flows and streambank erosion which are discussed in more detail in the followingsections.4.2.1 Irrigation Return FlowsSignificant natural sources <strong>of</strong> Se and TDS exist in the watershed. The geology <strong>of</strong> thelower portion <strong>of</strong> the basin is dominated by the highly saline Mancos shale formation.Whenever water comes into contact with this formation, or the saline soils formed fromit, selenium and other salts are dissolved and transported to <strong>Ashley</strong> <strong>Creek</strong> via surfacerun<strong>of</strong>f or shallow groundwater. There have been numerous studies within the <strong>Ashley</strong><strong>Creek</strong> watershed on the causes and sources <strong>of</strong> salt and selenium loading and allgenerally agree that, other than seepage from the sewage lagoons, the most significanthuman caused sources include irrigation return flows and field drains. However, due toimplementation <strong>of</strong> salinity control efforts in the last 20 years a significant amount <strong>of</strong> thereturn flows have been greatly reduced or eliminated. Salinity control practices typicallyentail converting from flood irrigation to sprinklers or gated pipe and lining or pipingditches to reduce deep percolation.According to data collected from ephemeral drainages to the west <strong>of</strong> <strong>Ashley</strong> <strong>Creek</strong> thatconstitute most <strong>of</strong> the potential return flows, some Se and TDS loading occurs. Ofparticular concern is the Mantle Gulch drainage that crosses US-40 just west <strong>of</strong> <strong>Ashley</strong><strong>Creek</strong>. In July <strong>of</strong> 1988 a Se concentration <strong>of</strong> 540 mg/L was measured where MantleGulch flows into <strong>Ashley</strong> <strong>Creek</strong>, although no accompanying flow was given (Stephens etal., 1992). However, when considered in light <strong>of</strong> the Se and TDS loading from thesewer lagoons, the loads originating from irrigation return flows pale in comparison.Which is not to say that potential Se and TDS loading attributable to irrigation returnflows can be dismissed as insignificant, rather at the present time there is insufficientinformation to conclusively state what the allocation should be. As the sewer lagoonsdry up and loading decreases the proportionate contribution from irrigation return flowsmay increase, thereby justifying the implementation <strong>of</strong> additional best managementpractices in this area.26
<strong>Ashley</strong> <strong>Creek</strong> Selenium and Total Dissolved Solids <strong>TMDL</strong>sAs noted in a recent study conducted by the USGS in western Colorado (Butler, 2001),TDS concentrations in return flows tend to remain relatively constant regardless <strong>of</strong> theamount <strong>of</strong> flow. In other words, salinity control efforts have been effective in reducingSe and TDS loading through reduction <strong>of</strong> return flows but not in reducingconcentrations, which requires dilution with high quality water.4.2.2 Streambank ErosionSe and TDS loading attributable to streambank erosion is highly variable from year toyear, depending primarily on the magnitude and duration <strong>of</strong> peak flows and thestreambank’s soil type.Figure 4-1. Extensive cut bank along <strong>Ashley</strong> <strong>Creek</strong>Soils in the area <strong>of</strong> lower <strong>Ashley</strong> <strong>Creek</strong> are derived from alluvial material and fromMancos Shale. The two soil types associated with high Se and TDS concentrationsinclude the Billings clay and Naples loam (Figure 4-2). Se concentrations <strong>of</strong> 2,000 to8,000 ppb have been reported for six samples <strong>of</strong> Billings clay loam from WesternColorado, and an alkaline crust resulting from seepage through Billings clay loamcontained a Se concentration <strong>of</strong> 52,000 ppb (Williams and Byers, 1935).27
<strong>Ashley</strong> <strong>Creek</strong> Selenium and Total Dissolved Solids <strong>TMDL</strong>sFigure 4-2. Locations <strong>of</strong> Billings clay and Naples loam soils along <strong>Ashley</strong> <strong>Creek</strong>From “Detailed Study <strong>of</strong> Selenium and Selected Elements in <strong>Water</strong>, Bottom Sediment, and BiotaAssociated with Irrigation Drainage in the Middle Green River Basin, Utah, 1988-90.” USGS <strong>Water</strong>Resources Investigations Report 92-4084.28
<strong>Ashley</strong> <strong>Creek</strong> Selenium and Total Dissolved Solids <strong>TMDL</strong>s5.0 Technical ApproachEstablishing a relationship between the in-stream water quality targets and sourceloading is a critical component <strong>of</strong> <strong>TMDL</strong> development. Identifying the cause-and-effectrelationship between pollutant loads and the water quality response is necessary toevaluate the loading capacity <strong>of</strong> the receiving waterbodies. The loading capacity is theamount <strong>of</strong> pollutant that can be assimilated by the waterbody while still attaining andmaintaining water quality standards. In other words, the load capacity, or maximumallowable load, is calculated by multiplying existing flows by the water quality standard.This section discusses the estimation <strong>of</strong> the loading capacity and existing Se and TDSloadings in the <strong>Ashley</strong> <strong>Creek</strong> watershed.Together with historical flow records, the water quality target for Se and TDS was usedto establish loading capacities for all flows expected to occur in <strong>Ashley</strong> <strong>Creek</strong> in atypical year. Existing loads also were estimated for comparison to loading capacitiesand evaluation <strong>of</strong> necessary load reductions. Existing loads were calculated based onavailable monitoring data for Se, TDS and flow. The following sections discuss theapproaches used to estimate loading capacity and existing Se and TDS loadings for<strong>Ashley</strong> <strong>Creek</strong>.A percent ranking model based on flow was used to establish associated Se and TDSloads. The available flow record at the USGS Gage 9271550 (<strong>Ashley</strong> <strong>Creek</strong> belowUnion Canal diversion near Jensen) was used to develop the flow duration curves andthe loading analyses for the <strong>TMDL</strong>s. The observed daily USGS flows (7/91 to 9/01)were ranked in order <strong>of</strong> magnitude and each flow was assigned a percent that reflectsthe chance <strong>of</strong> a flow less than or equal to it (Table 5-1). To evaluate the allowable Seand TDS loadings for the watershed, each flow was then multiplied by the 5 ug/L or1,200 mg/L criterion respectively to calculate a corresponding maximum loading limit foreach flow. The individual lines were plotted to present a loading capacity line by flowpercentile, as shown in Figures 5-1 and 5-2.29
<strong>Ashley</strong> <strong>Creek</strong> Selenium and Total Dissolved Solids <strong>TMDL</strong>sTable 5-1. Summary <strong>of</strong> flows by percentile at USGS Gage 9271550 (<strong>Ashley</strong> <strong>Creek</strong>below Union Canal diversion near Jensen).PercentileAverage Flow (cfs)Selenium0%-10% 1.1 1.110%-20% 3.2 3.320%-30% 7.1 7.530%-40% 12.5 12.340%-50% 17.4 16.950%-60% 20 19.960%-70% 23 24.470%-80% 33.6 32.480%-90% 81.4 72.390%-100% 167.3 561.6Total DissolvedSolidsFigure 5-1. Loading capacity <strong>of</strong> selenium for all observed flows in <strong>Ashley</strong> <strong>Creek</strong>.100.01000010.01000Se Load (lb/day)1.00.10.0100101Flow (cfs)0.00.10.00.010% 10% 20% 30% 40% 50% 60% 70% 80% 90% 100%Flow PercentileSe Load CapacityFlow30
<strong>Ashley</strong> <strong>Creek</strong> Selenium and Total Dissolved Solids <strong>TMDL</strong>sFigure 5-2. Loading capacity <strong>of</strong> total dissolved solids for all observed flows in<strong>Ashley</strong> <strong>Creek</strong>.1.E+0810000TDS Load (lb/day)1.E+071.E+061.E+051.E+041.E+031.E+021.E+0110001001010.1Flow (cfs)1.E+000.010% 10% 20% 30% 40% 50% 60% 70% 80% 90% 100%Flow PercentileTDS Load CapacityFlow5.2 Estimation <strong>of</strong> Existing LoadingExisting loadings <strong>of</strong> Se and TDS for the <strong>Ashley</strong> <strong>Creek</strong> watershed were calculated usingmonitoring data for station 493721 (<strong>Ashley</strong> <strong>Creek</strong> above confluence with Green River)and flow measurements from USGS gage 9271550 recorded on the same day.Although the USGS has collected Se samples during the same time period it wasdecided that it would be more appropriate for this analysis to use the UDWQ data setsince these data were used for assessing and listing <strong>Ashley</strong> <strong>Creek</strong> and UDWQ willcontinue to monitor it indefinitely, allowing more accurate tracking <strong>of</strong> changes in waterquality over the long term. The average Se concentration <strong>of</strong> the two data sets are notsignificantly different, the average over the 10 year analysis period <strong>of</strong> USGS data is40.3 ug/L while the UDWQ Se average is 39.7 ug/L. This section presents the methodsand results <strong>of</strong> the analysis <strong>of</strong> existing Se and TDS loadings in the watershed.5.2.1 SeleniumExisting Se loadings for <strong>Ashley</strong> <strong>Creek</strong> were calculated using Daily Se loads for <strong>Ashley</strong><strong>Creek</strong> were calculated by multiplying the flow by the associated Se concentrationcollected on the same day (Figure 5-1). The calculated existing loads were thengrouped based on the 10 flow percentile groupings from Table 5-1. Table 5-2summarizes the maximum, minimum, average, and standard deviation <strong>of</strong> existing Seloads for each <strong>of</strong> the 10 percentile flow groups for <strong>Ashley</strong> <strong>Creek</strong>.Average Se loads for each flow percentile group were used to establish a linerepresenting existing loading for all flows for <strong>Ashley</strong> <strong>Creek</strong>. Figure 5-3 presents allindividual existing Se loadings for <strong>Ashley</strong> <strong>Creek</strong> and the representative loading linearranged by flow percentile.31
<strong>Ashley</strong> <strong>Creek</strong> Selenium and Total Dissolved Solids <strong>TMDL</strong>sTable 5-2. Selenium loading statistics for the <strong>Ashley</strong> <strong>Creek</strong> watershed.FlowPercentileAvg.Flow(cfs)No. <strong>of</strong>Loads 1 Violations Max(lbs/day)Mean+Std(lbs/day)Existing load summaryMean(lbs/day)Mean-Std(lbs/day)Min(lbs/day)LoadCapacity 2(lbs/day)0%-10% 1.1 4 4 0.30 0.31 0.17 0.03 0.02 0.0310%-20% 3.2 4 4 1.57 1.31 0.78 0.25 0.47 0.0920%-30% 7.1 7 7 3.54 2.78 1.94 1.10 1.06 0.1930%-40% 12.5 2 2 4.53 4.82 3.84 2.86 3.14 0.3440%-50% 17.4 5 5 7.34 6.74 4.65 2.56 2.14 0.4750%-60% 20 5 5 6.47 7.00 5.46 3.92 2.83 0.5460%-70% 23 3 2 8.31 8.78 5.54 2.30 1.98 0.6270%-80% 33.6 7 7 9.44 8.74 7.07 5.40 5.18 0.9180%-90% 81.4 5 2 14.89 12.31 7.58 2.85 2.49 2.2090%-100% 167.3 3 0 9.44 9.34 7.83 6.32 6.43 4.511 Number <strong>of</strong> loads calculated using flows within the specified percentile range. This number reflects the number <strong>of</strong>available paired Se and flow measurements available within the specific flow range.2 Based on water quality criterion <strong>of</strong> 5 ug/L.Figure 5-3. Existing Selenium loading by flow percentile for <strong>Ashley</strong> <strong>Creek</strong>Se Load (lbs/day)16141210864200% 10% 20% 30% 40% 50% 60% 70% 80% 90% 100%Flow PercentileExisting Se LoadsAverage Se Load5.2.2 Total Dissolved SolidsAs for Se, existing TDS loadings for <strong>Ashley</strong> <strong>Creek</strong> were calculated using monitoringdata for station 493721 (<strong>Ashley</strong> <strong>Creek</strong> above confluence with Green River) and flowmeasurements from USGS gage 9271550. Daily TDS loads for <strong>Ashley</strong> <strong>Creek</strong> werecalculated by multiplying the flow by the associated TDS concentration (Figure 5-2).32
<strong>Ashley</strong> <strong>Creek</strong> Selenium and Total Dissolved Solids <strong>TMDL</strong>sThe calculated existing loads were then grouped based on the 10 flow percentilegroupings from Table 5-1. Table 5-3 summarizes the maximum, minimum, average,and standard deviation <strong>of</strong> existing TDS loads for each <strong>of</strong> the 10 percentile flow groupsfor <strong>Ashley</strong> <strong>Creek</strong>.Average TDS loads for each flow percentile group were used to establish a linerepresenting existing loading for all flows for <strong>Ashley</strong> <strong>Creek</strong>. Figure 5-3 presents allindividual existing Se loadings for <strong>Ashley</strong> <strong>Creek</strong> and the representative loading linearranged by flow percentile.Table 5-3. Total Dissolved Solids loading statistics for the <strong>Ashley</strong> <strong>Creek</strong>watershed.FlowPercentileFlow(cfs)No. <strong>of</strong>Loads 1 Violations Max(lbs/day)Mean+Std(lbs/day)Existing load summaryMean(lbs/day)Mean-Std(lbs/day)Min(lbs/day)LoadCapacity 2(lbs/day)0%-10% 1.1 7 4 27,207 19,116 10,916 2,716 1,962 8,60810%-20% 3.3 8 8 49,709 45,693 36,472 27,251 24,647 24,14320%-30% 7.5 10 10 113,377 105,330 80,888 56,446 43,281 50,03330%-40% 12.3 4 4 162,957 153,264 129,866 106,468 113,205 82,13640%-50% 16.9 9 9 201,943 182,924 157,086 131,248 122,137 107,50950%-60% 19.9 8 8 224,230 212,354 198,165 183,976 184,629 128,54460%-70% 24.4 5 5 308,448 305,980 249,136 192,292 163,507 156,82970%-80% 32.4 13 12 354,145 320,176 269,804 219,432 179,224 209,90480%-90% 72.3 9 3 480,348 441,586 342,673 243,760 172,385 418,64390%-100% 561.6 8 0 2,426,120 1,455,152 750,491 45,830 254,856 3,352,0591 Number <strong>of</strong> loads calculated using flows within the specified percentile range. This number reflects the number <strong>of</strong>available paired TDS and flow measurements available within the specific flow range.2 Based on water quality criterion <strong>of</strong> 1,200 mg/L.33
<strong>Ashley</strong> <strong>Creek</strong> Selenium and Total Dissolved Solids <strong>TMDL</strong>sFigure 5-4. Existing Total Dissolved Solids loading by flow percentile for <strong>Ashley</strong><strong>Creek</strong>.TDS Load (lbs/day)1,000,000900,000800,000700,000600,000500,000400,000300,000200,000100,00000% 10% 20% 30% 40% 50% 60% 70% 80% 90% 100%Flow PercentileExisting TDS LoadsAverage TDS Load5.3 Comparison <strong>of</strong> Existing Loading and Loading CapacityTo evaluate the load reductions and controls necessary to maintain water qualitystandards in <strong>Ashley</strong> <strong>Creek</strong>, the existing Se and TDS loadings in each flow percentilegroup were compared to their respective loading capacities. Figures 5-5 and 5-6present the estimated loading capacity curve and existing loadings based on monitoringdata, arranged by flow percentile, for Se and TDS, respectively. Table 5-2 presents theexisting loadings for the Se, grouped into the 10 percentile ranges, and the discreteloading capacity based on the 5 ug/L target and average flow for the percentile grouping(e.g., 1.1 ft 3 /s multiplied by the 5 ug/L criterion, multiplied by conversion factors equals0.03 lb/d). Table 5-3 presents the existing loadings and loading capacity for TDS foreach flow range. For Se, all flow percentile groups have a maximum load above theload capacity limit, whereas for TDS all but the highest two flow percentile groupsexceed the load capacity, indicating the need for reductions <strong>of</strong> Se and TDS loads atmost flows for <strong>Ashley</strong> <strong>Creek</strong>.By plotting the loading capacities and individual existing loads by flow percentile, thespecific dates <strong>of</strong> flows and loads are removed and the curve can be applied to differenttime periods. The curve illustrates an average year, with all flows and associatedloadings expected to occur during a typical year. Therefore, Figure 5-5 presents theestimated annual existing loading and loading capacity <strong>of</strong> Se, and Figure 5-6 presentsthe estimated annual existing loading and loading capacity <strong>of</strong> TDS.34
<strong>Ashley</strong> <strong>Creek</strong> Selenium and Total Dissolved Solids <strong>TMDL</strong>s6.0 <strong>TMDL</strong> Allocation6.1 Description <strong>of</strong> <strong>TMDL</strong> AllocationA <strong>TMDL</strong> is composed <strong>of</strong> the sum <strong>of</strong> individual waste load allocations (WLAs) for pointsources and load allocations (LAs) for non-point sources and natural background levels.In addition, the <strong>TMDL</strong> must include a margin <strong>of</strong> safety (MOS), either implicitly orexplicitly, that accounts for the uncertainty in the relationship between pollutant loadsand the quality <strong>of</strong> the receiving waterbody. Conceptually, this definition is denoted bythe equation<strong>TMDL</strong> = Σ WLAs + Σ LAs + MOSThe <strong>TMDL</strong> is the total amount <strong>of</strong> a pollutant that can be assimilated by the receivingwater while still achieving water quality standards. The <strong>TMDL</strong>s for Se and TDS for<strong>Ashley</strong> <strong>Creek</strong> are expressed on a mass loading basis.6.2 Selecting a Margin <strong>of</strong> SafetyThe MOS is a required part <strong>of</strong> the <strong>TMDL</strong> development process. There are two basicmethods for incorporating the MOS (USEPA, 1991). Implicit methods incorporate theMOS using conservative model assumptions to develop allocations. Explicit methodsspecify a portion <strong>of</strong> the total <strong>TMDL</strong> as the MOS, allocating the remainder to sources.For the <strong>Ashley</strong> <strong>Creek</strong> <strong>TMDL</strong>s, the MOS was included explicitly by allocating 5 percent <strong>of</strong>the loading capacity to the MOS.6.3 Allocation SummaryThe <strong>TMDL</strong>s for <strong>Ashley</strong> <strong>Creek</strong> have been developed for the range <strong>of</strong> flows measuredfrom July 1991 to September 2001 at the USGS gage 9271550 (<strong>Ashley</strong> <strong>Creek</strong> belowUnion Canal diversion near Jensen). Using the observed flows and the targets <strong>of</strong> 5ug/L Se and 1,200 mg/L TDS, average annual loading capacities were calculated.Average existing Se and TDS loadings were developed within each flow percentilegroup using the USGS flow data and the corresponding observed water quality data atUDWQ’s <strong>Ashley</strong> <strong>Creek</strong> above confluence with Green River (493721) monitoring site.These flow percentile group loadings were used to calculate the annual existing load(average daily loading multiplied by 365). These existing loads were compared to theloading capacity, and necessary reductions were calculated. Tables 6-1 and 6-2provide summaries <strong>of</strong> the Se and TDS <strong>TMDL</strong>s for <strong>Ashley</strong> <strong>Creek</strong>, respectively.Section 6.4 provides more detail on the calculation <strong>of</strong> the loading capacity anddetermination <strong>of</strong> the allocations.36
<strong>Ashley</strong> <strong>Creek</strong> Selenium and Total Dissolved Solids <strong>TMDL</strong>sTable 6-1. Summary <strong>of</strong> Se <strong>TMDL</strong> for <strong>Ashley</strong> <strong>Creek</strong> watershed.SourceAnnual existingSe loadEstimated percentreductionAnnual allocated SeloadNon-point Sources:<strong>Ashley</strong> <strong>Creek</strong> watershed 271 lbs/yr 0 % 271 lbs/yrPoint Sources:<strong>Ashley</strong> Valley <strong>Water</strong>Reclamation Facility(UPDES #UT0025348)<strong>Ashley</strong> Valley SewerLagoons (UPDES#UT0024511)10 lbs/yr 0 % 72 lbs1,356 lbs/yr 100 % 0 lbs/yrTotal Existing Load 1,637 lbs/yr Load Allocation 271 lbs/yrWasteload Allocation72 lbs/yrTotal Annual Load Reduction = 78% Margin <strong>of</strong> Safety 1 18 lbs/yr<strong>TMDL</strong> = Loading Capacity = 361 lbs/yr1 Margin <strong>of</strong> safety. The MOS was included in the analysis explicitly by allocating 5 percent <strong>of</strong> the loadingcapacity to the MOS.Table 6-2. Summary <strong>of</strong> TDS <strong>TMDL</strong> for <strong>Ashley</strong> <strong>Creek</strong> watershed.SourceNon-point Sources:Annual existingTDS loadEstimated percentreductionAnnual allocated TDSload<strong>Ashley</strong> <strong>Creek</strong> watershed 25,580 tons/yr 7 % 23,806 tons/yrPoint Sources:<strong>Ashley</strong> Valley <strong>Water</strong>Reclamation Facility(UPDES #UT0025348)<strong>Ashley</strong> Valley SewerLagoons (UPDES#UT0024511)1,667 tons/yr 0 % 3,794 tons/yr9,000 tons/yr 100 % 0 tons/yrTotal Existing Load 36,247 tons/yr Load Allocation 23,806 tons/yrWasteload Allocation3,794 tons/yrTotal Annual Load Reduction = 20% Margin <strong>of</strong> Safety 1 1,453 tons/yr<strong>TMDL</strong> = Loading Capacity = 29,053 tons/yr1 Margin <strong>of</strong> safety. The MOS was included in the analysis explicitly by allocating 5 percent <strong>of</strong> the loadingcapacity to the MOS.37
<strong>Ashley</strong> <strong>Creek</strong> Selenium and Total Dissolved Solids <strong>TMDL</strong>s6.4 Pollutant Loading ScenariosThe <strong>TMDL</strong> process is designed to establish the total loading a stream can assimilatewithout causing violation <strong>of</strong> the water quality standards. Because <strong>of</strong> the complexhydrology, the interconnectedness <strong>of</strong> the sources, and the location and temporal record<strong>of</strong> the monitoring data, the <strong>TMDL</strong>s do not distinguish between the contribution <strong>of</strong> Se andTDS from the various tributaries. Therefore, the <strong>TMDL</strong> analyses focus on and establishthe <strong>TMDL</strong>s for the entire watershed <strong>of</strong> <strong>Ashley</strong> <strong>Creek</strong> based on flow. The <strong>TMDL</strong>s arecalculated on an annual basis to account for complex and varying hydrology and criticalconditions in the watersheds and consistent violations <strong>of</strong> Se and TDS water qualitystandards.6.4.1 Existing ConditionsThe existing conditions represent Se and TDS loadings in the <strong>Ashley</strong> <strong>Creek</strong> watershedcalculated from existing monitoring data. As discussed in Section 5.3, existing loadswere calculated for days that had recorded Se and TDS concentrations. Theseindividual daily loadings were calculated by multiplying the observed Se and TDSconcentrations by the flow for that day and were used to establish the existing loadingfor each parameter (Figures 5-3 and 5-4). These lines represent the estimated existingSe and TDS loads within each flow percentile group occurring over the 10-year analysisperiod. The area under the existing loading curve represents the total loading over theanalysis period. As summarized in Tables 6-1 and 6-2, the average annual existing Seand TDS loading in the <strong>Ashley</strong> <strong>Creek</strong> watershed is 1,637 lbs/yr and 36,247 tons/yrrespectively.6.4.2 Loading CapacityAs discussed in Section 5.1, USGS observed flows were used with the 5 ug/L target toestablish the Se loading capacity over the range <strong>of</strong> observed flows (as shown in Figure5-5). This results in an average annual loading capacity <strong>of</strong> 361 lbs/yr <strong>of</strong> Se for <strong>Ashley</strong><strong>Creek</strong> (Table 6-1). Because 5 percent <strong>of</strong> the <strong>TMDL</strong> loading capacity is reserved for themargin <strong>of</strong> safety the allocatable portion <strong>of</strong> the loading capacity for Se is 343 lbs/yr.Likewise, USGS observed flows were used with the 1,200 mg/L target to establish theloading capacity for TDS (Figure 5-6). The analysis resulted in an average annualloading capacity <strong>of</strong> 29,053 tons <strong>of</strong> TDS for <strong>Ashley</strong> <strong>Creek</strong>, as summarized in Table 6-2.After the 5 percent reservation for the margin <strong>of</strong> safety, the allocatable portion <strong>of</strong> theloading capacity for TDS is 27,600 tons/yr.To illustrate the range <strong>of</strong> reductions needed at various flow and loading conditions forthe <strong>TMDL</strong>s, Tables 6-3 and 6-4 present the loading capacity and average existing loadsused to develop the existing loading (and, therefore, the annual existing loads) in <strong>Ashley</strong><strong>Creek</strong>.38
<strong>Ashley</strong> <strong>Creek</strong> Selenium and Total Dissolved Solids <strong>TMDL</strong>sTable 6-3. Se load capacity, existing load, and necessary reduction at variousflows.Flow rangeAvg. Flow(cfs)Existing load(lbs/day)LoadingCapacity(lbs/day)Percentreduction0%-10% 1.1 0.17 0.03 82%10%-20% 3.2 0.78 0.09 88%20%-30% 7.1 1.94 0.19 90%30%-40% 12.5 3.84 0.34 91%40%-50% 17.4 4.65 0.47 90%50%-60% 20.0 5.46 0.54 90%60%-70% 23.0 5.54 0.62 89%70%-80% 33.6 7.07 0.91 87%80%-90% 81.4 7.58 2.20 71%90%-100% 167.3 7.83 4.51 42%Average Annual Load* 1,637 lbs/yr 361 lbs/yr 78%*Calculated by multiplying the average <strong>of</strong> existing loads and load capacities by 365.Table 6-4. TDS load allocation, existing load, and necessary reduction at variousflows.Flow rangeAvg. Flow(cfs)Existing load(lbs/day)LoadingCapacity(lbs/day)Percentreduction0%-10% 1.1 10,916 6,842 37%10%-20% 3.3 36,472 21,602 41%20%-30% 7.5 80,888 48,479 40%30%-40% 12.3 129,866 79,289 39%40%-50% 16.9 157,086 109,314 30%50%-60% 19.9 198,165 128,642 35%60%-70% 24.4 249,136 157,930 37%70%-80% 32.4 269,804 203,979 24%80%-90% 72.3 342,673 324,769 5%90%-100% 561.6 511,116 511,116 0%Average Annual Load (tons)* 36,247 29,053 20%*Calculated by multiplying the average <strong>of</strong> existing loads and load capacities by 365.39
<strong>Ashley</strong> <strong>Creek</strong> Selenium and Total Dissolved Solids <strong>TMDL</strong>s6.4.3 Waste Load AllocationPractically all <strong>of</strong> the Se and TDS load reductions needed to meet the <strong>TMDL</strong> have beenallocated to the <strong>Ashley</strong> Valley Sewage Lagoons. According to studies conducted by theBureau <strong>of</strong> Reclamation and USGS the loading attributable to the sewage lagoons totalsapproximately 2,000 pounds <strong>of</strong> selenium and 9,000 tons <strong>of</strong> salt per year to <strong>Ashley</strong><strong>Creek</strong> (USDI, 1997). With the closure <strong>of</strong> the lagoons the seeps have begun to dry upand the latest Se and TDS data from <strong>Ashley</strong> <strong>Creek</strong> (493721) shows that loads <strong>of</strong> Seand TDS are decreasing (Figure 6-1). The USGS is continuing to monitor the seeps ina study scheduled to be completed in September <strong>of</strong> 2003 (Naftz, pers. comm.).Preliminary data shows that the seeps are decreasing in flow and Se concentrations aredeclining, but there is no identifiable trend in TDS concentrations which is similar to theUSGS’s findings in Colorado (Butler, 2001).Figure 6-1. Se and TDS loads and trends from 1998-2002.35014.030012.025010.0TDS load (tons)2001501008.06.04.0Se load (pounds)502.001998 1999 2000 2001 2002Year0.0Total Dissolved Solids Selenium TDS Trend Line Selenium Trend LineLoad allocations for Se and TDS have also been established for the AVWRF, basedupon the chronic water quality standard concentration <strong>of</strong> 5 ug/L for selenium and nomore than a 400 mg/L increase in TDS concentration from the culinary source, alongwith the plant’s designed capacity outflow <strong>of</strong> 4.7 million gallons per day. Since thecurrent permit limit for TDS is relative to the concentration at the culinary source, themaximum concentration recorded <strong>of</strong> 130 mg/L plus the permitted 400 mg/L increasewas used in calculating the load allocation to the AVWRF. However, this will notsupercede the current permit limit <strong>of</strong> no more than a 400 mg/L increase from theculinary source. It is recognized that there is the potential for the culinary source to behigher than 130 mg/L, which would not exceed the <strong>TMDL</strong> unless the annual averageconcentration also exceeded 130 mg/L in which case the load allocation established by40
<strong>Ashley</strong> <strong>Creek</strong> Selenium and Total Dissolved Solids <strong>TMDL</strong>sthis <strong>TMDL</strong> would be revised accordingly to account for the natural change in waterchemistry.It should also be noted that current concentrations <strong>of</strong> Se from the AVWRF’s dischargefall well below its established permit limit. The AVWRF’s UPDES permit also states thatif Se is not detected, or is found in amounts substantially below the permit limits thenthe AVWRF’s monitoring requirement for Se could be eliminated after one year (12samples). Given the low concentrations <strong>of</strong> Se currently being discharged by theAVWRF it is proposed that this provision be honored with the State continuing toperiodically monitor Se as part <strong>of</strong> its regular monitoring program. If, at the time <strong>of</strong> theAVWRF’s permit renewal date <strong>of</strong> January 31, 2006, Se concentrations have notexceeded the permit limit it is proposed that the AVWRF may petition to have Seremoved from its UPDES permit.6.4.4 Load AllocationBecause <strong>of</strong> the natural geologic sources <strong>of</strong> Se and TDS that underlie <strong>Ashley</strong> Valleythere will always be some Se and TDS non-point source loading into <strong>Ashley</strong> <strong>Creek</strong>.However, due to the past and on-going implementation <strong>of</strong> salinity control projects withinthe watershed, the proportion <strong>of</strong> loading directly attributable to human causes (e.g.irrigation return flows) has and will likely continue to decline. Improving riparian habitatand reducing streambank erosion will also reduce Se and TDS loading, therebyimproving aquatic habitat as well. Although only a small non-point source loadreduction is needed it is anticipated that efforts to reduce salt loading and improveaquatic habitat will continue with the provision <strong>of</strong> cost-share funding and other grantsdirected at improving water quality.41
<strong>Ashley</strong> <strong>Creek</strong> Selenium and Total Dissolved Solids <strong>TMDL</strong>s7. Potential Control OptionsAlthough practically all <strong>of</strong> the required Se and TDS load reductions have been allocatedto the <strong>Ashley</strong> Valley Sewage Lagoons it is important to recognize that other sourcesassociated with natural background (streambank erosion) and non-point sources(irrigation return flows) can and should be controlled to the maximum extent practicableon a voluntary basis through the implementation <strong>of</strong> best management practices.Potential options for reducing non-point source Se and TDS loads in the <strong>Ashley</strong> <strong>Creek</strong>watershed include:− Increase irrigation efficiency by providing sprinkler irrigation, properly schedulingirrigation turns, reducing flood length and leveling land.− Line canals and ditches with open concrete lining or replace them with pipe.Seepage losses in canals and ditches can result in mineral pickup and return flow tostreams through springs and drains.− Construct weirs at turnouts to ensure that proper amounts <strong>of</strong> water are applied.− Maintain grassed waterways and construct check dams on return flows.− Maintain uncultivated buffer strips along streams and channels.− Re-establish and preserve existing flood plains along <strong>Ashley</strong> <strong>Creek</strong> through planningand zoningIn addition to reducing deep percolation <strong>of</strong> irrigation water it is anticipated thatcontrolling soil erosion from streambanks and uplands will also reduce Se and TDSloading since soils in the lower watershed are slightly to highly saline. Potential controloptions for reducing soil and streambank erosion include:− Promoting proper grazing management on uplands and riparian areas to maintainsufficient plant cover to protect the soil.− Improve condition <strong>of</strong> riparian areas through plantings, temporary grazing exclusionand development <strong>of</strong> alternate watering sites.− Stabilize streambanks through planting deep rooted species <strong>of</strong> woody plants,placement <strong>of</strong> rock barbs and revetment to deflect flow away from erosive banks andsloping vertical streambanks to reconnect the stream channel to its floodplain andallow native vegetation to re-establish.The <strong>Ashley</strong> <strong>Creek</strong> Stabilization/Restoration Report, completed in May <strong>of</strong> 2000 for UintahCounty and the Uintah County <strong>Water</strong> Conservancy District, summarized the results <strong>of</strong>several studies designed to address problems along <strong>Ashley</strong> <strong>Creek</strong> including chronicflooding during spring run-<strong>of</strong>f, lack <strong>of</strong> riparian habitat and fisheries, water quality and lowflow summer conditions. After extensive discussion and consultation with local <strong>of</strong>ficialsand the general public the authors <strong>of</strong> the report recommended the construction <strong>of</strong> an<strong>of</strong>f-stream reservoir within the intermittent Spring <strong>Creek</strong> drainage to store peak floodstage flows in the spring for gradual release over the summer to provide instream flowsnecessary for the establishment <strong>of</strong> riparian habitat and a fishery (Franson-Noble, 2000).Work on this project has begun with a detailed site investigation <strong>of</strong> the proposed dam-42
<strong>Ashley</strong> <strong>Creek</strong> Selenium and Total Dissolved Solids <strong>TMDL</strong>ssite location currently underway. It is anticipated that this project would ultimatelybenefit water quality downstream, particularly during the summer, by dilutinggroundwater base-flows high in TDS that enter the channel in lower reaches.These <strong>TMDL</strong>s are based on a representative flow regime that is determined usinghistorical flow records. Therefore the allocated loadings and associated load reductionsare calculated to meet water quality standards assuming the flow conditions remainsimilar to those established in the <strong>TMDL</strong>. However, it is possible with salinity controlefforts focusing on decreasing TDS loads that instream TDS concentrations mayincrease. This could be the result <strong>of</strong> less dilution water available from flood irrigationreturn flows or higher TDS concentrations <strong>of</strong> groundwater baseflow. To <strong>of</strong>fset this, thecontrol options for the <strong>Ashley</strong> <strong>Creek</strong> watershed should focus on minimizing deeppercolation <strong>of</strong> irrigation water through improving the efficiency <strong>of</strong> irrigation practices andconveyances on saline soils.To address the possibility that implementation may lead to increased instream TDSconcentrations and non-attainment <strong>of</strong> water quality standards this <strong>TMDL</strong> will utilize anapproach that provides for the implementation <strong>of</strong> load reduction strategies whilecontinuing to collect additional data. If when the load reductions identified in this <strong>TMDL</strong>are attained or a reasonable effort towards implementation has occurred, and waterquality standards are still violated, the <strong>TMDL</strong> will be revised accordingly based upon theadditional data collected. Regardless <strong>of</strong> the short-term effect on instream flows andconcentrations, the available and recommended control efforts should improve irrigationefficiencies and water quality will ultimately benefit.The reasonable assurance that these implementation activities will occur and attempt tomeet the load reduction goals is that implementation is currently ongoing under thecooperative efforts <strong>of</strong> local agricultural producers and the USDI/USDA Salinity ControlProgram. In fact, approximately 17,000 acres <strong>of</strong> irrigated land within the watershedhave already been treated. There is a great deal <strong>of</strong> local interest among watershedstakeholders to participate in the salinity control program. The availability <strong>of</strong> cost-sharefunding is the primary limitation on implementation. It is anticipated that with theestablishment <strong>of</strong> this <strong>TMDL</strong> for the <strong>Ashley</strong> <strong>Creek</strong> watershed some <strong>of</strong> the fundingshortfalls will be alleviated with 319 funding along with the priority status <strong>of</strong> othersources <strong>of</strong> funding associated with approved <strong>TMDL</strong> watersheds.43
<strong>Ashley</strong> <strong>Creek</strong> Selenium and Total Dissolved Solids <strong>TMDL</strong>s8. Future MonitoringContinued water quality monitoring is essential to evaluate the effects <strong>of</strong> bestmanagement practices as well as progress towards meeting water quality goals andbeneficial use support. In addition to the regular and intensive monitoring alreadyconducted by the state and USGS, additional monitoring <strong>of</strong> shallow wells isrecommended to determine the influence <strong>of</strong> groundwater and deep aquifers on surfacewater Se and TDS concentrations. Periodic monitoring will also be needed on theephemeral drainages to the west <strong>of</strong> <strong>Ashley</strong> <strong>Creek</strong>, particularly Mantle Gulch, todetermine the influence <strong>of</strong> irrigation return flows versus natural precipitation on Se andTDS loading.In addition to regular water quality monitoring, upland and riparian areas should bemonitored periodically. The purpose for monitoring these areas is to identify wheresignificant sources <strong>of</strong> sediment and salt originate from. This monitoring will beconducted through the cooperative efforts <strong>of</strong> the Uintah County Soil ConservationDistrict and the <strong>Ashley</strong> <strong>Creek</strong> Stabilization and Restoration Committee.It is important to recognize that data collection in support <strong>of</strong> this <strong>TMDL</strong> is an ongoingeffort and that as new data is collected this <strong>TMDL</strong> will be revised as appropriate.44
<strong>Ashley</strong> <strong>Creek</strong> Selenium and Total Dissolved Solids <strong>TMDL</strong>s9. Public ParticipationPublic participation for this <strong>TMDL</strong> was accomplished through a series <strong>of</strong> public meetingswith the local Uintah County Soil Conservation District and the <strong>Ashley</strong> <strong>Creek</strong>Stabilization and Restoration Committee (ACSRC). The ACSRC is comprised <strong>of</strong>individuals representing key interests within the watershed.A public hearing on the <strong>TMDL</strong>s was held on March 5, 2003 with notification <strong>of</strong> thehearing published in the local newspaper on February 24, 2003 (Vernal Express). Thecomment period was opened on February 24 and closed on March 18, 2002. Formalcomments and responses are included in Appendix B.In addition, the <strong>TMDL</strong> and dates for public comment were posted on the <strong>Division</strong> <strong>of</strong><strong>Water</strong> <strong>Quality</strong>’s website at (www.deq.state.ut.us/EQWQ/<strong>TMDL</strong>/<strong>TMDL</strong>_WEB.HTM).45
<strong>Ashley</strong> <strong>Creek</strong> Selenium and Total Dissolved Solids <strong>TMDL</strong>s10. ReferencesBureau <strong>of</strong> Reclamation. 1957. Vernal Unit, Central Utah Project, Definite Plan Report,May 1957. Appendix A, Project Lands, Land Drainage.Butler, D.L. 2001. Effects <strong>of</strong> Piping Irrigation Laterals on Selenium and Salt Loads,Montrose Arroyo Basin, Western Colorado. USGS/WRIR 01-4204.Evaluation <strong>of</strong> Salinity and Selenium Loading to Lower <strong>Ashley</strong> <strong>Creek</strong>, Uintah County,Utah. UT-00-259. U.S. Bureau <strong>of</strong> Reclamation and U.S. Geological Survey. B.J. Stolp.http://wwwdutslc.wr.usgs.gov/publications/Activities00/Text.html#UT_259Franson-Noble. 2000. <strong>Ashley</strong> <strong>Creek</strong> Stabilization/Restoration Report, Spring <strong>Creek</strong>Dam and Reservoir.Naftz, D. 2002. Personal communication (regarding Selenium and Total DissolvedSolids loading from <strong>Ashley</strong> Valley Sewer Lagoons).Stephens, D.W., B.W. Waddell, L.A. Peltz, J.B. Miller. 1992. Detailed Study <strong>of</strong> Seleniumand Selected Elements in <strong>Water</strong>, Bottom Sediment, and Biota Associated with IrrigationDrainage in the Middle Green River Basin, Utah, 1988-90. USGS/WRIR 92-4084.U.S. Dept <strong>of</strong> Interior, National Irrigation <strong>Water</strong> <strong>Quality</strong> Program. 1997. Middle GreenRiver Basin Study, Stewart Lake <strong>Water</strong>fowl Management Area, Final EnvironmentalAssessment. PRO-EA-97-001.Utah <strong>Division</strong> <strong>of</strong> <strong>Water</strong> Resources. 1999. Utah State <strong>Water</strong> Plan, Uintah Basin. SaltLake City, Utah.Utah <strong>Division</strong> <strong>of</strong> <strong>Water</strong> <strong>Quality</strong>. 2001. Standards <strong>of</strong> <strong>Quality</strong> for <strong>Water</strong>s <strong>of</strong> the State, UtahAdministrative Code R317-2. Salt Lake City, Utah.Williams, K.T. and H.G. Byers. 1935. Occurrence <strong>of</strong> selenium in the Colorado River andsome <strong>of</strong> its tributaries: Industrial and Engineering Chemistry. 7:6:431-432.46