Glendale (PDF) - Hazard Mitigation Web Portal - State of California
Glendale (PDF) - Hazard Mitigation Web Portal - State of California
Glendale (PDF) - Hazard Mitigation Web Portal - State of California
- No tags were found...

You also want an ePaper? Increase the reach of your titles
YUMPU automatically turns print PDFs into web optimized ePapers that Google loves.
City CouncilDave Weaver, MayorRafi Manoukian Ara NajarianFrank Quinteros Bob YosefianCity AdministrationJames E. Starbird, City ManagerRobert McFall, Assistand City Manager<strong>Mitigation</strong> Plan Steering CommitteeYasin Beers, Management Services Deputy City ManagerApril Fitzpatrick, Public Works Executive AnalystKathy Duarte, Planning Department PlannerJames Frawley, Fire Captain Emergency Services and Homeland SecurityCoordinatorConsultant: Tania Gonzalez, Earth Consultants International, Inc.City StaffPublic Works: William A’Hearn<strong>Glendale</strong> Water and Power:Planning Department: Jeff HamiltonFire Department: Doug Nickles, Eric Indermill, Vasken Demirjian, JulieSchaeffer, Amanda HutchinsPolice: Lewis GuayDaniel Rodriguez, William Hall, Oliver Tetreault,Stake HoldersMark Muniz, <strong>Glendale</strong> Memorial Hospiatl, John Fenton, <strong>Glendale</strong> UnifiedSchool District, Robert Reynoso, American Red Cross, Rio Cordova,Verdugo Hills Hospital,
Natural <strong>Hazard</strong>s <strong>Mitigation</strong> PlanCity <strong>of</strong> <strong>Glendale</strong>, <strong>California</strong>SECTION 1:Section 1 - IntroductionINTRODUCTIONThroughout history, the residents <strong>of</strong> southern <strong>California</strong>, including the city <strong>of</strong> <strong>Glendale</strong>, haveexperienced and dealt with a variety <strong>of</strong> natural hazards common to the area. In the 1700s and1800s, when there were fewer people in the area, these natural hazards adversely affected thelives <strong>of</strong> those who depended directly on the land and climatic conditions for their food andwelfare. Therefore, when a natural event disrupted their lives, the survivors <strong>of</strong>ten recordedtheir impressions in journals, letters, newspaper articles, and more recently, photographs. Inthe 1900s, as we began to attempt to understand and modify the natural environment to reducethe impact <strong>of</strong> these natural hazards on the local population and the environment, natural eventswere also recorded in scientific journals. Many <strong>of</strong> these sources are referred to in the followingsections in an effort to document the area’s past vulnerability to specific natural hazards, and toassess the area’s potential future risks. This is especially important because as the population <strong>of</strong>southern <strong>California</strong> increases, natural hazards have the potential to pose an even higher risk tothe population and the economic welfare <strong>of</strong> the area.Southern <strong>California</strong> is the fifth largest economy in the world, and the city <strong>of</strong> <strong>Glendale</strong>, as thethird most populous city in Los Angeles County is a vibrant and significant member <strong>of</strong> thateconomy. People originally from all over the United <strong>State</strong>s and the world now call the city <strong>of</strong><strong>Glendale</strong> home because <strong>of</strong> its gentle Mediterranean climate, geographical attributes (the oceanand mountains are both within a one- to two-hour drive) and ample job opportunities.However, the area’s terrain is the product <strong>of</strong> powerfully active natural forces forming andtearing down mountains at remarkable rates by geological standards, and when humans interactwith this changing environment, there is a high possibility for the population to be negativelyimpacted. Thus, a natural event, such as an earthquake, clearly has the potential to causesignificant damage at the personal, local, and regional levels. In this document we discussscenarios that estimate how much damage (in terms <strong>of</strong> loss <strong>of</strong> life, injuries, and economic loss)an earthquake could cause in <strong>Glendale</strong>.In addition to earthquakes, the city <strong>of</strong> <strong>Glendale</strong>, like most <strong>of</strong> the region, is also subject towildfires, floods, landslides and debris flows, windstorms, tornadoes, and other geologicalhazards. Some <strong>of</strong> these hazards, like tornadoes, occur fairly infrequently and are difficult topredict, whereas others, such as expansive or compressible soils, can be effectively mitigatedwith engineering applications. The historical record and our current state <strong>of</strong> knowledgeindicate that those hazards with the potential to cause the most damage in <strong>Glendale</strong>, listed inorder <strong>of</strong> decreasing severity, include earthquakes, wildfires, floods, and landslides. These arethe four natural hazards that are covered in most detail in this document, given that it ispossible to minimize the losses that result from these hazards through careful planning andcommunity participation in the implementation <strong>of</strong> natural hazard reduction measures.Why Develop a Local Natural <strong>Hazard</strong>s <strong>Mitigation</strong> Plan?As the costs <strong>of</strong> damage from natural disasters continue to increase, communities realize theimportance <strong>of</strong> identifying effective ways to reduce their vulnerability to disasters. <strong>Hazard</strong>mitigation plans assist communities in reducing their risk from natural hazards by identifyingresources, information, and strategies for risk reduction, while helping to guide and coordinatemitigation activities throughout the area. This document aims to do just that for the city <strong>of</strong><strong>Glendale</strong>, <strong>California</strong>.The Plan provides a set <strong>of</strong> action items that if implemented can help reduce the risk fromnatural hazards through education and outreach programs, by fostering the development <strong>of</strong>2006 PAGE 1 - 1
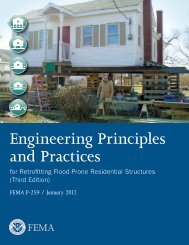
Natural <strong>Hazard</strong>s <strong>Mitigation</strong> PlanCity <strong>of</strong> <strong>Glendale</strong>, <strong>California</strong>Section 1 - Introductionpartnerships, and by implementing preventive activities (such as land use programs) thatrestrict and control development in areas subject to damage from natural hazards.The resources and information contained within the <strong>Mitigation</strong> Plan:1) Establish a basis for coordination and collaboration among agencies and thepublic in the city <strong>of</strong> <strong>Glendale</strong>;2) Identify and prioritize future mitigation projects; and3) Assist in meeting the requirements <strong>of</strong> federal assistance programs.The Local Natural <strong>Hazard</strong>s <strong>Mitigation</strong> Plan works in conjunction with other City plans,including the City’s Safety Element <strong>of</strong> the General Plan and the City’s Emergency OperationsPlans.Whom Does the <strong>Mitigation</strong> Plan Affect?<strong>Glendale</strong>’s Local Natural <strong>Hazard</strong>s <strong>Mitigation</strong> Plan affects the entire city (see Map 1.1 below).This Plan provides a framework for planning for the four main natural hazards that have thepotential to impact the <strong>Glendale</strong> area. The resources and background information in the Planare applicable citywide, and the goals and recommendations can lay the groundwork for localmitigation plans and partnerships.Natural <strong>Hazard</strong> Land Use Policy in <strong>California</strong>Planning for natural hazards should be an integral element <strong>of</strong> any city’s land use planningprogram. All <strong>California</strong> cities and counties are required to have Safety Elements, one <strong>of</strong> sevenmandatory elements <strong>of</strong> their General Plans, that document the natural hazards specific to thearea, and provide the framework by which ordinances to reduce these hazards are implemented.However, Safety Elements are typically updated only once every 15 to 25 years, and are <strong>of</strong>tensuperseded by other local and statewide planning regulations. With the requirements for Local<strong>Hazard</strong> <strong>Mitigation</strong> Plans, the Federal Emergency Management Agency (FEMA) has essentiallyexported the <strong>California</strong> municipal Safety Element idea to the rest <strong>of</strong> the United <strong>State</strong>s, but theyalso have expanded on it by requiring a more publicly open and economically quantifiableplanning process for community disaster reduction, and a process by which the document isreviewed yearly and updated every five years. Current Safety Elements such as <strong>Glendale</strong>’srecently adopted document (adopted in October, 2003), emphasize hazard mapping and developforward-looking land use planning policies to minimize those hazards. FEMA has directed that,following the hazard mapping effort, an emphasis be placed on hazard mitigation policies thatare based on quantifiable vulnerability, loss, and risk analysis. FEMA also requires extensivepublic participation in this process, because they recognize that without public education andcitizen buy-in <strong>of</strong> mitigation needs, it is nearly impossible to mobilize the level <strong>of</strong> supportnecessary to fully begin to deal with multi-hazard mitigation over multi-decadal timescales.Map 1.1 – City <strong>of</strong> <strong>Glendale</strong>, in dark yellow at the center,showing the major roadways that traverse the area.2006 PAGE 1 - 2
Natural <strong>Hazard</strong>s <strong>Mitigation</strong> PlanCity <strong>of</strong> <strong>Glendale</strong>, <strong>California</strong>Section 1 - IntroductionSource: 2004 Thomas Brothers Maps.The continuing challenge faced by local <strong>of</strong>ficials and state government is to keep the localhazard mitigation plans effective in responding to the changing conditions and needs <strong>of</strong><strong>California</strong>’s diverse and growing communities without forgetting the effect that low-probabilitybut high-risk natural events (such as major earthquakes and floods, which can skip entiregenerations and are therefore likely to be dismissed over time) can have on the builtenvironment. This is particularly true in the case <strong>of</strong> planning for natural hazards wherecommunities must balance development pressures with detailed information on the nature andextent <strong>of</strong> hazards. Planning for natural hazards therefore calls for local plans to includeinventories, policies, and ordinances to guide the safe development <strong>of</strong> areas that history showscan be greatly impacted by infrequent but large-magnitude natural hazard events. Theseinventories should include the compendium <strong>of</strong> hazards facing the community, the builtenvironment at risk, the personal property that may be damaged by hazard events, and most <strong>of</strong>all, the people who live in the shadow <strong>of</strong> these hazards.Support for Natural <strong>Hazard</strong> <strong>Mitigation</strong>All mitigation is local, and the primary responsibility for development and implementation <strong>of</strong>risk reduction strategies and policies lies with local jurisdictions. Local jurisdictions, however,are not alone. Partners and resources exist at the regional, <strong>State</strong> and Federal levels. Numerous<strong>California</strong> state agencies have a role in the research and public education about natural hazardsand in natural hazard mitigation. Some <strong>of</strong> these key agencies include:♦♦The Governor’s Office <strong>of</strong> Emergency Services (OES) is responsible for disastermitigation, preparedness, response, recovery, and the administration <strong>of</strong> federal fundsafter a major disaster declaration;The Southern <strong>California</strong> Earthquake Center (SCEC) gathers information about2006 PAGE 1 - 3
Natural <strong>Hazard</strong>s <strong>Mitigation</strong> PlanCity <strong>of</strong> <strong>Glendale</strong>, <strong>California</strong>Section 1 - Introductionearthquakes, integrates this information on earthquake phenomena, and communicatesthis to end-users and the general public to increase earthquake awareness, reduceeconomic losses, and save lives;♦♦♦The <strong>California</strong> Division <strong>of</strong> Forestry (CDF) is responsible for all aspects <strong>of</strong> wildland fireprotection on state lands, and administers forest practices regulations on non-federallands;The <strong>California</strong> Geological Survey (CGS) is responsible for geologic hazardcharacterization, public education, and the development <strong>of</strong> partnerships aimed atreducing risk, andThe <strong>California</strong> Division <strong>of</strong> Water Resources (DWR) plans, designs, constructs,operates, and maintains the <strong>State</strong> Water Project; regulates dams; provides floodprotection; and assists in emergency management. It also educates the public, andserves local water needs by providing technical assistance.Plan MethodologyInformation in the <strong>Mitigation</strong> Plan is based on research from a variety <strong>of</strong> sources, with emphasison data previously collected by the consultant for the City’s Safety Element <strong>of</strong> the General Plan,a document adopted by City Council in 2003. The consultant was helped on this effort by stafffrom the City <strong>of</strong> <strong>Glendale</strong>, who conducted data research, facilitated steering committee meetingsand public workshops, and developed the final Local <strong>Hazard</strong> <strong>Mitigation</strong> Plan. The researchmethods and various contributions to the Plan include:Input From the Steering and Advisory CommitteesThe <strong>Hazard</strong> <strong>Mitigation</strong> Advisory Committee guided development <strong>of</strong> the <strong>Mitigation</strong> Plan. Thecommittee played an integral role in developing the mission, goals, and action items for the<strong>Mitigation</strong> Plan. The committee consisted <strong>of</strong> representatives <strong>of</strong> public and private agencies andorganizations in the City <strong>of</strong> <strong>Glendale</strong>, including: City <strong>of</strong> <strong>Glendale</strong> Fire Department, including Emergency Services City <strong>of</strong> <strong>Glendale</strong> Planning Department City <strong>of</strong> <strong>Glendale</strong> Public Works Department City <strong>of</strong> <strong>Glendale</strong> Management Services City <strong>of</strong> <strong>Glendale</strong> Police Department City <strong>of</strong> <strong>Glendale</strong> Water and Power City <strong>of</strong> <strong>Glendale</strong> Parks, Recreation, and Community Services Department City <strong>of</strong> <strong>Glendale</strong> Information Services City <strong>of</strong> <strong>Glendale</strong> Development Services City <strong>of</strong> <strong>Glendale</strong> Management Services <strong>Glendale</strong> Unified School District <strong>Glendale</strong> Memorial Hospital and Verdugo Hills HospitalRecognizing that work “by committee” <strong>of</strong>ten needs to be streamlined to be effective, the firstfour members on the Advisory Committee currently form the <strong>Glendale</strong> <strong>Hazard</strong> <strong>Mitigation</strong>Steering Committee. These members have the added responsibility <strong>of</strong> overseeing2006 PAGE 1 - 4
Natural <strong>Hazard</strong>s <strong>Mitigation</strong> PlanCity <strong>of</strong> <strong>Glendale</strong>, <strong>California</strong>Section 1 - Introductionimplementation <strong>of</strong> the Plan. Additional information regarding the responsibilities <strong>of</strong> thecommittees is provided in Section 5.Stakeholder InterviewsCity staff has conducted interviews with individuals and specialists from organizationsinterested in natural hazards planning since 2002, when the process <strong>of</strong> preparing the SafetyElement <strong>of</strong> the General Plan began. The Safety Element was adopted in 2003 after acomprehensive planning process that included public input in the form <strong>of</strong> community openhousemeetings, and presentations to the public and City <strong>of</strong>ficials. The Draft Plan was alsoplaced on the City’s Wide <strong>Web</strong> site and feedback was sought from each reviewer. Copies <strong>of</strong> theDraft Plan were made available for review in all branches <strong>of</strong> the <strong>Glendale</strong> Public Library. Oncethe Plan is adopted by City Council, the final document will be available on the City’s <strong>Web</strong> siteand at each branch <strong>of</strong> the <strong>Glendale</strong> Public Library.More recently, the City has been involved in Long Range Planning, a process that has includedextensive public outreach and input. More than twelve public meetings were held, drawingmore than 600 residents. Notices <strong>of</strong> these public meetings were posted on the City <strong>Web</strong> site,distributed with utility bills, and advertised in the local newspapers. In addition, focus groupmeetings were held with stakeholders, including representatives <strong>of</strong> the local hospitals (May 3,2006), <strong>Glendale</strong> Unified School District (April 27, 2006), Chamber <strong>of</strong> Commerce (April 27,2006), and American Red Cross (April 28, 2006). The purpose <strong>of</strong> these meetings was to discussintegration <strong>of</strong> their own disaster mitigation and response plans with the City Plan. Thesemeetings were also instrumental in identifying common concerns related to natural hazards anddeveloping key long- and short-term activities to reduce risk from natural hazards. Under thePlan, these partnerships will be fostered and will play a role in regional mitigation and responseplanning.To summarize, stakeholders interviewed for the Plan included representatives from:♦♦♦♦♦♦♦♦♦<strong>Glendale</strong> Unified School DistrictLocal hospitalsCity <strong>of</strong> <strong>Glendale</strong> Chamber <strong>of</strong> CommerceAmerican Red CrossLos Angeles County Fire DepartmentLos Angeles County Public WorksUtility ProvidersLocal Businesses andLocal Citizens<strong>State</strong> and Federal Guidelines and Requirements for <strong>Mitigation</strong> PlansFollowing are the Federal requirements for approval <strong>of</strong> a Natural <strong>Hazard</strong> <strong>Mitigation</strong> Plan:♦♦♦♦Open public involvement, with public meetings that introduce the process and projectrequirements.The public must be afforded opportunities for involvement in identifying and assessingrisk, drafting a Plan, and public involvement in approval stages <strong>of</strong> the Plan.Community cooperation, with opportunity for other local government agencies, thebusiness community, educational institutions, and non-pr<strong>of</strong>its to participate in theprocess.Incorporation<strong>of</strong> local documents, including the City’s General Plan, the Zoning2006 PAGE 1 - 5
Natural <strong>Hazard</strong>s <strong>Mitigation</strong> PlanCity <strong>of</strong> <strong>Glendale</strong>, <strong>California</strong>Section 1 - IntroductionOrdinance, the Building Codes, and other pertinent documents.The following components must be part <strong>of</strong> the planning process:♦ Complete documentation <strong>of</strong> the planning process;♦♦♦♦♦A detailed risk assessment on hazard exposures in the community;A comprehensive mitigation strategy, which describes the goals and objectives,including proposed strategies, programs and actions to avoid long-term vulnerabilities;A plan maintenance process, which describes the method and schedule <strong>of</strong> monitoring,evaluating and updating the Plan and integration <strong>of</strong> the All <strong>Hazard</strong> <strong>Mitigation</strong> Planinto other planning mechanisms;Formal adoption by the City Council; andPlan review by both FEMA and <strong>State</strong> OES.These requirements are spelled out in greater detail in the following sections <strong>of</strong> the Plan andsupporting documentation.A minimum <strong>of</strong> two public workshops (or other public forums) is recommended to meet therequirement for public participation, in addition to the inclusion <strong>of</strong> representatives from outsideorganizations on the planning committee itself. The timing and scheduling <strong>of</strong> the workshopsmay vary from one community to another depending on how each city’s committee organizes itswork and the particular needs <strong>of</strong> the community.<strong>Glendale</strong>’s consultant and City staff examined existing mitigation plans from around thecountry, current FEMA hazard mitigation planning standards (386 series) and the <strong>State</strong> <strong>of</strong><strong>California</strong> Natural <strong>Hazard</strong>s <strong>Mitigation</strong> Plan Guidance.Other reference materials consisted <strong>of</strong> county and city mitigation plans, including:♦ Clackamas County (Oregon) Natural <strong>Hazard</strong>s <strong>Mitigation</strong> Plan♦ City <strong>of</strong> Long Beach Natural <strong>Hazard</strong>s <strong>Mitigation</strong> Plan♦ Upper Arkansas Area Risk Assessment and <strong>Hazard</strong> <strong>Mitigation</strong> Plan♦ <strong>State</strong> <strong>of</strong> Arkansas <strong>Hazard</strong> <strong>Mitigation</strong> Plan♦ City <strong>of</strong> Pasadena Natural <strong>Hazard</strong>s <strong>Mitigation</strong> Plan♦ City <strong>of</strong> Torrance <strong>Hazard</strong>s <strong>Mitigation</strong> Plan♦ Los Angeles Specific Planning Guidebook provided by the DMACs <strong>of</strong> Area C<strong>Hazard</strong> Specific Research<strong>Glendale</strong>’s consultant and staff collected data and compiled research on four hazards:earthquakes, wildfires, flooding, and landslides. Research materials used include publications byfederal agencies such as FEMA and the U.S. Geological Survey; state agencies such as CGS,OES and CDF; the City <strong>of</strong> <strong>Glendale</strong>’s Safety Element, and other sources. The City’s consultantconducted research by referencing historical local sources, interviewing long-time City <strong>of</strong><strong>Glendale</strong> employees, who provided invaluable data regarding past local disasters, and locatinginformation specific to the city <strong>of</strong> <strong>Glendale</strong> in historical documents.City <strong>of</strong> <strong>Glendale</strong>’s staff evaluated the feasibility and potential effectiveness<strong>of</strong> the proposed2006 PAGE 1 - 6
Natural <strong>Hazard</strong>s <strong>Mitigation</strong> PlanCity <strong>of</strong> <strong>Glendale</strong>, <strong>California</strong>Section 1 - Introductionmitigation activities, resources and programs, and potential action items based on theirexperience in implementing the action items in the Safety Element, and from feedback fromstakeholder interviews.Public Workshops and Public InputCity <strong>of</strong> <strong>Glendale</strong>’s staff facilitated two public meetings to gather comments and ideas from City<strong>of</strong> <strong>Glendale</strong> citizens about mitigation planning and priorities for mitigation plan goals as part <strong>of</strong>the Safety Element <strong>of</strong> the General Plan. The first open-house meeting was held in theconference room <strong>of</strong> the City’s Planning Department on April 14, 2003. The second meeting wasa meeting open to the public that included a presentation to the City’s Planning Commission.This meeting was held on September 8, 2003 in City Council Chambers. A third, also televisedpresentation, was made to City Council on October 7, 2003 as part <strong>of</strong> the adoption <strong>of</strong> the SafetyElement. The Draft <strong>of</strong> the Safety Element was placed on the City’s <strong>Web</strong> site and feedback wassought from each reviewer. Copies <strong>of</strong> the document were also made available for review in allbranches <strong>of</strong> the <strong>Glendale</strong> Public Library. Over the last two years (2004-2006), the City has beeninvolved in Long Range Planning, an effort that has included extensive public outreach andinput. More than twelve public meetings were held drawing more than 600 citizens. Additionalinformation regarding these community meetings is provided in Appendix B.The resources and information cited in the <strong>Hazard</strong> <strong>Mitigation</strong> Plan provide a strong localperspective and help identify strategies and activities to make City <strong>of</strong> <strong>Glendale</strong> more disaster-resilient.How is t he Plan Used?Each section <strong>of</strong> the Local Natural <strong>Hazard</strong>s <strong>Mitigation</strong> Plan provides information and resourcesto assist people in understanding the hazard-related issues facing <strong>Glendale</strong>’s citizens, businesses,and the environment. Combined, the sections <strong>of</strong> the Plan work together to create a documentthat guides the mission to reduce risk and prevent loss from future natural hazard events.The structure <strong>of</strong> the Plan enables the user to refer to specific sections <strong>of</strong> interest to him or her.It also allows City government to review and update sections when new data become available.The ability to update individual sections <strong>of</strong> the <strong>Hazard</strong> <strong>Mitigation</strong> Plan places less <strong>of</strong> a financialburden on the City. Decision-makers can allocate funding and staff resources to selected piecesin need <strong>of</strong> review, thereby avoiding a full update, which can be costly and time-consuming. Newdata can be easily incorporated, resulting in a Local <strong>Hazard</strong>s <strong>Mitigation</strong> Plan that remainscurrent and relevant to the city <strong>of</strong> <strong>Glendale</strong>.<strong>Glendale</strong>’s Local <strong>Hazard</strong> <strong>Mitigation</strong> Plan is organized in three volumes. Volume I contains theexecutive summary followed by Sections 1 through 5; introduction, community pr<strong>of</strong>ile, riskassessment, multi-hazard goals and action items, and Plan maintenance. Volume II containsthe four natural hazard sections (Sections 6 through 9) and Volume III includes the appendices.Each section <strong>of</strong> the Plan is described below.Volume I: <strong>Mitigation</strong> Action PlanExecutive Summary: Five-Year Action PlanThe Five-Year Action Plan provides an overview <strong>of</strong> the <strong>Hazard</strong> <strong>Mitigation</strong> Plan’s mission,goals, and action items. The Plan’s action items are included in this section, and address multihazardissues, as well as hazard-specific activities that can be implemented to reduce risk andprevent loss from future natural hazard events.2006 PAGE 1 - 7
Natural <strong>Hazard</strong>s <strong>Mitigation</strong> PlanCity <strong>of</strong> <strong>Glendale</strong>, <strong>California</strong>Section 1 - IntroductionSection 1: IntroductionThe Introduction describes the background and purpose <strong>of</strong> developing the LocalNatural <strong>Hazard</strong> <strong>Mitigation</strong> Plan for the city <strong>of</strong> <strong>Glendale</strong>.Section 2: Community Pr<strong>of</strong>ileThis section presents the history, geography, demographics, and socioeconomics <strong>of</strong> thecity <strong>of</strong> <strong>Glendale</strong>. It serves as a tool to provide an historical perspective <strong>of</strong> naturalhazards in the city, and a springboard to understand how natural hazards can impactthe city in the future.Section 3: Risk AssessmentThis section provides information on hazard identification, vulnerability and riskassociated with natural hazards in the city <strong>of</strong> <strong>Glendale</strong>.Section 4: Multi-<strong>Hazard</strong> and <strong>Hazard</strong>-Specific Goals and Action ItemsThis section provides information on the process used to develop goals and action itemsthat cut across the four natural hazards addressed in the Natural <strong>Hazard</strong> <strong>Mitigation</strong>Plan (the Multi-<strong>Hazard</strong> Action Items), and also includes the hazard-specific actionitems. Section 4 is the “Policy Document” that establishes the specific action itemsthat the City will undertake to reduce its risk to natural hazards.Section 5: Plan MaintenanceThis section provides information on Plan implementation, monitoring and evaluation.V olume II: <strong>Hazard</strong> Specific Information<strong>Hazard</strong>-specific information on four chronic hazards is addressed in this Plan. Chronic hazardsoccur with some regularity and may be forecasted through historic evidence and scientificmethods. Catastrophic hazards do not occur with the frequency <strong>of</strong> chronic hazards, butnotwithstanding, they can have devastating impacts on life, property, and the environment. Insouthern <strong>California</strong>, because <strong>of</strong> its geology and terrain, earthquakes, wildfires, floods, andlandslides have the potential to be catastrophic as well as chronic hazards.The hazards addressed in the Plan include:Section 6:Section 7:Section 8:Section 9:EarthquakesWildfiresFloods, Mudflows, and Catastrophic Inundation due to Failure <strong>of</strong>ReservoirsLandslides and Slope InstabilityEach <strong>of</strong> the hazard-specific sections includes information on the history, hazard causes andcharacteristics, hazard assessment, goals and action items, and local, state, and nationalresources available to mitigate or reduce the impact <strong>of</strong> these hazards.V olume III: Resources2006 PAGE 1 - 8
Natural <strong>Hazard</strong>s <strong>Mitigation</strong> PlanCity <strong>of</strong> <strong>Glendale</strong>, <strong>California</strong>Section 1 - IntroductionThe Plan appendices are designed to provide users <strong>of</strong> <strong>Glendale</strong>’s Local Natural <strong>Hazard</strong>s<strong>Mitigation</strong> Plan with additional information to assist them in understanding the contents <strong>of</strong> the<strong>Mitigation</strong> Plan, and potential resources to assist them with implementation.Appendix A: Plan Resource DirectoryThis appendix provides a resource directory, which includes city, regional, <strong>State</strong>, andnational resources and programs that may be <strong>of</strong> technical and/or financial assistance tothe City <strong>of</strong> <strong>Glendale</strong> during Plan implementation.Appendix B: Public Participation ProcessThis appendix includes specific information on the various public processes used duringdevelopment <strong>of</strong> the Plan.Appendix C: Benefit Cost AnalysisThis appendix describes FEMA's requirements for benefit cost analysis in naturalhazards mitigation, as well as various approaches for conducting economic analysis <strong>of</strong>proposed mitigation activities.Appendix D: List <strong>of</strong> AcronymsThis appendix provides a list <strong>of</strong> acronyms for city, regional, state, and federal agenciesand organizations that may be referred to within <strong>Glendale</strong>’s Local Natural <strong>Hazard</strong>s<strong>Mitigation</strong> Plan.Appendix E: GlossaryThis appendix provides a glossary <strong>of</strong> terms used throughout the Plan.Appendix F: <strong>California</strong> DisastersThis appendix lists major <strong>California</strong> disasters since 1950.Appendix G: List <strong>of</strong> DamsThis appendix provides a list <strong>of</strong> major dams and reservoirs in Los Angeles County.Appendix H: MapsThis appendix contains the maps referenced throughout the Plan.Appendix I: ReferencesThis appendix contains a listing <strong>of</strong> references used in the preparation <strong>of</strong> the Plan.Appendix J: Plan AdoptionDocumentation regardingthe formal adoption <strong>of</strong> the Plan.2006 PAGE 1 - 9
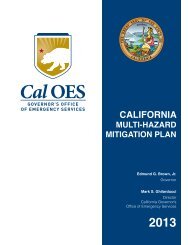
Natural <strong>Hazard</strong>s <strong>Mitigation</strong> PlanCity <strong>of</strong> <strong>Glendale</strong>, <strong>California</strong>SECTION 2:Section 2 – Community Pr<strong>of</strong>ileCOMMUNITY PROFILEPast earthquakes, wildfires, floods, and landslides have exposed <strong>Glendale</strong>’s residents andbusinesses to the financial and emotional costs <strong>of</strong> recovery. These same natural hazards have thepotential to pose a future negative impact on the citizens, property, environment, and economy<strong>of</strong> the city <strong>of</strong> <strong>Glendale</strong>. Furthermore, as more people move to areas vulnerable to these hazards,the risk associated with these natural hazards increases. The historical record shows that evenin those parts <strong>of</strong> the community that are essentially “built-out” (i.e., have little or no vacant landremaining for development), population density continues to increase as low-density housing isreplaced with medium- and high-density development projects. This in effect places even morepeople at risk from the hazards that can impact the area.Given that natural hazards are inevitable, and that populations in hazardous areas are increasingin response to development pressures, there is an urgent need to develop strategies, coordinateresources, and increase public awareness to reduce the risk and losses from future naturalhazard events. Identifying the risks posed by natural hazards, and developing strategies toreduce the impact <strong>of</strong> a hazard event can assist in protecting life and property. In <strong>Glendale</strong>, localresidents and businesses can work together with the City to create a natural hazards mitigationplan that addresses the potential natural hazards <strong>of</strong> most concern to <strong>Glendale</strong>.Geography and the EnvironmentThe city <strong>of</strong> <strong>Glendale</strong> is located in northeast Los Angeles County at the eastern end <strong>of</strong> the SanFernando Valley. The city has a total area <strong>of</strong> 30.7 square miles <strong>of</strong> developed and undevelopedland and is characterized by sharp contrasts in terrain. Distinct topographic features separatethe city into four specific areas. From north to south these include: 1) the steeply rising rangefront <strong>of</strong> the San Gabriel Mountains, 2) the gently south-dipping but elevated alluvial fan surfaceknown as the La Cañada Valley at the base <strong>of</strong> the San Gabriel Mountains, 3) the lower, but notless impressive, bedrock highlands <strong>of</strong> the Verdugo Mountains and the San Rafael Hills, and 4)the even more gently south-dipping alluvial surface (piedmont) at the base <strong>of</strong> the VerdugoMountains. Farther south, just outside city limits, is the northeastern end <strong>of</strong> the Santa MonicaMountains, which are locally referred to as the Hollywood Hills.Elevations in the southern part <strong>of</strong> the city range from about 420 feet above mean sea level at itssouthernmost point to about 800 feet at the base <strong>of</strong> the Verdugo Mountains. Mount Verdugoreaches an elevation <strong>of</strong> 3,126 feet, whereas the top <strong>of</strong> Flint Peak in the San Rafael Hills sits at anelevation <strong>of</strong> 1,889 feet. In the San Gabriel Mountains, the highest point within the city is at anelevation <strong>of</strong> about 4,800 feet.The city is served by the 210, 134, 5 and 2 freeways. Its major arterial highways include ChevyChase Drive, <strong>Glendale</strong> Avenue - Verdugo Road - Canada Boulevard - La Crescenta Avenue,Brand Boulevard, Central Avenue, and San Fernando Road, which run generally north to south,and Foothill Boulevard, Honolulu Avenue, Glenoaks Boulevard, Broadway, Colorado Street, andChevy Chase Drive, which run primarily east to west (see Map 2.1).Passenger transportation is provided by the Beeline Transit System, MetropolitanTransportation Authority (MTA) bus lines, the MTA Gold Line light rail system, Metrolink,City <strong>of</strong> Los Angeles Department <strong>of</strong> Transportation LADOT shuttle and commuter expressbuses, and <strong>Glendale</strong>’s Dial-a-Ride Program.Map 2.1: Freeways and Major Arterial Highways in the <strong>Glendale</strong> Area2006 PAGE 2 - 1
Natural <strong>Hazard</strong>s <strong>Mitigation</strong> PlanCity <strong>of</strong> <strong>Glendale</strong>, <strong>California</strong>Section 2 – Community Pr<strong>of</strong>ileSource: MapQuest, 2005.Major RiversThe nearest major river to <strong>Glendale</strong> is the Los Angeles River, located at its closest reach about0.5 miles west <strong>of</strong> the southern one-third <strong>of</strong> the city. The Los Angeles River hugs the north side<strong>of</strong> the Hollywood Hills as it flows easterly through the area; when it reaches the eastern end <strong>of</strong>the hills, the river veers south to flow through the “Narrows” and the city <strong>of</strong> Los Angeles on itsway to the Pacific Ocean. The two heavily populated alluvial surfaces at the base <strong>of</strong> theVerdugo and San Gabriel Mountains are linked by the south-trending canyon carved by theVerdugo Wash that separates the Verdugo Mountains on the west from the San Rafael Hills onthe east.The steep southern flank <strong>of</strong> the San Gabriel Mountains is deeply incised by gorges and canyonsthat drain south into the La Cañada Valley, where they have been channelized, conveying theirflows south to Verdugo Wash (see Plate H-1: Geomorphic Map <strong>of</strong> <strong>Glendale</strong> in Appendix H).The three canyons that are located mostly within city limits include Ward, Dunsmore, andCooks. Several other streams draining the San Gabriel Mountains are also channelized throughthe La Crescenta area and into the northern portion <strong>of</strong> <strong>Glendale</strong>; these include the EagleCanyon, Pickens, Hills and Winery Canyon channels. Nearly all the tributaries flowingnortherly and easterly out <strong>of</strong> the Verdugo Mountains and westerly out <strong>of</strong> the San Rafael Hillsempty into Verdugo Wash. South <strong>of</strong> the mountains, Verdugo Wash turns to the westsouthwestand joins the Los Angeles River near the junction <strong>of</strong> Highway 134 with the 5Freeway (Interstate 5). Drainage from the southwestern slope <strong>of</strong> the Verdugo Mountains flowsdirectly across the alluvial fan and into the Los Angeles River. Verdugo Wash has been confinedto a man-made channel through most <strong>of</strong> <strong>Glendale</strong> to reduce its potential to flood the city.2006 PAGE 2 - 2
Natural <strong>Hazard</strong>s <strong>Mitigation</strong> PlanCity <strong>of</strong> <strong>Glendale</strong>, <strong>California</strong>Section 2 – Community Pr<strong>of</strong>ileClimateThe city <strong>of</strong> <strong>Glendale</strong> enjoys a mild climate with an average high temperature <strong>of</strong> 77 degreesFahrenheit. Temperatures in the city generally range from a low <strong>of</strong> 43 degrees in the wintermonths to a high <strong>of</strong> 90 degrees in the summer months. However, Santa Ana winds can bringhigher temperatures and very low humidity. Temperatures rarely exceed 100 degrees in thesummer months (June - September), and rarely drop below 30 degrees in the winter months(November-March).Table 2.1: Average Monthly Temperature in <strong>Glendale</strong> (in ºF)9080706050403020100MarchMayJulyFebruaryJanuraryDecemberNovemberOctoberSeptemberAugustAprilJuneAverage HighAverage LowRainfall in the city averages 17.8 inches <strong>of</strong> rain per year (see Table 2.2). The term “averagerainfall” is misleading, however, because over the recorded history <strong>of</strong> rainfall in <strong>Glendale</strong>,rainfall amounts have ranged from one-third the normal amount to more than double thenormal amount. Furthermore, rainfall in <strong>Glendale</strong>, as in most <strong>of</strong> southern <strong>California</strong>, tends t<strong>of</strong>all in large amounts during sporadic and <strong>of</strong>ten heavy storms rather than consistently in severalmoderate storms at somewhat regular intervals. In short, rainfall in southern <strong>California</strong> mightbe characterized as “feast or famine” within a single year.Rocks and SoilThe properties <strong>of</strong> the rocks and soils underlying the city <strong>of</strong> <strong>Glendale</strong> determine to some extentthe potential geologic hazards that may occur in the area, such as the susceptibility <strong>of</strong> an area toearthquake-induced liquefaction, expansive soils, and landslides. Therefore, understanding thegeologic characteristics <strong>of</strong> the bedrock and soils <strong>of</strong> <strong>Glendale</strong> is an important step in hazardmitigation and avoiding at-risk development. The types and characteristics <strong>of</strong> the bedrock,unconsolidated sediments (weathered rock material), and soil that underlie the city also reflectthe geologic and climatic processes that have affected this region over the past few millionyears.4.543.532.521.510.5Table 2.2: Average Rainfall in <strong>Glendale</strong> (in Inches)2006 PAGE 2 - 30Jan Feb Mar April May June July Aug Sept Oct Nov DecRainfall (Inches)
Natural <strong>Hazard</strong>s <strong>Mitigation</strong> PlanCity <strong>of</strong> <strong>Glendale</strong>, <strong>California</strong>Section 2 – Community Pr<strong>of</strong>ileThe most striking geologic features <strong>of</strong> the <strong>Glendale</strong> area are the Verdugo and San GabrielMountains, ranges that form a dramatic backdrop to the southern and northern portions,respectively, <strong>of</strong> the city. These rugged, geologically young uplands consist <strong>of</strong> a series <strong>of</strong>predominantly east-west trending mountain ranges and intervening valleys. The mountains aremade up <strong>of</strong> various bedrock types, including igneous (granite and diorite) and metamorphic(gneiss and quartzite) rocks (see Plate H-2: Geologic Map <strong>of</strong> <strong>Glendale</strong>, in Appendix H). Asthese bedrock types weather and break down over time, they form unconsolidated sedimentsconsisting <strong>of</strong> silt-, sand-, and gravel-sized pieces <strong>of</strong> granite and gneiss. These unconsolidatedsediments are transported into the intervening valleys by running water, gravity, and wind,where they are deposited on the floodplain and fans as alluvium and fan material. This processhas been occurring for thousands <strong>of</strong> years, and some <strong>of</strong> the earliest alluvium (referred to as olderalluvium), which crops out in the La Cañada Valley and the piedmont surface south <strong>of</strong> theVerdugo Mountains, has developed secondary clay minerals that make the deposits weaklyconsolidated, and with a slightly red color as a result <strong>of</strong> some <strong>of</strong> the iron minerals turning torust.Other Significant Geologic FeaturesThe city <strong>of</strong> <strong>Glendale</strong>, like most <strong>of</strong> the Los Angeles Basin, overlies or is near to several knownfaults capable <strong>of</strong> producing damaging earthquakes. The major faults that have the potential toaffect the city <strong>of</strong> <strong>Glendale</strong> include the Sierra Madre, Verdugo, Hollywood, Raymond, PuenteHills Blind Thrust, San Andreas, San Gabriel, Newport-Inglewood, and Palos Verdes faults(refer to Section 6, see Map 2-2, and Plate H-4 in Appendix H). The San Gabriel Mountains arebeing uplifted along the Sierra Madre fault zone, whereas the Verdugo Mountains are beinguplifted along the Verdugo fault. Uplift <strong>of</strong> these mountains accelerated in mid-Pleistocene time,about 500,000 years ago, continues today, and is one <strong>of</strong> the fastest in the world, in the context <strong>of</strong>geologic time.The Los Angeles Basin experiences many small tremors every year, but its history has beenshaped by several relatively infrequent, but powerful earthquakes. The first historicalearthquake was recorded in 1769, when the Portola expedition was camped next to the SantaAna River in what is now the city <strong>of</strong> Orange, but earthquakes undoubtedly have shaken the areafor millennia. Other more recent earthquakes were recorded in 1812, 1857, 1933 (Long Beach),1987 (Whittier), and 1994 (Northridge). The 1857 Fort Tejon event was a large magnitude 8+earthquake on the San Andreas fault that caused only minor damage because the epicentral areawas largely unpopulated. A similar-sized earthquake today would result in thousands <strong>of</strong>casualties and billions <strong>of</strong> dollars in property loss. Given that paleoseismological researchindicates that great earthquakes (i.e., M8.0+) occur on the San Andreas fault at intervalsbetween 45 and 332 years, with an average interval <strong>of</strong> 140 years, another similar M8 earthquakeon the San Andreas fault is considered likely in the not-too-distant future. This fact aloneshould encourage local governments to strengthen their infrastructure and prepare for “the BigOne.” Furthermore, as we will discuss in this document, there are other lesser-known faultscloser to <strong>Glendale</strong> that have the potential to cause more damage to the city than the moredistant San Andreas fault. The earthquake hazard to the Los Angeles basin and the citiestherein is severe.2006 PAGE 2 - 4
Natural <strong>Hazard</strong>s <strong>Mitigation</strong> PlanCity <strong>of</strong> <strong>Glendale</strong>, <strong>California</strong>Section 2 – Community Pr<strong>of</strong>ileMap 2.1: Regional Active and Potentially Active Faults near <strong>Glendale</strong>2006 PAGE 2 - 5
Natural <strong>Hazard</strong>s <strong>Mitigation</strong> PlanCity <strong>of</strong> <strong>Glendale</strong>, <strong>California</strong>Section 2 – Community Pr<strong>of</strong>ileIn addition, many areas in the Los Angeles basin, including the city <strong>of</strong> <strong>Glendale</strong>, have sandysoils that are subject to liquefaction. The liquefaction-susceptible zones in the city <strong>of</strong> <strong>Glendale</strong>are shown on Plate H-5 (Appendix H). These zones include the youthful sandy sediments <strong>of</strong>Verdugo Wash and La Cañada Valley, along the Los Angeles River floodplain in the southwestpart <strong>of</strong> the city, and in the bottom <strong>of</strong> the smaller canyons emanating from the VerdugoMountains and the San Rafael Hills, such as Scholl and Sycamore canyons.The city <strong>of</strong> <strong>Glendale</strong> also has areas <strong>of</strong> slope instability potential. Evidence <strong>of</strong> past slope failuresare found throughout the mountain- and foothill-regions <strong>of</strong> the city. The crystalline bedrock <strong>of</strong>the San Gabriel Mountains, weakened by fracturing, shearing, and crushing along numerousfault zones, particularly near the range front, combined with the moderate to extremely steepslopes that have resulted from rapid uplift <strong>of</strong> the mountains, are important elements that createthe setting for the development <strong>of</strong> slope failures. Similar conditions are present in the VerdugoMountains and the San Rafael Hills, where rocks are highly weathered and slope gradients <strong>of</strong> 30degrees or steeper are common. Unfortunately, detailed maps showing previous sites <strong>of</strong>surficial slope failures, such as small landslides, slumps, soil slips, and rockfalls have not beencompiled or published for the <strong>Glendale</strong> area. However, an unpublished engineering geologyreport records several talus rockfalls on steep slopes and roadcuts in the Verdugo Mountains (R.T. Frankian & Associates, 1968). The common occurrence <strong>of</strong> rockfalls can also be inferred bythe abundant talus at the base <strong>of</strong> steep slopes and in canyons <strong>of</strong> the San Gabriel Mountains.Significantly, however, areas <strong>of</strong> gross instability such as large deep-seated landslides have notbeen mapped in the <strong>Glendale</strong> area, primarily because the highly fractured crystalline rocks thatunderlie the San Gabriel and Verdugo Mountains and the San Rafael Hills rarely fail as largecohesive units. All <strong>of</strong> the landslides mapped within city limits are relatively small in area, andlimited to the Verdugo Mountains and San Rafael Hills. The larger <strong>of</strong> these landslides areshown on Plates H-2 and H-11 (in Appendix H). The distribution <strong>of</strong> existing landslides in the<strong>Glendale</strong> area and vicinity was compiled from various publications, including Morton andStreitz, (1969), Crook et al. (1987), and Dibblee, (1989a, 1989b, 1991a, 1991b, 2002).Community History<strong>Glendale</strong> has an ethnically diverse and rich cultural heritage that dates back to the 1700s. Thefirst known inhabitants <strong>of</strong> the <strong>Glendale</strong> area were the native Americans known as theGabrielinos. In 1784, Corporal Verdugo <strong>of</strong> the Spanish Army received permission to settle onthis land, and by 1798 he had received title to the land and was a full-time rancher and farmer.Over the next 90 years, Verdugo’s descendants divided and sold <strong>of</strong>f the ranch. In 1884, the arearesidents decided to form a town and chose the name “<strong>Glendale</strong>.” The city <strong>of</strong> <strong>Glendale</strong> wasincorporated in 1906.Population and DemographicsAccording to the 2000 Census data, in the year 2000 the city <strong>of</strong> <strong>Glendale</strong> had a population <strong>of</strong>194,973. The city’s population steadily increased from 1940 through 1990 after a sharp increase<strong>of</strong> about 50,000 between 1930 and 1940 (see Table 2.3 below). Although population growthcontinued in the 1990s, the city’s growth rate slowed to about 8 percent from 1990 to 2000 froman average <strong>of</strong> about 20 percent per decade for the previous 50 years. The <strong>California</strong> Department<strong>of</strong> Finance projects a continued 5 to 7 percent population increase per decade for the near futurein <strong>Glendale</strong>. This population is not evenly distributed throughout the city’s 30.7 square miles,but is rather concentrated in the lowland portions <strong>of</strong> the city, south <strong>of</strong> the Verdugo Mountains,and between the Verdugo Mountains to the south and the San Gabriel Mountains to the north.Over the years, <strong>Glendale</strong> has experienced in-fill development, increasing its population density.This creates greater service loads on the built infrastructure, including roads, water supply,sewer services and storm drains, and existing services.2006 PAGE 2 - 6
Natural <strong>Hazard</strong>s <strong>Mitigation</strong> PlanCity <strong>of</strong> <strong>Glendale</strong>, <strong>California</strong>Section 2 – Community Pr<strong>of</strong>ile250,000Table 2.3: Historic and Projected Population in <strong>Glendale</strong>(2005 estimated by <strong>California</strong> Department <strong>of</strong> Finance; Source: U.S. Census)200,000150,000100,00050,00001910 1930 1950 1970 1990 2005(est)An increase in population creates more community exposure in the face <strong>of</strong> natural hazards, andchanges how agencies prepare for and respond to natural hazards. For example, more peopleliving at the wildland/urban interface, such as in the Verdugo Hills <strong>of</strong> <strong>Glendale</strong>, can increase therisk <strong>of</strong> wildland fire. This increased potential for wildfires results from the fact that most firesare caused by human activities, and as there are more people living and playing in the interface,there are more opportunities for fires to get started. At the same time, a larger number <strong>of</strong>people at the wildland/urban interface means that more people are exposed to and can thereforebe injured by fire, and there is also an increased potential for property damage.Urban/wildland fires are not the only concern in <strong>Glendale</strong>. In the 1987 publication, FireFollowing Earthquake issued by the All Industry Research Advisory Council, CharlesScawthorn explains how a post-earthquake urban conflagration would develop. Theconflagration would be started by fires resulting from earthquake damage, but made muchworse by the loss <strong>of</strong> pressure in the fire mains, caused by either lack <strong>of</strong> electricity to powerwater pumps, and/or loss <strong>of</strong> water pressure resulting from broken water mains. Furthermore,increased density can affect risk. High-density housing increases the chances <strong>of</strong> fire spreadingfrom one structure to the next. Also, narrow streets in residential areas (and especially in thehillside areas) are more difficult for emergency service vehicles to navigate, and the higher ratio<strong>of</strong> residents to emergency responders affects response times.Natural hazards do not discriminate, but the impacts in terms <strong>of</strong> vulnerability and the ability torecover vary greatly among the population. According to Peggy Stahl <strong>of</strong> FEMA’sPreparedness, Training, and Exercise Directorate, 80 percent <strong>of</strong> the disaster burden falls on thepublic, and a disproportionate percentage <strong>of</strong> the burden is placed upon special needs groups,including the elderly, women, children, minorities, and the poor. As the recent eventsassociated with the hurricane Katrina in the Gulf Coast have shown, vulnerable populations,including seniors, disabled citizens, women, and children, as well as those people living inpoverty, are <strong>of</strong>ten disproportionately impacted by natural hazards.Present-day <strong>Glendale</strong> is a racially and ethnically diverse community, (see Table 2.4 below). Forthe 2000 Census, the U.S. Census Bureau introduced new racial categories, which allowed2006 PAGE 2 - 7
Natural <strong>Hazard</strong>s <strong>Mitigation</strong> PlanCity <strong>of</strong> <strong>Glendale</strong>, <strong>California</strong>Section 2 – Community Pr<strong>of</strong>ilerespondents greater flexibility in how they define themselves. Between the 1990 and 2000Census, the percentage <strong>of</strong> “whites” in <strong>Glendale</strong> dropped about 10 percent, which approximatelycoincides with the percentage <strong>of</strong> people who define themselves as being <strong>of</strong> “two or more races.”Also, between 1990 and 2000, the number <strong>of</strong> Armenians and Asians increased from 17 to 27percent and 14 to 16 percent, respectively, <strong>of</strong> <strong>Glendale</strong>’s total population. The number <strong>of</strong>Hispanics (any race) dropped from 21 to 19 percent <strong>of</strong> the population. It should be noted thatHispanic ethnicity is a separate data category from race and is therefore not included on aseparate line in Table 2.4. The ethnic and cultural diversity suggests a need to address multiculturalneeds and services.Table 2.4: <strong>Glendale</strong>’s Racial Composition - Year 2000 CensusRACEPERCENTWhite 63.5African-American 1.3Asian 16.1Native American 0.3Native Hawaiian and Other Pacific Islander 0.1Other race 8.6Two or more races 10.1Source: U.S. Census BureauThe percentage <strong>of</strong> individuals living in poverty in the city <strong>of</strong> <strong>Glendale</strong> is 15.5 percent, which ishigher than the <strong>State</strong>’s 12.9 percent. Of those people living below the poverty line in <strong>Glendale</strong>,20.7 percent <strong>of</strong> them are less than 18 years old, and 11.9 percent are over the age <strong>of</strong> 65 (seeTable 2.5 below for more specific information). The number <strong>of</strong> <strong>Glendale</strong> families below thepoverty line is about 13.6 percent <strong>of</strong> the total population, or 6,802 families. Most live in thecentral and southern parts <strong>of</strong> the city.Table 2.5: Percentage <strong>of</strong> Poverty in City <strong>of</strong> <strong>Glendale</strong> based on 2000 Census DataPOVERTY STATUS NUMBER PERCENTFamilies 6,802Percent below poverty level 13.6With related children under 18 years 4,738Percent below poverty level 18.6With related children under 5 years 1,858Percent below poverty level 20.1Families with female householder, no husband present 1,512Percent below poverty level 17.9With related children under 18 years 1,102Percent below poverty level 26.1With related children under 5 years 352Percent below poverty level 34.4Individuals 29,927Percent below poverty level 15.518 years and over 20,921Percent below poverty level 14.065 years and over 3,039Percent below poverty level 11.9Related children under 18 years 8,9122006 PAGE 2 - 8
Natural <strong>Hazard</strong>s <strong>Mitigation</strong> PlanCity <strong>of</strong> <strong>Glendale</strong>, <strong>California</strong>Section 2 – Community Pr<strong>of</strong>ilePOVERTY STATUS NUMBER PERCENTPercent below poverty level 20.7Related children 5 to 17 years 6,764Percent below poverty level 21.0Unrelated individuals 15 years and over 5,828Percent below poverty level 19.3Source: U.S. Census BureauExamining the reach <strong>of</strong> hazard mitigation policies to special-needs populations may assist inincreasing access to services and programs. FEMA's Office <strong>of</strong> Equal Rights addresses this needby suggesting that agencies and organizations planning for natural disasters identify specialneedspopulations, make recovery centers more accessible, and review practices and proceduresto remedy any discrimination in relief application or assistance.The cost <strong>of</strong> natural hazards recovery can place an unequal financial responsibility on the generalpopulation when only a small proportion may benefit from governmental funds used to rebuildprivate structures. Discussions about natural hazards that include local citizen groups,insurance companies, and other public and private sector organizations can help ensure that allmembers <strong>of</strong> the population are a part <strong>of</strong> the decision-making processes.Land and DevelopmentIn the earliest days, development in southern <strong>California</strong> was a cycle <strong>of</strong> boom and bust. TheSecond World War, however, dramatically changed that cycle. Military personnel and defenseworkers came to southern <strong>California</strong> to fill the logistical needs created by the war effort. Theavailable housing was rapidly exhausted and existing commercial centers proved inadequate forthe influx <strong>of</strong> people. Immediately after the war, construction began on the freeway system, andthe face <strong>of</strong> southern <strong>California</strong> was forever changed. Home developments and shopping centerssprung up everywhere, and within a few decades the central basin <strong>of</strong> Los Angeles County wasvirtually built out. This pushed new development farther and farther away from the urbancenter.<strong>Glendale</strong>’s General Plan addresses the use and development <strong>of</strong> private land, includingresidential and commercial areas. This plan is one <strong>of</strong> the City's most important tools inaddressing environmental challenges, including transportation and air quality, growthmanagement, and the conservation <strong>of</strong> natural resources such as clean water and open spaces.However, the environment <strong>of</strong> most cities in Los Angeles County is nearly identical with that <strong>of</strong>their immediate neighbors and the transition from one incorporated municipality to another is<strong>of</strong>ten seamless to most people. This means that many <strong>of</strong> the environmental challenges listedabove need to be addressed on a regional scale, rather than on a city-by-city basis, to effectchange. Similarly, the area’s exposure to natural hazards is similar to that <strong>of</strong> severalneighboring communities, but a city’s response to that vulnerability can <strong>of</strong>ten be addressedindependently. For example, liquefaction susceptible sediments underlie large portions <strong>of</strong> theLos Angeles River floodplain, oblivious to corporate boundaries. However, a city can choose toimplement more strict building codes to study and mitigate the hazard posed by liquefaction, oreven restrict development in the most highly susceptible areas, thereby reducing its risk to alevel below that <strong>of</strong> adjoining municipalities with a similar susceptibility but less stringentdevelopment codes.Housing and Community DevelopmentHousing stock is many direct and indirect ways one <strong>of</strong> the most important commodities in acity. If a natural disaster, such as an earthquake, flood or landslide, damages several houses, thishas a significant impact not only on the residents <strong>of</strong> those structures, but on the City also. An2006 PAGE 2 - 9
Natural <strong>Hazard</strong>s <strong>Mitigation</strong> PlanCity <strong>of</strong> <strong>Glendale</strong>, <strong>California</strong>Section 2 – Community Pr<strong>of</strong>ileextreme, but real example <strong>of</strong> this is New Orleans; a year after Katrina, entire neighborhoods arevacant, the houses still in ruin. Past residents <strong>of</strong> these communities have started new lives inother cities and states and many do not plan to come back, substantially diminishing NewOrleans’ tax base, and hindering the City’s ability to rebuild and recover.In the year 2000, the median value <strong>of</strong> homes in the city <strong>of</strong> <strong>Glendale</strong> was estimated at $326,700(2000 Census). However, the demand for housing has outpaced the available supply, and therecent low interest rates have further fueled this demand. As a result, in 2004, the median homeprice in <strong>Glendale</strong> was estimated to be over $557,000, which is about a 70 percent jump in valuefrom the 2000 values. Even at these prices, the demand for low- to medium-priced homescontinues to be strong, given the few existing homes available. There are approximately 73,611total housing units in the city <strong>of</strong> <strong>Glendale</strong>. Of these, 29,492 (40 percent) are single-familyhomes, 7,276 (10 percent) are condominiums, and 36,843 (50 percent) are apartments. Seventysix(76) percent <strong>of</strong> these housing units were built before the 1980s, before the more recent (andstringent) building and fire codes for public safety were adopted. To address developmentissues, <strong>Glendale</strong>’s Department <strong>of</strong> Community Development and Housing has engaged inactivities that promote the quality <strong>of</strong> life for the citizens <strong>of</strong> the city <strong>of</strong> <strong>Glendale</strong>. The large-scaleeffort includes neighborhood and other public facility improvements, rehabilitation <strong>of</strong> existinghousing, new housing development, and home purchase assistance.There is an increased concentration <strong>of</strong> resources and capital in <strong>Glendale</strong>. The best indicator <strong>of</strong>this is the increasing per-capita income in the region since the 1970s. Per-capita income is anestimate <strong>of</strong> total personal income divided by the total population. This estimate can be used tocompare economic areas as a whole, but it does not reflect how the income is distributed amongresidents <strong>of</strong> the area being examined. For example, the City's per-capita income has beenincreasing at a faster rate than that <strong>of</strong> <strong>California</strong> and the United <strong>State</strong>s, and yet, as reportedabove, <strong>Glendale</strong> also has a relatively large percentage <strong>of</strong> population living below the povertylevel. This shows that wealth in the area is distributed unevenly among different segments <strong>of</strong>the population.Subtle but very measurable changes occur constantly in communities that increase the potentialloss that will occur in a major disaster. There are a number <strong>of</strong> factors that contribute to thisincreasing loss potential. First, populations continue to increase, putting more people at riskwithin a defined geographic space. Second, inflation constantly increases the worth <strong>of</strong> realproperty and permanent improvements. Third, the amount <strong>of</strong> property owned per capitaincreases over time. Information from the U.S. Census Bureau shows gains in average housingstandards in the United <strong>State</strong>s (Table 2.6).Table 2.6: Historical Trends in Housing Standards in the United <strong>State</strong>sPROPERTY PER PERSON 1975 1998Average size <strong>of</strong> new homes 1,645 sq. ft. 2,190 sq. ft.Homes with 4+ bedrooms 21% 33%Homes with 2½ or more baths 20% 52%Source: U.S. Census BureauIf we look at the greatest recorded earthquakes in American history, and compare the level <strong>of</strong>population and development today with that which existed at the time <strong>of</strong> these events, the scale<strong>of</strong> potential damage is staggering (Source: Risk Management Solutions).2006 PAGE 2 - 10
Natural <strong>Hazard</strong>s <strong>Mitigation</strong> PlanCity <strong>of</strong> <strong>Glendale</strong>, <strong>California</strong>Section 2 – Community Pr<strong>of</strong>ile• 1886 Charleston, South Carolina M7.3 earthquakeEstimated insured damage if it happened today: $10 Billion• 1906 San Francisco earthquake, significant fire following seismic damageEstimated insured damage if it happened today: $36 Billion• 1811-12 New Madrid, Missouri earthquakes, series <strong>of</strong> 4 earthquakes over 7 weeksEstimated insured damage if this happened today: $88 BillionEmployment and Industry<strong>Glendale</strong>'s principal employment and industrial activities include service industries,manufacturing, retail, entertainment, tourism, and commerce. The city’s business climate hasbeen strong and growing with concentrations <strong>of</strong> retail and wholesale trade, pr<strong>of</strong>essionalservices, and real estate firms. <strong>Glendale</strong> provided over 91,500 jobs in 2000. Education andhealth-related services accounted for the largest percentage (19.9%), followed by pr<strong>of</strong>essionalservices (12%), retail trade (11.4%), and manufacturing (10.6%). Occupations <strong>of</strong> persons 16years and older, per the 2000 Census, are apportioned as listed in Table 2.7.2006 PAGE 2 - 11
Natural <strong>Hazard</strong>s <strong>Mitigation</strong> PlanCity <strong>of</strong> <strong>Glendale</strong>, <strong>California</strong>Section 2 – Community Pr<strong>of</strong>ileTable 2.7: Employment in <strong>Glendale</strong> by IndustryEMPLOYMENT BY INDUSTRYPERCENTAgriculture, forestry, fishing and hunting, and mining 0.2Construction 4.4Manufacturing 10.6Wholesale trade 4.1Retail trade 11.4Transportation and warehousing, and utilities 3.8Information 6.5Finance, insurance, real estate, and rental and leasing 9.3Pr<strong>of</strong>essional, scientific, management, administrative and waste mgt. 12.0Educational, health and social services 19.9Arts, entertainment, recreation, accommodation and food services 7.6Other services (except public administration) 6.8Public administration 3.4Government 2.6Source: U.S. Census Bureau<strong>Mitigation</strong> activities are needed at the business level to ensure the safety and welfare <strong>of</strong> workersand limit damage to industrial infrastructure. Employees are highly mobile, commuting fromsurrounding areas to industrial and business centers. This creates a greater dependency onroads, communications, accessibility and emergency plans to reunite people with their families.Before a natural hazard event, large and small businesses can develop strategies to prepare fornatural hazards, respond efficiently, and prevent loss <strong>of</strong> life and property.Transportation and Commuting PatternsThe city <strong>of</strong> <strong>Glendale</strong> is the 3 rd largest, based on its population, in the Los Angeles MetropolitanStatistical Area (LAMSA). Over the past decade, the LAMSA experienced rapid growth inemployment and population. There has been a constant increase in vehicle licensingtransactions in the Los Angeles region (see table 2.8).Table 2.8 - Automobile Registration in the Los Angeles Metropolitan Statistical AreaType <strong>of</strong> Vehicle 2001 2000 1999 1998Autos 5,296,141 5,134,168 4,935,605 4,825,512Trucks 1,026,961 1,021,397 991,315 970,993Trailers 288,638 283,402 288,487 262,506Motorcycles 87,986 81,167 75,569 74,210Total 6,699,726 6,520,134 6,290,976 6,133,221Private automobiles are the dominant means <strong>of</strong> transportation in southern <strong>California</strong> and in thecity <strong>of</strong> <strong>Glendale</strong>. However, <strong>Glendale</strong> meets its public transportation needs through a mixture <strong>of</strong>a regional transit system (MTA) <strong>of</strong> bus lines and light-rail system (MTA Gold Line),Metrolink, the City <strong>of</strong> Los Angeles Department <strong>of</strong> Transportation LADOT shuttle andcommuter express buses, and the City-contracted bus system (Beeline Transit System) whichserves 1.7 million riders a year. In addition, the City provides curb-to-curb transportation for54,000 elderly or disabled residents, and promotes alternative transportation activities.<strong>Glendale</strong> has included a mobility plan in its General Plan. The City benefits from a diverse2006 PAGE 2 - 12
Natural <strong>Hazard</strong>s <strong>Mitigation</strong> PlanCity <strong>of</strong> <strong>Glendale</strong>, <strong>California</strong>Section 2 – Community Pr<strong>of</strong>iletransportation system that includes transit, bicycle, and pedestrian links, as well as vehicularlinks. The City’s local system connects with the larger regional system, and the operation <strong>of</strong> thetwo systems is interdependent. The mobility plan establishes how the City manages the localsystem to provide for the safe and convenient movement <strong>of</strong> people and goods. It also addresseshow the City influences and manages connections with the regional transportation system.The vision <strong>of</strong> the mobility plan is to promote a livable community where people can circulatewithout cars. Consistent with this principle, the mobility plan has four primary objectives thatguide how the City’s transportation system is managed:• Promote a livable and economically strong community;• Encourage non-auto travel;• Protect neighborhoods by discouraging traffic from passing through neighborhoods; and• Manage multimodal corridors to improve citywide transportation services.As noted above, one <strong>of</strong> the key components <strong>of</strong> the mobility plan is the encouragement <strong>of</strong> nonautomodes <strong>of</strong> transportation, such as transit, bicycling, car-sharing, and walking. Increasingthe use <strong>of</strong> non-auto travel options yields numerous community benefits including reducedtraffic, less need for costly roadway improvement projects, a more enjoyable pedestrianenvironment, and improved air quality.2006 PAGE 2 - 13
Natural <strong>Hazard</strong>s <strong>Mitigation</strong> PlanCity <strong>of</strong> <strong>Glendale</strong>, <strong>California</strong>SECTION 3:Section 3 – Risk AssessmentRISK ASSESSMENTWhat is a Risk Assessment?Risk assessment is the process <strong>of</strong> estimating or calculating the potential losses (in terms <strong>of</strong> life,injuries, and property and economic damage) resulting from a natural hazard event. To conductthis analysis, it is necessary to identify and understand the hazards that can impact thecommunity (hazard identification and hazard pr<strong>of</strong>iling), assess the vulnerability <strong>of</strong> the people,buildings and infrastructure that can be impacted by each hazard identified (vulnerabilityassessment and asset inventory), and estimate the potential losses (risk analysis). Each <strong>of</strong> thesetasks, as it pertains to the city <strong>of</strong> <strong>Glendale</strong>, is described further below:1) <strong>Hazard</strong> IdentificationThis is the description <strong>of</strong> the geographic extent, potential intensity and the probability <strong>of</strong>occurrence <strong>of</strong> a given hazard. Maps are frequently used to display hazard identificationdata. The city <strong>of</strong> <strong>Glendale</strong> and its residents can be impacted by earthquakes (and secondaryhazards triggered by earthquakes), storm flooding and debris flows, urban and wildlandfires, landslides, dam and water reservoir failures, strong winds (such as Santa Ana winds),tornadoes, and dangerous vectors, plants and animals. Man-made hazards that couldimpact the area include terrorist attacks using weapons <strong>of</strong> mass destruction, accidentalreleases <strong>of</strong> hazardous materials, aviation accidents, and civil unrest events. However, theCity has chosen to discuss only natural hazards in this document, and specifically thehazards <strong>of</strong> earthquakes, wildland fires, floods (storm flooding, debris flows and inundationdue to catastrophic failure <strong>of</strong> dams and water reservoirs), and landslides. These are thehazards with the potential to cause the most damage, in terms <strong>of</strong> losses, at the city. Each <strong>of</strong>these hazards will be described in detail in the following sections. The geographic extent<strong>of</strong> each <strong>of</strong> the identified hazards has been identified in the City’s Safety Element <strong>of</strong> theGeneral Plan using the most current data available, and the maps that accompany thatdocument have been included herein, throughout the text <strong>of</strong> the report, and in Appendix H(see list on Table 3.1 below).2) Pr<strong>of</strong>iling <strong>Hazard</strong> EventsThis process describes the causes and characteristics <strong>of</strong> each hazard, how it has affected thecity <strong>of</strong> <strong>Glendale</strong> in the past, and what part <strong>of</strong> <strong>Glendale</strong>'s population, infrastructure, andenvironment has historically been vulnerable to each specific hazard. A pr<strong>of</strong>ile <strong>of</strong> eachhazard discussed in this Plan is provided in Sections 6 through 9. Therefore, for adescription <strong>of</strong> the history <strong>of</strong> hazard-specific events, please see the appropriate hazardsection.3) Vulnerability Assessment/Inventorying AssetsThis is a combination <strong>of</strong> hazard identification with an inventory <strong>of</strong> the existing (or planned)property development(s) and population(s) exposed to a hazard. Critical facilities are <strong>of</strong>particular concern because these entities provide essential products and services to thegeneral public that are necessary to preserve the welfare and quality <strong>of</strong> life in <strong>Glendale</strong> andfulfill important public safety, emergency response, and/or disaster recovery functions.2006 PAGE 3 - 1
Natural <strong>Hazard</strong>s <strong>Mitigation</strong> PlanCity <strong>of</strong> <strong>Glendale</strong>, <strong>California</strong>Section 3 – Risk AssessmentTable 3.1: List <strong>of</strong> Maps that are Part <strong>of</strong> this Local Natural <strong>Hazard</strong>s <strong>Mitigation</strong> PlanMap/Plate Type <strong>of</strong> Map Section <strong>of</strong> the Plan1.1 City <strong>of</strong> <strong>Glendale</strong> (boundaries and major roads) Section 1: IntroductionFreeways and Major Arterials in the <strong>Glendale</strong>2.1Section 2: Community Pr<strong>of</strong>ileArea2.2 Regional Active and Potentially Active Faults Section 2: Community Pr<strong>of</strong>ile3.1 Critical Facilities and Infrastructure Map Section 3: Risk Assessment6.1 Faults in and Near <strong>Glendale</strong> Section 6: Earthquakes6.2 Ground Shaking Zones in <strong>California</strong> Section 6: EarthquakesEarthquake Scenario for the 1857 San Andreas Section 6: Earthquakes6.3Fault Rupture6.4 Scenario for a M6.7 EQ on the Verdugo Fault Section 6: Earthquakes6.5 Scenario for a M6.5 EQ on the Raymond Fault Section 6: EarthquakesDistribution and Severity <strong>of</strong> Damaged Residential Section 6: Earthquakes6.6 Buildings in <strong>Glendale</strong> as a Result <strong>of</strong> ThreeDifferent Earthquake ScenariosDistribution and Severity <strong>of</strong> Damaged Commercial Section 6: Earthquakes6.7 Buildings in <strong>Glendale</strong> as a Result <strong>of</strong> ThreeDifferent Earthquake ScenariosDistribution and Severity <strong>of</strong> Damaged Schools in Section 6: Earthquakes6.8 <strong>Glendale</strong> as a Result <strong>of</strong> Three DifferentEarthquake ScenariosDistribution <strong>of</strong> Damaged Bridges in <strong>Glendale</strong> as a Section 6: Earthquakes6.9Result <strong>of</strong> Three Different Earthquake Scenarios7.1 Historical Wildfires in the <strong>Glendale</strong> Area Section 7, same as H-67.2 Fire <strong>Hazard</strong> Areas in <strong>Glendale</strong> Section 7, same as H-7Geomorphic Map <strong>of</strong> <strong>Glendale</strong> Showing the8.1Section 8, same as H-1Canyons Referred to in the Text8.2 Effects <strong>of</strong> the 1934 Flood in <strong>Glendale</strong> Section 8, same as H-98.3 Dam Inundation Areas in <strong>Glendale</strong> Section 8, same as H-109.1 Geologic Map <strong>of</strong> <strong>Glendale</strong> Section 9, same as H-29.2 Slope Instability Map <strong>of</strong> the <strong>Glendale</strong> Area Section 9, same as H-11H-1 Geomorphic Map <strong>of</strong> <strong>Glendale</strong> Sections 1, 2, 6 – 9, Appendix HH-2 Geologic Map <strong>of</strong> <strong>Glendale</strong> Sections 1, 2, 6, 8-9, Appendix HH-3 Historical Seismicity in <strong>Glendale</strong> Section 6, Appendix HH-4 Fault Map <strong>of</strong> <strong>Glendale</strong> Section 6, Appendix HH-5 Seismic <strong>Hazard</strong>s Map <strong>of</strong> <strong>Glendale</strong> Section 6, 7, 9, Appendix HH-6 Historical Wildfires in <strong>Glendale</strong> Section 7, Appendix HH-7 Fire <strong>Hazard</strong> Areas in <strong>Glendale</strong> Section 7, Appendix HH-8 Non-Compliant Roads in <strong>Glendale</strong> Section 7, Appendix HH-9 Damage Resulting from 1934 Floods in <strong>Glendale</strong> Section 8, Appendix HH-10 Dam Inundation Pathways in <strong>Glendale</strong> Section 8, Appendix HH-11 Slope Instability Map Section 9, Appendix HH-12 Critical Facilities and Infrastructure in <strong>Glendale</strong> Sections 2, 3,Note: These maps were derived from data provided by the City and/or publicly available sources. Care was taken inthe creation <strong>of</strong> these maps, but the maps are provided "as is." The City <strong>of</strong> <strong>Glendale</strong> cannot accept any responsibilityfor errors, omissions or positional accuracy, and therefore, there are no warranties that accompany these maps.Although information from land surveys may have been used in the creation <strong>of</strong> these maps, this does not mean thatthe maps represent or constitute a land survey. Users are cautioned to field verify the information on these productsbefore making any decisions.The critical facilities in <strong>Glendale</strong> have been identified and are illustrated in Map 3.1 and inPlate H-12 (Appendix H). This Plan includes a community issues summary in each hazardsection to identify the most vulnerable and problematic areas in the city, including criticalfacilities, and other public and private properties. Additional information on essentialstructures and infrastructure has been withheld for security reasons. The inventory isavailable at the Emergency Operations Center from the EOC Coordinator.2006 PAGE 3 - 2
Natural <strong>Hazard</strong>s <strong>Mitigation</strong> PlanCity <strong>of</strong> <strong>Glendale</strong>, <strong>California</strong>Section 3 – Risk Assessment4) Risk AnalysisThe purpose <strong>of</strong> this task is to estimate the potential losses in a geographic area over a givenperiod <strong>of</strong> time by assessing the damage, injuries, and financial costs likely to be sustained.This level <strong>of</strong> analysis involves using mathematical models. The two measurablecomponents <strong>of</strong> risk analysis are magnitude <strong>of</strong> the harm that may result and the likelihood <strong>of</strong>the harm occurring. Describing vulnerability in terms <strong>of</strong> dollar losses provides thecommunity and the <strong>State</strong> with a common framework by which to measure the potentialeffects <strong>of</strong> a given hazard on the assets <strong>of</strong> the area.5) Assessing Vulnerability/ Analyzing Development TrendsThis task provides a general description <strong>of</strong> land uses and development trends within thecommunity so that mitigation options can be considered in land use planning and futureland use decisions. This Plan provides comprehensive description <strong>of</strong> the character <strong>of</strong><strong>Glendale</strong> in the Community Pr<strong>of</strong>ile section (see Section 2). This description includes thegeography and environment, population and demographics, land use and development,housing and community development, employment and industry, and transportation andcommuting patterns. Analyzing these components <strong>of</strong> <strong>Glendale</strong> can help in identifyingpotential problem areas, and can serve as a guide for incorporating the goals and ideascontained in this <strong>Mitigation</strong> Plan into other community development plans.<strong>Hazard</strong> assessments are subject to the availability <strong>of</strong> hazard-specific data. Gathering data for ahazard assessment requires a commitment <strong>of</strong> resources on the part <strong>of</strong> participatingorganizations and agencies. Each hazard-specific section <strong>of</strong> the Plan includes a section onhazard identification using data and information from City, County or <strong>State</strong> agency sources.A loss estimate for the city <strong>of</strong> <strong>Glendale</strong> was conducted for the hazard <strong>of</strong> earthquakes. Thisestimate was done using HazUS, a standardized methodology for earthquake loss estimationbased on a geographic information system (GIS). HazUS was created as a project <strong>of</strong> theNational Institute <strong>of</strong> Building Sciences, funded by the Federal Emergency Management Agency(FEMA), and it is based on guidelines and procedures developed to make standardized lossestimates at a regional scale (allowing estimates to be compared from region to region). HazUSis designed for use by <strong>State</strong>, regional and local governments in planning for loss mitigation,emergency preparedness, response and recovery. HazUS addresses nearly all aspects <strong>of</strong> thebuilt environment, and many different types <strong>of</strong> losses, and newer components <strong>of</strong> the programallow loss estimates for hurricanes, and floods in addition to earthquakes. The earthquakecomponent has been tested against the experience <strong>of</strong> several past earthquakes, and against thejudgment <strong>of</strong> experts.The HAZUS analysis conducted for <strong>Glendale</strong> indicates that an earthquake on the Sierra Madre,Verdugo or Raymond faults has the potential to cause significant damage in the city. Anearthquake on either the Sierra Madre or Verdugo fault could cause moderate damage to asmany as 5,000 structures, amounting to about 15 percent <strong>of</strong> the total building stock in the area.An earthquake on any <strong>of</strong> these three faults also has the potential to impact several <strong>of</strong> <strong>Glendale</strong>’scritical and essential facilities: several schools and bridges are anticipated to be at leastmoderately damaged. The potable water and electricity systems are anticipated to be damagedsignificantly, with thousands <strong>of</strong> costumers potentially without water or power for days after theearthquake. Specifics regarding these earthquake loss estimates are provided in Section 6 <strong>of</strong> thisreport.Vulnerability assessments and risk analyses for the other hazards addressed in the Plan,including floods, wildfires, and landslides, were not conducted, although qualitative assessments2006 PAGE 3 - 3
Natural <strong>Hazard</strong>s <strong>Mitigation</strong> PlanCity <strong>of</strong> <strong>Glendale</strong>, <strong>California</strong>Section 3 – Risk Assessmentare included in the appropriate chapter for each hazard. Overlay comparisons <strong>of</strong> the critical andessential facilities and infrastructure with the <strong>Hazard</strong> Maps were performed for landslide,wildfire, and flooding. This information is available at the EOC. The point <strong>of</strong> contact forpersons interested in this information is the EOC Coordinator. More detailed analysis <strong>of</strong> therisk posed by each hazard will be addressed in future generations <strong>of</strong> this plan.An overlay comparison <strong>of</strong> the wildland fire hazard map (Plate H-7) with the critical facilities andinfrastructure (Plate H-12, Map 3.1) map <strong>of</strong> <strong>Glendale</strong> shows that most, if not all, <strong>of</strong> <strong>Glendale</strong>’scritical and essential facilities are not located in a wildland fire hazard zone. Therefore thepotential wildfire impact to these facilities is significantly less than the potential impact to theresidential structures located in the fire-susceptible Verdugo and San Rafael Hills.Regardless <strong>of</strong> the data available for hazard assessments, there are numerous strategies <strong>Glendale</strong>can take to reduce risk. These strategies are described in the action items detailed in eachhazard section <strong>of</strong> this Plan. <strong>Mitigation</strong> strategies can further reduce disruption to criticalservices, reduce the risk to human life, and alleviate damage to personal and public property andinfrastructure. Action items throughout the hazard sections provide recommendations tocollect further data to map hazard locations and conduct hazard assessments.2006 PAGE 3 - 4
Natural <strong>Hazard</strong>s <strong>Mitigation</strong> PlanCity <strong>of</strong> <strong>Glendale</strong>, <strong>California</strong>Section 3 – Risk AssessmentMap 3.1: Critical Facilities and Infrastructure In and Near <strong>Glendale</strong>2006 PAGE 3 - 5
Natural <strong>Hazard</strong>s <strong>Mitigation</strong> PlanCity <strong>of</strong> <strong>Glendale</strong>, <strong>California</strong>Section 3 – Risk AssessmentFederal Requirements for Risk AssessmentRecent federal regulations for hazard mitigation plans outlined in 44 CFR Part 201 include arequirement for risk assessment. This requirement is intended to provide information that willhelp communities identify and prioritize mitigation activities that will reduce losses from theidentified hazards. There are four natural hazards pr<strong>of</strong>iled in this <strong>Mitigation</strong> Plan, includingearthquakes, wildfires, floods, and landslides. The Federal criteria for risk assessment andinformation on how the <strong>Glendale</strong>’s Natural <strong>Hazard</strong> <strong>Mitigation</strong> Plan meets those criteria isoutlined in the table below:Table 3.2 - Federal Criteria for Risk AssessmentSection 322 PlanRequirementIdentifying <strong>Hazard</strong>sPr<strong>of</strong>iling <strong>Hazard</strong> EventsAssessing Vulnerability:Identifying AssetsAssessing Vulnerability:Estimating Potential Losses:Assessing Vulnerability:Analyzing DevelopmentTrendsHow is this addressed?Each hazard section (Sections 6 through 9) includes aninventory <strong>of</strong> the best available data sources that identify hazardareas. To the extent GIS data are available, the City hasdeveloped maps that identifying the areas most likely to beimpacted by each hazard. These <strong>Hazard</strong> Maps are listed inTable 3.1 and are included in Appendix H.Each hazard section includes documentation on the history <strong>of</strong>past hazard events, and the causes and characteristics <strong>of</strong> thehazard in the city.Where data are available, the vulnerability assessment for eachhazard addressed in the mitigation plan includes an inventory<strong>of</strong> critical facilities within hazardous areas. Each hazardsection provides information on vulnerable areas in the city inthe Community Issues section. Each hazard section alsoidentifies potential mitigation strategies.The Risk Assessment Section <strong>of</strong> this Plan identifies key criticalfacilities and lifelines in the city and includes a map <strong>of</strong> thesefacilities. Vulnerability assessments have been completed forthe hazards addressed in the plan, and quantitative estimateswere made for each hazard where data were available.The Pr<strong>of</strong>ile Section <strong>of</strong> this Plan provides a description <strong>of</strong>development trends in the city, including its geography andenvironment, population and demographics, land use anddevelopment, housing and community development,employment and industry, and transportation and commutingpatterns (Section 2).Critical Facilities and InfrastructureCritical facilities are those parts <strong>of</strong> a community's infrastructure that must remain operationalafter a disaster. Critical facilities include schools, hospitals, fire and police stations, emergencyoperation centers, and communication centers. A vulnerability assessment for these facilitiesinvolves comparing the locations <strong>of</strong> these facilities to the hazardous areas identified in the city.Other important facilities <strong>of</strong>ten considered in risk assessments include:♦High-risk facilities, if severely damaged, may result in a disaster far beyond thefacilities themselves. Examples include power plants, dams and flood control structures,freeway interchanges, bridges, and industrial plants that use or store explosives, toxic2006 PAGE 3 - 6
Natural <strong>Hazard</strong>s <strong>Mitigation</strong> PlanCity <strong>of</strong> <strong>Glendale</strong>, <strong>California</strong>Section 3 – Risk Assessmentmaterials or petroleum products.♦♦♦High-occupancy facilities have the potential <strong>of</strong> resulting in a large number <strong>of</strong>casualties or crowd-control problems. This category includes high-rise buildings, largeassembly facilities, and large multifamily residential complexes.Dependent-care facilities, such as preschools and schools, rehabilitation centers,prisons, group care homes, and nursing homes, house populations with specialevacuation considerations.Economic facilities are those facilities that should remain operational to avoid severeeconomic impacts. These facilities include banks, archiving and vital record-keepingfacilities, airports, and large industrial or commercial centers.Facilities critical to government response and recovery activities (i.e., life safety and propertyand environmental protection) include: 911 centers, emergency operations centers, police andfire stations, public works facilities, communications centers, sewer and water facilities,hospitals, bridges and roads, and shelters. Facilities that if damaged could cause serioussecondary impacts may also be considered "critical."Lifelines are those services that are critical to the health, safety and functioning <strong>of</strong> thecommunity. They are particularly essential for emergency response and recovery after adisaster. Furthermore, certain critical facilities designed to remain functional during andimmediately after a disaster, such as an earthquake, may be able to provide only limited servicesif the lifelines they depend on are disrupted. Lifeline systems include water, sewage, electricalpower, communication, transportation (highways, bridges, railroads, and airports), natural gas,and liquid fuel systems.Some <strong>of</strong> the critical facilities in the city <strong>of</strong> <strong>Glendale</strong> are shown on Maps 3.1 and in Plate H-12.Additional information on the full inventory <strong>of</strong> these facilities is available from the EOCCoordinator.SummaryNatural hazard mitigation strategies can reduce the impacts concentrated at large employmentand industrial centers, public infrastructure, and critical facilities. Natural hazard mitigation forindustries and employers may include developing relationships with emergency managementservices and their employees before disaster strikes, and establishing mitigation strategiestogether. Collaboration among the public and private sector to create mitigation plans andactions can reduce the impacts <strong>of</strong> natural hazards.2006 PAGE 3 - 7
Natural <strong>Hazard</strong>s <strong>Mitigation</strong> PlanCity <strong>of</strong> <strong>Glendale</strong>, <strong>California</strong>SECTION 4:Section 4 – Multi-<strong>Hazard</strong> Goals and Action ItemsGOALSAND ACTION ITEMSThis section provides information on the process used to develop goals and action items thatpertain to the four natural hazards addressed in the <strong>Hazard</strong>s <strong>Mitigation</strong> Plan. It also describesthe framework that focuses the Plan on developing successful mitigation strategies. Theframework is made up <strong>of</strong> three parts: the Mission, Goals, and Action Items.MissionThe mission <strong>of</strong> the city <strong>of</strong> <strong>Glendale</strong>’s Natural <strong>Hazard</strong>s <strong>Mitigation</strong> Plan is to promote soundpublic policy designed to protect citizens, critical facilities, infrastructure, private property, andthe environment from natural hazards. This can be achieved by increasing public awareness,documenting the resources for risk reduction and loss-prevention, and identifying activities toguide the City towards building a safer, more sustainable community.GoalsThe Plan goals describe the overall direction that City agencies, organizations, and citizens cantake to minimize the impacts <strong>of</strong> natural hazards. The goals are stepping-stones between thebroad direction <strong>of</strong> the mission statement and the specific recommendations that are outlined inthe action items.Action ItemsThe action items are activities that City agencies, businesses and residents can be engaged toreduce risk. Each action item includes an estimate <strong>of</strong> the time line for implementation. Shorttermaction items are activities that City agencies may implement with existing resources andauthorities within one to two years. Long-term action items may require new or additionalresources or authorities, and may take between one and five years (or more) to implement.<strong>Mitigation</strong> Plan Goals and Public ParticipationThe Plan goals help to guide direction <strong>of</strong> future activities aimed at reducing risk and preventingloss from natural hazards. The goals listed here serve as checkpoints as agencies andorganizations begin implementing mitigation action items.Protect Life and Property• Implement activities that assist in protecting lives by making existing and proposed newhomes, businesses, infrastructure, critical facilities, and other property more resistant tonatural hazards.• Reduce losses and repetitive damages from chronic hazard events while promotinginsurance coverage for catastrophic hazards.• Improve hazard assessment information from which to make recommendations todiscourage new development in hazardous areas and encourage preventative measures2006 PAGE 4 - 1
Natural <strong>Hazard</strong>s <strong>Mitigation</strong> PlanCity <strong>of</strong> <strong>Glendale</strong>, <strong>California</strong>Section 4 – Multi-<strong>Hazard</strong> Goals and Action Itemsfor existing development in areas vulnerable to natural hazards.Public Awareness• Develop and implement education and outreach programs to increase publicawareness <strong>of</strong> the risks associated with natural hazards.• Provide information on tools, partnership opportunities, and funding resources to assistin implementing mitigation activities.• Keep the public informed on natural hazards mitigation initiatives and activities throughnewspapers, local access channels, City website and newsletters.Natural Systems• Balance watershed planning, natural resource management, and land use planning withnatural hazard mitigation to protect life, property, and the environment.• Preserve, rehabilitate, and enhance natural systems to serve natural hazard mitigationfunctions.Partnerships and Implementation• Strengthen communication and coordinate participation among and within publicagencies, citizens, non-pr<strong>of</strong>it organizations, businesses, and industry to gain a vestedinterest in implementation.• Encourage leadership within public and private sector organizations to prioritize andimplement local, county, and regional hazard mitigation activities.Emergency Services• Establish policy to ensure mitigation projects for existing critical and essential facilities,services, and infrastructure.• Strengthen emergency operations by increasing collaboration and coordination amongpublic agencies, non-pr<strong>of</strong>it organizations, businesses, and industry.• Coordinate and integrate natural hazard mitigation activities, where appropriate, withemergency operations plans and procedures.Public Participation• Input from the public and City staff during development <strong>of</strong> the <strong>Mitigation</strong> Plan assistedin creating and prioritizing Plan goals, with emphasis on the efficacy <strong>of</strong> the proposedaction items, and the proposed timelines.• As the action items in the Plan are implemented, continue to obtain input from2006 PAGE 4 - 2
Natural <strong>Hazard</strong>s <strong>Mitigation</strong> PlanCity <strong>of</strong> <strong>Glendale</strong>, <strong>California</strong>Section 4 – Multi-<strong>Hazard</strong> Goals and Action Itemsdifferent stakeholders as to the success <strong>of</strong> the various action items, and incorporate thisinput into future revisions <strong>of</strong> the Plan.<strong>Hazard</strong> <strong>Mitigation</strong> Plan Action ItemsThe <strong>Hazard</strong>s <strong>Mitigation</strong> Plan identifies short and long-term action items developed throughdata collection and research, and the public participation process. <strong>Mitigation</strong> Plan activitiesmay be considered for funding through Federal and <strong>State</strong> grant programs, and when otherfunds are made available through the City. Action items address multi-hazard (MH) andhazard-specific issues. To help ensure activity implementation, each action item includesinformation on its timeline and coordinating organizations. Upon implementation, thecoordinating organizations may look to partner with other organizations for resources andtechnical assistance. A description <strong>of</strong> possible partner organizations is provided in AppendixA, the Resource Directory <strong>of</strong> this Plan.Multi-hazard action items are presented in this Chapter only. <strong>Hazard</strong>-specific action items areincluded in this Chapter and are also repeated in the individual chapter that addresses theseissues (Chapter 6 for Earthquakes, Chapter 7 for Floods, Chapter 8 for Wildfires, and Chapter 9for Landslides). Putting all the action items together under one chapter heading is meant tomake this document more user friendly, allowing the coordinating organizations to moreeffectively manage their assigned action items.Coordinating OrganizationThe coordinating organization is the organization that is willing and able to organizeresources, find appropriate funding, or oversee activity implementation, monitoring, andevaluation. Coordinating organizations may include local, City, or regional agencies thatare capable <strong>of</strong> or responsible for implementing activities and programs.TimelineAction items include both short and long-term activities. Each action item includes anestimate <strong>of</strong> the timeline for implementation. Short-term action items are activities thatCity agencies may implement with existing resources and authorities within one to twoyears. Long-term action items may require new or additional resources or authorities, andmay take between one and five years (or more) to implement.Ideas for Future ImplementationEach multi-hazard action item includes ideas for future implementation that may beconsidered once the main action items have been addressed. Some <strong>of</strong> these ideas maybecome action items in future versions <strong>of</strong> the Plan.Plan Goals AddressedThe Plan goals addressed by each action item are included as a way to monitor andevaluate how well the <strong>Hazard</strong>s <strong>Mitigation</strong> Plan is achieving its goals once implementationbegins.2006 PAGE 4 - 3
Natural <strong>Hazard</strong>s <strong>Mitigation</strong> PlanCity <strong>of</strong> <strong>Glendale</strong>, <strong>California</strong>Section 4 – Multi-<strong>Hazard</strong> Goals and Action ItemsConstraintsConstraints may apply to some <strong>of</strong> the action items. These constraints may be a currentlack <strong>of</strong> City staff to implement the action, lack <strong>of</strong> funds, or vested property rights thatmight expose the City to legal action as a result <strong>of</strong> adverse impacts on private property.Project Evaluation WorksheetsEvery jurisdiction has limitations on the number <strong>of</strong> mitigation activities that can becompleted within a given period <strong>of</strong> time, usually because <strong>of</strong> limited economic resources.This forces jurisdictions and agencies to review and select the most cost-effectivemitigation projects first, in essence prioritizing mitigation projects by their return oninvestment. Given the competition for available funding, multi-hazard action items aregenerally attractive and more likely to be implemented first. The challenge is to maintaina balance between mitigating projects that can be implemented readily and for a relativelysmall amount <strong>of</strong> money, with longer-term projects that cost more but have the potential toreally reduce the City’s vulnerability to natural hazards.To prioritize the implementation <strong>of</strong> the action items, and in conformance with FEMArecommendations, the committee conducted a generalized “STAPLEE” ranking analysis <strong>of</strong>the proposed action items. The STAPLEE process considers the Social, Technical,Administrative, Political, Legal, Economic, and Environmental benefits <strong>of</strong> a givenproposed action item and weighs these benefits against the costs <strong>of</strong> implementing theaction (see Table 4-1, below). Finding that the action items are in most cases generallyworded, the Committee then used the results <strong>of</strong> the first STAPLEE analysis to identify thoseaction items that have priority and develop more specific implementation measures thataddress the high priority action items. These specific implementation measures arequantifiable — the costs associated with them can be estimated to at least an order <strong>of</strong>magnitude if not better, and the completion <strong>of</strong> these action items is measurable, inagreement with the requirements that future updates <strong>of</strong> this Plan use metrics to qualify thesuccessful implementation <strong>of</strong> the action items in past versions <strong>of</strong> the Plan. These specificaction items were then prioritized using a similar STAPLEE approach. The prioritizationprocess, including a description <strong>of</strong> the criteria and grading system used for both thegeneral and specific action items is summarized in Tables 4-2 (STAPLEE ranking <strong>of</strong> thegeneral action items), 4-3 (STAPLEE ranking <strong>of</strong> specific action items) and 4-4 (gradingcriteria used in the STAPLEE process), respectively. These tables are at the end <strong>of</strong> thissection.Once the process <strong>of</strong> implementing an action item begins and funding for it is sought,<strong>Glendale</strong> can follow the FEMA-required Benefit Cost Analysis (BCA) by preparing andsubmitting to the appropriate agencies a Project Evaluation Worksheet as part <strong>of</strong> theproposal package. An example <strong>of</strong> a Project Evaluation Worksheet is included at the end<strong>of</strong> this section. The data on these worksheets can help the coordinating organization andother agencies and committees involved in the project assess the value <strong>of</strong> an action item(both in dollars and overall benefit to the community). Some projects may need a moredetailed BCA, but this worksheet provides a first-screening methodology.2006 PAGE 4 - 4
Natural <strong>Hazard</strong>s <strong>Mitigation</strong> PlanCity <strong>of</strong> <strong>Glendale</strong>, <strong>California</strong>Section 4 – Multi-<strong>Hazard</strong> Goals and Action ItemsTable 4-1: The STAPLEE ProcessSOCIAL Community Acceptance Effect on Segment <strong>of</strong> PopulationTECHNICAL Technical Feasibility Long-term Solution Secondary ImpactsADMINISTRATIVE Staffing Funding Allocated Maintenance/OperationsPOLITICAL Political Support Local Champion Public SupportLEGAL <strong>State</strong> Authority Existing Local Authority Potential Legal ChallengeECONOMICBenefit <strong>of</strong>ActionCost <strong>of</strong> Action Contributes to Economic Goals Outside Funding RequiredENVIRONMENTALEffects onLand/WaterEffect onEndangeredSpeciesEffect onHAZMAT /Waste SitesConsistent withCommunityEnvironmental GoalsConsistentwith FederalLawsMulti-<strong>Hazard</strong> Action ItemsMulti-hazard action items are those activities that pertain to two or more <strong>of</strong> the four naturalhazards identified in the <strong>Mitigation</strong> Plan: earthquake, flood, wildfire and landslide. There areseven short-term and three long-term multi-hazard action items described below.Short-Term Activity- Multi-<strong>Hazard</strong> #l:Action Item: Integrate the goals and action items from the City <strong>of</strong> <strong>Glendale</strong> Local Natural<strong>Hazard</strong> <strong>Mitigation</strong> Plan into existing regulatory documents and programs, where appropriate.Ideas for Implementation:• Continue to adopt and enforce the most recent Building and Fire Codes, with localamendments that reflect current standards for structural and engineering methods toreduce the effects <strong>of</strong> natural hazards.• Require geotechical reviews that address liquefaction, slope stability and seismicvulnerability <strong>of</strong> proposed new structures and re-development projects.• Continue to review all plans for new construction and re-development projects toidentify structural or fire-code deficiencies that need to be addressed and mitigated foras condition <strong>of</strong> approval <strong>of</strong> the project.• Prohibit any additions to or reconstruction <strong>of</strong> critical facilities damaged by a naturalhazard, unless the facility is re-located to a safer area, or it can be demonstrated thatthe proposed project and any occupants can be protected from future, recurrentdamage by implementing mitigation measures not present in the original, damagedstructure.Ideas for Future Implementation:• Use the <strong>Mitigation</strong> Plan to help institutionalize the guidelines in the City's General Planto encourage sustainable development in all new construction and developmentprojects with emphasis on mitigation or hazard reduction <strong>of</strong> those hazards known tohave the potential to impact the city <strong>of</strong> <strong>Glendale</strong>.2006 PAGE 4 - 5
Natural <strong>Hazard</strong>s <strong>Mitigation</strong> PlanCity <strong>of</strong> <strong>Glendale</strong>, <strong>California</strong>Section 4 – Multi-<strong>Hazard</strong> Goals and Action Items• Integrate the City's <strong>Mitigation</strong> Plan into current capital improvement plans to ensurethat development does not encroach on known hazardous areas.• Partner with other organizations and agencies at the <strong>State</strong> level with similar goals topromote Building and Safety Codes that are more disaster resistant.Coordinating Organization: <strong>Hazard</strong> <strong>Mitigation</strong> Advisory CommitteeBuilding and Safety, Planning, FireTimeline:OngoingPlan Goals Addressed: Protect Life and Property, Partnerships andImplementationConstraints: Pending funding and available personnel; vestedproperty rights.Short-Term Activity – Multi-<strong>Hazard</strong> #2:Action Item: Identify and pursue funding opportunities to develop and implement local andcitywide mitigation activities.Ideas for Implementation:♦♦Develop a program for monitoring and enforcing mitigation measures or conditions <strong>of</strong>approval applied to projects.Support a full-time or part-time position to monitor the availability <strong>of</strong> Federal, <strong>State</strong> andlocal funds that can be tapped into to implement specific action items <strong>of</strong> the Plan, andto write grant requests for funding <strong>of</strong> specific programs.♦ As action items are identified for potential grant funding, conduct a more detailedBenefit Cost Analysis (BCA) using the STAPLEE process than that used in this generation<strong>of</strong> the plan to assess the cost-effectiveness <strong>of</strong> the proposed measure.Ideas for Future Implementation:♦ Develop incentives for local agencies, residents, and businesses to pursue hazardmitigation projects.Coordinating Organization: Management Services in coordination with thedepartment(s) requesting the funding or sponsoring themitigation projectTimeline:OngoingPlan Goals Addressed:Partnerships and Implementation,Public AwarenessConstraints:Pending funding and available personnelShort-Term Activity – Multi-<strong>Hazard</strong> #3:Action Item: Establish a formal role for the City <strong>of</strong> <strong>Glendale</strong>’s <strong>Hazard</strong>s <strong>Mitigation</strong> AdvisoryCommittee to develop a sustainable process for implementing, monitoring, and evaluatingcitywide mitigation activities.2006 PAGE 4 - 6
Natural <strong>Hazard</strong>s <strong>Mitigation</strong> PlanCity <strong>of</strong> <strong>Glendale</strong>, <strong>California</strong>Section 4 – Multi-<strong>Hazard</strong> Goals and Action ItemsIdeas for Implementation:♦ Establish clear roles for members <strong>of</strong> the Advisory Committee, and meet regularly topursue and evaluate implementation <strong>of</strong> mitigation strategies.♦ Oversee implementation <strong>of</strong> the <strong>Hazard</strong>s <strong>Mitigation</strong> Plan.♦ Establish measurable standards to evaluate mitigation policies and programs andprovide a mechanism to update and revise the <strong>Hazard</strong>s <strong>Mitigation</strong> Plan. Develop aprogram to measure the successes and failures (if any) <strong>of</strong> the action items in the Plan,including specific constraints to implementation and adherence to the timelinesidentified, to be used as input in future versions <strong>of</strong> the Plan.♦ Develop updates <strong>of</strong> the <strong>Hazard</strong>s <strong>Mitigation</strong> Plan based on new information.♦ Conduct a full review <strong>of</strong> the <strong>Hazard</strong>s <strong>Mitigation</strong> Plan every 5 years by evaluatingmitigation successes, failures, and areas that were not addressed.Ideas for Future Implementation:♦ Monitor hazard mitigation implementation by jurisdictions and participatingorganizations through surveys and other reporting methods.♦ Provide training for Committee members to remain current on developing issues in thenatural hazard loss reduction field.Coordinating Organization:Timeline:Plan Goals Addressed:Constraints:Fire, PlanningOngoingPartnerships and ImplementationPending funding and available personnelShort-Term Activity – Multi-<strong>Hazard</strong> #4:Action Item: Identify, improve, and sustain collaborative programs focusing on the real estateand insurance industries, public and private sector organizations, and individuals to avoidactivities that increase the risk to natural hazards.Ideas for Implementation:♦ Distribute information about flood, fire, and earthquake hazards insurance to propertyowners in areas identified to be at risk through hazard mapping.♦ Develop a one-page handout on types <strong>of</strong> insurance available and deliver to residentsand businesses in the appropriate areas through City utility or service agencies.♦ Educate individuals and businesses on the benefit <strong>of</strong> engaging in mitigation activitiessuch as developing impact analyses.2006 PAGE 4 - 7
Natural <strong>Hazard</strong>s <strong>Mitigation</strong> PlanCity <strong>of</strong> <strong>Glendale</strong>, <strong>California</strong>Section 4 – Multi-<strong>Hazard</strong> Goals and Action ItemsIdeas for Future Implementation:♦ Pinpoint areas <strong>of</strong> high risk and transfer the cost <strong>of</strong> risk to property owners throughinsurance (rather than to the public).♦ Encourage the development <strong>of</strong> unifying organizations to ensure communication anddissemination <strong>of</strong> natural hazard mitigation information.♦ Identify activities for private sector and citizen involvement such as non-structuralseismic retr<strong>of</strong>its <strong>of</strong> day care centers, senior residences, and other special populationfacilities.Coordinating Organization: Management Services; Businesses: <strong>Glendale</strong>Redevelopment Agency; Residents: CommunityDevelopment and Housing, Fire; <strong>Glendale</strong> UnifiedSchool DistrictTimeline:OngoingPlan Goals Addressed:Protect Life and Property, Public Awareness, Partnershipsand ImplementationConstraints:Pending funding and available personnelShort-Term Activity – Multi-<strong>Hazard</strong> #5:Action Item: Foster public and private partnerships to improve hazard mitigation programcoordination and collaboration in the city <strong>of</strong> <strong>Glendale</strong>.Ideas for Implementation:♦ Identify and engage organizations within <strong>Glendale</strong> that have programs or interests innatural hazards mitigation.♦ Involve private businesses throughout the City in mitigation planning.Ideas for Future Implementation:♦ Work with area City governments to integrate local <strong>Hazard</strong>s <strong>Mitigation</strong> Plans that areconsistent with the goals and framework <strong>of</strong> the City Plan.♦ Improve communication between the <strong>California</strong> Department <strong>of</strong> Transportation and theCity’s Public Works Department, and work together to prioritize and identify strategiesto deal with road problems.Coordinating Organization:Time line:Plan Goals Addressed:Constraints:Management Services, Fire, <strong>Glendale</strong> RedevelopmentAgency, Public Works, Water and Power, PlanningOngoingPartnerships and ImplementationPending funding and available personnel2006 PAGE 4 - 8
Natural <strong>Hazard</strong>s <strong>Mitigation</strong> PlanCity <strong>of</strong> <strong>Glendale</strong>, <strong>California</strong>Section 4 – Multi-<strong>Hazard</strong> Goals and Action ItemsShort-Term Activity – Multi-<strong>Hazard</strong> #6:Action Item: Continue to develop inventories <strong>of</strong> existing at-risk buildings and infrastructureand prioritize mitigation projects.Ideas for Implementation:♦ Improve redundancy <strong>of</strong> electrical utilities in North <strong>Glendale</strong>. Harden infrastructure toprotect power distribution in the Montrose/La Crescenta area.♦ Improve security <strong>of</strong> critical facilities from both natural and man-made (terrorism)hazards.♦ Integrate the public education functions from various City Divisions to coordinatemessages regarding hazard awareness, personal preparedness, and communityemergency response training.Ideas for Future Implementation:♦ Identify existing critical facilities at risk from natural hazards (such as s<strong>of</strong>t-storystructures, structures underlain by active faults).♦ Identify existing bridges at risk from flood or earthquake hazards, identifyenhancements, and implement projects needed to reduce the risks.♦ Develop strategies to mitigate risk to these existing facilities, or to utilize alternativefacilities should natural hazards events cause damages to the facilities in question.Coordinating Organization: Planning, Public Works, Water & Power, FireTime line:1 YearPlan Goals Addressed: Protect Life and Property, Partnerships andImplementationConstraints:Pending funding and available personnelShort-Term Activity – Multi-<strong>Hazard</strong> #7:Action Item: Strengthen emergency services preparedness and response by linking emergencyservices with hazard mitigation programs, and enhancing public education on a regional scale.Ideas for Implementation:♦ Increase individual and family preparedness through public education projects such assafety fairs, brochures and bill inserts that are distributed to residents and localbusinesses via mass mailings.♦ Identify opportunities for partnering with citizens, private contractors, and otherjurisdictions to increase availability <strong>of</strong> equipment and manpower and increase theefficiency and efficacy <strong>of</strong> response efforts.♦ Work with Community Planning Organizations and other neighborhood groups toestablish community response teams.2006 PAGE 4 - 9
Natural <strong>Hazard</strong>s <strong>Mitigation</strong> PlanCity <strong>of</strong> <strong>Glendale</strong>, <strong>California</strong>Section 4 – Multi-<strong>Hazard</strong> Goals and Action Items♦ Familiarize public <strong>of</strong>ficials with requirements regarding public assistance for disasterresponse.Ideas for Future Implementation:♦ Educate private property owners on limitations <strong>of</strong> bridges and dangers associated withthem.♦ Coordinate the maintenance <strong>of</strong> emergency transportation routes throughcommunication among the City’s Department <strong>of</strong> Public Works, neighboringjurisdictions, and the <strong>California</strong> Department <strong>of</strong> Transportation.Coordinating Organization:Time line:Plan Goals Addressed:Constraints:Fire, Police, Public WorksOngoingEmergency Services, Protect Life and Property, PublicAwarenessPending funding and available personnelLong-Term Activity – Multi-<strong>Hazard</strong> #1:Action Item: Develop, enhance, and implement education programs aimed at mitigatingnatural hazards, and reducing the risk to citizens, public agencies, private property owners,businesses, and schools.Ideas for Implementation:♦ Make the City <strong>of</strong> <strong>Glendale</strong> <strong>Hazard</strong>s <strong>Mitigation</strong> Plan available to the public bypublishing the Plan electronically on the City’s and Fire Department’s websites.♦ Enhance the City’s web page to facilitate Internet discussions and information sharing.♦ Develop adult and child educational programs to be used by local radio and cableaccess stations.♦ Use local radio and cable access stations as a conduit for advertising public forums.♦ Develop an educational curriculum for school programs and adult education onreducing risk and preventing loss from natural hazards.♦ Conduct natural hazards awareness programs in schools and community centers.♦ Enhance outreach materials for mitigation, preparedness, response and recovery.♦ Conduct workshops for public and private sector organizations to raise awareness <strong>of</strong>mitigation activities and programs.Ideas for Future Implementation:♦ Continue to promote outreach programs aimed at businesses, residents and2006 PAGE 4 - 10
Natural <strong>Hazard</strong>s <strong>Mitigation</strong> PlanCity <strong>of</strong> <strong>Glendale</strong>, <strong>California</strong>Section 4 – Multi-<strong>Hazard</strong> Goals and Action Itemsorganizations that are most likely to be impacted by flooding events.♦ Provide electronic map capabilities by creating a website that includes informationspecific to city <strong>of</strong> <strong>Glendale</strong> residents, including site-specific hazards information,Building & Safety Codes information, insurance companies that provide earthquakeinsurance for <strong>Glendale</strong> residents, and educational information on damage prevention.♦ Conduct a baseline survey to gather perceptions <strong>of</strong> private citizens and the businesscommunity regarding natural hazard risks and identify mitigation needs. Repeat thesurvey in five years to monitor successes and failures <strong>of</strong> hazard mitigation programs.Coordinating Organization:Time line:Plan Goals Addressed:Constraints:Management Services, Fire, Planning, Library ServicesDivision, <strong>Glendale</strong> Unified School DistrictOngoingPublic Awareness, Protect Life and PropertyPending funding and available personnelLong Term Activity - Multi <strong>Hazard</strong> #2:Action Item: Use technical knowledge <strong>of</strong> natural ecosystems and events to link naturalresource management and land use organizations to mitigation activities and technicalassistance.Ideas for Implementation:♦ Review ordinances that protect natural systems and resources to mitigate for naturalhazards for possible enhancements.♦ Pursue vegetation and restoration practices that assist in enhancing and restoring thenatural and beneficial functions <strong>of</strong> the watershed.♦ Develop education and outreach programs that focus on protecting natural systems asa mitigation activity.Coordinating Organization:Time line:Plan Goals Addressed:Constraints:Planning, Parks Recreation and Community Services,Public Works, FireOngoingNatural SystemsPending funding and available personnelLong Term Activity - Multi <strong>Hazard</strong> #3:Action Item: Expand <strong>Glendale</strong>’s Local <strong>Hazard</strong> <strong>Mitigation</strong> Plan to include man-made hazards(e.g., hazardous materials releases, terrorism, etc.).Ideas for Implementation:♦ Use the City’s updated Safety Element <strong>of</strong> the General Plan and available publicinformation from <strong>State</strong> and Federal databases for assistance to expand the <strong>Mitigation</strong>Plan.2006 PAGE 4 - 11
Natural <strong>Hazard</strong>s <strong>Mitigation</strong> PlanCity <strong>of</strong> <strong>Glendale</strong>, <strong>California</strong>Section 4 – Multi-<strong>Hazard</strong> Goals and Action Items♦ Utilize available <strong>State</strong> and Federal programs to educate City representatives onmitigation initiatives to combat terrorism and hazards due to terrorist acts.Coordinating Organization:Time line:Plan Goals Addressed:Constraints:Public Works, Fire, Police, and Planning1-5 yearsPartnerships and Implementation, Protect Life andProperty, Emergency ServicesPending funding and available personnelEarthquake <strong>Mitigation</strong> Action ItemsThe Earthquake mitigation action items provide guidance on specific activities that agencies,organizations, and residents in the city <strong>of</strong> <strong>Glendale</strong> can undertake to reduce risk and preventloss from earthquake events. Each action item is followed by ideas for implementation, whichcan be used by the steering committee and local decision makers in pursuing strategies forimplementation.Short Term - Earthquake # 1:Action Item: Integrate new earthquake hazard mapping data for the city <strong>of</strong> <strong>Glendale</strong> andimprove technical analysis <strong>of</strong> earthquake hazards.Ideas for Implementation:♦ Update the city <strong>of</strong> <strong>Glendale</strong> earthquake HAZUS scenarios using City-specific data,such as building inventories, geologic materials and depth to ground water, to improveaccuracy <strong>of</strong> the vulnerability assessment for <strong>Glendale</strong>.♦ Conduct risk analysis incorporating HAZUS data and hazard maps using GIStechnology to identify risk sites and further assist in prioritizing mitigation activities andassessing the adequacy <strong>of</strong> current land use requirements.Coordinating Organization:Timeline:Plan Goals Addressed:Constraints:Public Works Geographic Information Systems2 yearsPartnerships and Implementation, Protect Life andPropertyPending Funding and Available PersonnelShort Term – Earthquake # 2:Action Item: Incorporate the Regional Earthquake Transportation Evacuation Routesdeveloped by the Regional Emergency Managers Group into appropriate planning documents.Ideas for Implementation:♦ Update the transportation routes map in the City <strong>of</strong> <strong>Glendale</strong> Natural <strong>Hazard</strong><strong>Mitigation</strong> Plan with the evacuation routes data.2006 PAGE 4 - 12
Natural <strong>Hazard</strong>s <strong>Mitigation</strong> PlanCity <strong>of</strong> <strong>Glendale</strong>, <strong>California</strong>Section 4 – Multi-<strong>Hazard</strong> Goals and Action Items♦ Integrate the evacuation routes data into the City <strong>of</strong> <strong>Glendale</strong> Emergency OperationsPlan.Coordinating Organization:Timeline:Plan Goals Addressed:Constraints:Emergency Services, Police2 yearsEmergency ServicesPending Funding and Available PersonnelLong Term - Earthquake # l:Action Item: Identify funding sources for structural and nonstructural retr<strong>of</strong>itting <strong>of</strong> existingstructures that are identified as seismically vulnerable.Ideas for Implementation:♦ Provide information for property owners, small businesses, and organizations onsources <strong>of</strong> funds (loans, grants, etc.).♦ Explore options for including seismic retr<strong>of</strong>itting in existing programs such as lowincomehousing, insurance reimbursements, and pre and post disaster repairs.Coordinating Organization:Timeline:Plan Goals Addressed:Constraints:<strong>Hazard</strong> <strong>Mitigation</strong> Advisory CommitteeOngoingPartnerships and Implementation, Public AwarenessPending funding and available personnelLong Term - Earthquake #2:Action Item: Encourage purchase <strong>of</strong> earthquake hazard insurance.Ideas for Implementation:♦ Provide earthquake insurance information to <strong>Glendale</strong> residents.♦ Coordinate with insurance companies to produce and distribute earthquake insuranceinformation.Coordinating Organization:Timeline:Plan Goals Addressed:Constraints:<strong>Hazard</strong> <strong>Mitigation</strong> Advisory CommitteeOngoingProtect Life and Property, Public AwarenessPending funding and available personnelLong Term - Earthquake # 3:Action Item: Encourage seismic strength evaluations <strong>of</strong> existing critical facilities in <strong>Glendale</strong>to identify vulnerabilities for mitigation <strong>of</strong> schools and universities, public infrastructure, andcritical facilities to meet current seismic standards.2006 PAGE 4 - 13
Natural <strong>Hazard</strong>s <strong>Mitigation</strong> PlanCity <strong>of</strong> <strong>Glendale</strong>, <strong>California</strong>Section 4 – Multi-<strong>Hazard</strong> Goals and Action ItemsIdeas for Implementation:♦ Develop an inventory <strong>of</strong> existing schools, universities, and critical facilities that do notmeet current seismic standards.♦ Encourage owners <strong>of</strong> non-retr<strong>of</strong>itted structures to upgrade them to meet seismicstandards.♦ Encourage water providers to replace old cast iron pipes with more ductile iron, andidentify partnership opportunities with other agencies for pipe replacement.Coordinating Organization:Timeline:Plan Goals Addressed:Constraints:<strong>Hazard</strong> <strong>Mitigation</strong> Advisory Committee, Building andSafety, Public Works5 yearsProtect Life and Property, Emergency ServicesPending funding and available personnelLong Term - Earthquake # 4:Action Item: Encourage reduction <strong>of</strong> nonstructural and structural earthquake hazards inhomes, schools, businesses, and government <strong>of</strong>fices.Ideas for Implementation:♦ Provide information to government building and school facility managers andteachers on securing bookcases, filing cabinets, light fixtures, and other objects thatcan cause injuries and block exits.♦ Encourage facility managers, business owners, and teachers to refer to FEMA's practicalguidebook: “Reducing the Risks Nonstructural Earthquake Damage.”♦ Encourage homeowners and renters to use “Is Your Home Protected from EarthquakeDisaster? A Homeowner’s Guide to Earthquake Retr<strong>of</strong>it” (IBHS) for economic andefficient mitigation techniques.♦ Explore partnerships to provide retr<strong>of</strong>itting classes for homeowners, renters, buildingpr<strong>of</strong>essionals, and contractors.♦ Target development located in potential fault zones or in unstable soils for intensiveeducation and retr<strong>of</strong>itting resources.Coordinating Organization:Timeline:Plan Goals Addressed:Constraints:<strong>Hazard</strong> <strong>Mitigation</strong> Advisory CommitteeOngoingProtect Life and Property, Public AwarenessPending funding and available personnel2006 PAGE 4 - 14
Natural <strong>Hazard</strong>s <strong>Mitigation</strong> PlanCity <strong>of</strong> <strong>Glendale</strong>, <strong>California</strong>Section 4 – Multi-<strong>Hazard</strong> Goals and Action ItemsWildfire <strong>Mitigation</strong> Action ItemsAs stated in the Federal Wildland Fire Policy, “The problem is not one <strong>of</strong> finding new solutionsto an old problem but <strong>of</strong> implementing known solutions. Deferred decision making is asmuch a problem as the fires themselves. If history is to serve us in the resolution <strong>of</strong> thewildland/urban interface problem, we must take action on these issues now. To do anythingless is to guarantee another review process in the aftermath <strong>of</strong> future catastrophic fires.”The wildfire mitigation action items below provide direction on specific activities thatorganizations and residents <strong>of</strong> southern <strong>California</strong>, including <strong>Glendale</strong>, can undertake toreduce risk and prevent loss from wildfire events. Each action item is followed by ideas forimplementation, which can be used by the steering committee and local decision makers inpursuing strategies for implementation.Short Term – Wildfire #1:Action Item: Enhance outreach and education programs aimed at mitigating wildfire hazardsand reducing or preventing the exposure <strong>of</strong> citizens, public agencies, private property ownersand businesses to natural hazards.Ideas for Implementation:♦ Continue the hiring <strong>of</strong> fire prevention and education personnel to oversee educationprograms.♦ Continue to train in all areas <strong>of</strong> fire prevention.♦ Visit urban interface neighborhoods and rural areas and conduct education andoutreach activities.♦ Conduct specific community-based demonstration projects <strong>of</strong> fire prevention andmitigation in the urban interface.♦ Establish neighborhood "drive-through" activities that pinpoint site-specific mitigationactivities. Fire crews can give property owners suggestions and assistance.♦ Perform public outreach and information activities at fire stations by creating "WildfireAwareness Week" activities. Fire stations can hold open houses and allow the publicto visit, see the equipment and discuss wildfire mitigation with the station crews.Coordinating Organization:Timeline:Plan Goals Addressed:Constraints:Fire DepartmentOngoingProtect Life and Property, Public AwarenessPending funding and available personnelShort Term – Wildfire #2:Action Item: Enhance emergency services to increase the efficiency <strong>of</strong> wildfire response andrecovery activities.2006 PAGE 4 - 15
Natural <strong>Hazard</strong>s <strong>Mitigation</strong> PlanCity <strong>of</strong> <strong>Glendale</strong>, <strong>California</strong>Section 4 – Multi-<strong>Hazard</strong> Goals and Action ItemsIdeas for Implementation:♦ Continue to develop and increase training and outreach programs.♦ Evaluate internal and external notification systems that include all at-riskurban/wildland interface residents in the jurisdiction in order to contact them duringevacuations.Coordinating Organization:Timeline:Plan Goals Addressed:Constraints:Fire Department2 yearsEmergency ServicesPending funding and available personnelShort Term – Wildfire #3:Action Item: Educate agency personnel on federal cost-share and grant programs, FireProtection Agreements and other related federal programs so the full array <strong>of</strong> assistanceavailable to local agencies is understood.Ideas for Implementation:♦ Investigate potential funding opportunities for individual mitigation projects; and♦ Develop, approve and promote Fire Protection Agreements and partnerships to clarifyroles and responsibilities and to provide for fire mitigation activities and suppressionpreparedness.Coordinating Organization:Timeline:Plan Goals Addressed:Constraints:Fire Department1-2 yearsProtect Life and Property, Public AwarenessPending funding and available personnelShort Term – Wildfire #4:Action Item: Inventory existing alternative firefighting water sources and encourage thedevelopment <strong>of</strong> additional sources.Ideas for Implementation:♦ Advocate for water storage facilities with fire-resistant electrical pumps or gravity-fedsystems in facilities that are not connected to a community water or hydrant system.♦ Review protocol for fire department and water district to communicate all hydrantoutages and water shortage information.Coordinating Organization:Timeline:Plan Goals Addressed:Constraints:Fire, Planning, Water and Power1 yearProtect Life and PropertyPending funding and available personnel2006 PAGE 4 - 16
Natural <strong>Hazard</strong>s <strong>Mitigation</strong> PlanCity <strong>of</strong> <strong>Glendale</strong>, <strong>California</strong>Section 4 – Multi-<strong>Hazard</strong> Goals and Action ItemsLong Term – Wildfire #l:Action Item: Encourage development and dissemination <strong>of</strong> maps relating to the fire hazard tohelp educate and assist builders and homeowners in being engaged in wildfire mitigationactivities and to help guide emergency services during response.Ideas for Implementation:♦ Update wildland/urban interface maps.♦ Conduct risk analysis incorporating data and the created hazard maps using GIStechnology to identify risk sites and further assist in prioritizing mitigation activities.♦ Encourage coordination between fire jurisdictions and sanitary districts to make surethat the most accurate elevation maps are being used.Coordinating Organization:Timeline:Plan Goals Addressed:Constraints:Fire Department1-3 yearsProtect Life and PropertyPending funding and available personnelLong Term – Wildfire #2:Action Item: Increase communication, coordination and collaboration betweenwildland/urban interface property owners, local and county planners and fire prevention crewsand <strong>of</strong>ficials to address risks, existing mitigation measures and federal assistance programs.Ideas for Implementation:♦ Encourage single-family residences to have fire plans and practice evacuation routes.♦ Encourage fire inspections in residential homes by fire departments to increaseawareness among homeowners and potential fire responders.♦ Encourage a standard for the <strong>State</strong> Fire Marshal to evaluate fire plans and emergencyplans.♦ Encourage fire department notification <strong>of</strong> new business applications to ensure thatappropriate fire plans have been developed.♦ Encourage local zoning and planning entities to work closely with landowners and/ordevelopers who choose to build in the wildland/urban interface to identify and mitigateconditions that aggravate wildland/urban interface wildfire hazards, including:♦ Limited access for emergency equipment due to width and grade <strong>of</strong> roadways;♦ Inadequate water supplies and the spacing, consistency and species <strong>of</strong> vegetationaround structures;♦ Inadequate fuel breaks, or lack <strong>of</strong> defensible space;♦ Highly flammable construction materials;2006 PAGE 4 - 17
Natural <strong>Hazard</strong>s <strong>Mitigation</strong> PlanCity <strong>of</strong> <strong>Glendale</strong>, <strong>California</strong>Section 4 – Multi-<strong>Hazard</strong> Goals and Action Items♦ Building lots and subdivisions that are not in compliance with state and localland use and fire protection regulations;♦ Inadequate entry/escape routes.♦ Require all new homes and major remodels involving ro<strong>of</strong>s additions that are locatedin the interface to have fire resistant ro<strong>of</strong>s and residential sprinkler systems.♦ Encourage the public to evaluate access routes to rural homes for fire-fighting vehiclesand to develop passable routes if they do not exist.Coordinating Organization: Fire Department, Building & Safety, Planning,Information ServicesTimeline:OngoingPlan Goals Addressed:Protect Life and Property, Public Awareness, EmergencyServices, Partnerships and ImplementationConstraints:Pending funding and available personnelLong Term – Wildfire #3:Action Items: Encourage implementation <strong>of</strong> wildfire mitigation activities in a mannerconsistent with the goals <strong>of</strong> promoting sustainable ecological management and communitystability.Ideas for Implementation:♦ Employ mechanical or other appropriate thinning technique to abate the risk <strong>of</strong>catastrophic fire and restore the more natural regime <strong>of</strong> high frequency, low-intensityburns. Prescribed burning can provide benefit to ecosystems by thinning hazardousvegetation and restoring ecological diversity to areas homogenized by invasive plants.♦ Clear trimmings, trees, brush and other debris completely from sites when performingroutine maintenance and landscaping to reduce fire risk.♦ Enhance programs to coordinate and monitor adjacent areas that utilize prescribedburning techniques.Coordinating Organization:Timeline:Plan Goals Addressed:Constraints:Fire DepartmentOngoingNatural SystemsPending funding and available personnelFlood <strong>Mitigation</strong> Action ItemsThe flood mitigation action items provide direction on specific activities that organizations andresidents in the city <strong>of</strong> <strong>Glendale</strong> can undertake to reduce risk and prevent loss from floodevents. Each action item is followed by ideas for implementation, which can be used by thesteering committee and local decision makers in pursuing strategies for implementation.2006 PAGE 4 - 18
Natural <strong>Hazard</strong>s <strong>Mitigation</strong> PlanCity <strong>of</strong> <strong>Glendale</strong>, <strong>California</strong>Section 4 – Multi-<strong>Hazard</strong> Goals and Action ItemsShort Term – Flood #l:Action Item: Analyze each repetitive flood property within the City <strong>of</strong> <strong>Glendale</strong> and identifyfeasible mitigation options.Ideas for Implementation:♦ Identify appropriate and feasible mitigation activities for identified repetitive floodproperties. Funding may be available through FEMA' s <strong>Hazard</strong> <strong>Mitigation</strong> Grant andFlood <strong>Mitigation</strong> Assistance Programs and the Pre-disaster <strong>Mitigation</strong> Program.♦ Contact repetitive loss property owners to discuss mitigation opportunities, anddetermine interest should future project opportunities arise.♦ Explore options for incentives to encourage property owners to engage in mitigation.Coordinating Organization: <strong>Hazard</strong> <strong>Mitigation</strong> Advisory CommitteeTimeline:1-2 yearsPlan Goals Addressed: Protect Life and Property, Partnerships andImplementationConstraints:Pending Funding and Available PersonnelShort Term – Flood #2:Action Item: Recommend revisions to requirements for development within the floodplain,where appropriate.Ideas for Implementation:♦ Evaluate elevation requirements for new residential and nonresidential structures in theunincorporated floodplain area.♦ Explore raising the base elevation requirement for new residential construction to twoor three feet above base flood elevation, or greater. An increased elevation standard isone activity the county can engage in to receive credit from the NFIP CommunityRating System Program.♦ Identify opportunities to review and the Federal Insurance Study for <strong>Glendale</strong> anddevelop, if necessary, a Federal Insurance Rate Map for the area.♦ Identify alternatives to reduce development in the floodplain.Coordinating Organization:Timeline:Plan Goals Addressed:Constraints:Public Works, County Department <strong>of</strong> Transportation,Information Services2 yearsProtect Life and PropertyPending Funding and Available Personnel2006 PAGE 4 - 19
Natural <strong>Hazard</strong>s <strong>Mitigation</strong> PlanCity <strong>of</strong> <strong>Glendale</strong>, <strong>California</strong>Section 4 – Multi-<strong>Hazard</strong> Goals and Action ItemsShort Term – Flood #3:Action Item: Develop better flood warning systems.Ideas for Implementation:♦ Coordinate with appropriate organizations to evaluate the need for more streamgauges.♦ Distribute information regarding flooding to the general public efficiently.Coordinating Organization:Timeline:Plan Goals Addressed:Constraints:County Emergency Management, County Public Works,County Department <strong>of</strong> Transportation2 yearsProtect Life and Property, Emergency ServicesPending Funding and Available PersonnelLong Term – Flood #l:Action Item: Enhance data and mapping for floodplain information within the county, andidentify and map flood-prone areas outside <strong>of</strong> designated floodplains.Ideas for Implementation:♦ Apply for FEMA's cooperative technical partnership using the 2-foot contour intervalfloodplain mapping data acquired by the City <strong>of</strong> <strong>Glendale</strong> GIS.♦ Use WES inventory and mapping data to update the flood-loss estimates for the city <strong>of</strong><strong>Glendale</strong>.♦ Encourage the development <strong>of</strong> floodplain maps for all local streams not currentlymapped on Flood Insurance Rate Maps or county maps, with special attention focusedon mapping rural and unincorporated areas. The maps should show the expectedfrequency <strong>of</strong> flooding, the level <strong>of</strong> flooding, and the areas subject to inundation. Themaps can be used for planning, risk analysis, and emergency management.Coordinating Organization: County Geographic Information Services, CountyDepartment <strong>of</strong> Transportation, County Public WorksTimeline:3 years (as funding allows)Plan Goals Addressed:Protect Life and PropertyConstraints:Pending Funding and Available PersonnelLong Term – Flood #2:Action Item: Encourage development <strong>of</strong> acquisition and management strategies to preserveopen space for flood mitigation and water quality in the floodplain.Ideas for Implementation:♦ Develop a comprehensive strategy for acquiring and managing floodplain open spacein the City <strong>of</strong> <strong>Glendale</strong>.2006 PAGE 4 - 20
Natural <strong>Hazard</strong>s <strong>Mitigation</strong> PlanCity <strong>of</strong> <strong>Glendale</strong>, <strong>California</strong>Section 4 – Multi-<strong>Hazard</strong> Goals and Action Items♦ Explore funding for property acquisition from federal (e,g" FEMA <strong>Hazard</strong> <strong>Mitigation</strong>Grant Program), state, regional, and local governments, as well as private and nonpr<strong>of</strong>itorganizations, trails programs, as well as options for special appropriations.♦ Develop a regional partnership between flood mitigation and water qualityenhancement organizations/programs to improve educational programs.♦ Identify sites where environmental restoration work can benefit flood mitigation andwater quality.♦ Identify existing watershed education programs and determine which programs wouldsupport a flood education component.Coordinating Organization:Timeline:Plan Goals Addressed:Constraints:County Department <strong>of</strong> Transportation, County PublicWorks5 yearsNatural Systems, Protect Life and PropertyPending Funding and Available PersonnelLong Term – Flood #3:Action Item: Identify surface water drainage obstructions in the city <strong>of</strong> <strong>Glendale</strong>.Ideas for Implementation:♦ Map culverts in the city.♦ Prepare an inventory <strong>of</strong> culverts that historically create flooding problems and targetthem for retr<strong>of</strong>itting.♦ Prepare an inventory <strong>of</strong> major urban drainage problems, and identify causes andpotential mitigation actions for urban drainage problem areas.Coordinating Organization:Timeline:Plan Goals Addressed:Constraints:County Public Works, County Geographic InformationSystems5 yearsProtect Life and PropertyPending Funding and Available PersonnelLong Term – Flood #4:Action Item: Establish a framework to compile and coordinate surface water managementplans and data throughout the City.Ideas for Implementation:♦ Develop surface water management plans for areas that are not currently within surfacewater management plan boundaries.2006 PAGE 4 - 21
Natural <strong>Hazard</strong>s <strong>Mitigation</strong> PlanCity <strong>of</strong> <strong>Glendale</strong>, <strong>California</strong>Section 4 – Multi-<strong>Hazard</strong> Goals and Action ItemsCoordinating Organization: County Public Works, County Planning Division,Geographic Information SystemsTimeline:5 yearsPlan Goals Addressed: Protect Life and Property, Partnerships andImplementationConstraints:Pending Funding and Available PersonnelLandslide <strong>Mitigation</strong> Action ItemsThe landslide mitigation action items below provide direction on specific activities that theCity, organizations, and residents <strong>of</strong> <strong>Glendale</strong> can undertake to reduce risk and prevent lossfrom landslide events. Each action item is followed by ideas for implementation, which can beused by the steering committee and local decision makers in pursuing strategies forimplementation.Short Term - Landslide #l:Action Item: Improve knowledge <strong>of</strong> landslide hazard areas and understanding <strong>of</strong> vulnerabilityand risk to life and property in hazard-prone areas.Ideas for Implementation:♦ Continuously update the landslide map for the city <strong>of</strong> <strong>Glendale</strong> to show areas whererockfalls, debris flows and surficial mass wasting events are reported, especially duringwet winters.♦ Develop public information to emphasize economic risk when building on potential orhistorical landslide areas.Coordinating Organization:Timeline:Plan Goals Addressed:Constraints:<strong>Hazard</strong> <strong>Mitigation</strong> Advisory Committee1 -2 YearsProtect Life and PropertyPending Funding and Available PersonnelShort Term - Landslide #2:Action Item: Encourage construction and subdivision design that can be applied to steepslopes to reduce the potential adverse impacts from development.Ideas for Implementation:♦ Increase communication and coordination between the City’s Departments.Coordinating Organization:Timeline:Plan Goals Addressed:Constraints:<strong>Hazard</strong> <strong>Mitigation</strong> Advisory Committee1 – 2 YearsIncrease awareness <strong>of</strong> mitigation issues through thecoordination <strong>of</strong> all City resources and departments.Pending Funding and Available Personnel2006 PAGE 4 - 22
Natural <strong>Hazard</strong>s <strong>Mitigation</strong> PlanCity <strong>of</strong> <strong>Glendale</strong>, <strong>California</strong>Section 4 – Multi-<strong>Hazard</strong> Goals and Action ItemsShort Term - Landslide #3:Action Item: Identify safe evacuation routes in high-risk debris flow and landslide areas.Ideas for Implementation:♦ Identify potential debris removal resources.♦ Increase participation in regional committee planning for emergency transportationroutes.♦ Identify and publicize information regarding emergency transportation routes.Coordinating Organization:Timeline:Plan Goals Addressed:Constraints:Public Works, Engineering1 – 3 YearsProtection <strong>of</strong> Life and more efficient response <strong>of</strong>emergency personnel.Pending Funding and Available PersonnelLong Term - Landslide #l:Action Item: Review local ordinances regarding building and development in landslide-proneareas.Ideas for Implementation:♦ Create committee <strong>of</strong> local stakeholders to study issue and make recommendations tostaff.Coordinating Organization:Timeline:Plan Goals Addressed:Constraints:Building and Safety3 – 5 YearsProtect Life and PropertyPending Funding and Available PersonnelLong Term - Landslide #2:Action Item: Limit activities in identified potential and historical landslide areas throughregulation and public outreach.Ideas for Implementation:♦ Analyze existing regulations regarding development in landslide-prone areas.♦ Identify existing mechanisms for public outreach / develop new methods <strong>of</strong> outreach.Coordinating Organization:Timeline:Plan Goals Addressed:Constraints:<strong>Hazard</strong> <strong>Mitigation</strong> Advisory Committee, Public AffairsDepartment3 – 5 YearsProtect Life and PropertyPending Funding and Available Personnel2006 PAGE 4 - 23
Table 4-2: STAPLEE Ranking <strong>of</strong> Action Items2007 Disaster <strong>Mitigation</strong> Plan, City <strong>of</strong> <strong>Glendale</strong>, <strong>California</strong>ACTION ITEMSEQ = Earthquake, MH= Multi <strong>Hazard</strong> ST= Short Term, LT= Long TermDESCRIPTIONAdvisory CommitteeManagement Services(CO = Coordinating Organization)FirePublic WorksPlanning<strong>Glendale</strong> Water & PowerPolice<strong>Glendale</strong> Unified School DistrictLos Angeles Co Dept. <strong>of</strong> TransportationLos Angeles County FloodAcceptanceEffect on Segment <strong>of</strong> PopulationFeasibilityLong-Term SolutionStaffingFunding AllocatedMaintenancePublic SupportPolitical Support<strong>State</strong> AuthorityExisting Local Auth.Potential ChallengeBenefitCostOutside FundingEffects on EnvironmentConsistent with Community GoalsTOTALRANKSTAPLEE ComponentsSocial Technical Administrative Political Legal Economic nvironmentaE Q ST 1Formalize need to have up to date GIS available for planning and response.Use HAZUS for planning.CO 2 1 3 3 1 1 -1 2 3 1 0 0 3 -1 2 0 3 23 7E Q ST 2 Add REMG data to our GIS, update plans where changes are needed. CO X 2 2 3 2 2 0 0 2 3 2 2 0 0 -1 1 0 0 20 12E Q LT 1 Emphasize process <strong>of</strong> upgrading vulnerable structures. CO X 3 2 3 3 1 1 0 2 3 2 2 0 3 -2 2 0 0 25 4E Q LT 2 Encourage purchase <strong>of</strong> earthquake hazard insurance. CO 1 -2 0 0 0 0 -1 1 2 2 0 -2 2 -2 0 0 0 1 35E Q LT 3 Inventory target hazards for seismic vulnerability, encourage upgrades. CO X 3 -1 2 3 1 0 -1 2 3 2 1 -1 3 -2 2 0 0 17 22E Q LT 4Educate the public on nonstructural methods to reduce impact <strong>of</strong> seismicevents, target education to address areas with unstable soils and fault zone.CO X X X X 3 2 3 2 2 1 -2 2 3 2 2 0 2 0 2 0 0 24 5Fire ST 1Continue to develop and increase training and outreach programs like FireWatch and increase reporting equipment such as phone lines. Enhancenotification systems targeting residents in at-risk urban/wildland interfaceCO 3 3 3 2 1 2 -1 3 3 2 2 0 2 -2 2 0 0 25 3areas.Fire ST 2 Seek funding opportunities and foster Fire Protection Agreements. CO 3 3 3 2 2 2 -1 3 3 3 3 0 3 -1 0 0 0 28 1Fire ST 3Increase number <strong>of</strong> water sources in interface area.- <strong>Glendale</strong> Fire Road andCistern system.CO 2 2 2 2 1 0 -1 2 2 2 2 -1 2 -2 1 -2 -1 13 32Fire LT 1 Update and disseminate accurate and relevant maps <strong>of</strong> fire hazard areas. CO X 2 -1 2 1 2 0 -1 2 3 3 2 -1 2 -1 1 0 0 16 25Fire LT 2Continue Public Education to reduce exposure and increase communityspecific involvement.CO 3 2 2 2 2 2 -2 3 3 2 3 3 2 -1 1 0 0 27 2Fire LT 3Increase communication, coordination and collaboration betweenwildland/urban interface property owners, local and county planners and fireprevention crews and <strong>of</strong>ficials to address risks, existing mitigation measuresCO X 2 2 1 2 2 0 -2 2 3 3 2 0 2 -1 1 0 0 19 16and federal assistance programs.Fire LT 4Encourage implementation <strong>of</strong> wildfire mitigation activities in a mannerconsistent with the goals <strong>of</strong> promoting sustainable ecological managementCO X 2 -1 3 3 2 1 -2 2 3 2 2 -1 3 -1 0 0 1 19 15and community stability.Flood ST 1Update and analyze repetitive flood properties and site appropriate mitigationstrategies.CO 2 2 2 2 1 0 -1 2 2 1 1 0 2 -1 1 0 0 16 24Flood ST 2Revise development requirements as appropriate, for example raising baseelevation. Identify opportunities to upgrade maps.CO X 2 -1 2 2 1 0 -1 1 2 2 1 -1 2 -1 1 0 0 12 34Flood ST 3 Improve flood warning systems X X CO 3 3 2 2 1 0 -1 2 3 2 1 0 2 -2 0 0 18 17Flood LT 1 Enhance and improve data and mapping. CO X 3 0 2 3 1 0 0 2 3 2 1 0 2 -1 2 0 0 20 11Encourage acquisition and management <strong>of</strong> watershed for open space andFlood LT 2 recreational use. Will mostly be done on a regional scale outside <strong>of</strong>CO 2 0 1 2 1 0 -1 3 3 2 1 0 1 -3 0 1 2 15 28<strong>Glendale</strong>.Flood LT 3Identify surface water drainage obstructions through mapping and historicalresearch.X CO 2 1 3 2 1 0 0 2 2 2 1 0 2 -1 0 0 0 17 21Flood LT 4Compile and coordinate surface water plans county wide that may affect ourwatershed.XGISCO 1 0 3 2 1 0 0 1 2 2 1 0 1 -1 0 0 0 13 31For a description <strong>of</strong> the grading system used to weigh each action item, refer to Table 4.4.
Table 4-2: STAPLEE Ranking <strong>of</strong> Action Items2007 Disaster <strong>Mitigation</strong> Plan, City <strong>of</strong> <strong>Glendale</strong>, <strong>California</strong>ACTION ITEMSEQ = Earthquake, MH= Multi <strong>Hazard</strong> ST= Short Term, LT= Long TermDESCRIPTIONAdvisory CommitteeManagement ServicesFirePublic WorksPlanning<strong>Glendale</strong> Water & PowerPolice<strong>Glendale</strong> Unified School DistrictLos Angeles Co Dept. <strong>of</strong> TransportationLos Angeles County FloodAcceptanceSocialEffect on Segment <strong>of</strong> PopulationTechnicalFeasibilityLong-Term SolutionAdministrative Political Legal Economic nvironmentaStaffingFunding AllocatedMaintenancePublic SupportPolitical Support<strong>State</strong> AuthorityExisting Local Auth.Potential ChallengeBenefitCostOutside FundingEffects on EnvironmentConsistent with Community GoalsTOTALRANKMH ST 1MH ST 2MH ST 3MH ST 4MH ST 5MH ST 6MH ST 7Integrate NHMP into <strong>Glendale</strong>’s General Plan, Capital Improvement Plansand local Codes. Lobby to have NHMP concerns integrated into new Codes.Identify and pursue funding opportunities to develop and implement localand City mitigation activities.Establish a formal role for the City <strong>of</strong> <strong>Glendale</strong>’s <strong>Hazard</strong>s <strong>Mitigation</strong> AdvisoryCommittee to develop a sustainable process for implementing, monitoring,and evaluating citywide mitigation activities.Transfer cost <strong>of</strong> risk to owners through insurance. Pinpoint specific hazardsand focus education to match. Continue community wide Public Educationand unify organizations involved in the effort.Identify stake holders and responders. Develop mutual goals and formalizeintegration <strong>of</strong> plans. Improve coordination between GPW and CDOT, andElectric and Transportation utilities in response preparation.Develop inventories <strong>of</strong> at-risk buildings and infrastructure and prioritizemitigation projects.Have owners upgrade bridges where needed. Coordinate emergencytransportation routes. (GPW and Cal DOT.) Coordinate public, privateresources and establish response teams. Educate public <strong>of</strong>ficials re:requirements for disaster response.CO X X X 2 0 2 3 2 0 -1 2 2 2 2 0 2 -1 0 0 0 17 20CO 2 0 2 2 2 0 -1 2 3 2 2 0 2 -1 2 0 0 19 14X CO X 3 2 3 3 2 0 -1 2 2 3 3 0 2 -1 0 0 0 23 6CO 2 2 2 2 1 0 1 0 1 2 1 -2 2 -1 0 0 0 13 30X CO X 2 2 2 2 1 0 -1 1 2 2 2 0 2 -1 0 0 0 16 23X X CO 2 -1 2 3 2 1 -1 3 3 2 2 -1 3 -1 1 0 0 20 10X CO 2 -2 3 3 1 0 -1 2 3 2 1 -1 2 -2 1 0 0 14 29MH LT 1 Publish the Plan, start outreach and public education on aspects <strong>of</strong> NHMP. X CO X X 3 2 3 2 1 0 -1 2 3 3 3 0 2 -1 0 0 0 22 8MH LT 2MH LT 3Slides ST 1Incorporate natural systems and processes in local codes, and use themwhere possible to reduce hazards.Address conflicts created by overlapping regulatory requirements; developsingle reference for emergency action. Include terrorism in Public Educationefforts.Map landslide hazards; emphasize economic risk when building in theseareas.CO 3 -1 2 2 1 0 -1 2 2 2 1 -1 2 -2 1 2 2 17 19CO X 2 2 2 3 2 0 -1 3 3 2 2 0 2 -1 0 0 0 21 9CO CO 2 -2 3 2 1 0 0 1 2 2 1 -1 2 -1 0 0 0 12 33Slides ST 2 Increase communication and coordination between the City’s Departments. CO CO 3 2 3 2 1 0 -2 3 3 1 2 0 2 -1 0 0 0 19 13Slides ST 3Slides LT 1Slides LT 2Increase participation in regional committee planning for emergencytransportation routes. Identify and publicize information regardingemergency transportation routes. Identify potential debris removal resourcesto open routes if needed.Create committee <strong>of</strong> local stakeholders to study issue and makerecommendations to staff.Analyze and perhaps strengthen existing regulations regarding developmentin landslide prone areas. Identify existing mechanisms for public outreach /develop new methods <strong>of</strong> outreach.CO 2 1 2 2 1 0 -1 2 2 2 1 0 2 -1 0 0 0 15 272 2 2 2 1 0 -1 2 3 1 2 0 2 -1 0 0 0 17 18CO X 2 1 3 3 1 0 -1 1 2 2 1 -1 2 -1 0 0 0 15 26Maximum Possible Score 3 3 3 3 3 3 0 3 3 3 3 0 3 0 3 3 3 42 Maximumpossible scoreFor a description <strong>of</strong> the grading system used to weigh each action item, refer to Table 4.4.
Table 4-3: STAPLEE Ranking <strong>of</strong> Specific Action Items2007 Disaster <strong>Mitigation</strong> Plan, City <strong>of</strong> <strong>Glendale</strong>, <strong>California</strong>ACTION ITEMSProvide CERT training to the Community and integratethat capability into our emergency plans.Improve interoperability with local and regionalemergency responders through joint training.Pursue grant funding for fuels modification in theWildland Interface.Foster workgroups to assist stake holders in theirindividual and joint preparation.Expand the Natural <strong>Hazard</strong>s <strong>Mitigation</strong> Plan to addressTerrorism and Pandemic.Facilitate earthquake retr<strong>of</strong>itting <strong>of</strong> critical facilities suchas the MSB and <strong>Glendale</strong> High School.Develop mass evacuation plans with mass transitagencies.Provide reliable emergency back up power to the CivicAuditorium Evacuation Center.Update Emergency Plans with Assisting Agencies andCritical Facilities.Harden our power supply to northern <strong>Glendale</strong> byreplacing transmission line over the Verdugos.Integrate 2010 census data into new Land Use DataBase and GSI to update Hazus studies for Fire, Floodand Landslide.STAPLEE COMPONENTSSocial Technical Administrative Political Legal Economic EnvironmentalAcceptanceEffect on Segment <strong>of</strong> Pop.FeasibilityLong-Term SolutionStaffingFunding AllocatedMaintenancePublic SupportPolitical Support<strong>State</strong> AuthorityExisting Local Auth.BenefitCostOutside FundingEffects on EnvironmentConsistent withCommunity Goals3 3 3 2 3 2 -1 3 3 3 3 0 -2 1 0 0 26 13 1 2 2 2 1 0 2 2 3 3 0 0 0 0 0 21 22 3 3 1 -1 0 -1 2 1 2 2 0 -1 2 2 2 19 32 3 3 2 0 0 0 2 1 3 3 0 -1 0 0 0 18 43 2 3 3 0 -1 -1 2 1 3 3 0 -1 0 0 0 17 53 2 3 3 1 1 0 1 1 3 1 0 -2 0 0 0 17 62 2 3 2 -1 0 -1 2 2 3 3 0 -1 0 0 0 16 72 1 2 2 1 1 0 2 2 1 1 2 -2 0 0 0 15 82 2 3 1 1 0 -1 1 1 3 2 0 -1 0 0 0 14 91 2 2 2 -2 0 -2 1 1 3 2 1 -2 1 0 1 11 103 1 1 2 -2 0 -1 1 1 3 2 -1 -1 0 0 0 9 11TOTALRANKPAGE 4-26
Table 4-4: Description <strong>of</strong> Ranking Criteria Used for Each STAPLEE Component2007 Disaster <strong>Mitigation</strong> Plan, City <strong>of</strong> <strong>Glendale</strong>, <strong>California</strong>GENERAL IMPACT SPECIFIC IMPACT DESCRIPTION <strong>of</strong> GRADING SCALE for EACH IMPACTSocialAcceptanceEffect on Segment <strong>of</strong> PopulationIs the action item perceived as socially acceptable to a wide segment <strong>of</strong> the population? Values range from 0 to 3, with 0 =public indifferent to action, 1 = somewhat popular, 2 = popular, 3 = very popular.Is the action item likely to impact (positively or negatively) a particular segment <strong>of</strong> the population? Values range from -3 to 3with -3 = will negatively impact a segment <strong>of</strong> the population, 0 = will have no effect, 3 = will have a very positive effect on asegment <strong>of</strong> the population.Technical Feasibility Is the action feasible given our current knowledge or science? 0 = No, 1 = somewhat, 2 = moderately, 3 = absolutely.Long-Term SolutionIs implementation <strong>of</strong> this action going to reduce the hazard permanently? 0 = no, 1 = slightly, 2 = somewhat, 3 = yes.AdministrativePoliticalLegalStaffingFunding allocatedMaintenancePublic SupportPolitical Support<strong>State</strong> AuthorityLocal AuthorityPossible Legal Action?Is there staff currently at the City doing this work? Does it involve 1 person, or more? The resulting number is a weightedsum <strong>of</strong> individual components, as described below:Is there staff currently at the City doing this work? 0 = no; 1 = yes, 1 person; 2 = yes, 2 or more but not enough to do theproposed work; 3 = yes, several, enough to get the work done. -1 = City needs to hire someone to do the work; -2 = Cityneeds to hire 2 people to do the work; 3 = City needs to hire several people to get this done.0 = no funding currently allocated; 1 = some funding allocated, need a lot more $, 2 = funding available, enough to do thebasics; 3 = funding available to do the work w/out cutting corners.Does this action require constant maintenance and upgrade? 0 = no, this is a one-time expenditure; -1= some minormaintenance required, -2 = constant maintenance by 1 individual required; -3 = constant maintenance and upgrade required,effort requires 2 more individuals assigned to task.Is the action going to be popular with the public? On a scale from -3 to 3, with -3 = very unpopular; 0 = no public reaction,indifferent; and 3 = very popular.Is the action going to be popular with the Mayor and City Council? On a scale from -3 to 3, with -3 = very unpopular; 0 = noreaction, indifferent; and 3 = very popular.Is there a <strong>State</strong> mandate or a recommendation to have this done? 0 = no; 1= there is minor <strong>State</strong> interest in doing this; 2 thereis a strong support at the <strong>State</strong> level to do this; 3 = there is a <strong>State</strong> mandate to do this, generally with a target date forimplementationIs there a local mandate or recommendation to implement this action? 0 = no; 1 = there is minor local support to get thisdone, 2 = there is strong local support to get this done; 3 = there is a City mandate to get this done.Is this action likely to get challenged in court? 0 = no; -1 = a small possibility, -2 = yes, some people might object enough togo to court; -3 = yes, expect several neighbors to challenge this in court.Economic Benefit The economic benefits <strong>of</strong> implementing this action. 0 = no benefit; 1= small benefit, 2 = benefit; 3 = great benefit.CostThe economic costs <strong>of</strong> implementing this action: 0 = no costs; -1 = small cost, -2 = some cost; 3= very expensive.Outside FundingIs there outside funding available to implement this action? 0 = no; 1 = small amounts <strong>of</strong> money, not enough to get it done;2= funding available; 3= enough grant money available to get this done.EnvironmentalImpacts on EnviromentConsistent with Community'sEnvironmental GoalsDoes this action have a positive or negative impact on the environment? On a scale from -3 to 3 with -3 = severe negativeimpact on enviroment; 0 = no impact; and 3 = very positive impact on environment.Is the proposed action consistent with <strong>Glendale</strong>'s environmental goals? On a scale from -3 to3 with -3 = goes against all goalsto protect the environment; 0 = has no impact on the local enviromental goals; 3 = is very consistent with <strong>Glendale</strong>'senvironmental goals.Page 4-27
Natural <strong>Hazard</strong>s <strong>Mitigation</strong> PlanCity <strong>of</strong> <strong>Glendale</strong>, <strong>California</strong>Section 4 – Multi-<strong>Hazard</strong> Goals and Action ItemsJurisdiction:Project TitleAgency:<strong>Hazard</strong>(s):Flood Zone:Project Evaluation WorksheetBase FloodElevation:Contact:Phone:E-mail:Erosion Rate:Critical Facility/Population At Risk:Environmental Impact:Historic Preservation Impact:High Medium Low High Medium LowImportance to Protection <strong>of</strong> Life/Property andRisk <strong>of</strong> <strong>Hazard</strong> Impact:Disaster RecoveryHigh Medium Low High Medium LowEstimated Cost:Project Duration:Value <strong>of</strong> Facility:Value <strong>of</strong> Contents:Source(s) <strong>of</strong> Financing:Project Objectives:Project Description:Proposal Date:Evaluation Category Considerations CommentsCommunity AcceptanceSocialTechnicalAdversely Affects Segments <strong>of</strong> thePopulationTechnical FeasibilityLong Term SolutionAdministrativeSecondary ImpactsStaffingFunding AllocatedPoliticalMaintenance / OperationsPolitical SupportPlan ProponentLegalPublic SupportAuthorityAction Subject to Legal ChallengeEconomicBenefitCost <strong>of</strong> ActionContributes to Economic GoalsEnvironmentalOutside Funding RequiredAffects Land / Water BodiesAffects Endangered SpeciesAffects <strong>Hazard</strong>ous Materials andWaste SitesConsistent with CommunityEnvironmental GoalsConsistent with Federal Laws2006 PAGE 4 - 28
Natural <strong>Hazard</strong>s <strong>Mitigation</strong> PlanCity <strong>of</strong> <strong>Glendale</strong>, <strong>California</strong>SECTION 5:Section 5 – Plan MaintenancePLAN MAINTENANCEThe plan maintenance section <strong>of</strong> this document details the formal process that will ensure that<strong>Glendale</strong>’s <strong>Hazard</strong>s <strong>Mitigation</strong> Plan remains an active and relevant document. The planmaintenance process includes a schedule for monitoring and evaluating the Plan annually andproducing a Plan revision every five years. This section describes how the City <strong>of</strong> <strong>Glendale</strong> willintegrate public participation throughout the plan maintenance process. Finally, this sectionincludes an explanation <strong>of</strong> how the City <strong>of</strong> <strong>Glendale</strong> government intends to incorporate themitigation strategies outlined in this Plan into existing planning mechanisms such as the City’sGeneral Plan, Capital Improvement Plans, and Building and Safety Codes.Monitoring and Implementing the PlanPlan AdoptionCity Council will be responsible for adopting <strong>Glendale</strong>’s <strong>Hazard</strong>s <strong>Mitigation</strong> Plan. Thisgoverning body has the authority to promote sound public policy regarding natural hazardmitigation. Once the Plan has been adopted, the City Emergency Services Coordinator will beresponsible for submitting the Plan to the <strong>State</strong> <strong>Hazard</strong> <strong>Mitigation</strong> Officer at the Governor’sOffice <strong>of</strong> Emergency Services. The Governor’s Office <strong>of</strong> Emergency Services will then submitthe Plan to the Federal Emergency Management Agency (FEMA) for review. This review willaddress the federal criteria outlined in FEMA Interim Final Rule 44 CFR Part 201. Uponacceptance by FEMA, <strong>Glendale</strong> will gain eligibility for <strong>Hazard</strong> <strong>Mitigation</strong> Grant Programfunds.Coordinating BodyThe City <strong>of</strong> <strong>Glendale</strong> <strong>Hazard</strong> <strong>Mitigation</strong> Steering Committee will be responsible forcoordinating implementation <strong>of</strong> Plan’s action items and undertaking the formal review process.The City Mayor, or designee, will assign representatives from City agencies, including, but notlimited to, the current <strong>Hazard</strong> <strong>Mitigation</strong> Steering Committee members. At this time, the<strong>Hazard</strong> <strong>Mitigation</strong> Steering Committee consists <strong>of</strong> a representative from each <strong>of</strong> the followingCity Departments or agencies:♦♦♦♦City <strong>of</strong> <strong>Glendale</strong> Fire Department, including Emergency ServicesCity <strong>of</strong> <strong>Glendale</strong> Planning DepartmentCity <strong>of</strong> <strong>Glendale</strong> Management Services, andCity <strong>of</strong> <strong>Glendale</strong> Public Works Department.The Steering Committee is supported by a larger body <strong>of</strong> advisors representing several otheragencies and organizations that have a vested interest in managing or reducing the naturalhazards in the city <strong>of</strong> <strong>Glendale</strong>. This larger body, referred to as the <strong>Hazard</strong> <strong>Mitigation</strong>Advisory Committee, has responsibility for reviewing the Plan and providing input on theaction items proposed and their prioritization. The current Advisory Committee membersinclude representatives from the following local agencies and organizations:♦♦♦♦♦♦City <strong>of</strong> <strong>Glendale</strong> Emergency ServicesCity <strong>of</strong> <strong>Glendale</strong> Police DepartmentCity <strong>of</strong> <strong>Glendale</strong> Water and PowerCity <strong>of</strong> <strong>Glendale</strong> Parks, Recreation, and Community ServicesCity <strong>of</strong> <strong>Glendale</strong> Engineering Department, Information Services DivisionCity <strong>of</strong> <strong>Glendale</strong> Development Services2006 PAGE 5 - 1
Natural <strong>Hazard</strong>s <strong>Mitigation</strong> PlanCity <strong>of</strong> <strong>Glendale</strong>, <strong>California</strong>Section 5 – Plan Maintenance♦♦♦<strong>Glendale</strong> Unified School District<strong>Glendale</strong> Memorial Hospital, andVerdugo Hills Hospital.I n order to make this committee as broad and useful as possible, the City Mayor, or designee,may engage other relevant organizations and agencies, including:♦ An elected <strong>of</strong>ficial♦ A representative from the Chamber <strong>of</strong> Commerce♦ An insurance company representative♦ Community Planning Organization representatives♦ A representative from the City Manager’s <strong>of</strong>fice♦ Representatives from pr<strong>of</strong>essional organizations such as the Home BuildersAssociation♦ Representatives from the local universities and community colleges♦ A representative from the Office <strong>of</strong> Disaster Management, Area C, and♦ Local residentsAdditional resources at the state and federal levels, in the form <strong>of</strong> ad-hoc committee membersthat could be invited to participate in <strong>Glendale</strong>’s Natural <strong>Hazard</strong>s <strong>Mitigation</strong> program, could bedrawn from the following agencies:♦♦♦♦♦<strong>California</strong> Geological SurveyFederal Emergency Management Agency<strong>California</strong> Governor’s Office <strong>of</strong> Emergency ServicesRed CrossSalvation ArmyThe <strong>Hazard</strong> <strong>Mitigation</strong> Steering Committee will meet no less than quarterly. Meeting dateswill be scheduled once the final Plan has been adopted by City Council and approved by theappropriate FEMA <strong>of</strong>fice. These meetings will provide an opportunity to discuss the progress<strong>of</strong> the action items and maintain the partnerships that are essential for the sustainability <strong>of</strong> the<strong>Mitigation</strong> Plan.ConvenerCity Council will adopt <strong>Glendale</strong>’s <strong>Hazard</strong> <strong>Mitigation</strong> Plan, and the <strong>Hazard</strong> <strong>Mitigation</strong> SteeringCommittee will take responsibility for Plan implementation. The City Mayor, or designee, willserve as a convener to facilitate the meetings <strong>of</strong> the <strong>Hazard</strong> <strong>Mitigation</strong> Steering and AdvisoryCommittees, and will assign tasks such as updating and presenting the Plan to the members <strong>of</strong>the committees. Plan implementation and evaluation will be a shared responsibility among all<strong>of</strong> the <strong>Hazard</strong> Steering Committee members. Future updates <strong>of</strong> the Plan will requireparticipation <strong>of</strong> the Advisory Committee.Implementation through Existing ProgramsThe City <strong>of</strong> <strong>Glendale</strong> addresses statewide planning goals and legislative requirements throughits General Plan, Capital Improvement Plans, and City Building and Safety Codes. The <strong>Hazard</strong><strong>Mitigation</strong> Plan provides a series <strong>of</strong> recommendations, many <strong>of</strong> which are closely related to thegoals and objectives <strong>of</strong> existing planning programs. The City <strong>of</strong> <strong>Glendale</strong> will have theopportunity to implement recommended mitigation action items through existing programs andprocedures.2006 PAGE 5 - 2
Natural <strong>Hazard</strong>s <strong>Mitigation</strong> PlanCity <strong>of</strong> <strong>Glendale</strong>, <strong>California</strong>Section 5 – Plan MaintenanceThe City <strong>of</strong> <strong>Glendale</strong> Engineering, Planning and Fire Departments are responsible foradministering the Building and Fire Codes, and other regulations designed to improve safety <strong>of</strong>the community, such as the policies in the Safety Element <strong>of</strong> the General Plan. In addition, the<strong>Hazard</strong> Steering Committee will work with other agencies at the state level to review, developand implement Building and Safety Codes that are adequate to mitigate or reduce the damageposed by natural hazards. This is to ensure that life-safety criteria are met for new construction.The goals and action items in the <strong>Mitigation</strong> Plan may be achieved through activitiesrecommended in the City's Capital Improvement Plans (CIP). Various City departmentsdevelop CIP plans and review them on an annual basis. Upon annual review <strong>of</strong> the CIPs, the<strong>Hazard</strong> <strong>Mitigation</strong> Advisory Committee will work with the City departments to identify areasthat the <strong>Hazard</strong> <strong>Mitigation</strong> Plan action items are consistent with CIP planning goals andintegrate them where appropriate.Within six months <strong>of</strong> formal adoption <strong>of</strong> the <strong>Mitigation</strong> Plan, the recommendations listed abovewill be incorporated into the process <strong>of</strong> existing planning mechanisms at the City level. Themeetings <strong>of</strong> the <strong>Hazard</strong> <strong>Mitigation</strong> Steering and Advisory Committees will provide anopportunity for committee members to report back on the progress made on the integration <strong>of</strong>mitigation planning elements into City planning documents and procedures.Economic Analysis <strong>of</strong> <strong>Mitigation</strong> ProjectsFEMA's approaches to identify the costs and benefits associated with natural hazard mitigationstrategies, measures, or projects, fall into two general categories: benefit/cost analysis and cost-for a mitigation activity can assisteffectiveness analysis. Conducting a benefit/cost analysiscommunities in determining whether a project is worth undertaking now, in order to avoiddisaster-related damages later. Cost-effectiveness analysis evaluates how best to spend a givenamount <strong>of</strong> money to achieve a specific goal. Determining the economic feasibility <strong>of</strong> mitigatingnatural hazards can provide decision-makers with an understanding <strong>of</strong> the potential benefits andcosts <strong>of</strong> an activity, as well as a basis upon which to compare alternative projects.Given federal funding, the <strong>Hazard</strong> <strong>Mitigation</strong> Advisory Committee will use a FEMA-approvedbenefit/cost analysis approach to identify and prioritize mitigation action items. A copy <strong>of</strong> aProject Evaluation Worksheet modeled after the STAPPLE cost benefit analysis processpreferred by FEMA, is included at the end <strong>of</strong> Chapter 4. For other projects and fundingsources, the <strong>Hazard</strong> <strong>Mitigation</strong> Advisory Committee may use other approaches to understandthe costs and benefits <strong>of</strong> each action item and develop a prioritized list. For more informationregarding economic analysis <strong>of</strong> mitigation action items, please see Appendix C <strong>of</strong> the Plan.2006 PAGE 5 - 3
Natural <strong>Hazard</strong>s <strong>Mitigation</strong> PlanCity <strong>of</strong> <strong>Glendale</strong>, <strong>California</strong>Section 5 – Plan MaintenanceEvaluating and Updating the PlanFormal Review ProcessThe City <strong>of</strong> <strong>Glendale</strong> <strong>Hazard</strong>s <strong>Mitigation</strong> Plan will be evaluated on an annual basis to determinethe effectiveness <strong>of</strong> programs, and to reflect changes in land development or programs that mayaffect mitigation priorities. The evaluation process includes a firm schedule and time line, andidentifies the local agencies and organizations participating in Plan evaluation. The convener,or designee, will be responsible for contacting the <strong>Hazard</strong> <strong>Mitigation</strong> Advisory Committeemembers and organizing the annual meeting. Committee members will be responsible formonitoring and evaluating the progress <strong>of</strong> the mitigation strategies in the Plan.The Committee will review the goals and action items to determine their relevance to changingsituations in the City, as well as changes in <strong>State</strong> or Federal policy, and to ensure they areaddressing current and expected conditions. The Committee will also review the riskassessment portion <strong>of</strong> the Plan to determine if this information should be updated or modified,given new available data. The coordinating organizations responsible for the various actionitems will report on the status <strong>of</strong> their projects, the success <strong>of</strong> various implementation processes,difficulties encountered, success <strong>of</strong> coordination efforts, and which strategies should be revised.The convener will assign the duty <strong>of</strong> updating the Plan to one or more <strong>of</strong> the SteeringCommittee members. The designated committee members will have three months to makeappropriate changes to the Plan before submitting it to the <strong>Hazard</strong> <strong>Mitigation</strong> AdvisoryCommittee members, and presenting it to City Council. The <strong>Hazard</strong> <strong>Mitigation</strong> SteeringCommittee will also notify all holders <strong>of</strong> the City Plan when changes have been made. Everyfive years the updated Plan will be submitted to the <strong>State</strong> <strong>Hazard</strong> <strong>Mitigation</strong> Officer and theFederal Emergency Management Agency for review.Continued Public InvolvementThe City <strong>of</strong> <strong>Glendale</strong> is dedicated to involving the public directly in review and updates <strong>of</strong> the<strong>Hazard</strong> <strong>Mitigation</strong> Plan. The <strong>Hazard</strong> <strong>Mitigation</strong> Advisory Committee members are responsiblefor the annual review and update <strong>of</strong> the Plan.The public will also have the opportunity to provide feedback about the Plan. Copies <strong>of</strong> thePlan will be kept at all <strong>of</strong> the appropriate agencies in the City, as well as at the Central Libraryand branches. The Plan will also be placed on the City’s website for review by the public, oralternatively, the existence and location <strong>of</strong> copies <strong>of</strong> the Plan will be publicized on the City’swebsite and newsletters. In addition, information on how to obtain copies <strong>of</strong> the Plan and anyproposed changes will be posted on the City’s website. This site will list an e-mail address andphone number to which people can direct their comments and concerns.A public meeting will also be held after each annual evaluation or when deemed necessary bythe <strong>Hazard</strong> <strong>Mitigation</strong> Advisory Committee. The meetings will provide the public with a forumfrom which they can express their concerns, opinions, or ideas about the Plan. The City’s PublicInformation Officer will be responsible for using City resources to publicize the annual publicmeetings and maintain public involvement through the City’s public access channel, web page,and newspapers or newsletters.2006 PAGE 5 - 4
Natural <strong>Hazard</strong>s <strong>Mitigation</strong> PlanCity <strong>of</strong> <strong>Glendale</strong>, <strong>California</strong>SECTION 6:Section 6 – EarthquakesEARTHQUAKESTable <strong>of</strong> ContentsWhy Are Earthquakes A Threat to the City <strong>of</strong> <strong>Glendale</strong>?....................................... 6-1History <strong>of</strong> Earthquake Events in Southern <strong>California</strong> .......................................................6-10Earthquake <strong>Hazard</strong> Assessment ..................................................................................6-14<strong>Hazard</strong> Identification ..................................................................................................................6-15Vulnerability Assessment ..........................................................................................................6-32Risk Analysis ................................................................................................................................6-36Existing <strong>Mitigation</strong> Activities .....................................................................................6-56Earthquake <strong>Mitigation</strong> Action Items .........................................................................6-59Earthquake Resource Directory .................................................................................6-62Local and Regional Resources ..................................................................................................6-62<strong>State</strong> Resources ............................................................................................................................6-63Federal and National Resources ..............................................................................................6-64Publications ...................................................................................................................................6-652006 PAGE 6 - i
Natural <strong>Hazard</strong>s <strong>Mitigation</strong> PlanCity <strong>of</strong> <strong>Glendale</strong>, <strong>California</strong>SECTION 6:Section 6 – EarthquakesEARTHQUAKESWhy Are Earthquakes a Threat to the City <strong>of</strong> <strong>Glendale</strong>?While <strong>Glendale</strong> is at risk from many natural and man-made hazards, an earthquake is the event withthe greatest potential for far-reaching loss <strong>of</strong> life or property, and economic damage. This is true formost <strong>of</strong> southern <strong>California</strong>, since damaging earthquakes are frequent, affect widespread areas,trigger many secondary effects, and can overwhelm the ability <strong>of</strong> local jurisdictions to respond.Earthquake-triggered geologic effects include ground shaking, surface fault rupture, landslides,liquefaction, subsidence, and seiches. Earthquakes can also cause human-made hazards such as urbanfires, dam failures, and toxic chemical releases.In <strong>California</strong>, recent earthquakes in or near urban environments have caused relatively fewcasualties. This is due more to luck than design. For example, when a portion <strong>of</strong> the NimitzFreeway in Oakland collapsed at rush hour during the 1989, M W 7.1 Loma Prieta earthquake, it wasuncommonly empty because so many were watching the World Series. The 1994, M W 6.7Northridge earthquake occurred before dawn, when most people were home safely in bed. Despitesuch good luck, <strong>California</strong>’s urban earthquakes have resulted in significant losses. The moderatesizedNorthridge earthquake caused 54 deaths, more than 1,500 injuries and nearly $30 billion indamage. For days afterward, thousands <strong>of</strong> homes and businesses were without electricity; tens <strong>of</strong>thousands had no gas; and nearly 50,000 had little or no water. Approximately 15,000 structureswere moderately to severely damaged, which left thousands <strong>of</strong> people temporarily homeless. Severalcollapsed bridges and overpasses created commuter havoc on the freeway system. Extensive damagewas caused by ground shaking, with shaking-induced liquefaction and dozens <strong>of</strong> fires after theearthquake causing additional severe damage. This moderately sized earthquake resulted in recordeconomic losses, and yet <strong>Glendale</strong> is at risk from earthquakes that could release more than ten timesthe seismic energy <strong>of</strong> the Northridge earthquake.Historical and geological records show that <strong>California</strong> has a long history <strong>of</strong> seismic events. Southern<strong>California</strong> is probably best known for the San Andreas fault, a 750-mile long fault running from theMexican border to a point <strong>of</strong>fshore west <strong>of</strong> San Francisco. Geologic studies show that over the past1,400 to 1,500 years, large earthquakes have occurred on the southern San Andreas fault at about130-year intervals. As the last large earthquake on the southern San Andreas occurred in 1857, thatsection <strong>of</strong> the fault is considered a likely location for an earthquake within the next few decades. TheSan Andreas fault, however, is only one <strong>of</strong> dozens <strong>of</strong> known faults that criss-cross southern<strong>California</strong>. Some <strong>of</strong> the better-known faults include the Sierra Madre, Newport-Inglewood,Whittier, Elsinore, Hollywood, and Palos Verdes faults. Of these, the Sierra Madre and Hollywoodfaults extend through the northern and southwestern portions, respectively, <strong>of</strong> <strong>Glendale</strong>, whereasthe lesser-known, but active Verdugo and Raymond faults extend through the central andsoutheastern portions <strong>of</strong> <strong>Glendale</strong> (see Map 6.1). Beyond these known faults, there are several“blind” faults that underlie southern <strong>California</strong>. [“Blind” faults do not break the surface, but ratheroccur thousands <strong>of</strong> feet below the ground. They are not less <strong>of</strong> a seismic hazard, though]. One suchblind fault ruptured causing the Whittier Narrows earthquake in October 1987. Each <strong>of</strong> these faultsis capable <strong>of</strong> producing, at a minimum, a moderate-sized earthquake that has the potential to inflictgreat damage on the urban core <strong>of</strong> the Los Angeles basin. For example, seismologists believe that a6.0 to 6.5 earthquake on the Newport-Inglewood fault would result in far more death anddestruction than a “great” quake on the San Andreas fault, because the San Andreas is relativelyremote from the urban centers <strong>of</strong> southern <strong>California</strong>.Map 6.1: Faults In and Near <strong>Glendale</strong>2006 PAGE 6 - 2
Natural <strong>Hazard</strong>s <strong>Mitigation</strong> PlanCity <strong>of</strong> <strong>Glendale</strong>, <strong>California</strong>Section 6 – EarthquakesAlthough great advances in earthquake engineering have been made in the last decade, in great partas a result <strong>of</strong> the 1994 Northridge, <strong>California</strong>, 1995 Kobe, Japan, 1999 Izmit, Turkey and 1999 Chi-Chi, Taiwan earthquakes, the majority <strong>of</strong> <strong>California</strong> communities remain unprepared because there isa general lack <strong>of</strong> understanding regarding earthquake hazards among <strong>California</strong>ns. It is not possibleto prevent earthquakes, but their destructive effects can be minimized. Comprehensive hazardmitigation programs that include the identification and mapping <strong>of</strong> hazards, prudent planning, publiceducation, emergency exercises, enforcement <strong>of</strong> building codes, and expedient retr<strong>of</strong>itting andrehabilitation <strong>of</strong> weak structures can significantly reduce the scope <strong>of</strong> an earthquake’s effects andavoid disaster. Local government, emergency relief organizations, and residents must take action todevelop and implement policies and programs to reduce the effects <strong>of</strong> earthquakes.Earthquake Basics - DefinitionsThe outer 10 - 70 kilometers <strong>of</strong> the Earth consist <strong>of</strong> enormous blocks <strong>of</strong> moving rock, called plates.There are about a dozen major plates, which slowly collide, separate, and grind past each other. In2006 PAGE 6 - 3
Natural <strong>Hazard</strong>s <strong>Mitigation</strong> PlanCity <strong>of</strong> <strong>Glendale</strong>, <strong>California</strong>Section 6 – Earthquakesthe uppermost plates, friction locks the plate edges together, while movement continues at depth.Consequently, the near-surface rocks bend and deform near plate boundaries, storing strain energy.Eventually, the frictional forces are overcome and the locked portions <strong>of</strong> the plates move. The storedstrain energy is released in waves.By definition, the break or fracture between moving blocks <strong>of</strong> rock is called a fault, and suchdifferential movement produces a fault rupture. The place where the fault first ruptures is called thefocus (or hypocenter). The released energy waves radiate out in all directions from the rupturesurface, making the earth vibrate and shake as the waves travel through. This shaking is what wefeel in an earthquake.Although faults exist everywhere, most earthquakes occur on or near plate boundaries. Thus,southern <strong>California</strong> has many earthquakes, because it straddles the boundary between the NorthAmerican and Pacific plates, and fault rupture accommodates their motion. The Pacific Plate ismoving northwesterly, relative to the North American Plate, at about 50 mm/yr. This is about therate at which fingernails grow, and seems unimpressive. However, it is enough to accumulateenormous amounts <strong>of</strong> strain energy over dozens to thousands <strong>of</strong> years. Despite being locked inplace most <strong>of</strong> the time, in another 15 million years (a short time in the context <strong>of</strong> the Earth’s history),due to plate movements, <strong>Glendale</strong> will be hundreds <strong>of</strong> kilometers north <strong>of</strong> San Francisco.Although the San Andreas fault marks the actual separation between the Pacific and North Americanplates, only about 70 percent <strong>of</strong> the plate motion occurs on the San Andreas fault itself. The rest isdistributed among other faults <strong>of</strong> the San Andreas system, including the San Jacinto, Whittier-Elsinore, Newport-Inglewood, Palos Verdes, plus several <strong>of</strong>fshore faults; and among faults <strong>of</strong> theEastern Mojave Shear Zone, a series <strong>of</strong> faults east <strong>of</strong> the San Andreas, responsible for the 1992Landers and 1999 Hector Mine earthquakes. (M W stands for moment magnitude, a measure <strong>of</strong>earthquake energy release, discussed below.) Thus, the zone <strong>of</strong> plate-boundary earthquakes andground deformation covers an area that stretches from the Pacific Ocean to Nevada.Because the Pacific and North American plates are sliding past each other, with relative motions tothe northwest and southeast, respectively, all <strong>of</strong> the faults mentioned above are aligned northwestsoutheast,and are strike-slip faults. On average, strike-slip faults are nearly vertical breaks in therock, and when a strike-slip fault ruptures, the rocks on either side <strong>of</strong> the fault slide horizontally pasteach other.However, about 75 miles northeast <strong>of</strong> <strong>Glendale</strong>, there is a kink in the San Andreas fault, commonlyreferred to as the “Big Bend.” Near the Big Bend, the two plates do not slide past each other.Instead, they collide, causing localized compression, resulting in folding and thrust faulting. Thrustfaults meet the surface <strong>of</strong> the Earth at a low angle, dipping 25 – 45 degrees from the horizontal.Thrusts are a type <strong>of</strong> dip-slip fault, where rocks on opposite sides <strong>of</strong> the fault move up or downrelative to each other. When a thrust fault ruptures, the top block <strong>of</strong> rock moves up and over therock on the other side <strong>of</strong> the fault.Strike-slip faults are vertical or almost verticalrifts where the earth’s plates move mostlyhorizontally. From the observer’s perspective, ifthe opposite block looking across the fault movesto the right, the slip style is called a right- lateralfault; if the block moves left, the shift is called aleft-lateral fault.Normal faultReverse fault2006 PAGE 6 - 4
Natural <strong>Hazard</strong>s <strong>Mitigation</strong> PlanCity <strong>of</strong> <strong>Glendale</strong>, <strong>California</strong>Section 6 – EarthquakesDip-slip faults are slanted fractures where the blocks mostly shift vertically. If the earth above an inclined faultmoves down, the fault is called a normal fault, but when the rock above the fault moves up, the fault is called areverse fault. Thrust faults are reverse faults with a dip <strong>of</strong> 45 ° or less.Few faults are simple, planar breaks in the Earth. They more <strong>of</strong>ten consist <strong>of</strong> smaller strands, with asimilar orientation and sense <strong>of</strong> movement. Sometimes geologists group strands into segments,which are believed capable <strong>of</strong> rupturing together during a single earthquake. The more extensive thefault, the bigger the earthquake it can produce. Therefore, multi-strand fault ruptures producelarger earthquakes.The bigger and closer the earthquake, the greater the likelihood <strong>of</strong> damage. Thus fault dimensionsand proximity to urban centers are key parameters in any hazard assessment. In addition, it isimportant to know a fault’s style <strong>of</strong> movement (i.e. is it dip-slip or strike-slip), the age <strong>of</strong> its mostrecent activity, its total displacement, and its slip rate (all discussed below). These values indicatehow <strong>of</strong>ten a fault produces damaging earthquakes, and how big an earthquake should be expected thenext time the fault ruptures.Total displacement is the length, measured in kilometers (km), <strong>of</strong> the total movement that hasoccurred along the fault over as long a time as the geologic record reveals. It is usually estimated bymeasuring distances between geologic features that have been split apart and separated (<strong>of</strong>fset) bythe cumulative movement <strong>of</strong> the fault over many earthquakes. Slip rate is a speed, expressed inmillimeters per year (mm/yr). Slip rate is estimated by measuring an amount <strong>of</strong> <strong>of</strong>fset accruedduring a known amount <strong>of</strong> time, obtained by dating the ages <strong>of</strong> geologic features. Slip rate data alsoare used to estimate a fault’s earthquake recurrence interval. Sometimes referred to as “repeattime” or “return interval”, the recurrence interval represents the average amount <strong>of</strong> time that elapsesbetween major earthquakes on a fault. The most specific way to derive recurrence interval is toexcavate a trench across a fault to obtain paleoseismic evidence <strong>of</strong> earthquakes that have occurredduring prehistoric time.In southern <strong>California</strong>, ruptures along thrust faults have built the Transverse Ranges geologicprovince, a region with an east-west trend to its landforms and underlying geologic structures. Thisorientation is anomalous, virtually unique in the western United <strong>State</strong>s, and a direct consequence <strong>of</strong>the plates colliding at the Big Bend. Many <strong>of</strong> southern <strong>California</strong>’s most recent damagingearthquakes have occurred on thrust faults that are uplifting the Transverse Ranges, including the1971 San Fernando, the 1987 Whittier Narrows, the 1991 Sierra Madre, and the 1994 Northridgeearthquakes. Thrust faults can be particularly hazardous because many are blind thrust faults, thatis, they do not extend to the surface <strong>of</strong> the Earth. These faults are extremely difficult to detectbefore they rupture. Some <strong>of</strong> the most recent earthquakes, like the 1987 Whittier Narrowsearthquake, and the 1994 Northridge earthquake, occurred on blind thrust faults.When comparing the sizes <strong>of</strong> earthquakes, the most meaningful feature is the amount <strong>of</strong> energyreleased. Thus scientists most <strong>of</strong>ten consider seismic moment, a measure <strong>of</strong> the energy releasedwhen a fault ruptures. We are more familiar, however, with scales <strong>of</strong> magnitude, which measureamplitude <strong>of</strong> ground motion. Magnitude scales are logarithmic. Each one-point increase inmagnitude represents a ten-fold increase in amplitude <strong>of</strong> the waves as measured at a specific location,2006 PAGE 6 - 5
Natural <strong>Hazard</strong>s <strong>Mitigation</strong> PlanCity <strong>of</strong> <strong>Glendale</strong>, <strong>California</strong>Section 6 – Earthquakesand a 32-fold increase in energy. That is, a magnitude 7 earthquake produces 100 times (10 x 10) theground motion amplitude <strong>of</strong> a magnitude 5 earthquake. Similarly, a magnitude 7 earthquake releasesapproximately 1,000 times more energy (32 x 32) than a magnitude 5 earthquake. Recently,scientists have developed the moment magnitude (Mw) scale to relate energy release to magnitude.[The moment magnitude scale has replaced the Richter scale, which is no longer being used.]An early measure <strong>of</strong> earthquake size still used today is the seismic intensity scale, which is aqualitative assessment <strong>of</strong> an earthquake’s effects at a given location. Although it has limitedscientific application, intensity is still widely used because it is intuitively clear and quick todetermine. The most commonly used measure <strong>of</strong> seismic intensity is called the Modified MercalliIntensity (MMI) scale, which has 12 damage levels (Table 6.1).A given earthquake will have one moment and, in principle, one magnitude, although there areseveral methods <strong>of</strong> calculating magnitude, which give slightly different results. However, oneearthquake will produce many intensities because intensity effects vary with the location andperceptions <strong>of</strong> the observer.2006 PAGE 6 - 6
Natural <strong>Hazard</strong>s <strong>Mitigation</strong> PlanCity <strong>of</strong> <strong>Glendale</strong>, <strong>California</strong>Table 6-1:Abridged Modified Mercalli Intensity ScaleSection 6 – EarthquakesIntensity Value and DescriptionAverage PeakVelocity(cm/sec)Average PeakAcceleration(g = gravity )I. Not felt except by a very few under especially favorable circumstances (I Rossi-Forel scale). Damage potential: None.II. Felt only by a few persons at rest, especially on upper floors <strong>of</strong> high-risebuildings. Delicately suspended objects may swing.(I to II Rossi-Forel scale). Damage potential: None.III. Felt quite noticeably indoors, especially on upper floors <strong>of</strong> buildings, but manypeople do not recognize it as an earthquake. Standing automobiles may rockslightly. Vibration like passing <strong>of</strong> truck. Duration estimated. (III Rossi-Forelscale). Damage potential: None.IV. During the day felt indoors by many, outdoors by few. At night some awakened.Dishes, windows, doors disturbed; walls make creaking sound. Sensation like aheavy truck striking building. Standing automobiles rocked noticeably. (IV to VRossi-Forel scale). Damage potential: None. Perceived shaking: Light.V. Felt by nearly everyone; many awakened. Some dishes, windows, and so onbroken; cracked plaster in a few places; unstable objects overturned.Disturbances <strong>of</strong> trees, poles, and other tall objects sometimes noticed. Pendulumclocks may stop. (V to VI Rossi-Forel scale). Damage potential: Very light.Perceived shaking: Moderate.VI. Felt by all; many frightened and run outdoors. Some heavy furniture moved, fewinstances <strong>of</strong> fallen plaster and damaged chimneys. Damage slight. (VI to VIIRossi-Forel scale). Damage potential: Light. Perceived shaking: Strong.VII. Everybody runs outdoors. Damage negligible in buildings <strong>of</strong> good design andconstruction; slight to moderate in well-built ordinary structures; considerable inpoorly built or badly designed structures; some chimneys broken. Noticed bypersons driving cars. (VIII Rossi-Forel scale). Damage potential: Moderate.Perceived shaking: Very strong.VIII. Damage slight in specially designed structures; considerable in ordinarysubstantial buildings with partial collapse; great in poorly built structures. Panelwalls thrown out <strong>of</strong> frame structures. Fall <strong>of</strong> chimneys, factory stacks, columns,monuments, and walls. Heavy furniture overturned. Sand and mud ejected insmall amounts. Changes in well water. Persons driving cars disturbed. (VIII+to IX Rossi-Forel scale). Damage potential: Moderate to heavy. Perceivedshaking: Severe.IX. Damage considerable in specially designed structures; well-designed framestructures thrown out <strong>of</strong> plumb; great in substantial buildings with partialcollapse. Buildings shifted <strong>of</strong>f foundations. Ground cracked conspicuously.Underground pipes broken. (IX+ Rossi-Forel scale). Damage potential: Heavy.Perceived shaking: Violent.X. Some well-built wooden structures destroyed; most masonry and framestructures destroyed; ground badly cracked. Rails bent. Landslides considerablefrom river banks and steep slopes. Shifted sand and mud. Water splashed,slopped over banks. (X Rossi-Forel scale). Damage potential: Very heavy.Perceived shaking: Extreme.XI. Few, if any, (masonry) structures remain standing. Bridges destroyed. Broadfissures in ground. Underground pipelines completely out <strong>of</strong> service. Earthslumps and land slips in s<strong>of</strong>t ground. Rails bent greatly. 1.24XII.Damage total. Waves seen on ground surface. Lines <strong>of</strong> sight and level distorted.Objects thrown into air.Modified from Bolt (1999); Wald et al. (1999).Causes <strong>of</strong> Earthquake Damage2006 PAGE 6 - 7
Natural <strong>Hazard</strong>s <strong>Mitigation</strong> PlanCity <strong>of</strong> <strong>Glendale</strong>, <strong>California</strong>Section 6 – EarthquakesCauses <strong>of</strong> earthquake damage can be categorized into three general areas: strong shaking, varioustypes <strong>of</strong> ground failure that are a result <strong>of</strong> shaking, and ground displacement along the rupturingfault.Ground shaking is the motion felt on the earth's surface caused by seismic waves generated by theearthquake. It is the primary cause <strong>of</strong> earthquake damage, and is typically reported as the peakhorizontal ground acceleration estimated as a percentage <strong>of</strong> g, the acceleration <strong>of</strong> gravity. Fullcharacterization <strong>of</strong> shaking potential, though, requires estimates <strong>of</strong> peak (maximum) grounddisplacement and velocity, the duration <strong>of</strong> strong shaking, and the periods (lengths) <strong>of</strong> waves thatwill control each <strong>of</strong> these factors at a given location. The strength <strong>of</strong> ground shaking also dependson the source, path, and site effects. Estimates <strong>of</strong> the ground shaking possible at different locationsin <strong>California</strong> have been mapped, as shown on Map 6.2.• Source effects include earthquake size, location, and distance, plus directivity <strong>of</strong> the seismicwaves (for example, the 1995, M W 6.9, Kobe, Japan earthquake was not much bigger than the1994, M W 6.7 Northridge, <strong>California</strong> earthquake, but Kobe caused much worse damage.During the Kobe earthquake, the fault’s orientation and movement directed seismic wavesinto the city. During the Northridge earthquake, the fault’s motion directed waves awayfrom populous areas).• Path effects refers to how the seismic waves change direction as they travel through theEarth’s contrasting layers, just as light bounces (reflects) and bends (refracts) as it movesfrom air to water. Sometimes seismic energy gets focussed into one location and causesdamage in unexpected areas (focussing <strong>of</strong> 1989’s M W 7.1 Loma Prieta earthquake wavescaused damage in San Francisco’s Marina district, some 100 km distant from the rupturingfault).• Site effects refer to how seismic waves interact with the ground surface; seismic waves slowdown in the loose sediments and weathered rock at the Earth’s surface. As they slow, theirenergy converts from speed to amplitude, which heightens shaking (amplification).Therefore, buildings on poorly consolidated and thick soils will typically see more damagethan buildings on consolidated soils and bedrock. Amplification can also occur in areas ondeep, sediment-filled basins and on ridge tops. Seismic waves can also get trapped at thesurface and reverberate (resonate). Whether resonance will occur depends on the period (thelength) <strong>of</strong> the incoming waves. Long-period seismic waves, which are created by largeearthquakes, are most likely to reverberate and cause damage in long-period structures, likebridges and high-rises. (“Long-period structures” are those that respond to long-periodwaves.) Shorter-period seismic waves, which tend to die out quickly, will most <strong>of</strong>ten causedamage fairly near the fault, and they will cause most damage in shorter-period structuressuch as one- to three-story buildings. Very short-period waves are most likely to cause nearfault,interior damage, such as to equipment.Earthquake damage also depends on the characteristics <strong>of</strong> human-made structures. The interaction<strong>of</strong> ground motion with the built environment is complex. Governing factors include a structure’sheight, construction, and stiffness, architectural design, condition, and age <strong>of</strong> the structure.2006 PAGE 6 - 8
Natural <strong>Hazard</strong>s <strong>Mitigation</strong> PlanCity <strong>of</strong> <strong>Glendale</strong>, <strong>California</strong>Section 6 – EarthquakesMap 6.2: Ground Shaking Zones in <strong>California</strong>(map shows areas <strong>of</strong> ground shaking with a 10 percent chance <strong>of</strong> exceedance in 50 years – the darkerzones can experience higher ground shaking because they are closer to active faults, and areunderlain by sediments that may amplify the effects <strong>of</strong> shaking)Liquefaction typically occurs within the upper 50 feet <strong>of</strong> the surface, when saturated, loose, fine- tomedium-grained soils (sand and silt) are present. Earthquake shaking suddenly increases pressure inthe water that fills the pores between soil grains, causing the soil to lose strength and behave as aliquid. This process can be observed at the beach by standing on the wet sand near the surf zone.Standing still, the sand will support your weight. However, when you tap the sand with your feet,water comes to the surface, the sand liquefies, and your feet sink.Liquefaction-related effects include loss <strong>of</strong> bearing strength, ground oscillations, lateral spreadingand flow failures or slumping. The excess water pressure is relieved by the ejection <strong>of</strong> materialupward through fissures and cracks. When soils liquefy, the structures built on them can sink, tilt,and suffer significant structural damage. Buildings and their occupants are at risk when the groundcan no longer support the buildings.2006 PAGE 6 - 9
Natural <strong>Hazard</strong>s <strong>Mitigation</strong> PlanCity <strong>of</strong> <strong>Glendale</strong>, <strong>California</strong>Section 6 – EarthquakesEarthquake-induced landslides and rockfalls are secondary earthquake hazards that occur fromground shaking. Gravity inexorably pulls hillsides down, and earthquake shaking enhances this ongoingprocess. Landslides and rockfalls can destroy the roads, buildings, utilities, and other criticalfacilities necessary to respond and recover from an earthquake. Many communities in southern<strong>California</strong> with steep slopes have a high likelihood <strong>of</strong> being impacted by landslides.Primary Ground Rupture Due to Fault Movement typically results in a relatively smallpercentage <strong>of</strong> the total damage in an earthquake, yet being too close to a rupturing fault can result inextensive damage. It is difficult to safely reduce the effects <strong>of</strong> this hazard through building andfoundation design. Therefore, the primary mitigation measure is to avoid active faults by settingstructures back from the fault zone. Application <strong>of</strong> this measure is subject to requirements <strong>of</strong> theAlquist-Priolo Earthquake Fault Zoning Act and guidelines prepared by the <strong>California</strong> GeologicalSurvey – previously known as the <strong>California</strong> Division <strong>of</strong> Mines and Geology.History <strong>of</strong> Earthquake Events in Southern <strong>California</strong>To better understand earthquake hazards, scientists study past earthquakes by looking at theirrecords, or by studying the effects that past earthquakes had on the ground surface and the builtenvironment. Historical earthquake records are either from the instrumental period (since about1932, when the first seismographs were deployed), or pre-instrumental. In the absence <strong>of</strong>instrumentation, the detection and record <strong>of</strong> earthquakes are based on observations and felt reports,and are dependent upon population density and distribution. Since <strong>California</strong> was sparsely populatedin the 1800s, our record <strong>of</strong> pre-instrumental earthquakes is relatively incomplete. However, twovery large earthquakes, the Fort Tejon in 1857 (M7.9) and the Owens Valley in 1872 (M7.6) areevidence <strong>of</strong> the tremendously damaging potential <strong>of</strong> earthquakes in southern <strong>California</strong>. Morerecently, two M7.3 earthquakes struck southern <strong>California</strong>, in Kern County (1952) and Landers(1992), and a M7.1 earthquake struck the Mojave Desert (Hector Mine, in 1999). The damage fromthese five large earthquakes was limited because they occurred in sparsely populated areas. Asimilarly sized earthquake closer to southern <strong>California</strong>’s population centers has the potential toplace millions <strong>of</strong> people at risk.Since seismologists started recording and measuring earthquakes, there have been tens <strong>of</strong> thousands<strong>of</strong> recorded earthquakes in southern <strong>California</strong>, most with a magnitude below 3.0. Plate H-3 (inAppendix H) shows the historical seismicity in the immediate vicinity <strong>of</strong> <strong>Glendale</strong>. The map showsthat small earthquakes, <strong>of</strong> magnitude between 1 and 3, have occurred historically in the area, but thatno moderate to large earthquakes have occurred beneath <strong>Glendale</strong> in historical times. Nevertheless,these recordings show that only the easternmost portion <strong>of</strong> southern <strong>California</strong> may be beyond thereach <strong>of</strong> a damaging earthquake. Table 6-2 lists the moderate to large historical earthquake eventsthat have affected southern <strong>California</strong>. The most significant <strong>of</strong> these events based on their felt effectsin <strong>Glendale</strong> are summarized in the next pages.2006 PAGE 6 - 10
Natural <strong>Hazard</strong>s <strong>Mitigation</strong> PlanCity <strong>of</strong> <strong>Glendale</strong>, <strong>California</strong>Section 6 – EarthquakesTable 6-2: Historical Earthquakes in the Southern <strong>California</strong> Regionwith Magnitude > 51769 Los Angeles Basin 1916 Tejon Pass Region1800 San Diego Region 1918 San Jacinto1812 Wrightwood 1923 San Bernardino Region1812 Santa Barbara Channel 1925 Santa Barbara1827 Los Angeles Region 1933 Long Beach1855 Los Angeles Region 1941 Carpinteria1857 Great Fort Tejon Earthquake 1952 Kern County1858 San Bernardino Region 1954 West <strong>of</strong> Wheeler Ridge1862 San Diego Region 1971 San Fernando1892 San Jacinto or Elsinore Fault 1973 Point Mugu1893 Pico Canyon 1986 North Palm Springs1894 Lytle Creek Region 1987 Whittier Narrows1894 San Diego Region 1992 Landers1899 Lytle Creek region 1992 Big Bear1899 San Jacinto and Hemet 1994 Northridge1907 San Bernardino region 1999 Hector Mine1910 Glen Ivy Hot SpringsLong Beach Earthquake <strong>of</strong> 1933This M w 6.4 earthquake occurred on March 10, 1933, at 5:54 in the afternoon. The location <strong>of</strong> theearthquake’s epicenter has been re-evaluated, and determined to have occurred approximately 3miles south <strong>of</strong> present-day Huntington Beach. However, it caused extensive damage in Long Beach,hence its name. The earthquake occurred on the Newport-Inglewood fault, a right-lateral strike slipfault that extends across the western portion <strong>of</strong> the Los Angeles basin. The Newport-Inglewoodfault did not rupture the surface during this earthquake, but substantial liquefaction-induced damagewas reported. The earthquake caused 120 deaths, and over $50 million in property damage (Wood,1933).Most <strong>of</strong> the damaged buildings were <strong>of</strong> unreinforced masonry, and many school buildings weredestroyed. Fortunately, children were not present in the classrooms at that time, otherwise, thedeath toll would have been much higher. This earthquake led to the passage <strong>of</strong> the Field Act, whichgave the Division <strong>of</strong> the <strong>State</strong> Architect authority and responsibility for approving design andsupervising construction <strong>of</strong> public schools. Building codes were also improved.San Fernando (Sylmar) Earthquake <strong>of</strong> 1971This M w 6.6 earthquake occurred on the San Fernando fault zone, the western-most segment <strong>of</strong> theSierra Madre fault, on February 9, 1971, at 6:00 in the morning. The surface rupture caused by thisearthquake was nearly 12 miles long, and occurred in the Sylmar-San Fernando area, just a few milesnorthwest <strong>of</strong> <strong>Glendale</strong>. The maximum slip measured at the surface was nearly 6 feet.The earthquake caused over $500 million in property damage and 65 deaths. Most <strong>of</strong> the deathsoccurred when the Veteran's Administration Hospital collapsed. Several other hospitals, includingthe Olive View Community Hospital in Sylmar suffered severe damage. Newly constructed freewayoverpasses also collapsed, in damage scenes similar to those that occurred 23 years later in the 1994Northridge earthquake. Loss <strong>of</strong> life could have been much greater had the earthquake struck at abusier time <strong>of</strong> day. Thirty-one buildings in <strong>Glendale</strong> were so severely damaged that they had to bedemolished, and approximately 3,250 masonry chimneys in the City collapsed. The total buildingloss in <strong>Glendale</strong> as a result <strong>of</strong> this earthquake was estimated at more than $2 million (Oakeshott,2006 PAGE 6 - 11
Natural <strong>Hazard</strong>s <strong>Mitigation</strong> PlanCity <strong>of</strong> <strong>Glendale</strong>, <strong>California</strong>Section 6 – Earthquakes1975). As with the Long Beach earthquake, legislation was passed in response to the damage causedby the 1971 earthquake. In this case, the building codes were strengthened and the Alquist PrioloSpecial Studies (now Earthquake Fault) Zone) Act was passed in 1972.Whittier Narrows Earthquake <strong>of</strong> 1987The Whittier Narrows earthquake occurred on October 1, 1987, at 7:42 in the morning, with itsepicenter located approximately 12 miles southwest <strong>of</strong> <strong>Glendale</strong> (Hauksson and Jones, 1989). TheM L 5.9 earthquake occurred on a previously unknown, north-dipping concealed thrust fault (blindthrust) now called the Puente Hills fault (Shaw, and Shearer, 1999). The earthquake caused eightfatalities, over 900 injured, and $358 million in property damage. Severe damage was confinedmainly to communities east <strong>of</strong> Los Angeles and near the epicenter. Areas with high concentrations<strong>of</strong> URMs, such as the "Uptown" district <strong>of</strong> Whittier, the old downtown section <strong>of</strong> Alhambra, and the"Old Town" section <strong>of</strong> Pasadena, were severely impacted. Several tilt-up buildings partiallycollapsed, including tilt-up buildings built after 1971, that were built to improved building standardsbut were <strong>of</strong> irregular configuration, revealing seismic vulnerabilities not previously recognized.Residences that sustained damage usually were constructed <strong>of</strong> masonry, were not fully anchored t<strong>of</strong>oundations, or were houses built over garages with large door openings. Many chimneys collapsedand in some cases, fell through ro<strong>of</strong>s. Wood-frame residences, in contrast, sustained relatively littledamage, and no severe structural damage to high-rise structures in downtown Los Angeles wasreported.Pasadena Earthquake <strong>of</strong> 1988The Pasadena earthquake occurred at 3:38 in the morning on December 3, 1988, directly underneaththe city <strong>of</strong> Pasadena. The M L 5.0 earthquake occurred on the Raymond fault (Hauksson and Jones,1991), and helped determine that the Raymond fault is a left-lateral strike-slip fault (prior to thisearthquake, the geological community was divided on this issue – the fault forms a well-defined scarpthat many attributed to reverse faulting). This earthquake was also notable because it was followedby an unusually small number <strong>of</strong> aftershocks, and these were <strong>of</strong> small size (the largest was only amagnitude 2.4).Sierra Madre Earthquake <strong>of</strong> 1991The Sierra Madre earthquake occurred on June 28, 1991 at 7:43 in the morning approximately 18miles northeast <strong>of</strong> <strong>Glendale</strong>. The M w 5.8 earthquake probably occurred on the Clamshell-SawpitCanyon fault, an <strong>of</strong>fshoot <strong>of</strong> the Sierra Madre fault zone in the San Gabriel Mountains (Haukson,1994). Because <strong>of</strong> its depth and moderate size, it caused no surface rupture, but it did triggerrockslides that blocked some <strong>of</strong> the local mountain roads. Roughly $40 million in property damageoccurred in the San Gabriel Valley; URM buildings were hardest hit, and many brick chimneyscollapsed. Two deaths resulted from this earthquake -- one person was killed in Arcadia, and oneperson in Pasadena died from a heart attack. In all, at least 100 others were injured, though theinjuries were mostly minor.2006 PAGE 6 - 12
Natural <strong>Hazard</strong>s <strong>Mitigation</strong> PlanCity <strong>of</strong> <strong>Glendale</strong>, <strong>California</strong>Section 6 – EarthquakesLanders and Big Bear Earthquakes <strong>of</strong> 1992On the morning <strong>of</strong> June 28, 1992, most people in southern <strong>California</strong> were awakened at 4:57 by thelargest earthquake to strike <strong>California</strong> in 40 years. Named “Landers” after a small desert communitynear its epicenter, the earthquake had a magnitude <strong>of</strong> 7.3. More than 50 miles <strong>of</strong> surface ruptureassociated with five or more faults occurred as a result <strong>of</strong> this earthquake. The average right-lateralstrike-slip displacement was about 10 to 15 feet, but a maximum <strong>of</strong> 18 feet <strong>of</strong> slip was observed.Centered in the Mojave Desert, approximately 120 miles from Los Angeles, the earthquake causedrelatively little damage for its size (Brewer, 1992). It released about four times as much energy asthe very destructive Loma Prieta earthquake <strong>of</strong> 1989, but fortunately, it did not claim as many lives(one child died when a chimney collapsed). The power <strong>of</strong> the earthquake was illustrated by thelength <strong>of</strong> the ground rupture it left behind. The earthquake ruptured 5 separate faults: JohnsonValley, Landers, Homestead Valley, Emerson, and Camp Rock faults (Sieh et al., 1993). Nearbyfaults also experienced triggered slip and minor surface rupture. There are no Modified MercalliIntensity (MMI) reports for this earthquake in the <strong>Glendale</strong> area, but in Pasadena three individualsreported MMIs <strong>of</strong> IV, and in Burbank, MMIs <strong>of</strong> IV to V were reported(http://pasadena.wr.usgs.gov/shake/ca/).The magnitude 6.4 Big Bear earthquake struck little more than 3 hours after the Landers earthquakeon June 28, 1992 at 8:05:30 A.M. PDT. This earthquake is technically considered an aftershock <strong>of</strong>the Landers earthquake (indeed, the largest aftershock), although the Big Bear earthquake occurredover 20 miles west <strong>of</strong> the Landers rupture, on a fault with a different orientation and sense <strong>of</strong> slipthan those involved in the main shock. From its aftershock, the causative fault was determined to bea northeast-trending left-lateral fault. This orientation and slip are considered “conjugate” to thefaults that slipped in the Landers rupture. The Big Bear earthquake did not break the groundsurface, and, in fact, no surface trace <strong>of</strong> a fault with the proper orientation has been found in the area.The Big Bear earthquake caused a substantial amount <strong>of</strong> damage in the Big Bear area, butfortunately, it claimed no lives. However, landslides triggered by the quake blocked roads in themountainous areas, aggravating the clean-up and rebuilding process (SCEC-DC, 2001).Northridge Earthquake <strong>of</strong> 1994The Northridge Earthquake <strong>of</strong> January 17, 1994 woke up most <strong>of</strong> southern <strong>California</strong> at 4:30 in themorning. The earthquake’s epicenter was located 20 miles to the west-northwest <strong>of</strong> downtown LosAngeles, on a previously unknown blind thrust fault now called the Northridge (or Pico) Thrust.Although moderate in size, this earthquake produced the strongest ground motions everinstrumentally recorded in North America. The M w 6.7 earthquake is one <strong>of</strong> the most expensivenatural disasters to have impacted the United <strong>State</strong>s. Damage was widespread, sections <strong>of</strong> majorfreeways collapsed, parking structures and <strong>of</strong>fice buildings collapsed, and numerous apartmentbuildings suffered irreparable damage. Damage to wood-frame apartment houses was verywidespread in the San Fernando Valley and Santa Monica areas, especially to structures with "s<strong>of</strong>t"first floor or lower-level parking garages. The high accelerations, both vertical and horizontal, liftedstructures <strong>of</strong>f <strong>of</strong> their foundations and/or shifted walls laterally. The death toll was 57, and morethan 1,500 people were seriously injured.In the <strong>Glendale</strong> area, this earthquake caused predominantly Modified Mercalli intensities <strong>of</strong> VII(http://pasadena.wr.usgs.gov/shake/ca/). High-pr<strong>of</strong>ile damage in <strong>Glendale</strong> includes the followingcases: A section <strong>of</strong> the third level above grade in the <strong>Glendale</strong> City Center parking structurecollapsed, sections <strong>of</strong> the <strong>Glendale</strong> Galleria parking structure settled 4 to 8 inches due to damage topedestals, and the <strong>Glendale</strong> Fashion Center had damage to exterior columns.Despite the losses, gains made through earthquake hazard mitigation efforts <strong>of</strong> the last two decadeswere obvious. Retr<strong>of</strong>its <strong>of</strong> masonry building helped reduce the loss <strong>of</strong> life, hospitals suffered lessstructural damage than in 1971 San Fernando earthquake, and emergency response was exemplary.2006 PAGE 6 - 13
Natural <strong>Hazard</strong>s <strong>Mitigation</strong> PlanCity <strong>of</strong> <strong>Glendale</strong>, <strong>California</strong>Section 6 – EarthquakesEarthquake <strong>Hazard</strong> AssessmentChoosing Earthquakes for Planning and DesignIt is <strong>of</strong>ten useful to create a deterministic or design earthquake scenario to study the effects <strong>of</strong> aparticular earthquake on a building or a community. Often, such scenarios consider the largestearthquake that is believed possible to occur on a fault or fault segment, referred to as the maximummagnitude earthquake (Mmax). Other scenarios consider the maximum probable earthquake(MPE) or design basis earthquake (DBE) (1997 Uniform Building Code - UBC), the earthquakewith a statistical return period <strong>of</strong> 475 years (with ground motion that has a 10 percent probability <strong>of</strong>being exceeded in 50 years). For public schools, hospitals, and other critical facilities, the <strong>California</strong>Building Code (1998) defines the Upper Bound Earthquake (UBE), which has a statistical returnperiod <strong>of</strong> 949 years and a ground motion with a 10 percent probability <strong>of</strong> being exceeded in 100years. As the descriptions above suggest, which earthquake scenario is most appropriate depends onthe application, such as the planned use, lifetime or importance <strong>of</strong> a facility. The more critical thestructure, the longer the time period used between earthquakes and the larger the design earthquakeshould be.Geologists, seismologists, engineers, emergency response personnel and urban planners typically usemaximum magnitude and maximum probable earthquakes to evaluate seismic hazard. Theassumption is that if we plan for the worst-case scenario, we establish safety margins. Then smallerearthquakes, that are more likely to occur, can be dealt with effectively.Seismic design parameters define what kinds <strong>of</strong> earthquake effects a structure must be able towithstand. These include peak ground acceleration, duration <strong>of</strong> strong shaking, and the periods <strong>of</strong>incoming strong motion waves.As is true for most earthquake-prone regions, many potential earthquake sources pose a threat to<strong>Glendale</strong>. Thus it is also important to consider the overall likelihood <strong>of</strong> damage from a plausiblesuite <strong>of</strong> earthquakes. This approach is called probabilistic seismic hazard analysis (PSHA), andtypically considers the likelihood <strong>of</strong> exceeding a certain level <strong>of</strong> damaging ground motion that couldbe produced by any or all faults within a 100-km radius <strong>of</strong> the project site, or in this case, the City.PSHA is utilized by the U.S. Geological Survey to produce national seismic hazard maps that areused by the Uniform Building Code (ICBO, 1997).Regardless <strong>of</strong> which fault causes a damaging earthquake, there will always be aftershocks. Bydefinition, these are smaller earthquakes that happen close to the mainshock (the biggest earthquake<strong>of</strong> the sequence) in time and space. These smaller earthquakes occur as the Earth adjusts to theregional stress changes created by the mainshock. The bigger the mainshock, the greater thenumber <strong>of</strong> aftershocks, the larger the aftershocks will be, and the wider the area in which they mightoccur. On average, the largest aftershock will be 1.2 magnitude units less than the mainshock. Thisis an average, and there are many cases where the biggest aftershock is larger than the averagepredicts. The key point is this: any major earthquake will produce aftershocks large enough to causeadditional damage, especially to already-weakened structures. Consequently, post-disaster responseplanning must take damaging aftershocks into account.<strong>Hazard</strong> IdentificationIn <strong>California</strong>, many agencies are focused on seismic safety issues: the <strong>State</strong>’s Seismic SafetyCommission, the Applied Technology Council, Governor’s Office <strong>of</strong> Emergency Services, United<strong>State</strong>s Geological Survey, Cal Tech, the <strong>California</strong> Geological Survey as well as a number <strong>of</strong>universities and private foundations. These organizations, in partnership with other <strong>State</strong> andFederal agencies, have undertaken a rigorous program in <strong>California</strong> to identify seismic hazards and2006 PAGE 6 - 14
Natural <strong>Hazard</strong>s <strong>Mitigation</strong> PlanCity <strong>of</strong> <strong>Glendale</strong>, <strong>California</strong>Section 6 – Earthquakesrisks including active fault identification, ground shaking, ground motion amplification, liquefaction,earthquake induced landslides, and for coastal areas, tsunami inundation zones. Seismic hazard mapshave been published and are available for many communities in <strong>California</strong> through the <strong>California</strong>Geological Survey. Some <strong>of</strong> the most significant earthquake-induced hazards with the potential toimpact the city <strong>of</strong> <strong>Glendale</strong> are described below.Seismic ShakingSeismic shaking is the seismic hazard that has the greatest potential to severely impact <strong>Glendale</strong>given the city’s proximity to several active seismic sources (faults). To give the City a betterunderstanding <strong>of</strong> the hazard posed by these faults, we performed a deterministic seismic hazardanalysis to estimate the Peak Horizontal Ground Accelerations (PHGA) that can be expected at<strong>Glendale</strong>’s City Center due to earthquakes occurring on any <strong>of</strong> the known active or potentially activefaults within 100 km (62 miles) from the city. We also conducted probabilistic seismic hazardanalyses to estimate the median PHGA at twelve different sites throughout the city. Those faultsthat, based on the ground shaking analyses described above, can cause peak horizontal groundaccelerations <strong>of</strong> about 0.1g or greater (Modified Mercalli Intensities greater than VII) in the<strong>Glendale</strong> area are listed in Table 6-3. For a map showing most <strong>of</strong> these faults, refer to Map 6-1.Those faults included in Table 6-3 that pose the greatest impact on the <strong>Glendale</strong> area, or that arethought to have a higher probability <strong>of</strong> causing an earthquake, are described in more detail in thefollowing pages.Table 6-3 shows:• The closest approximate distance, in miles and kilometers, between <strong>Glendale</strong>’s City Hall andeach <strong>of</strong> the main faults considered in the deterministic and probabilistic analyses;• the maximum magnitude earthquake (M max ) each fault is estimated capable <strong>of</strong> generating;• the intensity <strong>of</strong> ground motion, expressed as a fraction <strong>of</strong> the acceleration <strong>of</strong> gravity (g), thatcould be experienced in the <strong>Glendale</strong> area if the M max occurs on one <strong>of</strong> these faults; and• the Modified Mercalli seismic Intensity (MMI) values estimated to be felt in the City as aresult <strong>of</strong> the M max on each one <strong>of</strong> these faults.2006 PAGE 6 - 15
Natural <strong>Hazard</strong>s <strong>Mitigation</strong> PlanCity <strong>of</strong> <strong>Glendale</strong>, <strong>California</strong>Section 6 – EarthquakesTable 6-3: Estimated Horizontal Peak Ground Accelerations andSeismic Intensities in the <strong>Glendale</strong> AreaFault NameDistance to<strong>Glendale</strong>(mi)Distance to<strong>Glendale</strong>(km)Magnitude <strong>of</strong>Mmax *PGA (g)from MmaxMMI fromVerdugo
Natural <strong>Hazard</strong>s <strong>Mitigation</strong> PlanCity <strong>of</strong> <strong>Glendale</strong>, <strong>California</strong>Section 6 – EarthquakesSan Andreas Fault Zone: As discussed previously, the San Andreas fault is the principal boundarybetween the Pacific and North American plates, and as such, it is considered the “Master Fault”because it has frequent (geologically speaking), large, earthquakes, and it controls the seismic hazardin southern <strong>California</strong>. The fault extends over 750 miles (1,200 kilometers), from near CapeMendocino in northern <strong>California</strong> to the Salton Sea region in southern <strong>California</strong>. At its closestapproach, the San Andreas fault is approximately 24 miles (38 km) north <strong>of</strong> <strong>Glendale</strong>.Large faults, such as the San Andreas fault, are generally divided into segments in order to evaluatetheir future earthquake potential. The segments are generally defined at discontinuities along thefault that may affect the rupture length. In central and southern <strong>California</strong>, the San Andreas faultzone is divided into five segments named, from north to south, the Cholame, Carrizo, Mojave, SanBernardino Mountains, and Coachella Valley segments (Working Group on <strong>California</strong> EarthquakeProbabilities - WGCEP, 1995). Each segment is assumed to have a characteristic slip rate (rate <strong>of</strong>movement averaged over time), recurrence interval (time between moderate to large earthquakes),and displacement (amount <strong>of</strong> <strong>of</strong>fset during an earthquake). While this methodology has some valuein predicting earthquakes, historical records and studies <strong>of</strong> prehistoric earthquakes show that it ispossible for more than one segment to rupture during a large quake or for ruptures to overlap intoadjacent segments.The last major earthquake on the southern portion <strong>of</strong> the San Andreas fault was the 1857 Fort Tejon(Mw 7.8) event. This is the largest earthquake reported in <strong>California</strong>. The 1857 surface rupturebroke the Cholame, Carrizo, and Mojave segments, resulting in displacements <strong>of</strong> as much as 27 feet(9 meters) along the rupture zone. Peak ground accelerations in the <strong>Glendale</strong> area as a result <strong>of</strong> the1857 earthquake are estimated to have been as high as 0.18g. Rupture <strong>of</strong> these fault segments as agroup, during a single earthquake, is thought to occur with a recurrence interval <strong>of</strong> between 104 and296 years. Map 6.3 shows the seismic intensities that would be expected in the southern <strong>California</strong>areas if a repeat <strong>of</strong> the 1857 earthquake occurred.The closest segment <strong>of</strong> the San Andreas fault to <strong>Glendale</strong> is the Mojave segment, locatedapproximately 29 miles to the northeast <strong>of</strong> the City Center area. This segment is 83 miles (133 km)long, extending from approximately Three Points southward to just northwest <strong>of</strong> Cajon Creek, atthe southern limit <strong>of</strong> the 1857 rupture (WGCEP, 1995). Using a slip rate <strong>of</strong> 30±8 millimeters peryear (mm/yr) and a characteristic displacement <strong>of</strong> 4.5±1.5 meters (m), the Working Group on<strong>California</strong> Earthquake Probabilities (WGCEP, 1995) derived a recurrence interval <strong>of</strong> 150 years forthis segment. The Mojave segment is estimated to be capable <strong>of</strong> producing a magnitude 7.1earthquake, which could result in peak ground accelerations in the <strong>Glendale</strong> area <strong>of</strong> about 0.13g.The WGCEP (1995) calculated that this segment has a 26 percent probability <strong>of</strong> rupturing sometimebetween 1994 and 2024.2006 PAGE 6 - 17
Natural <strong>Hazard</strong>s <strong>Mitigation</strong> PlanCity <strong>of</strong> <strong>Glendale</strong>, <strong>California</strong>Section 6 – EarthquakesMap 6.3: Earthquake Scenario for the 1857 San Andreas Rupture ShowingEstimated Intensity Values in the Region Resulting from this EventThe next closest segment <strong>of</strong> the San Andreas fault to the City <strong>of</strong> <strong>Glendale</strong> is the Carrizo segment,located approximately 41 miles from downtown. This fault segment, which is about 75 miles (121km) long, also ruptured during the 1857 earthquake. Slip on this segment <strong>of</strong> the San Andreas faultwas greater than on either <strong>of</strong> the two other segments, averaging 6 to 7 m, and locally displaying<strong>of</strong>fsets <strong>of</strong> as much as 8 to 10 m. Several paleoseismological studies have been conducted on thissegment <strong>of</strong> the San Andreas fault. This would suggest that this segment is well understood, but thedata are <strong>of</strong>ten conflicting or inconclusive. Past earthquakes have been resolved in some trenchexposures but not in others only a few miles away, and the slip estimates for past earthquakes asdetermined from these exposures also vary. To account for and resolve these discrepancies, the 1995WGCEP used a slip rate <strong>of</strong> 34±3 mm/yr, and a slip per event <strong>of</strong> 7±4 m. The error bars on the slipper-eventdata reflect the varying measurements that have been made along the fault length for the1857 event. These values resolve into a recurrence interval <strong>of</strong> 206 (+149, -125 years). This segment2006 PAGE 6 - 18
Natural <strong>Hazard</strong>s <strong>Mitigation</strong> PlanCity <strong>of</strong> <strong>Glendale</strong>, <strong>California</strong>Section 6 – Earthquakesis thought capable <strong>of</strong> producing a magnitude 7.2 earthquake, which could result in peak groundaccelerations in the <strong>Glendale</strong> area <strong>of</strong> about 0.10g. The WGCEP (1995) also calculated an 18 percentprobability that this fault segment will generate an earthquake sometime between 1994 and 2024.The San Bernardino Mountains segment, located about 43 miles from downtown <strong>Glendale</strong>, isapproximately 49 miles (78 km) long, and extends from Cajon Creek to the San Gorgonio Pass. Thissegment is a structurally complex zone that is poorly understood, and for which there are scant dataon fault behavior. Using a slip rate <strong>of</strong> 24±5 mm/yr and a characteristic displacement <strong>of</strong> 3.5±1.0 m,the WGCEP (1995) derived a recurrence interval on this fault <strong>of</strong> 146 years. This fault segment isestimated capable <strong>of</strong> producing a magnitude 7.3 earthquake, which could result in peak groundaccelerations in <strong>Glendale</strong> <strong>of</strong> about 0.1g. If this fault segment ruptures together with the Mojave andCoachella Valley segments, higher ground motions would be expected. In 1994, the WGCEP (1995)calculated that this fault segment had a 28 percent probability <strong>of</strong> rupturing sometime in the next 30years. Since the fault has not ruptured yet, the probability that it will before the year 2024 hasincreased.Sierra Madre Fault: The Sierra Madre fault zone is a north-dipping reverse fault zoneapproximately 47 miles (75 km) long that extends along the southern flank <strong>of</strong> the San GabrielMountains from San Fernando to San Antonio Canyon, where it continues southeastward as theCucamonga fault. The Sierra Madre fault has been divided into five segments, and each segmentseems to have a different rate <strong>of</strong> activity.The northwestern-most segment <strong>of</strong> the Sierra Madre fault (the San Fernando segment) ruptured in1971, causing the M w 6.7 San Fernando (or Sylmar) earthquake. As a result <strong>of</strong> this earthquake, theSierra Madre fault has been known to be active. In the 1980s, Crook and others (1987) studied theTransverse Ranges using general geologic and geomorphic mapping, coupled with a few trenchinglocations, and suggested that the segments <strong>of</strong> the Sierra Madre fault east <strong>of</strong> the San Fernandosegment have not generated major earthquakes in several thousands <strong>of</strong> years, and possibly as long as11,000 years. By <strong>California</strong>’s definitions <strong>of</strong> active faulting, most <strong>of</strong> the Sierra Madre fault wouldtherefore be classified as not active. Then, in the mid 1990s, Rubin et al. (1998) trenched a section <strong>of</strong>the Sierra Madre fault in Altadena, at the Loma Alta Park, and determined that this segment hasruptured at least twice in the last 15,000 years, causing magnitude 7.2 to 7.6 earthquakes. Thissuggests that the Los Angeles area is susceptible to infrequent, but large near-field earthquakes onthe Sierra Madre fault. Rubin et al.’s (1998) trenching data show that during the last earthquake, thisfault trace shifted as much as 13 feet (4 meters) at the surface, and that total displacement in the lasttwo events adds to more than 34 feet (10.5 meters)!Although the fault seems to slip at a rate <strong>of</strong> only between 0.5 and 1 mm/yr (Walls et al., 1998), overtime, it can accumulate a significant amount <strong>of</strong> strain. The paleoseismic data obtained at the LomaAlta Park site were insufficient to estimate the recurrence interval and the age <strong>of</strong> the last surfacerupturingevent on this segment <strong>of</strong> the fault. However, Tucker and Dolan (2001) trenched the eastSierra Madre fault at Horsethief Canyon and obtained data consistent with Rubin et al.’s (1998)findings. At Horsethief Canyon, the Sierra Madre fault last ruptured about 8,000 to 9,000 years ago.Using a slip rate <strong>of</strong> 0.6 mm/yr and a slip per event <strong>of</strong> 5 meters, resolves into a recurrence interval <strong>of</strong>about 8,000 years. If the last event occurred more than 8,000 years ago, it is possible that thesesegments <strong>of</strong> the Sierra Madre fault are near the end <strong>of</strong> their cycle, and therefore likely to generate anearthquake in the not too distant future.Given the data presented above, and since the Sierra Madre fault extends across the northern reaches<strong>of</strong> the <strong>Glendale</strong> area, this fault poses a significant hazard to the City. The deterministic analysis forthe <strong>Glendale</strong> City Center area estimates peak ground accelerations <strong>of</strong> about 0.46g, based on a2006 PAGE 6 - 19
Natural <strong>Hazard</strong>s <strong>Mitigation</strong> PlanCity <strong>of</strong> <strong>Glendale</strong>, <strong>California</strong>Section 6 – Earthquakesmagnitude 7.0 earthquake on the segment <strong>of</strong> the Sierra Madre fault that extends through the City <strong>of</strong><strong>Glendale</strong>. A larger earthquake on this fault, <strong>of</strong> magnitude between 7.2 and 7.6, could generatesignificantly stronger peak ground accelerations, especially in the northern portion <strong>of</strong> the City.Specific losses in <strong>Glendale</strong> as a result <strong>of</strong> an earthquake on the Sierra Madre fault are discussed indetail in Section 1.9, below. If the San Fernando segment <strong>of</strong> the Sierra Madre fault ruptured, causinga magnitude 6.7 earthquake, peak ground accelerations <strong>of</strong> about 0.28g are anticipated in the southernportion <strong>of</strong> <strong>Glendale</strong>, near City Hall. As before, stronger ground accelerations would be expected inthe northern reaches <strong>of</strong> the City, closer to the fault.Elysian Park Fault: The Whittier Narrows earthquake <strong>of</strong> October 1, 1987 occurred on a previouslyunknown blind thrust fault underneath the eastern part <strong>of</strong> the Los Angeles basin. Davis et al. (1989)used oil field data to construct cross-sections showing the subsurface geology <strong>of</strong> the basin, andconcluded that the Whittier Narrows earthquake occurred on a thrust ramp they called the ElysianPark thrust fault. They modeled the Elysian Park as a shallow-angle, reverse-motion fault 6 to 10miles below the ground surface generally located between the Whittier fault to the southeast, andthe Hollywood fault to the west-northwest. Although blind thrusts do not extend to the Earth’ssurface, they are typically expressed at the surface by a series <strong>of</strong> hills or mountains. Davis et al.(1989) indicated that the Elysian Park thrust ramp is expressed at the surface by the Santa MonicaMountains, and the Elysian, Repetto, Montebello and Puente Hills.Davis et al. (1989) estimated a long-term slip rate on the Elysian Park <strong>of</strong> between 2.5 and 5.2mm/yr. Dolan et al. (1995) used a different approach to estimate a slip rate on the Elysian Park fault<strong>of</strong> about 1.7 mm/yr with a recurrence interval <strong>of</strong> about 1,475 years. Then, in 1996, Shaw and Suppere-interpreted the subsurface geology <strong>of</strong> the Los Angeles basin, proposed a new model for what theycall the Elysian Park trend, and estimated a slip rate on the thrust ramp beneath the Elysian Parktrend <strong>of</strong> 1.7±0.4 mm/yr. More recently, Shaw and Shearer (1999) relocated the main shock andaftershocks <strong>of</strong> the 1987 Whittier Narrows earthquake, and showed that the earthquake sequenceoccurred on an east-west trending buried thrust they called the Puente Hills thrust (rather than thenorthwest-trending Elysian Park thrust).Given the enormous amount <strong>of</strong> research currently underway to better characterize the blind thrustfaults that underlie the Los Angeles basin, the Elysian Park thrust fault will most likely undergoadditional significant re-interpretations. In fact, Shaw and Shearer (1999) suggest that the ElysianPark thrust fault is no longer active. However, since this statement is under consideration, and theElysian Park thrust is still part <strong>of</strong> the active fault database for southern <strong>California</strong> (CGS, previouslyCDMG, 1996), we have considered this fault as a potential seismic source in <strong>Glendale</strong>. If this faultcaused a magnitude 6.7 earthquake, it is estimated that <strong>Glendale</strong> would experience peak groundaccelerations <strong>of</strong> about 0.38g.Verdugo Fault: The Verdugo fault is a 13 to 19-mile (21 to 30 km) long, southeast-striking faultthat that extends along the northeastern edge <strong>of</strong> the San Fernando Valley, and at or near thesouthern flank <strong>of</strong> the Verdugo Mountains, through the cities <strong>of</strong> <strong>Glendale</strong> and Burbank. <strong>Web</strong>er et al.(1980) first reported southwest-facing scarps 2 to 3 meters high in the alluvial fan deposits in theBurbank and west <strong>Glendale</strong> areas, and other subsurface features indicative <strong>of</strong> faulting. <strong>Web</strong>er et al.(1980) relied on these scarps, on <strong>of</strong>fset alluvial deposits at two localities, and on a subsurfacegroundwater cascade beneath Verdugo Wash to suggest that movement on this fault is youthful, butno age estimates were provided. <strong>Web</strong>er et al. (1980) further suggested that this fault is a shallow,north-dipping reverse fault responsible for uplift <strong>of</strong> the Verdugo Mountains, and proposed that thefault zone is approximately 1 km wide. For nearly 20 years since <strong>Web</strong>er et al.’s (1980) report, theVerdugo fault was not studied, but in the last few years, recognizing the potential threat that this2006 PAGE 6 - 20
Natural <strong>Hazard</strong>s <strong>Mitigation</strong> PlanCity <strong>of</strong> <strong>Glendale</strong>, <strong>California</strong>Section 6 – Earthquakesfault poses to the Los Angeles metropolitan region, several researchers have started to investigatethis fault.Some researchers have relied on deep subsurface data, primarily oil well records and geophysical datato review the subsurface geology <strong>of</strong> the San Fernando Valley area, including the characteristics <strong>of</strong> theVerdugo fault (Tsutsumi and Yeats, 1999; Langenheim et al., 2000; Pujol et al., 2001). Results <strong>of</strong>these studies suggest that the Verdugo fault changes in character from a reverse fault adjacent to thePacoima Hills, near its northwestern terminus, to a normal fault at the southwest edge <strong>of</strong> theVerdugo Mountains. To the north, the Verdugo fault appears to merge with both the Mission Hillsand Northridge Hills faults. To the south, the fault is on trend with the Eagle Rock fault, but it isstill unclear whether these faults are connected. Vertical separation on the Verdugo fault is at least1,000 meters (3,300 feet), based on the structural relief between the valley floor and the crest <strong>of</strong> theVerdugo Mountains and other indicators (Tsutsumi and Yeats, 1999). Even though some <strong>of</strong> the datasuggest that the Verdugo fault is a reverse fault, there are several researchers who now propose thatthe Verdugo fault is a left-lateral strike-slip fault (Walls et al., 1998; Dolan, personal communication,2002).Other investigators have taken a more direct, hands-on approach to study this fault, but findinglocations suitable for trenching has been difficult in the extensively developed San Fernando Valley.Dolan and Tucker (1999) tried to better define the location and recency <strong>of</strong> activity <strong>of</strong> the Verdug<strong>of</strong>ault by conducting geological and geophysical studies across the inferred trace <strong>of</strong> the fault in BrandPark. They used closely spaced boreholes drilled in a line perpendicular to the trend <strong>of</strong> the fault, andground penetrating radar to look for stratigraphic anomalies that could be suggestive <strong>of</strong> faulting.They identified one possible anomaly that could be the Verdugo fault and excavated a trench acrossthe suspect area. However, the sediments exposed in the trench were too friable to maintain thetrench open long enough to conduct their study. Dolan and Tucker believe that they did locate afault, but they are uncertain about whether or not the fault is a recent strand <strong>of</strong> the Verdugo fault.Realizing that the Brand Park site may not yield any additional, useful information, Dolan andTucker (1999) shifted their attention to another potential trenching site, at Palm Park in Burbank.Unfortunately, their studies at Palm Park were equally unsuccessful at locating and characterizingthis fault (Dolan, personal communication, 2002).Slip rate on the Verdugo fault is poorly constrained, and currently estimated at about 0.5 mm/yr(CDMG, 1996). The fault’s recurrence interval is unknown; however, the fault’s southern segment isthought to have ruptured during the Holocene, and the fault is therefore considered active (Jennings,1994). Based on its length, the Verdugo fault is thought capable <strong>of</strong> generating magnitude 6.0 to 6.8earthquakes. A magnitude 6.7 earthquake on this fault would generate peak ground accelerations inthe <strong>Glendale</strong> area <strong>of</strong> about 0.6g to 0.7g, with intensities as high as X (see Map 6.4). Higheraccelerations can be expected locally. Given the high accelerations that this fault is estimated capable<strong>of</strong> generating in <strong>Glendale</strong>, an earthquake scenario on this fault was modeled for loss estimationpurposes.Map 6.4: Scenario for a M6.7 Earthquake on the Verdugo FaultShowing Estimated Intensity Values in the Region Resulting from this Event2006 PAGE 6 - 21
Natural <strong>Hazard</strong>s <strong>Mitigation</strong> PlanCity <strong>of</strong> <strong>Glendale</strong>, <strong>California</strong>Section 6 – EarthquakesHollywood Fault: The Hollywood fault is the eastern 9-mile (14 km) long segment <strong>of</strong> the SantaMonica – Hollywood fault system that forms the southern margin <strong>of</strong> the Santa Monica Mountains(locally known as the Hollywood Hills). It has also been considered the westward extension <strong>of</strong> theRaymond fault. From east to west, the fault traverses the Hollywood section <strong>of</strong> Los Angeles, and thecities <strong>of</strong> West Hollywood and Beverly Hills. Its eastern end is mapped immediately south <strong>of</strong><strong>Glendale</strong>’s southern boundary (see Map 6-1 and Plate H-4). Movement on the Hollywood fault overgeologic time is thought responsible for the growth <strong>of</strong> the Hollywood Hills, which is why earlierresearchers characterized this fault as a northward-dipping reverse fault. However, recent studies byDolan et al. (1997, 2000a) and Tsutsumi et al. (2001) show that the Hollywood fault is primarily aleft-lateral strike-slip fault. A lateral component <strong>of</strong> movement on this fault is consistent with itslinear trace and steep, 80- to 90-degree dips (reverse faults typically have irregular, arcuate tracesand shallow dips).2006 PAGE 6 - 22
Natural <strong>Hazard</strong>s <strong>Mitigation</strong> PlanCity <strong>of</strong> <strong>Glendale</strong>, <strong>California</strong>Section 6 – EarthquakesThe Santa Monica – Hollywood fault system has not produced any damaging historical earthquakes,and it has had only relatively minor microseismic activity. Subsurface studies by Dolan et al. (2000a)suggest that the Hollywood fault moves infrequently. The most recent surface-rupturing earthquakeon this fault appears to have occurred 7,000 to 9,500 years ago, and another earthquake appears tohave occurred in the last 10,000 to 22,000 years (Dolan et al., 2000a). These data suggest that thefault either has a slow rate <strong>of</strong> slip (<strong>of</strong> between 0.33 and 0.75 mm/yr), or that it breaks in largemagnitudeevents. Interestingly, the recent past history <strong>of</strong> earthquakes on the Hollywood fault isremarkably similar to that <strong>of</strong> the Sierra Madre fault. Paleoseismologists are currently researchingthe possibility that earthquakes on the Sierra Madre fault trigger rupture <strong>of</strong> the Santa Monica –Hollywood fault system. If this is the case, then large earthquakes in the Los Angeles region maycluster in time, releasing a significant amount <strong>of</strong> strain over a geologically short time period,followed by lengthy periods <strong>of</strong> seismic quiescence.Based on its length, the Hollywood fault is thought capable <strong>of</strong> generating a Mw ~6.4 to 6.6earthquake. A conservative magnitude 6.4 earthquake on the Hollywood fault is thought capable <strong>of</strong>generating peak ground accelerations <strong>of</strong> about 0.55g in <strong>Glendale</strong>, near City Hall. Even higheraccelerations, <strong>of</strong> as much as 0.7g can be expected along the southernmost portion <strong>of</strong> the City, nearthe eastern end <strong>of</strong> the fault.Raymond Fault: The Raymond (or Raymond Hills) fault is a left-lateral, strike-slip fault about 13miles (20 km) long that extends across the San Gabriel Valley, along the eastern and southernmargins <strong>of</strong> Pasadena, and through the northern reaches <strong>of</strong> Arcadia, San Marino and South Pasadena.The westernmost portion <strong>of</strong> the Raymond fault is mapped just south <strong>of</strong> the City <strong>of</strong> <strong>Glendale</strong> (seeMap 6.1 and Plate H-4). The fault produces a very obvious south-facing scarp along much <strong>of</strong> itslength, which led many geologists to favor reverse-slip as the predominant sense <strong>of</strong> fault motion.However, left-deflected channels, shutter-ridges, sag ponds, and pressure ridges indicate that theRaymond fault is predominantly a left-lateral strike-slip fault. This sense <strong>of</strong> motion is confirmed bythe seismological record, especially by the mainshock and aftershock sequence to the 1988 Pasadenaearthquake <strong>of</strong> local magnitude (M L ) 5.0 that probably occurred on this fault (Jones et al., 1990;Hauksson and Jones, 1991). Investigators have suggested that the Raymond fault transfers slipsouthward from the Sierra Madre fault zone to other fault systems (Walls et al., 1998).The Raymond fault was recently trenched in San Marino, at the Los Angeles Arboretum in Arcadia(Weaver and Dolan, 2000), and in eastern Pasadena (Dolan et al., 2000b) where significant data onthe recent history <strong>of</strong> this fault were collected. These studies indicate that the most recent surfacerupturingearthquake on this fault occurred 1,000 to 2,000 years ago, and that between three and fiveearthquakes occurred on this fault between 41,500 and 31,500 years ago. This suggests that thefault either breaks in cluster earthquakes, or that several more surface-rupturing earthquakes haveoccurred on this fault that were not detected in the trenches. Proposed slip rates on the fault varyfrom a minimum <strong>of</strong> 1.5 mm/yr (Weaver and Dolan, 2000) to 4 (+1, -0.5) mm/yr (Marin et al., 2000;Dolan et al., in review). Weaver and Dolan (2000) also suggest an average recurrence interval forthis fault <strong>of</strong> about 3,000 years.Map 6.5: Earthquake Scenario for a M6.5 Earthquake on the Raymond FaultShowing Estimated Intensity Values in the Region Resulting from this Event2006 PAGE 6 - 23
Natural <strong>Hazard</strong>s <strong>Mitigation</strong> PlanCity <strong>of</strong> <strong>Glendale</strong>, <strong>California</strong>Section 6 – EarthquakesA conservative magnitude 6.5 earthquake on the Raymond fault would generate peak groundaccelerations in the <strong>Glendale</strong> area <strong>of</strong> about 0.55g and seismic intensities in the VII to X range (seeTable 6-3 and Map 6.5). However, the paleoseismic data suggest that this fault is capable <strong>of</strong>generating larger earthquakes, in the 7.0 magnitude range (Dolan et al., 2000b). If this is the case,stronger ground shaking as a result <strong>of</strong> an earthquake on this fault could be experienced in <strong>Glendale</strong>.Primary Fault RupturePrimary fault rupture refers to fissuring and <strong>of</strong>fset <strong>of</strong> the ground surface along a rupturing faultduring an earthquake. Primary ground rupture typically results in a relatively small percentage <strong>of</strong>the total damage in an earthquake, but being too close to a rupturing fault can cause severe damageto structures. Development constraints within active fault zones were implemented in 1972 withpassage <strong>of</strong> the <strong>California</strong> Alquist-Priolo Earthquake Fault Zoning Act. This law prohibits the2006 PAGE 6 - 24
Natural <strong>Hazard</strong>s <strong>Mitigation</strong> PlanCity <strong>of</strong> <strong>Glendale</strong>, <strong>California</strong>Section 6 – Earthquakesconstruction <strong>of</strong> new habitable structures astride an active fault and requires special geologic studiesto locate, and evaluate whether a fault has ruptured the ground surface in the last about 11,000 years.If an active fault is encountered, structural setbacks from the fault are defined.In the <strong>Glendale</strong> vicinity, the CGS has identified the Rowley fault (a section <strong>of</strong> the Sierra Madre fault)and the Raymond fault as sufficiently active and well defined to require zoning under the guidelines<strong>of</strong> the Alquist-Priolo Earthquake Fault Zoning Act. The Alquist-Priolo zones designated by theCGS for these faults are shown on Plate H-4 in Appendix H. Only the Rowley fault zone extendsinto the city <strong>of</strong> <strong>Glendale</strong> proper, so the Raymond fault is not discussed further below. Other faultsthat have been mapped in <strong>Glendale</strong> but have not been zoned by the <strong>California</strong> Geological Survey arediscussed in more detail below.The Rowley fault is the first segment <strong>of</strong> the Sierra Madre fault to the east <strong>of</strong> the fault traces thatruptured the ground surface during the 1971 Sylmar earthquake (see Plate H-4; the Lakeview fault isthe easternmost fault that ruptured the surface in 1971. The Sunland fault to the north did notbreak, but extensive landsliding occurred in the Sunland fault area in response to movement on theLakeview fault). Where the Rowley fault has been mapped in the town <strong>of</strong> Tujunga, it consists <strong>of</strong> atleast three fault planes in a zone <strong>of</strong> brecciated granodiorite that is thrust over very coarseconglomerate and basalt flows. In <strong>Glendale</strong>, the Rowley fault has been mapped as a single strand thatbifurcates at its eastern end, near Ward Canyon (see Plate H-4). The fault has been well located asevidenced by a single solid line on the map. Farther to the east, the fault is not as well defined and istherefore not currently zoned under the Alquist-Priolo Act criteria.Geologic studies conducted soon after the 1971 earthquake suggested that the last rupture on theSan Fernando segment <strong>of</strong> the Sierra Madre fault prior to 1971 had occurred less than 200 yearsbefore (Bonilla, 1973). However, a more recent trenching study in the immediate vicinity <strong>of</strong> Bonilla’strench suggests that this fault has only broken twice in the last 3,500 to 4,000 years, including the1971 rupture (Fumal et al., 1995), which suggests this fault has a recurrence interval <strong>of</strong> about 2,000years rather than 200 years. Nevertheless, the San Fernando segment appears to be more activethan other segments <strong>of</strong> the Sierra Madre fault, as first suggested by Crook et al. (1987), whoproposed that the rest <strong>of</strong> the fault zone has not moved in many thousands <strong>of</strong> years, possibly sincebefore the Holocene. Relatively recent trenching studies by Rubin et al. (1998) in Altadena,approximately 6 miles to the southeast <strong>of</strong> <strong>Glendale</strong>, have shown that the segment <strong>of</strong> the SierraMadre fault through Altadena, and possibly through <strong>Glendale</strong>, has a long recurrence interval, butthat it has moved in the Holocene and is therefore active. The segment <strong>of</strong> fault that Rubin et al.(1998) trenched has ruptured the ground surface twice in the last about 15,000 years, with the mostrecent earthquake having occurred probably 8,000 to 9,000 years ago. Other studies farther to thesoutheast, at Horsethief Canyon in the San Dimas area, also showed that this section <strong>of</strong> the SierraMadre fault has not broken in the last 8,000 years, but that the fault has slipped as much as 46 feet(14 m) between 8,000 and 24,000 years ago (Tucker and Dolan, 2001). These two studies suggestthat the central segments <strong>of</strong> the Sierra Madre fault, between the San Fernando segment on the northand the Cucamonga fault on the south, ruptures at the same time in infrequent but large magnitude(M>7) events.Based on the data presented above, the section <strong>of</strong> the Rowley fault not currently zoned by the <strong>State</strong>should nevertheless be considered active. A fault hazard management zone that includes and extendsbeyond the inferred traces <strong>of</strong> the fault is proposed in the City’s Safety Element <strong>of</strong> the General Plan.Geologic studies similar in scope to those required by the CGS in Alquist-Priolo Earthquake FaultZones should be conducted if new development or redevelopment is proposed in the fault hazardmanagement zone. As detailed geological investigations are conducted, the location and activitystatus (some <strong>of</strong> the splays may be proven to have not moved within the last 11,000 years) <strong>of</strong> the2006 PAGE 6 - 25
Natural <strong>Hazard</strong>s <strong>Mitigation</strong> PlanCity <strong>of</strong> <strong>Glendale</strong>, <strong>California</strong>Section 6 – Earthquakesfaults shown on Plate H-4 may be refined or modified. The map should be amended as new databecome available and are validated.The Mt. Lukens fault is a west- to northwest-trending thrust fault that extends across the southflank <strong>of</strong> the San Gabriel Mountains, between Haynes Canyon on the northwest, and the Los AngelesCrest Highway on the southeast. In the <strong>Glendale</strong> area, the fault is mapped about 1,500 feet to thenorth <strong>of</strong> the Sierra Madre fault. Because <strong>of</strong> its closeness to the Sierra Madre fault, Smith (1978)previously mapped this fault as part <strong>of</strong> the Sierra Madre fault system. The fault was mapped morerecently by Crook et al. (1987), and Dibblee (1991a, 1991b, 2002). Although the Mt. Lukens thrustfault appears to be a separate fault system, in the <strong>Glendale</strong> area this fault is so close to the SierraMadre fault that if the Sierra Madre fault ruptured, it could trigger co-seismic movement on the Mt.Lukens thrust fault. Therefore, a fault hazard management zone for critical facilities is hereinproposed for the Mt. Lukens fault.The Verdugo Canyon – La Tuna Canyon fault is oriented in a northwesterly direction through<strong>Glendale</strong>, where it inferred at the base <strong>of</strong> the northeast flank <strong>of</strong> the Verdugo Mountains, but changesto a more westerly orientation in the La Tuna Canyon, where the fault reportedly controls thelocation <strong>of</strong> the drainage. This fault was proposed by geologists from the Metropolitan WaterDistrict (as mentioned in Envicom, 1975), who indicated that the fault is north-dipping in the LaTuna Canyon, and south-dipping farther east. The fault was also inferred under the Verdugo Wash,where a deep, northwest-trending depression in the basement rocks has been reported (<strong>California</strong><strong>State</strong> Water Rights Board, 1962 as discussed in Envicom, 1975). The sections <strong>of</strong> the fault describedabove are not recognized by Dibblee (1991a, 1991b) in his geologic maps <strong>of</strong> the area, but farther tothe east, in the San Rafael Hills, Dibblee maps a fault that is consistent with Byer’s (1968) mapping.Farther to the east, the fault appears to swing to the east, where it may join the Sycamore Canyonfault (see Plate H-4). There are no data available to suggest that this fault is active; Envicom (1975)indicate that the fault is not a barrier to groundwater flow in the Verdugo Wash area, and shouldtherefore be considered inactive.The Sycamore Canyon fault zone consists <strong>of</strong> a series <strong>of</strong> discontinuous faults that trendnortheasterly in the vicinity <strong>of</strong> Sycamore Canyon, in the western part <strong>of</strong> the San Rafael Hills. Byer(1968) extended this fault zone westward across and along the north side <strong>of</strong> Sycamore Canyon, butmore recent geologic maps <strong>of</strong> the area (Dibblee, 1989b) do not show this trace (see Plate 1-2).Although the presence <strong>of</strong> sheared clays along a portion <strong>of</strong> the fault, in the eastern San Rafael Hills,has contributed to some slope instability problems, <strong>Web</strong>er (1980) reported that no evidence that thefault zone is active has been found. <strong>Web</strong>er (1980) also suggested that topographic lineamentsobserved in the northeastern San Rafael Hills (within Pasadena) might be an extension <strong>of</strong> theSycamore Canyon fault. This connection has not been proven out by field evidence. However,<strong>Web</strong>er’s (1980) lineaments coincide with lineaments in the younger alluvial fan deposits in thePasadena area mapped by Rubin (1992) that may be the surface expression <strong>of</strong> the most recentlyactive traces <strong>of</strong> the Sierra Madre fault. Therefore, in the Pasadena area, the Sycamore Canyon faulthas been zoned, with geological studies required in this zone if the proposed development is a criticalfacility. A similar approach is recommended for the southwest-trending section <strong>of</strong> the SycamoreCanyon fault that extends through the San Rafael Hills in the <strong>Glendale</strong> area. Even if the fault is notactive, the sheared clays that have been reported along the fault zone may be highly expansive. If astructure is built across the surface trace <strong>of</strong> these clays, and these clays swell when wetted, thestructure could experience some structural damage. Engineered mitigation measures such as deepremovals along the clay zone and replacement with non-expansive materials may be warranted.The Verdugo fault strikes southeasterly across the southern edge <strong>of</strong> the Verdugo Mountains,through the central portion <strong>of</strong> <strong>Glendale</strong>, and across the foot <strong>of</strong> the San Rafael Hills, where it seems tomerge with the Eagle Rock fault. The Verdugo fault separates the plutonic and metamorphic rocks2006 PAGE 6 - 26
Natural <strong>Hazard</strong>s <strong>Mitigation</strong> PlanCity <strong>of</strong> <strong>Glendale</strong>, <strong>California</strong>Section 6 – Earthquakesthat crop out in the Verdugo Mountains from the alluvial fan deposits to the southwest. The fault isprobably coincident with the sharp break in slope along the southwestern edge <strong>of</strong> the VerdugoMountains, where many <strong>of</strong> the alluvial fans that emanate from the mountains merge together to formthe gently southwest-facing alluvial surface between the mountains and the Los Angeles River. Inolder aerial photographs <strong>of</strong> the area, Dolan and Tucker (1999) interpreted several small scarps thatcould represent the last surface rupturing event on this fault, but these scarps have all beenobliterated by development. In fact, the inferred trace <strong>of</strong> the Verdugo fault is covered with buildingsand roads along almost its entire length, which makes it difficult to find suitable field study areaswhere the fault can be exposed and studied.To date, there has been only one study in <strong>Glendale</strong> that attempted to locate and date the most recentsurface rupturing events on this fault. This study, conducted in Brand Park (Dolan and Tucker,1999) may have constrained the location <strong>of</strong> the fault zone in the area, but the actual fault trace couldnot be identified due to the discontinuous nature <strong>of</strong> the alluvial fan deposits that they encountered,and because the trench excavated was too unstable to be entered safely. Dolan and Tucker (1999)proposed that the trace <strong>of</strong> the Verdugo fault in this area is approximately 300 feet (90 m) farther tothe north <strong>of</strong> where it is inferred by Dibblee (1991), extending in a southeasterly direction throughthe area between the Tea House and the Dr.’s House at Brand Park. Unfortunately, Dolan andTucker (1999) could not confirm the fault location elsewhere due to landscaping and previousground surface modifications at the park (for parking lots and playing fields) that precluded thepossibility <strong>of</strong> excavating another trench.Previous investigators (Byer, 1968) also identified a wide zone <strong>of</strong> faulting farther to the north thatconsists <strong>of</strong> laterally discontinuous fault planes that generally dip to the northeast. Locally, theyobserved minor shearing <strong>of</strong> the terrace deposits, which suggested to them relatively youthfulmovement on the fault. This zone <strong>of</strong> faulting is identified in Plate H-4 with cross-hatchures. Thiszone <strong>of</strong> faulting may not be the most recent fault trace, but there are insufficient data to determinewhether or not these faults are active. Therefore, this fault zone should be investigated in the futureif development is proposed in the area.Although the most recently active traces <strong>of</strong> the Verdugo fault are not well located, mostinvestigators agree that the Verdugo fault is active and therefore has the potential to generate futuresurface-rupturing earthquakes. Earlier investigators suggested that this fault is primarily a thrustfault, responsible for uplift <strong>of</strong> the Verdugo Mountains (R.T. Frankian & Associates, 1968; <strong>Web</strong>er etal., 1980; <strong>Web</strong>er, 1980), but more recently, it is thought that the fault displays primarily left-lateralstrike-slip movement (Walls et al., 1998; Dolan, personal communication, 2002). A fault hazardmanagement zone that includes the inferred trace <strong>of</strong> the fault as mapped by Dibblee (1991), but iswider to the north, to include the break in slope and the zone <strong>of</strong> faulting mapped by Byer (1968) isproposed. As with the fault hazard management zone for the Rowley fault, geological studies shouldbe conducted for sites within the Verdugo fault hazard management zone if new development orsignificant redevelopment is proposed.The Eagle Rock fault crosses the southwestern part <strong>of</strong> Pasadena and the northernmost portion <strong>of</strong>Los Angeles, including along a 2-mile stretch <strong>of</strong> the Ventura (134) Freeway, where it separatescrystalline bedrock on the north from sedimentary rock on the south (see Plates H-2 and H-4). Theportion <strong>of</strong> the Eagle Rock fault east <strong>of</strong> the San Rafael Hills was originally termed the “San Rafaelfault” by <strong>Web</strong>er (1980), who suggested the fault was active in late Quaternary time. This conclusionwas based on the presence <strong>of</strong> linear topographic features across the Pleistocene alluvial fan surfaceeast <strong>of</strong> the San Rafael Hills. Farther to the southeast, the fault appears to join the Raymond fault,however the exact location <strong>of</strong> the eastern terminus <strong>of</strong> the Eagle Rock fault is not well defined, and itsgeomorphology in this area is much more subdued than that <strong>of</strong> the Raymond fault. Consequently,Weaver and Dolan (2000) concluded that a connection with the Raymond fault could not be2006 PAGE 6 - 27
Natural <strong>Hazard</strong>s <strong>Mitigation</strong> PlanCity <strong>of</strong> <strong>Glendale</strong>, <strong>California</strong>Section 6 – Earthquakesestablished with certainty. To the west, the Eagle Rock fault lies on trend with the Verdugo fault,although in the subsurface, based on gravity data, <strong>Web</strong>er (1980) suggests that there may be a step orbend between the two fault zones. Although very little is known about the Eagle Rock fault, giventhat it appears to be related to active faults in the area, such as the Verdugo fault, it should beconsidered potentially active, subject to further study. For example, although the Eagle Rock faultmay not be capable <strong>of</strong> generating an earthquake, it may break co-seismically with movement on theVerdugo fault. A fault hazard management zone for this fault has been recommended in the Pasadenaarea, similar to that for the Sierra Madre and Verdugo faults. Extension <strong>of</strong> this zone betweenPasadena and <strong>Glendale</strong> is recommended, but the limits <strong>of</strong> this zone are predominantly outside theCity <strong>of</strong> <strong>Glendale</strong>.The Scholl Canyon faults were mapped by Byer (1968), and Envicom (1975) suggested that thisfault zone connects the Verdugo fault in the west to the Eagle Rock fault in the east. However, morerecent mapping by Dibblee (1989b) does not even show these faults, and there are no data availableto indicate that these fault traces, if even present, are active.The York Boulevard fault is a short, northeast trending fault first mapped by Lamar (1970), andmore recently by Dibblee (1989a, 1989b) in the Adams Hill area <strong>of</strong> southern <strong>Glendale</strong>. According toLamar (1970) the fault does not <strong>of</strong>fset older, Pleistocene-age deposits, and is therefore not active.However, the York Boulevard fault does appear to separate the Raymond fault from the Hollywoodfault, in an area where according to <strong>Web</strong>er (1980) there is step or bend in the fault zones at depth.Alternatively, the York Boulevard fault may be the eastern extension <strong>of</strong> the Hollywood fault. Basedon these relationships, and given that both the Raymond and Hollywood faults are active, Envicom(1975) suggested that the York Boulevard fault may be active also. Given its length, the YorkBoulevard fault is not likely to generate an earthquake, but it may move co-seismically with anearthquake on the Hollywood fault. Therefore, a hazard management zone for this fault is proposed,where geological studies to locate and characterize the fault would be required prior to development<strong>of</strong> a critical facility.The eastern terminus <strong>of</strong> the Hollywood fault has been mapped along the southwesternmost corner<strong>of</strong> the City <strong>of</strong> <strong>Glendale</strong> (see Map 6.1 and Plate H-4). This fault has been shown to be active in theLos Angeles and West Hollywood areas, where recently obtained data indicate that this fault breaksin infrequent, but large magnitude earthquakes. In the West Hollywood area, the inferred location <strong>of</strong>the fault along Sunset Boulevard has been proven to be incorrect; the fault is farther south, in thevalley. However, in the Los Angeles area, the fault does appear to be at the mountain front. Thefault has been well located in the Hollywood Hills, just to the west <strong>of</strong> <strong>Glendale</strong>, by Yerkes (1967) andDibblee (1991b), but as it extends across the Los Angeles River and into the <strong>Glendale</strong> area, itslocation is less well defined. Given that this fault is considered active, the inferred location <strong>of</strong> thefault in <strong>Glendale</strong> is herein included in a fault hazard management zone. Because <strong>of</strong> its location in thefloodplain <strong>of</strong> the Los Angeles River, where shallow ground water and deep Holocene sediments areanticipated, geologic studies to locate this fault may prove to be difficult and expensive, requiring theuse <strong>of</strong> deep boreholes rather than trenching.A few other minor, unnamed faults have been mapped both in the San Rafael Hills and in theVerdugo Mountains (see Plate H-4). These faults appear to be confined to the older bedrock units,with no impact on the younger terrace and alluvial deposits, and are therefore not considered active.Fault hazard management zones for these faults are not considered warranted, however, geologistsstudying these areas should continue to look for evidence <strong>of</strong> Holocene movement on these faults. Asnew data are developed and verified by third-party reviewers, Plate H-4 should be amended to reflectany changes in the location, recency <strong>of</strong> activity and need for future studies on these faults.2006 PAGE 6 - 28
Natural <strong>Hazard</strong>s <strong>Mitigation</strong> PlanCity <strong>of</strong> <strong>Glendale</strong>, <strong>California</strong>Section 6 – EarthquakesLiquefaction and Related Ground FailureLiquefaction is a geologic process that causes various types <strong>of</strong> ground failure. Liquefaction typicallyoccurs in loose, saturated sediments primarily <strong>of</strong> sandy composition, in the presence <strong>of</strong> groundaccelerations over 0.2g (Borchardt and Kennedy, 1979; Tinsley and Fumal, 1985). Whenliquefaction occurs, the sediments involved have a total or substantial loss <strong>of</strong> shear strength, andbehave like a liquid or semi-viscous substance. Liquefaction can cause structural distress or failuredue to ground settlement, a loss <strong>of</strong> bearing capacity in the foundation soils, and the buoyant rise <strong>of</strong>buried structures. The excess hydrostatic pressure generated by ground shaking can result in theformation <strong>of</strong> sand boils or mud spouts, and/or seepage <strong>of</strong> water through ground cracks.As indicated above, there are three general conditions that need to be met for liquefaction to occur.The first <strong>of</strong> these – strong ground shaking <strong>of</strong> relatively long duration - can be expected to occur inthe <strong>Glendale</strong> area as a result <strong>of</strong> an earthquake on any <strong>of</strong> several active faults in the region. Thesecond condition - loose, or unconsolidated, recently deposited sediments consisting primarily <strong>of</strong>silty sand and sand - occurs along the Verdugo Wash and the lower reaches <strong>of</strong> its tributaries, and inthe alluvial plain south <strong>of</strong> the Verdugo Mountains and the San Rafael Hills. Young alluvial sedimentshave also been mapped in the area between the San Gabriel and Verdugo Mountains, in the northernportion <strong>of</strong> the city, but close to the San Gabriel Mountains these sediments are coarser grained andmay therefore not be susceptible to liquefaction. Alluvial sediments have also been mapped in thecanyons emanating from the San Rafael Hills, such as Scholl and Sycamore canyons. The thirdcondition – water-saturated sediments within about 50 feet <strong>of</strong> the surface – has been known to occurhistorically only in the Verdugo Wash north <strong>of</strong> surface projection <strong>of</strong> the Verdugo fault, and in thefloodplain <strong>of</strong> the Los Angeles River. Therefore, these are the areas with the potential to experiencefuture liquefaction-induced ground displacements. The areas are shown on Plate H-5, and arediscussed further below.The Verdugo fault appears to cause a step or series <strong>of</strong> steps in the ground water surface, withgroundwater levels consistently lower on the south side <strong>of</strong> the fault zone. Brown (1975) indicatedthat these steps in the groundwater surface are due to <strong>of</strong>fsets in the bedrock surface at depth alongthe fault zone, but that no surface evidence <strong>of</strong> a fault forming groundwater barrier has been found inthe area. Nevertheless, a barrier to groundwater must be present in this area to cause the water onthe north side <strong>of</strong> the fault zone to rise to within 50 feet <strong>of</strong> the ground surface. Although not mapped,shallow groundwater conditions may occur locally in those sections <strong>of</strong> the south-flowing canyonsemanating from the Verdugo Mountains that are located north <strong>of</strong> the Verdugo fault zone. Groundwater may be perched on top <strong>of</strong> the bedrock surface, and ponded behind the fault zone. Since thebedrock that forms these mountains weathers to sand-sized particles, some <strong>of</strong> the canyons maycontain sediments susceptible to liquefaction. The potential for these areas to liquefy should beevaluated on a case-by-case basis.The San Fernando Valley narrows to essentially a point in the area <strong>of</strong> <strong>Glendale</strong> between theVerdugo Mountains to the north, and the Hollywood Hills to the south, in the area where the LosAngeles River veers to the south. Due to this constriction, or reduction in the cross-sectional area<strong>of</strong> the water-bearing section <strong>of</strong> the valley, the ground water rises. Historically the ground water inthis area has risen to within less than 50 feet <strong>of</strong> the ground surface. As a result, this portion <strong>of</strong> thebasin, which is underlain by unconsolidated, young sediments, is susceptible to liquefaction. PlateH-5 shows those areas <strong>of</strong> <strong>Glendale</strong> that the <strong>California</strong> Geological Survey (CDMG, 1999) hasidentified as susceptible to liquefaction based on an extensive database <strong>of</strong> boreholes andgroundwater levels measured in wells. Areas near existing stream channels, such as Verdugo Washand the Los Angeles River, are thought to be especially vulnerable to liquefaction as indicated byprevious events: Much <strong>of</strong> the liquefaction-related ground failure in the city <strong>of</strong> Simi Valley duringthe Northridge earthquake was concentrated near the Arroyo Simi. A study by the CGS found thatmost <strong>of</strong> the property damage occurred in poorly engineered fills placed over the natural, pre-2006 PAGE 6 - 29
Natural <strong>Hazard</strong>s <strong>Mitigation</strong> PlanCity <strong>of</strong> <strong>Glendale</strong>, <strong>California</strong>Section 6 – Earthquakesdevelopment channels <strong>of</strong> the Arroyo Simi, where ground water is very shallow (Barrows et al.,1994).The types <strong>of</strong> ground failure typically associated with liquefaction are explained below.Lateral Spreading - Lateral displacement <strong>of</strong> surficial blocks <strong>of</strong> soil as the result <strong>of</strong> liquefaction in asubsurface layer is called lateral spreading. Even a very thin liquefied layer can act as a hazardousslip plane if it is continuous over a large enough area. Once liquefaction transforms the subsurfacelayer into a fluid-like mass, gravity plus inertial forces caused by the earthquake may move the massdownslope towards a cut slope or free face (such as a river channel or a canal). Lateral spreadingmost commonly occurs on gentle slopes that range between 0.3° and 3°, and can displace the groundsurface by several meters to tens <strong>of</strong> meters. Such movement damages pipelines, utilities, bridges,roads, and other structures. During the 1906 San Francisco earthquake, lateral spreads withdisplacements <strong>of</strong> only a few feet damaged every major pipeline. Thus, liquefaction compromised SanFrancisco’s ability to fight the fires that caused about 85 percent <strong>of</strong> the damage (Tinsley et al., 1985).Flow Failure - The most catastrophic mode <strong>of</strong> ground failure caused by liquefaction is flow failure.Flow failure usually occurs on slopes greater than 3°. Flows are principally liquefied soil or blocks <strong>of</strong>intact material riding on a liquefied subsurface. Displacements are <strong>of</strong>ten in the tens <strong>of</strong> meters, but infavorable circumstances, soils can be displaced for tens <strong>of</strong> miles, at velocities <strong>of</strong> tens <strong>of</strong> miles perhour. For example, the extensive damage to Seward and Valdez, Alaska, during the 1964 GreatAlaskan earthquake was caused by submarine flow failures (Tinsley et al., 1985).Ground Oscillation - When liquefaction occurs at depth but the slope is too gentle to permit lateraldisplacement, the soil blocks that are not liquefied may separate from one another and oscillate onthe liquefied zone. The resulting ground oscillation may be accompanied by the opening and closing<strong>of</strong> fissures (cracks) and sand boils, potentially damaging structures and underground utilities(Tinsley et al., 1985).Loss <strong>of</strong> Bearing Strength - When a soil liquefies, loss <strong>of</strong> bearing strength may occur beneath astructure, possibly causing the building to settle and tip. If the structure is buoyant, it may floatupward. During the 1964 Niigata, Japan earthquake, buried septic tanks rose as much as 3 feet, andstructures in the Kwangishicho apartment complex tilted as much as 60° (Tinsley et al., 1985).Ground Lurching - S<strong>of</strong>t, saturated soils have been observed to move in a wave-like manner inresponse to intense seismic ground shaking, forming ridges or cracks on the ground surface. Atpresent, the potential for ground lurching to occur at a given site can be predicted only generally.Areas underlain by thick accumulation <strong>of</strong> colluvium and alluvium appear to be the most susceptibleto ground lurching. Under strong ground motion conditions, lurching can be expected in loose,cohesionless soils, or in clay-rich soils with high moisture content. In some cases, the deformationremains after the shaking stops (Barrows et al., 1994).Seismically Induced Slope FailureStrong ground motions can worsen existing unstable slope conditions, particularly if coupled withsaturated ground conditions. Seismically induced landslides can overrun structures, people orproperty, sever utility lines, and block roads, thereby hindering rescue operations after anearthquake. Over 11,000 landslides were mapped shortly after the Northridge earthquake, all withina 45-mile radius <strong>of</strong> the epicenter (Harp and Jibson, 1996). Although numerous types <strong>of</strong> earthquakeinducedlandslides have been identified, the most widespread type generally consists <strong>of</strong> shallowfailures involving surficial soils and the uppermost weathered bedrock in moderate to steep hillsideterrain (these are also called disrupted soil slides). Rock falls and rockslides on very steep slopes are2006 PAGE 6 - 30
Natural <strong>Hazard</strong>s <strong>Mitigation</strong> PlanCity <strong>of</strong> <strong>Glendale</strong>, <strong>California</strong>Section 6 – Earthquakesalso common. The 1989 Loma Prieta and Northridge earthquakes showed that reactivation <strong>of</strong>existing deep-seated landslides also occurs (Spittler et al., 1990; Barrows et al., 1995).A combination <strong>of</strong> geologic conditions leads to landslide vulnerability. These include high seismicpotential; rapid uplift and erosion resulting in steep slopes and deeply incised canyons; highlyfractured and folded rock; and rock with inherently weak components, such as silt or clay layers.The orientation <strong>of</strong> the slope with respect to the direction <strong>of</strong> the seismic waves (which can affect theshaking intensity) can also control the occurrence <strong>of</strong> landslides.Several areas in <strong>Glendale</strong> have been identified as vulnerable to seismically induced slope failure (seePlate H-5). The mountainous region along the northern reaches <strong>of</strong> the city (the San GabrielMountains) is susceptible to slope failure due to the steep terrain. The crystalline bedrock that cropsout in the northern and central portions <strong>of</strong> the San Rafael Hills is locally highly fractured andweathered. In steep areas, strong ground shaking can cause slides or rockfalls in this material. Slopefailures can also occur in the western and central portions <strong>of</strong> the city, in the Verdugo Mountains,where locally steep terrain is combined with fractured igneous and metamorphic rock units.Numerous small landslides can be expected to occur in these areas in response to an earthquake onthe Sierra Madre, the Verdugo or other nearby faults. For a more detailed assessment <strong>of</strong> potentialslope instability in the <strong>Glendale</strong> area, refer to Section 9 <strong>of</strong> this report.Ridgetop Fissuring and ShatteringLinear, fault-like fissures occurred on ridge crests in a relatively concentrated area <strong>of</strong> rugged terrainin the Santa Cruz Mountains during the Loma Prieta earthquake. Shattering <strong>of</strong> the surface soils onthe crests <strong>of</strong> steep, narrow ridgelines occurred locally in the 1971 San Fernando earthquake, but waswidespread in the 1994 Northridge earthquake. Ridgetop shattering (which leaves the surfacelooking as if it was plowed) by the Northridge earthquake was observed as far as 22 miles away fromthe epicenter. In the Sherman Oaks area, severe damage occurred locally to structures located at thetops <strong>of</strong> relatively high (greater than 100 feet), narrow (typically less than 300 feet wide) ridgesflanked by slopes steeper than about 2.5:1 (horizontal:vertical). It is generally accepted that ridgetopfissuring and shattering is a result <strong>of</strong> intense amplification or focusing <strong>of</strong> seismic energy due to localtopographic effects (Barrows et al., 1995).Ridgetop shattering can be expected to occur in the topographically steep portions <strong>of</strong> the SanGabriel Mountains north <strong>of</strong> <strong>Glendale</strong>, in the Verdugo Mountains, and locally in the San Rafael Hills.These areas are for the most part undeveloped, so the hazard associated with ridgetop shattering isrelatively low. However, above ground storage tanks, reservoirs and utility towers are <strong>of</strong>ten locatedon top <strong>of</strong> ridges, and during strong ground shaking, these can fail or topple over, with the potentialto cause widespread damage to development downslope (storage tanks and reservoirs), ordisruptions to the lifeline systems (utility towers).Vulnerability AssessmentThe effects <strong>of</strong> earthquakes span a large area, and large earthquakes occurring in the southern<strong>California</strong> area would be felt throughout the region. However, the degree to which earthquakes arefelt, and the damages associated with them may vary. At risk from earthquake damage are largestocks <strong>of</strong> old buildings and bridges; many hazardous materials facilities; extensive sewer, water, andnatural gas pipelines; earthen dams; petroleum pipelines; and other critical facilities, not to mentionprivate property and businesses. Secondary earthquake hazards, such as liquefaction and earthquakeinducedlandslides, can be just as devastating as the ground shaking.Damage to the extensive building stock in the area is expected to vary. Older, pre-1945 steel frame2006 PAGE 6 - 31
Natural <strong>Hazard</strong>s <strong>Mitigation</strong> PlanCity <strong>of</strong> <strong>Glendale</strong>, <strong>California</strong>Section 6 – Earthquakesstructures may have unreinforced masonry such as bricks, clay tiles and terra cotta tiles as claddingor infilling. Cladding in newer buildings may be glass, infill panels or pre-cast panels that may failand generate a band <strong>of</strong> debris around the building exterior (with considerable threat to pedestrians inthe streets below). Structural damage may occur if the structural members are subject to plasticdeformation which can cause permanent displacements. If some walls fail while others remain intact,torsion or s<strong>of</strong>t-story problems may result. Overall, modern steel frame buildings have been expectedto perform well in earthquakes, but the 1994 Northridge earthquake broke many welds in thesebuildings, a previously unanticipated problem.Buildings are <strong>of</strong>ten a combination <strong>of</strong> steel, concrete, reinforced masonry and wood, with differentstructural systems on different floors or different sections <strong>of</strong> the building. Combination types thatare potentially hazardous include: concrete frame buildings without special reinforcing, precastconcrete and precast-composite buildings, steel frame or concrete frame buildings with unreinforcedmasonry walls, reinforced concrete wall buildings with no special detailing or reinforcement, largecapacity buildings with long-span ro<strong>of</strong> structures (such as theaters and auditoriums), largeunengineered wood-frame buildings, buildings with inadequately anchored exterior cladding andglazing, and buildings with poorly anchored parapets and appendages (FEMA, 1985). Additionaltypes <strong>of</strong> potentially hazardous buildings may be recognized after future earthquakes.Mobile homes are prefabricated housing units that are placed on isolated piers, jackstands, ormasonry block foundations (usually without any positive anchorage). Floors and ro<strong>of</strong>s <strong>of</strong> mobilehomes are usually plywood, and outside surfaces are covered with sheet metal. Mobile homestypically do not perform well in earthquakes. Severe damage occurs when they fall <strong>of</strong>f theirsupports, severing utility lines and piercing the floor with jackstands.In addition to building types, there are other factors associated with the design and construction <strong>of</strong>the buildings that also have an impact on the structures’ vulnerability to strong ground shaking.Some <strong>of</strong> these conditions are discussed below:• Building Shape - A building’s vertical and/or horizontal shape can be important. Simple,symmetric buildings generally perform better than non-symmetric buildings. During anearthquake, non-symmetric buildings tend to twist as well as shake. Wings on a buildingtend to act independently during an earthquake, resulting in differential movements andcracking. The geometry <strong>of</strong> the lateral load-resisting systems also matters. For example,buildings with one or two walls made mostly <strong>of</strong> glass, while the remaining walls are made <strong>of</strong>concrete or brick, are at risk. Asymmetry in the placement <strong>of</strong> bracing systems that provide abuilding with earthquake resistance, can result in twisting or differential motions.• Pounding - Site-related seismic hazards may include the potential for neighboring buildingsto "pound," or for one building to collapse onto a neighbor. Pounding occurs when there islittle clearance between adjacent buildings, and the buildings "pound" against each other asthey deflect during an earthquake. The effects <strong>of</strong> pounding can be especially damaging if thefloors <strong>of</strong> the buildings are at different elevations, so that, for example, the floor <strong>of</strong> onebuilding hits a supporting column <strong>of</strong> the other. Damage to a supporting column can result inpartial or total building collapse.Damage to the region’s critical facilities and infrastructure need to be considered and planned for.Critical facilities are those parts <strong>of</strong> a community's infrastructure that must remain operational afteran earthquake. Critical facilities include schools, hospitals, fire and police stations, emergencyoperation centers, and communication centers. Plate H-12 shows the locations <strong>of</strong> the City’s firestations, police stations, schools, and other critical facilities. A vulnerability assessment for thesefacilities involves comparing the locations <strong>of</strong> these facilities to the hazardous areas identified in the2006 PAGE 6 - 32
Natural <strong>Hazard</strong>s <strong>Mitigation</strong> PlanCity <strong>of</strong> <strong>Glendale</strong>, <strong>California</strong>Section 6 – EarthquakesCity, including active and potentially active faults (Plate H-4), liquefaction-susceptible areas (PlateH-5), unstable slope areas (Plates H-5 and H-11), potential dam failure inundation areas (Plate H-10),fire hazard zones (Plate H-7), and sites that generate hazardous materials.High-risk facilities, if severely damaged, may result in a disaster far beyond the facilitiesthemselves. Examples include power plants, dams and flood control structures, freewayinterchanges, bridges, and industrial plants that use or store explosives, toxic materials or petroleumproducts.High-occupancy facilities have the potential <strong>of</strong> resulting in a large number <strong>of</strong> casualties or crowdcontrolproblems. This category includes high-rise buildings, large assembly facilities, and largemultifamily residential complexes.Dependent-care facilities, such as preschools and schools, rehabilitation centers, prisons, groupcare homes, and nursing homes, house populations with special evacuation considerations.Economic facilities, such as banks, archiving and vital record-keeping facilities, airports, and largeindustrial or commercial centers, are those facilities that should remain operational to avoid severeeconomic impacts.It is crucial that critical facilities have no structural weaknesses that can lead to collapse. Forexample, the Federal Emergency Management Agency (FEMA, 1985) has suggested the followingseismic performance goals for health care facilities:• The damage to the facilities should be limited to what might be reasonably expected after adestructive earthquake and should be repairable and not be life-threatening.• Patients, visitors, and medical, nursing, technical and support staff within and immediatelyoutside the facility should be protected during an earthquake.• Emergency utility systems in the facility should remain operational after an earthquake.• Occupants should be able to evacuate the facility safely after an earthquake.• Rescue and emergency workers should be able to enter the facility immediately after anearthquake and should encounter only minimum interference and danger.• The facility should be available for its planned disaster response role after an earthquake.Lifelines are those services that are critical to the health, safety and functioning <strong>of</strong> the community.They are particularly essential for emergency response and recovery after an earthquake.Furthermore, certain critical facilities designed to remain functional during and immediately after anearthquake may be able to provide only limited services if the lifelines they depend on are disrupted.Lifeline systems include water, sewage, electrical power, communication, transportation (highways,bridges, railroads, and airports), natural gas, and liquid fuel systems. The improved performance <strong>of</strong>lifelines in the 1994 Northridge earthquake, relative to the 1971 San Fernando earthquake, showsthat the seismic codes upgraded and implemented after 1971 have been effective. Nevertheless, theimpact <strong>of</strong> the Northridge quake on lifeline systems was widespread and illustrates the continued needto study earthquake impacts, to upgrade substandard elements in the systems, to provide redundancyin systems, to improve emergency response plans, and to provide adequate planning, budgeting andfinancing for seismic safety.Some <strong>of</strong> the observations and lessons learned from the Northridge earthquake are summarized below(from Savage, 1995; Lund, 1996).2006 PAGE 6 - 33
Natural <strong>Hazard</strong>s <strong>Mitigation</strong> PlanCity <strong>of</strong> <strong>Glendale</strong>, <strong>California</strong>Section 6 – Earthquakes• Several electrical transmission towers were damaged or totally collapsed. Collapse wasgenerally due to foundation distress in towers that were located near ridge tops whereamplification <strong>of</strong> ground motion may have occurred. One collapse was the result <strong>of</strong> aseismically induced slope failure at the base <strong>of</strong> the tower.• Damage to above ground water tanks typically occurred where piping and joints wererigidly connected to the tank, due to differential movement between the tank and the piping.Older steel tanks not seismically designed under current standards buckled at the bottom(called “elephant’s foot”), in the shell, and on the ro<strong>of</strong>. Modern steel and concrete tanksgenerally performed well.• The most vulnerable components <strong>of</strong> pipeline distribution systems were older threaded joints,cast iron valves, cast iron pipes with rigid joints, and older steel pipes weakened bycorrosion. In the case <strong>of</strong> broken water lines, the loss <strong>of</strong> fire suppression water forced firedepartments to utilize water from swimming pools and tanker trucks.• Significant damage occurred in water treatment plants due to sloshing in large water basins.• A number <strong>of</strong> facilities did not have an emergency power supply or did not have enoughpower supply capacity to provide their essential services.• Lifelines within critical structures, such as hospitals and fire stations, may be vulnerable.For instance, ro<strong>of</strong>top mechanical and electrical equipment is not generally designed forseismic forces. During the Northridge quake, ro<strong>of</strong>top equipment failed causing malfunctionsin other systems.• A 70-year old crude oil pipeline leaked from a cracked weld, spreading oil for 12 miles downthe Santa Clara River.• A freight train carrying sulfuric acid was derailed causing an 8,000-gallon acid spill and a2,000-gallon diesel spill from the locomotive.The above list is by no means a complete summary <strong>of</strong> the earthquake damage, but it does highlightsome <strong>of</strong> the issues pertinent to the <strong>Glendale</strong> area. All lifeline providers should make an evaluation <strong>of</strong>the seismic vulnerability within their systems a priority. The evaluation should include a plan t<strong>of</strong>und and schedule the needed seismic mitigation.2006 PAGE 6 - 34
Natural <strong>Hazard</strong>s <strong>Mitigation</strong> PlanCity <strong>of</strong> <strong>Glendale</strong>, <strong>California</strong>Section 6 – EarthquakesRisk AnalysisRisk analysis is the third phase <strong>of</strong> a hazard assessment. Risk analysis involves estimating thedamage and costs likely to be experienced in a geographic area over a period <strong>of</strong> time. Factorsincluded in assessing earthquake risk include population and property distribution in the hazard area,the frequency <strong>of</strong> earthquake events, landslide susceptibility, buildings, infrastructure, and disasterpreparedness <strong>of</strong> the region. This type <strong>of</strong> analysis can generate estimates <strong>of</strong> the damages to the regiondue to an earthquake event in a specific location. FEMA's s<strong>of</strong>tware program, HAZUS, usesmathematical formulas and information about building stock, local geology and the location and size<strong>of</strong> potential earthquakes, economic data, and other information to estimate losses from a potentialearthquake. A HAZUS loss estimation was conducted for the city <strong>of</strong> <strong>Glendale</strong> as part <strong>of</strong> its SafetyElement <strong>of</strong> the General Plan. That section <strong>of</strong> the Safety Element is reproduced in the followingpages.HAZUS-99 TM is a standardized methodology for earthquake loss estimation based on a geographicinformation system (GIS). A project <strong>of</strong> the National Institute <strong>of</strong> Building Sciences, funded by theFederal Emergency Management Agency (FEMA), it is a powerful advance in mitigation strategies.The HAZUS project developed guidelines and procedures to make standardized earthquake lossestimates at a regional scale. With standardization, estimates can be compared from region toregion. HAZUS is designed for use by state, regional and local governments in planning forearthquake loss mitigation, emergency preparedness, response and recovery. HAZUS addressesnearly all aspects <strong>of</strong> the built environment, and many different types <strong>of</strong> losses. The methodology hasbeen tested against the experience <strong>of</strong> several past earthquakes, and against the judgment <strong>of</strong> experts.Subject to several limitations noted below, HAZUS can produce results that are valid for theintended purposes.Loss estimation is an invaluable tool, but must be used with discretion. Loss estimation analyzescasualties, damage and economic loss in great detail. It produces seemingly precise numbers that canbe easily misinterpreted. Loss estimation's results, for example, may cite 4,054 left homeless by ascenario earthquake. This is best interpreted by its magnitude. That is, an event that leaves 4,000people homeless is clearly more manageable than an event causing 40,000 homeless people; and anevent that leaves 400,000 homeless would overwhelm a community's resources. However, anotherloss estimation that predicts 7,000 people homeless should probably be considered equivalent to the4,054 result. Because HAZUS results make use <strong>of</strong> a great number <strong>of</strong> parameters and data <strong>of</strong> varyingaccuracy and completeness, it is not possible to assign quantitative error bars. Although thenumbers should not be taken at face value, they are not rounded or edited because detailed evaluation<strong>of</strong> individual components <strong>of</strong> the disaster can help mitigation agencies ensure that they haveconsidered all the important options.The more community-specific the data that are input to HAZUS, the more reliable the lossestimation. HAZUS provides defaults for all required information. These are based on bestavailablescientific, engineering, census and economic knowledge. The loss estimations in this reporthave been tailored to <strong>Glendale</strong> by using a map <strong>of</strong> soil types for the City. HAZUS relies on 1990Census data, but for the purposes <strong>of</strong> this study, we replaced the population by census tract data thatcame with the s<strong>of</strong>tware with the 2000 Census data. Other modifications made to the data set beforerunning the analyses include:• updated the database <strong>of</strong> critical facilities, including the number and location <strong>of</strong> the fire andpolice stations in the City,• revised the number <strong>of</strong> beds available in the three major hospitals in <strong>Glendale</strong> to betterrepresent their current patient capacity, and2006 PAGE 6 - 35
Natural <strong>Hazard</strong>s <strong>Mitigation</strong> PlanCity <strong>of</strong> <strong>Glendale</strong>, <strong>California</strong>Section 6 – Earthquakes• upgraded the construction level for most unreinforced masonry buildings in the City tobetter represent the City’s retr<strong>of</strong>itting efforts <strong>of</strong> the last decade.As useful as HAZUS seems to be, the loss estimation methodology has some inherent uncertainties.These arise in part from incomplete scientific knowledge concerning earthquakes and their effectupon buildings and facilities, and in part from the approximations and simplifications necessary forcomprehensive analyses.Users should be aware <strong>of</strong> the following specific limitations:• HAZUS is driven by statistics, and thus is most accurate when applied to a region, or a class<strong>of</strong> buildings or facilities. It is least accurate when considering a particular site, building orfacility.• Losses estimated for lifelines may be less than losses estimated for the general buildingstock.• Losses from smaller (less than M 6.0) damaging earthquakes may be overestimated.• Pilot and calibration studies have not yet provided an adequate test concerning the possibleextent and effects <strong>of</strong> landsliding.• The indirect economic loss module is new and experimental. While output from pilot studieshas generally been credible, this module requires further testing.• The databases that HAZUS draws from to make its estimates are <strong>of</strong>ten incomplete oroutdated (as discussed above, efforts were made to improve some <strong>of</strong> the datasets used for theanalysis, but for some estimates, the s<strong>of</strong>tware still relies on 1990 census tracts data and 1994DNB economic reports). This is another reason the loss estimates should not be taken at facevalue.Essential facilities and lifeline inventory are located by latitude and longitude. However, the HAZUSinventory data for lifelines and utilities were developed at a national level and where specific data arelacking, statistical estimations are utilized. Specifics about the site-specific inventory data used inthe models are discussed further in the paragraphs below. Other site-specific data used include soiltypes and liquefaction susceptible zones. The user then defines the earthquake scenario to bemodeled, including the magnitude <strong>of</strong> the earthquake, and the location <strong>of</strong> the epicenter. Once all thesedata are input, the s<strong>of</strong>tware calculates the loss estimates for each scenario.The loss estimates include physical damage to buildings <strong>of</strong> different construction and occupancytypes, damage to essential facilities and lifelines, number <strong>of</strong> after-earthquake fires and damage due t<strong>of</strong>ire, and the amount <strong>of</strong> debris that is expected. The model also estimates the direct economic andsocial losses, including casualties and fatalities for three different times <strong>of</strong> the day, the number <strong>of</strong>people left homeless and number <strong>of</strong> people that will require shelter, number <strong>of</strong> hospital bedsavailable, and the economic losses due to damage to the places <strong>of</strong> businesses, loss <strong>of</strong> inventory, and(to some degree) loss <strong>of</strong> jobs. The indirect economic losses component is still experimental; thecalculations in the s<strong>of</strong>tware are checked against actual past earthquakes, such as the 1989 LomaPrieta and 1994 Northridge earthquake, but indirect losses are hard to measure, and it typically takesyears before these monetary losses can be quantified with any degree <strong>of</strong> accuracy. Therefore, thiscomponent <strong>of</strong> HAZUS is still considered experimental.HAZUS breaks critical facilities into two groups: essential facilities and high potential loss (HPL)facilities. Essential facilities provide services to the community and should be functional after anearthquake. Essential facilities include hospitals, medical clinics, schools, fire stations, police stations2006 PAGE 6 - 36
Natural <strong>Hazard</strong>s <strong>Mitigation</strong> PlanCity <strong>of</strong> <strong>Glendale</strong>, <strong>California</strong>Section 6 – Earthquakesand emergency operations facilities. The essential facility module in HAZUS determines theexpected loss <strong>of</strong> functionality for these facilities. The damage probabilities for essential facilities aredetermined on a site-specific basis (i.e., at each facility). Economic losses associated with thesefacilities are computed as part <strong>of</strong> the analysis <strong>of</strong> the general building stock. Data required for theanalysis include occupancy classes (current building use) and building structural type, or acombination <strong>of</strong> essential facilities building type, design level and construction quality factor. Highpotential loss facilities include dams, levees, military installations, nuclear power plants andhazardous material sites.HAZUS divides the lifeline inventory into two systems: transportation and utility lifelines. Thetransportation system includes seven components: highways, railways, light rail, bus, ports, ferry andairports. The utility lifelines include potable water, wastewater, natural gas, crude and refined oil,electric power and communications. If site-specific lifeline utility data are not provided for theseanalyses, HAZUS performs a statistical calculation based on the population served.General Building Stock Type and Classification: HAZUS provides damage data for buildingsbased on these structural types:• Concrete• Mobile Home• Precast Concrete• Reinforced Masonry BearingWalls• Steel• Unreinforced Masonry BearingWalls• Wood Frameand based on these occupancy (usage) classifications:• Residential• Commercial• Industrial• Agriculture• Religion• Government and• Education2006 PAGE 6 - 37
Natural <strong>Hazard</strong>s <strong>Mitigation</strong> PlanCity <strong>of</strong> <strong>Glendale</strong>, <strong>California</strong>Section 6 – EarthquakesLoss estimation for the general building stock is averaged for each census tract. Buildingdamage classifications range from slight to complete. As an example, the building damageclassification for wood frame buildings is provided below. Wood-frame structures comprise thecity’s most numerous building type.Wood, Light Frame:• Slight Structural Damage: Small plaster or gypsum-board cracks at corners <strong>of</strong> doorand window openings and wall-ceiling intersections; small cracks in masonrychimneys and masonry veneer.• Moderate Structural Damage: Large plaster or gypsum-board cracks at corners <strong>of</strong>door and window openings; small diagonal cracks across shear wall panels exhibitedby small cracks in stucco and gypsum wall panels; large cracks in brick chimneys;toppling <strong>of</strong> tall masonry chimneys.• Extensive Structural Damage: Large diagonal cracks across shear wall panels or largecracks at plywood joints; permanent lateral movement <strong>of</strong> floors and ro<strong>of</strong>; toppling <strong>of</strong>most brick chimneys; cracks in foundations; splitting <strong>of</strong> wood sill plates and/orslippage <strong>of</strong> structure over foundations; partial collapse <strong>of</strong> "room-over-garage" orother "s<strong>of</strong>t-story" configurations; small foundations cracks.• Complete Structural Damage: Structure may have large permanent lateraldisplacement, may collapse, or be in imminent danger <strong>of</strong> collapse due to cripple wallfailure or failure <strong>of</strong> the lateral load resisting system; some structures may slip andfall <strong>of</strong>f the foundations; large foundation cracks.Estimates <strong>of</strong> building damage are provided for "High", "Moderate" and "Low" seismic designcriteria. Buildings <strong>of</strong> newer construction (e.g., post-1973) are best designated by "High."Buildings built after 1940, but before 1973, are best represented by "Moderate." If built beforeabout 1940 (i.e., before significant seismic codes were implemented), "Low" is most appropriate.A large percentage <strong>of</strong> buildings in the City <strong>of</strong> <strong>Glendale</strong> fall in the “Moderate” and “High”seismic design criteria.HAZUS estimates two types <strong>of</strong> debris. The first is debris that falls in large pieces, such as steelmembers or reinforced concrete elements. These require special treatment to break into smallerpieces before they are hauled away. The second type <strong>of</strong> debris is smaller and more easily movedwith bulldozers and other machinery and tools. This type includes brick, wood, glass, buildingcontents and other materials.Casualties are estimated based on the assumption that there is a strong correlation betweenbuilding damage (both structural and non-structural) and the number and severity <strong>of</strong> casualties.In smaller earthquakes, non-structural damage will most likely control the casualty estimates.In severe earthquakes where there will be a large number <strong>of</strong> collapses and partial collapses,there will be a proportionately larger number <strong>of</strong> fatalities. Data regarding earthquake-relatedinjuries are not <strong>of</strong> the best quality, nor are they available for all building types. Available data<strong>of</strong>ten have insufficient information about the type <strong>of</strong> structure in which the casualties occurredand the casualty-generating mechanism. HAZUS casualty estimates are based on the injuryclassification scale described in Table 6-4.2006 PAGE 6 - 38
Natural <strong>Hazard</strong>s <strong>Mitigation</strong> PlanCity <strong>of</strong> <strong>Glendale</strong>, <strong>California</strong>Section 6 – EarthquakesTable 6-4: Injury Classification ScaleInjury SeverityLevelSeverity 1Severity 2Severity 3Severity 4Injury DescriptionInjuries requiring basic medical aid without requiring hospitalization.Injuries requiring a greater degree <strong>of</strong> medical care and hospitalization, butnot expected to progress to a life-threatening status.Injuries which pose an immediate life-threatening condition if not treatedadequately and expeditiously. The majority <strong>of</strong> these injuries are the result<strong>of</strong> structural collapse and subsequent entrapment or impairment <strong>of</strong> theoccupants.Instantaneously killed or mortally injured.In addition, HAZUS produces casualty estimates for three times <strong>of</strong> day:• Earthquake striking at 2:00 a.m. (population at home)• Earthquake striking at 2:00 p.m. (population at work/school)• Earthquake striking at 5:00 p.m. (commute time).Displaced Households/Shelter Requirements - Earthquakes can cause loss <strong>of</strong> function orhabitability <strong>of</strong> buildings that contain housing. Displaced households may need alternativeshort-term shelter, provided by family, friends, temporary rentals, or public shelters establishedby the City, County or by relief organizations such as the Red Cross or Salvation Army. Longtermalternative housing may require import <strong>of</strong> mobile homes, occupancy <strong>of</strong> vacant units, netemigration from the impacted area, or, eventually, the repair or reconstruction <strong>of</strong> new publicand private housing. The number <strong>of</strong> people seeking short-term public shelter is <strong>of</strong> most concernto emergency response organizations. The longer-term impacts on the housing stock are <strong>of</strong>great concern to local governments, such as cities and counties.Economic Losses - HAZUS estimates structural and nonstructural repair costs caused bybuilding damage and the associated loss <strong>of</strong> building contents and business inventory. Buildingdamage can cause additional losses by restricting the building's ability to function properly.Thus, business interruption and rental income losses are estimated. HAZUS divides buildinglosses into two categories: (1) direct building losses and (2) business interruption losses. Directbuilding losses are the estimated costs to repair or replace the damage caused to the buildingand its contents. Business interruption losses are associated with inability to operate a businessbecause <strong>of</strong> the damage sustained during the earthquake. Business interruption losses alsoinclude the temporary living expenses for those people displaced from their homes because <strong>of</strong>the earthquake.Earthquakes may produce indirect economic losses in sectors that do not sustain direct damage.All businesses are forward-linked (if they rely on regional customers to purchase their output)or backward-linked (if they rely on regional suppliers to provide their inputs) and are thuspotentially vulnerable to interruptions in their operation. Note that indirect losses are notconfined to immediate customers or suppliers <strong>of</strong> damaged enterprises. All <strong>of</strong> the successiverounds <strong>of</strong> customers <strong>of</strong> customers and suppliers <strong>of</strong> suppliers are affected. In this way, evenlimited physical earthquake damage causes a chain reaction, or ripple effect, that is transmittedthroughout the regional economy.2006 PAGE 6 - 39
Natural <strong>Hazard</strong>s <strong>Mitigation</strong> PlanCity <strong>of</strong> <strong>Glendale</strong>, <strong>California</strong>Section 6 – EarthquakesHAZUS Scenario Earthquakes for the <strong>Glendale</strong> AreaFive specific scenario earthquakes were modeled using the HAZUS loss estimation s<strong>of</strong>twareavailable from FEMA: earthquakes on the San Andreas, Sierra Madre, Verdugo, Raymond andHollywood faults (see Table 6-5).Fault Source MagnitudeSan Andreas -Mojave SegmentTable 6-5: HAZUS Scenario Earthquakes for the City <strong>of</strong> <strong>Glendale</strong>7.1DescriptionA large earthquake that ruptures the Mojave segment <strong>of</strong> the SanAndreas fault is modeled because <strong>of</strong> its high probability <strong>of</strong> occurrence,even though the epicenter would not be too close to the City.Sierra Madre 7.2Verdugo 6.7Raymond 6.5Hollywood 6.4Likely worst-case scenario for the <strong>Glendale</strong> area. The 7.2 magnitudeearthquake modeled is at the lower range <strong>of</strong> the size <strong>of</strong> earthquakes thatresearchers now believe this fault is capable <strong>of</strong> generating.Possible worst-case scenario for <strong>Glendale</strong>. Although this earthquake isnot as large as the one estimated on the Sierra Madre fault, this faultextends through an extensively developed area, and therefore has thepotential to cause significant damage to buildings and infrastructure.Maximum magnitude earthquake on the Raymond fault. This fault nearthe southern portion <strong>of</strong> the City could cause significant damage in thesouthern and eastern portions <strong>of</strong> <strong>Glendale</strong>, and in the San Rafael Hills.Maximum magnitude earthquake on the Hollywood fault would causeextensive damage in Hollywood, West Hollywood, and in thesouthwestern portion <strong>of</strong> <strong>Glendale</strong>. This fault could break together withthe Santa Monica faults, generating a stronger, more damagingearthquake than the one presented herein.Four <strong>of</strong> the five earthquake scenarios modeled for this study are discussed in the followingsections. An earthquake on the San Andreas fault is discussed because it has the highestprobability <strong>of</strong> occurring in the not too distant future, even though the loses expected from thisearthquake are not the worst possible for <strong>Glendale</strong>. An earthquake on the San Andreas fault hastraditionally been considered the “Big One,” the implication being that an earthquake on thisfault would be devastating to southern <strong>California</strong>. However, there are several other seismicsources that, given their location closer to the Los Angeles metropolitan area, have the potentialto be more devastating to the region, even if the causative earthquake is smaller in magnitudethan an earthquake on the San Andreas fault. The 7.1 magnitude San Andreas earthquakemodeled for this study would result from the rupture <strong>of</strong> the Mojave segment <strong>of</strong> the fault. Thissegment is thought to have more than a 40 percent probability <strong>of</strong> rupturing in the next 30years. A larger-magnitude earthquake on the San Andreas fault would occur if more than onesegment <strong>of</strong> the fault ruptures at the same time. If all three southern segments <strong>of</strong> the SanAndreas fault break together, an earthquake <strong>of</strong> at least magnitude 7.8 would result.The Sierra Madre and Verdugo scenarios are also presented here because both <strong>of</strong> these faultshave the potential to cause significant damage in the City. As discussed in Section 1.5.5, theSierra Madre fault appears to have last ruptured more than 8,000 years ago, and may be nearthe end <strong>of</strong> its strain accumulation cycle. Given that recent studies suggest that the Sierra Madre2006 PAGE 6 - 40
Natural <strong>Hazard</strong>s <strong>Mitigation</strong> PlanCity <strong>of</strong> <strong>Glendale</strong>, <strong>California</strong>Section 6 – Earthquakesfault can generate earthquakes <strong>of</strong> magnitude 7.2 to 7.5 (instead <strong>of</strong> the 7.0 used by the <strong>California</strong>Geological Survey), a lower-bound 7.2 magnitude earthquake was chosen for the scenario andloss estimation analysis. The earthquake history and recurrence interval <strong>of</strong> the Verdugo faultare unknown, and as a result, the probability <strong>of</strong> future earthquakes on this fault cannot bequantified with any degree <strong>of</strong> certainty. What it is certain is that if, and when this fault breaks,the City <strong>of</strong> <strong>Glendale</strong> will be impacted. HAZUS helps to quantify the damage expected.The Raymond and Hollywood faults would both cause about the same amount <strong>of</strong> damage in<strong>Glendale</strong>. The Raymond fault appears to break more <strong>of</strong>ten than the Hollywood fault, and as aresult, one could argue that it has a higher probability <strong>of</strong> rupturing again in the future.However, since the Hollywood fault appears to have last ruptured several thousand years ago, itmay actually be closer to rupture. Since both faults are located immediately south <strong>of</strong> <strong>Glendale</strong>,the damage patterns can be expected to be very similar (directivity <strong>of</strong> fault breakage can have asubstantial impact on the damage potential, but the damage analyses conducted for this studyare not designed to be sensitive to this issue).As mentioned previously, the population data used for the <strong>Glendale</strong> analyses were modifiedusing the recently available 2000 Census data. The general building stock and populationinventory data conform to census tract boundaries, and the census tract boundaries generallyconform to the City limits, with minor exceptions. The region studied is 30 square miles in areaand contains 28 census tracts. There are over 68,000 households (1990 Census Bureau data –the 2000 Census lists 74,000 households) in the region, with a total population <strong>of</strong> 194,000 (basedon 2000 Census Bureau data). There are an estimated 33,000 buildings in the region with a totalbuilding replacement value (excluding contents) <strong>of</strong> $9.85 billion (1994 dollars). Approximately96 percent <strong>of</strong> the buildings (and 76 percent <strong>of</strong> the building value) are associated with residentialhousing (see Figure 6-1). In terms <strong>of</strong> building construction types found in the region, woodframeconstruction makes up 94 percent <strong>of</strong> the building inventory. The remaining percentage isdistributed between the other general building types. The replacement value <strong>of</strong> thetransportation and utility lifeline systems in the City <strong>of</strong> <strong>Glendale</strong> is estimated to be nearly $3.26billion and $245 million (1994 dollars), respectively.The HAZUS inventory <strong>of</strong> unreinforced masonry (URM) buildings includes more URMs thanthose now present in the City, since many URMs have been demolished since 1994. Therefore,the URM numbers in the HAZUS output are somewhat overstated. However, far more URMsin <strong>Glendale</strong> have been retr<strong>of</strong>itted than demolished, and the database used for the HAZUSanalyses accounts for this: the seismic design criteria for most URMs in the City were upgradedfrom low to moderate to reflect the retr<strong>of</strong>itting efforts that have been accomplished in the late1990s and early 2000s. It is important to note, however, that retr<strong>of</strong>itting is typically designed tokeep buildings from collapsing, but that structural damage to the building is still possible andexpected.Changes were made to the HAZUS hospital inventory for <strong>Glendale</strong>, specifically, to the number<strong>of</strong> beds available. In all cases, the number <strong>of</strong> beds at all hospitals has increased since 1990, basedon recent bed counts published by each <strong>of</strong> the three main hospitals in the City: <strong>Glendale</strong>Adventist Medical Center has 450 beds, <strong>Glendale</strong> Memorial Hospital and Health Center has 334beds, and Verdugo Hills Hospital has 158 beds, for a total hospital capacity <strong>of</strong> 942 beds. Atleast one <strong>of</strong> these hospitals (<strong>Glendale</strong> Memorial) is currently enlarging its facilities to serve aneven larger number <strong>of</strong> patients. The new hospital wing is being built to the seismic standards <strong>of</strong>the Office <strong>of</strong> the <strong>State</strong> Architect in accordance with <strong>State</strong> law.Figure 6-1Building Inventory, by Occupancy Type, in the <strong>Glendale</strong> Area(values shown are in millions <strong>of</strong> dollars)2006 PAGE 6 - 41
Natural <strong>Hazard</strong>s <strong>Mitigation</strong> PlanCity <strong>of</strong> <strong>Glendale</strong>, <strong>California</strong>Section 6 – EarthquakesResidentia7,478,968Residential 75.9%Commercial 18.6%Industrial 3.6%Others 1.9%Commercia1,827,638Industria357,454Others183,915Regarding critical facilities, the HAZUS database for <strong>Glendale</strong> includes 70 schools or schoolfacilities, including school district <strong>of</strong>fices, private schools, and community colleges. The City’semergency operations center in the basement <strong>of</strong> City Hall is also included. The database wasmodified to include the two police stations and nine fire stations that serve the City. Thelocations <strong>of</strong> these facilities are shown on Plate H-12.HAZUS loss estimations for the City <strong>of</strong> <strong>Glendale</strong> based on four <strong>of</strong> the earthquake scenariosmodeled are presented concurrently below. These scenarios include earthquakes on the SanAndreas, Sierra Madre, Verdugo and Raymond faults. Of the five earthquake scenarios modeledfor the city, the results indicate that the San Andreas fault earthquake will pose the leastdamage to the <strong>Glendale</strong>, although this fault may have the highest probability <strong>of</strong> rupturing in thenear-future.The Sierra Madre and Verdugo earthquake scenarios are the worst-case scenarios for the City.The losses are similar, but the damaged areas will be different, as the faults transect differentsections <strong>of</strong> the City. Since the Sierra Madre fault is a reverse fault, it has the potential togenerate stronger ground accelerations than the predominantly left-lateral strike slip Verdug<strong>of</strong>ault (reverse faults typically generate stronger ground accelerations, distributed over a broadergeographic area than strike-slip faults). However, the stronger seismic shaking will beexperienced north <strong>of</strong> the fault, in the sparsely populated San Gabriel Mountains. Landslidingand rock collapse can be expected to result in road closures in the mountains, and some damageto the dams north <strong>of</strong> the area can be anticipated. The areas adjacent to and immediately south <strong>of</strong>the Sierra Madre fault will also experience damage.The losses anticipated as a result <strong>of</strong> either the Raymond or Hollywood fault causing anearthquake are also similar. These events would pose the next worst-case scenario for <strong>Glendale</strong>.Directivity <strong>of</strong> the seismic waves, as discussed earlier in this chapter, will determine, at least tosome extent, where and how much damage will be experienced in the area as a result <strong>of</strong>earthquakes on either the Hollywood or Raymond faults. However, seismologists still do not2006 PAGE 6 - 42
Natural <strong>Hazard</strong>s <strong>Mitigation</strong> PlanCity <strong>of</strong> <strong>Glendale</strong>, <strong>California</strong>Section 6 – Earthquakeshave the tools to predict where, when, and how a fault will break, and HAZUS does not considerthese issues in the loss estimation analysis.Building Damage - HAZUS estimates that between approximately 350 and 5,000 buildingswill be at least moderately damaged in response to the earthquake scenarios presented herein,with the lower number representative <strong>of</strong> damage as a result <strong>of</strong> an earthquake on the SanAndreas fault, and the higher number representing damage as a result <strong>of</strong> an earthquake oneither the Verdugo or Sierra Madre fault. These figures represent about 1 to 15 percent <strong>of</strong> thetotal number <strong>of</strong> buildings in the study area. An estimated 0 to 55 buildings will be completelydestroyed. Table 6-6 summarizes the expected damage to buildings by general occupancy type,while Table 6-7 summarizes the expected damage to buildings in <strong>Glendale</strong>, classified byconstruction type.The data presented in Tables 6-6 and 6-7 show that most <strong>of</strong> the buildings damaged will beresidential, with wood-frame structures experiencing mostly slight to moderate damage. TheVerdugo and Sierra Madre fault earthquake scenarios both have the potential to cause at leastslight damage to more than 50 percent <strong>of</strong> the residential structures in <strong>Glendale</strong>, and moderateto complete damage to as much as 16 percent <strong>of</strong> the residential stock. The distribution andseverity <strong>of</strong> the damage caused by these earthquakes to the residential buildings in the city isillustrated in Map 6.6. As mentioned before, an earthquake on the Sierra Madre fault wouldcause more damage in the northern section <strong>of</strong> the city than an earthquake on either the Verdugoor Raymond faults. The Raymond (and Hollywood) faults have the potential to cause significantdamage to the residential stock <strong>of</strong> <strong>Glendale</strong>, but the damage would not be as severe as thatcaused by either the Sierra Madre or Verdugo faults. The San Andreas fault scenario isanticipated to cause slight to moderate damage to about 10 percent <strong>of</strong> the residential buildingsin the city.2006 PAGE 6 - 43
Natural <strong>Hazard</strong>s <strong>Mitigation</strong> PlanCity <strong>of</strong> <strong>Glendale</strong>, <strong>California</strong>Section 6 – EarthquakesTable 6-6: Number <strong>of</strong> Buildings Damaged, by Occupancy TypeScenario Occupancy Type Slight Moderate Extensive Complete TotalResidential 2,859 308 0 0 3,167Commercial 86 25 0 0 111Industrial 23 10 1 0 34Agriculture 0 0 0 0 0Religion 3 0 0 0 3Government 0 0 0 0 0Education 0 0 0 0 0Total 2,971 343 1 0 3,315San AndreasSierra MadreVerdugoRaymondResidential 11,362 4,166 387 51 15,966Commercial 276 257 68 2 603Industrial 65 71 24 2 162Agriculture 2 2 0 0 4Religion 18 14 2 0 34Government 1 0 0 0 1Education 5 2 0 0 7Total 11,729 4,512 481 55 16,777Residential 11,656 4,153 330 20 16,159Commercial 285 272 82 5 644Industrial 66 73 24 2 165Agriculture 2 1 0 0 3Religion 18 15 2 0 35Government 1 0 0 0 1Education 5 1 0 0 6Total 12,033 4,515 438 27 17,013Residential 10,026 2,949 186 4 13,165Commercial 271 224 50 0 545Industrial 62 60 16 2 140Agriculture 2 0 0 0 2Religion 17 11 1 0 29Government 1 0 0 0 1Education 4 1 0 0 5Total 10,383 3,245 253 6 13,887Although the numbers presented in Table 6-6 only hint at it, the commercial andindustrial structures will also be impacted. The Sierra Madre and Verdugo earthquakeshave the potential to damage about 10 percent and 14 percent <strong>of</strong> the commercial andindustrial buildings, respectively, in the City. The distribution and severity <strong>of</strong> damageto the commercial structures in the City as a result <strong>of</strong> earthquakes on the Verdugo,Sierra Madre and Raymond faults is illustrated in Map 6.7. All three earthquakesshown on Map 6.7 are anticipated to cause damage in the commercial district <strong>of</strong> theCity, but an earthquake on the Verdugo fault would be the most severe, given the fault’slocation through the heart <strong>of</strong> <strong>Glendale</strong>.2006 PAGE 6 - 44
Natural <strong>Hazard</strong>s <strong>Mitigation</strong> Plan Section 6 – EarthquakesCity <strong>of</strong> <strong>Glendale</strong>, <strong>California</strong>Map 6.6: Distribution and Severity <strong>of</strong> Damaged Residential Buildings in <strong>Glendale</strong>as a Result <strong>of</strong> Three Different Earthquake Scenarios(Damage is defined as more than 50% <strong>of</strong> the structure has undergone moderate, extensive, and/or complete damage)2006 PAGE 6 - 45
Natural <strong>Hazard</strong>s <strong>Mitigation</strong> Plan Section 6 – EarthquakesCity <strong>of</strong> <strong>Glendale</strong>, <strong>California</strong>Map 6.7: Distribution and Severity <strong>of</strong> Damaged Commercial Buildings in <strong>Glendale</strong>as a Result <strong>of</strong> Three Different Earthquake Scenarios(Damage is defined as more than 50% <strong>of</strong> the structure has undergone moderate, extensive, and/or complete damage)2006 PAGE 6 - 46
Natural <strong>Hazard</strong>s <strong>Mitigation</strong> PlanCity <strong>of</strong> <strong>Glendale</strong>, <strong>California</strong>Section 6 – EarthquakesTable 6-7: Number <strong>of</strong> Buildings Damaged, by Construction TypeScenario Structure Type Slight Moderate Extensive Complete TotalConcrete 26 2 0 0 28Mobile Homes 10 5 0 0 15Precast Concrete 18 7 0 0 25Reinforced Masonry 40 19 0 0 59Steel 23 8 0 0 31URM 23 5 0 0 28Wood 2,831 290 0 0 3,121Total 2,971 336 0 0 3,307San AndreasSierra MadreVerdugoRaymondConcrete 103 103 25 0 231Mobile Homes 8 25 12 2 47Precast Concrete 59 83 22 2 166Reinforced Masonry 149 167 57 0 373Steel 73 106 34 0 213URM 39 50 11 1 101Wood 11,298 3,978 315 44 15,635Total 11,729 4,512 476 49 16,766Concrete 106 111 31 1 249Mobile Homes 11 23 11 0 45Precast Concrete 60 91 29 2 182Reinforced Masonry 157 185 67 0 409Steel 74 106 38 0 218URM 39 55 12 1 107Wood 11,586 3,944 250 10 15,790Total 12,033 4,515 438 14 17,000Concrete 103 94 21 0 218Mobile Homes 12 20 4 0 36Precast Concrete 60 72 20 0 152Reinforced Masonry 142 142 45 0 329Steel 74 89 24 0 187URM 43 43 7 0 93Wood 9,949 2,785 126 0 12,860Total 10,383 3,245 247 0 13,875The HAZUS output shows that URMs in <strong>Glendale</strong> will suffer slight to extensive damage, butthat very few are likely to be completely destroyed. This is anticipated to reduce the number <strong>of</strong>casualties significantly. The numbers show that by retr<strong>of</strong>itting its URMs, <strong>Glendale</strong> has alreadyreduced significantly its vulnerability to seismic shaking.Significantly, reinforced masonry, concrete and steel structures are not expected to performwell, with hundreds <strong>of</strong> these buildings in <strong>Glendale</strong> experiencing at least moderate damageduring an earthquake on the Sierra Madre or Verdugo faults. These types <strong>of</strong> structures arecommonly used for commercial and industrial purposes, and failure <strong>of</strong> some <strong>of</strong> these structures2006 PAGE 6 - 47
Natural <strong>Hazard</strong>s <strong>Mitigation</strong> PlanCity <strong>of</strong> <strong>Glendale</strong>, <strong>California</strong>Section 6 – Earthquakesexplains the casualties anticipated during the middle <strong>of</strong> the day in the non-residential sector (seeTable 6-8). These types <strong>of</strong> buildings also generate heavy debris that is difficult to cut throughto extricate victims.Casualties - Table 6-8 provides a summary <strong>of</strong> the casualties estimated for these scenarios. Theanalysis indicates that the worst time for an earthquake to occur in the City <strong>of</strong> <strong>Glendale</strong> isduring maximum non-residential occupancy (at 2 o’clock in the afternoon, when most people arein their place <strong>of</strong> business and schools are in session). The Verdugo fault earthquake scenario isanticipated to cause the largest number <strong>of</strong> casualties, followed closely by an event on the SierraMadre fault.Essential Facility Damage - The loss estimation model calculates the total number <strong>of</strong> hospitalbeds in <strong>Glendale</strong> that will be available after each earthquake scenario.A maximum magnitude earthquake on the Verdugo fault is expected to impact the localhospitals such that only 38 percent <strong>of</strong> the hospital beds (358 beds) would be available for use byexisting patients and injured persons on the day <strong>of</strong> the earthquake. One week after theearthquake, about 57 percent <strong>of</strong> the beds are expected to be back in service. After one month, 82percent <strong>of</strong> the beds are expected to be operational.Similarly, on the day <strong>of</strong> the Sierra Madre earthquake, the model estimates that only 378 hospitalbeds (40 percent) will be available for use by patients already in the hospital and those injuredby the earthquake. After one week, 59 percent <strong>of</strong> the beds will be back in service. After thirtydays, 83 percent <strong>of</strong> the beds will be available for use.An earthquake on the Raymond fault is only expected to be slightly better regarding theavailability <strong>of</strong> hospital beds. The model estimates that only 391 hospital beds (42 percent) willbe available on the day <strong>of</strong> the earthquake. After one week, 60 percent <strong>of</strong> the hospital beds areexpected to be available for use, and after one month, 84 percent <strong>of</strong> the beds are expected to beoperational.An earthquake on the San Andreas fault is not expected to cause significant damage to thehospitals in <strong>Glendale</strong>: On the day <strong>of</strong> the earthquake, the model estimates that 86 percent <strong>of</strong> thebeds will be available for use; after one week, 93 percent <strong>of</strong> the beds will be available for use; andafter 30 days, 98 percent <strong>of</strong> the beds will be operational.Given that the models estimate a maximum <strong>of</strong> about 100 people in the <strong>Glendale</strong> area willrequire hospitalization after an earthquake on either the Verdugo or Sierra Madre faults (seeTable 6-8), the hospitals in the City, even with the reduced number <strong>of</strong> beds that the modelprojects will be available, are anticipated to handle the local demand. However, nearby cities,such as Pasadena, which have limited medical care resources available, are anticipated to have ahigher number <strong>of</strong> casualties. <strong>Glendale</strong>’s hospitals will most likely provide a regional service toother nearby communities, taking in patients that other hospitals outside the City cannot handlebecause <strong>of</strong> damage to their own facilities, or due to excess demand for medical care.AndType and Time <strong>of</strong> ScenarioTable 6-8: Estimated CasualtiesLevel 1: Level 2: Level 3: Level 4:MedicaltreatmentwithouthospitalizationHospitalizationbut not lifethreateningHospitalizationand lifethreateningFatalities due toscenario event2AM Residential 15 1 0 02006 PAGE 6 - 48
Natural <strong>Hazard</strong>s <strong>Mitigation</strong> PlanCity <strong>of</strong> <strong>Glendale</strong>, <strong>California</strong>Section 6 – EarthquakesSierra Madre (M7.2)VerdugoRaymondNon-Residential 1 0 0 0Commute 0 0 0 0Total 16 1 0 0Residential 4 1 0 0Non-Residential 24 2 0 0Commute 0 0 0 02PM(max educational,industrial, andcommercial) Total 28 3 0 05PM (peakcommute time)Residential 4 0 0 0Non-Residential 9 1 0 0Commute 0 0 0 0Total 13 1 0 02AM Residential 165 24 2 4(maximum Non-Residential 9 2 0 1residential Commute 0 0 0 0occupancy) Total 175 26 2 42PM Residential 43 6 1 1(max educational, Non-Residential 337 71 9 19industrial, and Commute 0 0 0 0commercial) Total 380 78 10 205PM (peakcommute time)Residential 51 7 1 1Non-Residential 122 26 3 7Commute 0 1 1 0Total 173 34 5 82AM Residential 179 27 2 5(maximum Non-Residential 11 2 1 1residential Commute 0 0 0 0occupancy) Total 189 29 3 62PM Residential 47 7 1 1(max educational, Non-Residential 378 82 11 22industrial, and Commute 0 0 0 0commercial) Total 425 89 12 235PM (peakcommute time)Residential 56 8 1 2Non-Residential 140 31 4 8Commute 1 1 1 0Total 197 40 6 102AM Residential 131 17 2 3(maximum Non-Residential 7 1 0 0residential Commute 0 0 0 0occupancy) Total 138 18 2 32PM Residential 35 5 0 1(max educational, Non-Residential 244 47 6 11industrial, and Commute 0 0 0 0commercial) Total 279 52 6 125PM (peakcommute time)Residential 42 5 0 1Non-Residential 90 17 2 4Commute 0 0 1 0Total 132 23 3 5HAZUS also estimates the damage to other critical facilities in the City, including schools, fireand police stations, and the emergency operations center. According to the model, anearthquake on the Mojave segment <strong>of</strong> the San Andreas fault is not going to damage any <strong>of</strong> theschools, fire or police stations, or the City’s emergency operations center. All <strong>of</strong> these facilitieswould be fully functional the day after the earthquake.An earthquake on the Sierra Madre fault is anticipated to cause at least moderate damage toseven schools in the City, and none <strong>of</strong> the schools and school district <strong>of</strong>fices in <strong>Glendale</strong> areexpected to be more than 50 percent operational the day after the earthquake. Most <strong>of</strong> the2006 PAGE 6 - 49
Natural <strong>Hazard</strong>s <strong>Mitigation</strong> PlanCity <strong>of</strong> <strong>Glendale</strong>, <strong>California</strong>Section 6 – Earthquakesschools with more than 50 percent moderate damage are located in the northern portion <strong>of</strong> theCity, as illustrated in Map 6.8. The model also indicates that although none <strong>of</strong> the other criticalfacilities will experience more than slight damage, none <strong>of</strong> them would be more than fullyoperational the day after the earthquake.An earthquake on the Verdugo fault is anticipated to cause at least moderate damage to oneschool in the City – <strong>Glendale</strong> High (see Map 6.8), which according to the HAZUS inventory,also houses the <strong>Glendale</strong> Cosmetology School. The model indicates that none <strong>of</strong> the othercritical facilities in the City will experience more than slight damage, but with the exception <strong>of</strong>one hospital, none <strong>of</strong> the critical facilities (including fire stations and the emergency operationscenter) will be more than 50 percent functional the day after the earthquake.An earthquake on the Raymond fault is expected to also damage <strong>Glendale</strong> High. Damage to theother critical facilities in the City is expected to be less severe than that caused by earthquakeson either the Sierra Madre or Verdugo faults, but few facilities are expected to be more than 50percent operational the day after the earthquake.Economic Losses - The model estimates that total building-related losses in the City <strong>of</strong><strong>Glendale</strong> will range from $83 million for an earthquake on the San Andreas fault, to $853million for an earthquake on the Verdugo fault. Approximately 20 percent <strong>of</strong> these estimatedlosses would be related to business interruption in the city. By far, the largest loss would besustained by the residential occupancies that make up as much as 60 percent <strong>of</strong> the total loss.Table 6-9 below provides a summary <strong>of</strong> the estimated economic losses anticipated as a result <strong>of</strong>each <strong>of</strong> the earthquake scenarios considered herein.ScenarioTable 6-9: Estimated Economic LossesProperty DamageBusinessInterruptionTotalSan Andreas $69.8 Million $13.5 Million $83.3 MillionSierra Madre $639.7 Million $158.2 Million $797.8 MillionVerdugo $680.4 Million $72.7 Million $853.0 MillionRaymond $560.1 Million $127.6 Million $687.7 Million2006 PAGE 6 - 50
Natural <strong>Hazard</strong>s <strong>Mitigation</strong> Plan Section 6 – EarthquakesCity <strong>of</strong> <strong>Glendale</strong>, <strong>California</strong>Map 6.8: Distribution and Severity <strong>of</strong> Damaged Schools in <strong>Glendale</strong>as a Result <strong>of</strong> Three Different Earthquake Scenarios(Damage is defined as more than 50% <strong>of</strong> the structure has undergone moderate, extensive, and/or complete damage)2006 PAGE 6 - 51
Natural <strong>Hazard</strong>s <strong>Mitigation</strong> PlanCity <strong>of</strong> <strong>Glendale</strong>, <strong>California</strong>Section 6 – EarthquakesShelter Requirement - HAZUS estimates that approximately 1,300 households in<strong>Glendale</strong> may be displaced due to the Verdugo earthquake modeled for this study (ahousehold contains four people, on average). About 980 people will seek temporaryshelter in public shelters. The rest <strong>of</strong> the displaced individuals are anticipated to seekshelter with family or friends. An earthquake on the Sierra Madre fault is anticipated todisplace nearly 1,200 households, with approximately 900 people seeking temporaryshelter. An earthquake on the San Andreas fault is not expected to displace anyhouseholds.ScenarioTable 6-10: Estimated Shelter RequirementsDisplacedHouseholdsPeople NeedingShort-Term ShelterSan Andreas - Mojave Segment 0 0Sierra Madre 1,179 886Verdugo 1,303 980Raymond 945 738Transportation Damage – Damage to transportation systems in the city <strong>of</strong> <strong>Glendale</strong> isbased on a generalized inventory <strong>of</strong> the region as described in Table 6-11. Roadsegments are assumed to be damaged by ground failure only; therefore, the numberspresented herein may be low given that, based on damage observed from the Northridgeand San Fernando earthquakes, strong ground shaking can cause considerable damageto bridges. Economic losses due to bridge damage are estimated at between $0.8million (for an earthquake on the San Andreas fault) to $24.4 million for an earthquakeon the Sierra Madre fault.The San Andreas fault earthquake scenario estimates that only 1 <strong>of</strong> the 143 bridges inthe study area will experience at least moderate damage, but this bridge is expected tobe more than 50 percent functional by the next day. The San Andreas earthquakescenario indicates that the Burbank airport will experience some economic losses, butthat its functionality will not be impaired.Alternatively, an earthquake on the Sierra Madre fault is expected to damage about 27bridges in the <strong>Glendale</strong> area, with 5 <strong>of</strong> them considered to be completely damaged.Temporary repairs are expected to make all but 2 <strong>of</strong> the bridge locations more than 50percent functional one day after the earthquake. Seven days after the earthquake, allbridge locations would be more than 50 percent functional. The Burbank airport isexpected to incur losses <strong>of</strong> about $1.8 million, but the airport will be functional. TheSierra Madre fault earthquake scenario is the worst-case for the transportation systemin the city. The damage to bridges as a result <strong>of</strong> earthquakes on the Sierra Madre,Verdugo and Raymond faults is illustrated in Map 6.9.2006 PAGE 6 - 52
Natural <strong>Hazard</strong>s <strong>Mitigation</strong> Plan Section 6 – EarthquakesCity <strong>of</strong> <strong>Glendale</strong>, <strong>California</strong>Map 6.9: Distribution and Severity <strong>of</strong> Damaged Bridges in <strong>Glendale</strong>as a Result <strong>of</strong> Three Different Earthquake Scenarios2006 PAGE 6 - 53
Natural <strong>Hazard</strong>s <strong>Mitigation</strong> PlanCity <strong>of</strong> <strong>Glendale</strong>, <strong>California</strong>Section 6 – EarthquakesA maximum magnitude earthquake on the Verdugo fault is modeled to damage about 25bridges in the city, with 4 <strong>of</strong> them considered completely damaged. However, as before,all but 2 <strong>of</strong> the bridge locations are expected to be functional by the next day. TheRaymond and Hollywood fault earthquake scenarios model some damage to the<strong>Glendale</strong> transportation system, but less than that caused by either the Sierra Madre orVerdugo earthquakes discussed above.Table 6-11: Expected Damage to Transportation SystemsScenario System Segments inInventorySan AndreasReplacementValue for AllSegments inInventoryWith AtLeastModerateDamageWithCompleteDamageEconomicLoss ($M)>50 percentFunctionalafter 1 DayHighway Major Roads 5 $2.8 Billion 0 0 0 5Bridges 143 $419 Million 1 0 0.8 143Railways Tracks 2 $19 Million 0 0 0 2Airport Facilities 4 $8 Million 0 0 0.3 4Sierra MadreVerdugoHighway Major Roads 5 $2.8 Billion 0 0 0 5Bridges 143 $419 Million 27 5 24.4 143Railways Tracks 2 $19 Million 0 0 0 2Airport Facilities 4 $8 Million 2 0 1.8 4Highway Major Roads 5 $2.8 Billion 0 0 0 5Bridges 143 $419 Million 25 4 23.3 141Railways Tracks 2 $19 Million 0 0 0 2Airport Facilities 4 $8 Million 1 0 1.7 4RaymondHighway Major Roads 5 $2.8 Billion 0 0 0 5Bridges 143 $419 Million 13 2 12.1 143Railways Tracks 2 $19 Million 0 0 0 2Airport Facilities 4 $8 Million 1 0 1.6 4Utility Systems Damage - The HAZUS inventory for the <strong>Glendale</strong> area does not includespecifics regarding the various lifeline systems in the city, therefore, the model estimateddamage to the potable water and electric power using empirical relationships based on thenumber <strong>of</strong> households served in the area. The results <strong>of</strong> the analyses regarding thefunctionality <strong>of</strong> the potable water and electric power systems in the city for the four mainearthquakes discussed herein are presented in Table 6-12. According to the models, all <strong>of</strong> theearthquake scenarios will impact the electric power systems; thousands <strong>of</strong> households in the cityare expected to not have electric power even three days after an earthquake on any <strong>of</strong> the faultsdiscussed in this report. An earthquake on either the Sierra Madre or Verdugo fault isanticipated to leave as many as 9,000 households without electricity for more than one week.The potable water system is anticipated to do better, but nearly 8,000 households are expectedto be without water for at least 3 days after the earthquake. These results suggest that the citywill have to truck in water into some <strong>of</strong> the residential neighborhoods in the northern portion <strong>of</strong>the city until the damages to the system are repaired. Residents are advised to have drinking2006 PAGE 6 - 54
Natural <strong>Hazard</strong>s <strong>Mitigation</strong> PlanCity <strong>of</strong> <strong>Glendale</strong>, <strong>California</strong>Section 6 – Earthquakeswater stored in their earthquake emergency kits, enough to last all members <strong>of</strong> the household(including pets) for at least 3 days.Table 6-12: Expected Performance <strong>of</strong> Potable Water and Electricity ServicesNumber <strong>of</strong> Households without Service*Scenario Utility Day 1 Day 3 Day 7 Day 30 Day 90San AndreasPotable Water 0 0 0 0 0Electricity 10,215 1,440 69 0 0Sierra MadrePotable Water 16,145 7,933 0 0 0Electricity 45,389 26,431 9,695 376 0VerdugoPotable Water 11,060 4,189 0 0 0Electricity 45,250 26,154 9,449 332 0RaymondPotable Water 4,334 52 0 0 0Electricity 43,850 24,845 8,868 322 0*Based on Total Number <strong>of</strong> Households = 68,186.Debris Generation - The model estimates that a total <strong>of</strong> 620 – 1,710 thousand tons <strong>of</strong> debriswill be generated. Of the total amount, brick and wood comprise 28 percent <strong>of</strong> the total, withthe remainder consisting <strong>of</strong> reinforced concrete and steel. If the debris tonnage is converted toan estimated number <strong>of</strong> truckloads, it will require 25,000 – 69,000 truckloads (@25 tons/truck)to remove the debris generated by the earthquakes modeled.Existing <strong>Mitigation</strong> ActivitiesExisting mitigation activities include current mitigation programs and activities that are beingimplemented by county, regional, <strong>State</strong>, or Federal agencies or organizations.<strong>California</strong> Earthquake <strong>Mitigation</strong> Legislation:<strong>California</strong> is painfully aware <strong>of</strong> the threats it faces from earthquakes. Since the 1800s,<strong>California</strong>ns have been killed, injured, and lost property as a result <strong>of</strong> earthquakes. As the<strong>State</strong>’s population continues to grow, and urban areas become even more densely built up, therisk will continue to increase. In response to this concern, for decades now the Legislature haspassed laws to strengthen the built environment and protect the citizens. Table 6-13 provides asampling <strong>of</strong> some <strong>of</strong> the 200 plus laws in the <strong>State</strong>’s codes.2006 PAGE 6 - 55
Natural <strong>Hazard</strong>s <strong>Mitigation</strong> PlanCity <strong>of</strong> <strong>Glendale</strong>, <strong>California</strong>Section 6 – EarthquakesTable 6-13: Partial List <strong>of</strong> the Over 200 <strong>California</strong> Laws on Earthquake SafetyGovernment Code Section8870-8870.95Government Code Section8876.1-8876.10Public Resources CodeSection 2800-2804.6Public Resources CodeSection 2810-2815Health and Safety CodeSection 16100-16110Government Code Section8871-8871.5Health and Safety CodeSection 130000-130025Public Resources CodeSection 2805-2808Government Code Section8899.10-8899.16Public Resources CodeSection 2621-2630 2621.Government Code Section8878.50-8878.52 8878.50.Education Code Section35295-35297 35295.Health and Safety CodeSection 19160-19169Health and Safety CodeSection 1596.80-1596.879Creates Seismic Safety Commission.Established the <strong>California</strong> Center for Earthquake EngineeringResearch.Authorized a prototype earthquake prediction system along the centalSan Andreas fault near the City <strong>of</strong> Parkfield.Continued the Southern <strong>California</strong> Earthquake Preparedness Projectand the Bay Area Regional Earthquake Preparedness Project.The Seismic Safety Commission and <strong>State</strong> Architect, will develop astate policy on acceptable levels <strong>of</strong> earthquake risk for new and existingstate-owned buildings.Established the <strong>California</strong> Earthquake <strong>Hazard</strong>s Reduction Act <strong>of</strong> 1986.Defined earthquake performance standards for hospitals.Established the <strong>California</strong> Earthquake Education Project.Established the Earthquake Research Evaluation Conference.Established the Alquist-Priolo Earthquake Fault Zoning Act.Created the Earthquake Safety and Public Buildings RehabilitationBond Act <strong>of</strong> 1990.Established emergency procedure systems in kindergarten throughgrade 12 in all the public or private schools.Established standards for seismic retr<strong>of</strong>itting <strong>of</strong> unreinforced masonrybuildings.Required all child day care facilities to include an EarthquakePreparedness Checklist as an attachment to their disaster plan.City <strong>of</strong> <strong>Glendale</strong> Codes:Implementation <strong>of</strong> earthquake mitigation policy most <strong>of</strong>ten takes place at the local governmentlevel. The City <strong>of</strong> <strong>Glendale</strong> Engineering Department, Building and Safety Division enforcesbuilding codes pertaining to earthquake hazards. The City has adopted the provisions <strong>of</strong> themost current version <strong>of</strong> the <strong>California</strong> Building Code (CBC), with more restrictive amendmentsbased upon local geographic, topographic or climatic conditions. The City <strong>of</strong> <strong>Glendale</strong>, alongwith 55 other local jurisdictions, have worked together to make these amendments to the<strong>California</strong> Building Code consistent with the rest <strong>of</strong> southern <strong>California</strong>. Currently, <strong>Glendale</strong>’sBuilding and Safety staff are very active in the code development process and all regionalactivities to improve the technical provisions <strong>of</strong> the building code and the understanding <strong>of</strong> thepurpose <strong>of</strong> the building codes by the public. They participate in the Los Angeles RegionalUniform Code Program, (LARUCP), and promote the adoption <strong>of</strong> uniform amendments to theCBC by other local jurisdictions.The City <strong>of</strong> <strong>Glendale</strong> Planning Department enforces the zoning and land use regulationsrelating to earthquake hazards. Generally, these codes and regulations seek to discouragedevelopment in areas that could be prone to flooding, landslide, wildfire and / or seismichazards; and where development is permitted, that the applicable construction standards aremet. Developers in hazard-prone areas may be required to retain a qualified pr<strong>of</strong>essionalengineer to evaluate level <strong>of</strong> risk on the site and recommend appropriate mitigation measures.2006 PAGE 6 - 56
Natural <strong>Hazard</strong>s <strong>Mitigation</strong> PlanCity <strong>of</strong> <strong>Glendale</strong>, <strong>California</strong>Section 6 – EarthquakesBusinesses/Private Sector:Natural hazards have a devastating impact on businesses. In fact, <strong>of</strong> all businesses which closefollowing a disaster, more than forty-three percent never reopen, and an additional twenty-ninepercent close for good within the next two years. The Institute <strong>of</strong> Business and Home Safety hasdeveloped “Open for Business,” a disaster planning toolkit to help guide businesses in preparingfor and dealing with the adverse affects natural hazards. The kit integrates protection fromnatural disasters into the company's risk reduction measures to safeguard employees, customers,and the investment itself. The guide helps businesses secure human and physical resourcesduring disasters, and helps to develop strategies to maintain business continuity before, during,and after a disaster occurs.Hospitals:“The Alfred E. Alquist Hospital Seismic Safety Act (“Hospital Act”) was enacted in 1973 inresponse to the moderate Magnitude 6.6 Sylmar Earthquake in 1971 when four major hospitalcampuses were severely damaged and evacuated. Two hospital buildings collapsed killing fortyseven people. Three others were killed in another hospital that nearly collapsed.In approving the Act, the Legislature noted that: “Hospitals, that house patients who have lessthan the capacity <strong>of</strong> normally healthy persons to protect themselves, and that must bereasonably capable <strong>of</strong> providing services to the public after a disaster, shall be designed andconstructed to resist, ins<strong>of</strong>ar as practical, the forces generated by earthquakes, gravity andwinds.” (Health and Safety Code Section 129680)When the Hospital Act was passed in 1973, the <strong>State</strong> anticipated that, based on the regular andtimely replacement <strong>of</strong> aging hospital facilities, the majority <strong>of</strong> hospital buildings would be incompliance with the Act’s standards within 25 years. However, hospital buildings were not, andare not, being replaced at that anticipated rate. In fact, the great majority <strong>of</strong> the <strong>State</strong>’s urgentcare facilities are now more than 40 years old.The moderate magnitude 6.7 Northridge Earthquake in 1994 caused $3 billion in hospitalrelateddamage and evacuations. Twelve hospital buildings constructed before the Act werecited (red tagged) as unsafe for occupancy after the earthquake. Those hospitals that had beenbuilt in accordance with the 1973 Hospital Act were very successful in resisting structuraldamage. However, nonstructural damage (for example, plumbing and ceiling systems) was stillextensive in those post-1973 buildings.Senate Bill 1953 (“SB 1953”), enacted in 1994 after the Northridge Earthquake, expanded thescope <strong>of</strong> the 1973 Hospital Act. Under SB 1953, all hospitals are required, as <strong>of</strong> January 1, 2008,to survive earthquakes without collapsing or posing the threat <strong>of</strong> significant loss <strong>of</strong> life. The1994 Act further mandates that all existing hospitals be seismically evaluated, and retr<strong>of</strong>itted, ifneeded, by 2030, so that they are in substantial compliance with the Act (which requires that thehospital buildings be reasonably capable <strong>of</strong> providing services to the public after disasters). SB1953 applies to all urgent care facilities (including those built prior to the 1973 Hospital Act)and affects approximately 2,500 buildings on 475 campuses.SB 1953 directed the Office <strong>of</strong> <strong>State</strong>wide Health Planning and Development (OSHPD), inconsultation with the Hospital Building Safety Board, to develop emergency regulationsincluding “…earthquake performance categories with subgradations for risk to life, structuralsoundness, building contents, and nonstructural systems that are critical to providing basicservices to hospital inpatients and the public after a disaster.” (Health and Safety Code Section130005)2006 PAGE 6 - 57
Natural <strong>Hazard</strong>s <strong>Mitigation</strong> PlanCity <strong>of</strong> <strong>Glendale</strong>, <strong>California</strong>Section 6 – EarthquakesMore recently, in 2001, recognizing the continuing need to assess the adequacy <strong>of</strong> policies andthe application <strong>of</strong> advances in technical knowledge and understanding, the <strong>California</strong> SeismicSafety Commission created an Ad Hoc Committee to re-examine the compliance with theAlquist Hospital Seismic Safety Act. The formation <strong>of</strong> the Committee was also prompted by therecent evaluations <strong>of</strong> hospital buildings reported to OSHPD that revealed that a largepercentage (40%) <strong>of</strong> <strong>California</strong>’s operating hospitals are in the highest category <strong>of</strong> collapse risk.”Earthquake Education:Earthquake research and education activities are conducted at several major universities in theSouthern <strong>California</strong> region, including Cal Tech, USC, UCLA, UCSB, UCI, and UCSB.The local clearinghouse for earthquake information is the Southern <strong>California</strong> EarthquakeCenter (SCEC) located at the University <strong>of</strong> Southern <strong>California</strong>, Los Angeles, CA 90089,Telephone: (213) 740-5843, Fax: (213) 740-0011, Email: SCEinfo@usc.edu, <strong>Web</strong>site:http://www.scec.org. The Southern <strong>California</strong> Earthquake Center (SCEC) is a community <strong>of</strong>scientists and specialists who actively coordinate research on earthquake hazards at nine coreinstitutions, and communicate earthquake information to the public. SCEC is a National ScienceFoundation (NSF) Science and Technology Center and is co-funded by the United <strong>State</strong>sGeological Survey (USGS).In addition, Los Angeles County, along with other Southern <strong>California</strong> counties, sponsors theEmergency Survival Program (ESP), an educational program for learning how to prepare forearthquakes and other disasters. Many school districts have very active emergencypreparedness programs that include earthquake drills and periodic disaster response teamexercises.Earthquake <strong>Mitigation</strong> Action ItemsThe Earthquake mitigation action items provide guidance on suggesting specific activities thatagencies, organizations, and residents in the city <strong>of</strong> <strong>Glendale</strong> can undertake to reduce risk andprevent loss from earthquake events. Each action item is followed by ideas for implementation,which can be used by the steering committee and local decision makers in pursuing strategiesfor implementation.Short Term - Earthquake # 1:Action Item: Integrate new earthquake hazard mapping data for the city <strong>of</strong> <strong>Glendale</strong> andimprove technical analysis <strong>of</strong> earthquake hazards.2006 PAGE 6 - 58
Natural <strong>Hazard</strong>s <strong>Mitigation</strong> PlanCity <strong>of</strong> <strong>Glendale</strong>, <strong>California</strong>Section 6 – EarthquakesIdeas for Implementation:• Update the city <strong>of</strong> <strong>Glendale</strong> earthquake HAZUS scenarios using City-specific data, suchas building inventories, geologic materials and depth to ground water, to improveaccuracy <strong>of</strong> the vulnerability assessment for <strong>Glendale</strong>.• Conduct risk analysis incorporating HAZUS data and hazard maps using GIStechnology to identify risk sites and further assist in prioritizing mitigation activitiesand assessing the adequacy <strong>of</strong> current land use requirements.Coordinating Organization:Timeline:Plan Goals Addressed:Constraints:Public Works Geographic Information Systems2 yearsPartnerships and Implementation, Protect Life andPropertyPending Funding and Available PersonnelShort Term – Earthquake # 2:Action Item: Incorporate the Regional Earthquake Transportation Evacuation Routesdeveloped by the Regional Emergency Managers Group into appropriate planning documents.Ideas for Implementation:• Update the transportation routes map in the City <strong>of</strong> <strong>Glendale</strong> Natural <strong>Hazard</strong><strong>Mitigation</strong> Plan with the evacuation routes data.• Integrate the evacuation routes data into the City <strong>of</strong> <strong>Glendale</strong> Emergency OperationsPlan.Coordinating Organization:Timeline:Plan Goals Addressed:Constraints:Emergency Services, Police2 yearsEmergency ServicesPending Funding and Available PersonnelLong Term - Earthquake # l:Action Item: Identify funding sources for structural and nonstructural retr<strong>of</strong>itting <strong>of</strong>structures that are identified as seismically vulnerable.Ideas for Implementation:♦ Provide information for property owners, small businesses, and organizations onsources <strong>of</strong> funds (loans, grants, etc.).♦ Explore options for including seismic retr<strong>of</strong>itting in existing programs such as lowincomehousing, insurance reimbursements, and pre and post disaster repairs.Coordinating Organization:Timeline:Plan Goals Addressed:Constraints:<strong>Hazard</strong> <strong>Mitigation</strong> Advisory CommitteeOngoingPartnerships and Implementation, Public AwarenessPending funding and available personnel2006 PAGE 6 - 59
Natural <strong>Hazard</strong>s <strong>Mitigation</strong> PlanCity <strong>of</strong> <strong>Glendale</strong>, <strong>California</strong>Section 6 – EarthquakesLong Term - Earthquake #2:Action Item: Encourage purchase <strong>of</strong> earthquake hazard insurance.Ideas for Implementation:• Provide earthquake insurance information to <strong>Glendale</strong> residents.• Coordinate with insurance companies to produce and distribute earthquake insuranceinformation.Coordinating Organization:Timeline:Plan Goals Addressed:Constraints:<strong>Hazard</strong> <strong>Mitigation</strong> Advisory CommitteeOngoingProtect Life and Property, Public AwarenessPending funding and available personnelLong Term - Earthquake # 3:Action Item: Encourage seismic strength evaluations <strong>of</strong> critical facilities in <strong>Glendale</strong> toidentify vulnerabilities for mitigation <strong>of</strong> schools and universities, public infrastructure, andcritical facilities to meet current seismic standards.Ideas for Implementation:♦ Develop an inventory <strong>of</strong> schools, universities, and critical facilities that do not meetcurrent seismic standards.♦ Encourage owners <strong>of</strong> non-retr<strong>of</strong>itted structures to upgrade them to meet seismicstandards.♦ Encourage water providers to replace old cast iron pipes with more ductile iron, andidentify partnership opportunities with other agencies for pipe replacement.Coordinating Organization:Timeline:Plan Goals Addressed:Constraints:<strong>Hazard</strong> <strong>Mitigation</strong> Advisory Committee, Building andSafety, Public Works5 yearsProtect Life and Property, Emergency ServicesPending funding and available personnelLong Term - Earthquake # 4:Action Item: Encourage reduction <strong>of</strong> nonstructural and structural earthquake hazards inhomes, schools, businesses, and government <strong>of</strong>fices.2006 PAGE 6 - 60
Natural <strong>Hazard</strong>s <strong>Mitigation</strong> PlanCity <strong>of</strong> <strong>Glendale</strong>, <strong>California</strong>Section 6 – EarthquakesIdeas for Implementation:♦ Provide information to government building and school facility managers and teacherson securing bookcases, filing cabinets, light fixtures, and other objects that can causeinjuries and block exits.♦ Encourage facility managers, business owners, and teachers to refer to FEMA'spractical guidebook: “Reducing the Risks Nonstructural Earthquake Damage.”♦ Encourage homeowners and renters to use “Is Your Home Protected from EarthquakeDisaster? A Homeowner’s Guide to Earthquake Retr<strong>of</strong>it” (IBHS) for economic andefficient mitigation techniques.♦ Explore partnerships to provide retr<strong>of</strong>itting classes for homeowners, renters, buildingpr<strong>of</strong>essionals, and contractors.♦Target development located in potential fault zones or in unstable soils for intensiveeducation and retr<strong>of</strong>itting resources.Coordinating Organization:Timeline:Plan Goals Addressed:Constraints:<strong>Hazard</strong> <strong>Mitigation</strong> Advisory CommitteeOngoingProtect Life and Property, Public AwarenessPending funding and available personnelEarthquake Resource DirectoryLocal and Regional ResourcesLos Angeles County Public Works DepartmentLevel: County <strong>Hazard</strong>: Multi http://ladpw.org900 S. Fremont Ave.<strong>Glendale</strong>, CA 91803 Ph: 626-458-5100 Fx:Notes: The Los Angeles County Department <strong>of</strong> Public Works protects property and promotespublic safety through Flood Control, Water Conservation, Road Maintenance, Bridges, Busesand Bicycle Trails, Building and Safety, Land Development, Waterworks, Sewers,Engineering, Capital Projects and AirportsSouthern <strong>California</strong> Earthquake Center (SCEC)Level: Regional <strong>Hazard</strong>: Earthquake www.scec.org3651 Trousdale Parkway Suite 169Los Angeles, CA 90089-0742 Ph: 213-740-5843 Fx: 213-740-0011Notes: The Southern <strong>California</strong> Earthquake Center (SCEC) gathers new information aboutearthquakes in Southern <strong>California</strong>, integrates this information into a comprehensive andpredictive understanding <strong>of</strong> earthquake phenomena, and communicates this understanding toend-users and the general public in order to increase earthquake awareness, reduce economiclosses, and save lives.2006 PAGE 6 - 61
Natural <strong>Hazard</strong>s <strong>Mitigation</strong> PlanCity <strong>of</strong> <strong>Glendale</strong>, <strong>California</strong>Section 6 – Earthquakes<strong>State</strong> Resources<strong>California</strong> Department <strong>of</strong> Transportation (CalTrans)Level: <strong>State</strong> <strong>Hazard</strong>: Multi http://www.dot.ca.gov/120 S. Spring StreetLos Angeles, CA 90012 Ph: 213-897-3656 Fx:Notes: CalTrans is responsible for the design, construction, maintenance, and operation <strong>of</strong> the<strong>California</strong> <strong>State</strong> Highway System, as well as that portion <strong>of</strong> the Interstate Highway Systemwithin the state's b oundaries. Alone and in partnership with Amtrak, CalTrans is alsoinvolved in the support <strong>of</strong> intercity passenger rail service in Calif ornia.<strong>California</strong> Resources AgencyLevel: <strong>State</strong> <strong>Hazard</strong>: Multi http://resources.ca.gov/1416 Ninth Street Suite 1311Sacramento, CA 95814Ph: 916-653-5656Notes: The <strong>California</strong> Resources Agency restores, protects and manages the state's natural,historical and cultural resources for current and future generations using solutions based onscience, collaboratio n and respect for all the communities and interests involved.<strong>California</strong> Geological SurveyLevel: <strong>State</strong> <strong>Hazard</strong>: Multi www.consrv.ca.gov/cgs/index.htm801 K Street MS 12-30Sacramento, CA 95814Fx:Ph: 916-445-1825 Fx: 916-445-5718Notes: The <strong>California</strong> Geological Survey develops and disseminates technical information andadvice on <strong>California</strong>’s geology, geologic hazards, and mineral resources.<strong>California</strong> Department <strong>of</strong> Conservation: Southern <strong>California</strong> Regional OfficeLevel: <strong>State</strong> <strong>Hazard</strong>: Multi www.consrv.ca.gov655 S. Hope Street #700Los Angeles, CA 90017-2321 Ph: 213-239-0878 Fx: 213-239-0984Notes: The Department <strong>of</strong> Conservation provides services and information that promoteenvironmental health, economic vitality, informe d land-use decisions and sound management<strong>of</strong> our state's natural resources.<strong>California</strong> Planning Information NetworkLevel: <strong>State</strong> <strong>Hazard</strong>: Multi www.calpin.ca.govNotes: The Governor's Office <strong>of</strong> Planning and Research (OPR) publishesbasic information onlocal planning agencies, known as the <strong>California</strong> Planners' Book <strong>of</strong> Lists. This local planninginformation is available on-line with new search capabilities and up-to-the- minute updates.2006 PAGE 6 - 62
Natural <strong>Hazard</strong>s <strong>Mitigation</strong> PlanCity <strong>of</strong> <strong>Glendale</strong>, <strong>California</strong>Section 6 – EarthquakesGovernor’s Office <strong>of</strong> Emergency Services (OES)Level: <strong>State</strong> <strong>Hazard</strong>: Multi www.oes.ca.govP.O. Box 419047Rancho Cordova, CA 95741-9047 Ph: 916 845- 8911 Fx: 916 845- 8910Notes: The Governor's Office <strong>of</strong> Emergency Services coordinates overall state agencyresponse to major disasters in support <strong>of</strong> local government. The <strong>of</strong>fice is responsible forassuring the state's readiness to respond to and recover from natural, manmade, and war-and for assisting local governments in their emergency preparedness,caused emergencies,response and recovery efforts.Federal and National ResourcesBuilding Seismic Safety Council (BSSC)Level: <strong>Hazard</strong>: Earthquakewww.bssconline.orgNational1090 Vermont Ave., NWWashington, DC 20005Suite 700Ph: 202-289-7800 Fx: 202-289-109Notes: The Building Seismic Safety Council (BSSC) develops and promotes buildingearthquake risk mitigation regulatory provisions for the nation.Federal Emergency Management Agency, Region IXLevel: Federal1111 Broadway<strong>Hazard</strong>: Multi www.fema.govSuite 1200Oakland, CA 94607 Ph: 510-627-7100 Fx: 510-627-7112Notes: The Federal Emergency Management Agency is tasked with responding to, planningfor, recovering from and mitigating against disasters.2006 PAGE 6 - 63
Natural <strong>Hazard</strong>s <strong>Mitigation</strong> PlanCity <strong>of</strong> <strong>Glendale</strong>, <strong>California</strong>Section 6 – EarthquakesFederal Emergency Management Agency, <strong>Mitigation</strong> DivisionLevel: Federal <strong>Hazard</strong>: Multi www.fema.gov/fima/planhowto.shtm500 C Street, S.W.Washington, D.C. 20472 Ph: 202-566-1600 Fx:Notes: The <strong>Mitigation</strong> Division manages the National Flood Insurance Program and overseesFEMA's mitigation programs. It has a number <strong>of</strong> programs and activities which provide citizensProtection, with flood insurance; Prevention, with mitigation measures and Partnerships, withcommunities throughout the country.United <strong>State</strong>s Geological SurveyLevel: Federal <strong>Hazard</strong>: Multi http://www.usgs.gov/345 Middlefield RoadMenlo Park, CA 94025 Ph: 650-853-8300 Fx:Notes: The USGS provides reliable scientific information to describe and understand theEarth; minimize loss <strong>of</strong> life and property from natural disasters; manage water, biological,energy, and mineral resources; and enhance and protect our quality <strong>of</strong> life.Western <strong>State</strong>s Seismic Policy Council (WSSPC)Level: <strong>Hazard</strong>: Earthquake www.wsspc.org/home.htmlRegional125 <strong>California</strong> Avenue Suite D201, #1Palo Alto, CA 94306 Ph: 650-330-1101 Fx: 650-326-1769Notes: WSSPC is a regional earthquake consortium funded mainly by FEMA. Its website isa great resource, with information clearly categorized - from policy to engineering toeducation.Institute for Business & Home SafetyLevel: <strong>Hazard</strong>: MultiNational4775 E. Fowler Avenuehttp://www.ibhs.org/Tampa, FL 33617 Ph: 813-286-3400 Fx: 813-286-9960The Institute for Business & Home Safety (IBHS) is a nonpr<strong>of</strong>it association that engages incommunication, education, engineering and research. The Institute works to reduce deaths,injuries, property damage, economic losses and human suffering caused by natural disasters.Publications:“Land Use Planning for Earthquake <strong>Hazard</strong> <strong>Mitigation</strong>: Handbook for Planners” by Wolfe,Myer R. et. al., (1986) University <strong>of</strong> Colorado, Institute <strong>of</strong> Behavioral Science, NationalScience Foundation.This handbook provides techniques that planners and others can utilize to help mitigate forseismic hazards, It provides information on the effects <strong>of</strong> earthquakes, sources on riskassessment, and effects <strong>of</strong> earthquakes on the built environment. The handbook also gives2006 PAGE 6 - 64
Natural <strong>Hazard</strong>s <strong>Mitigation</strong> PlanCity <strong>of</strong> <strong>Glendale</strong>, <strong>California</strong>Section 6 – Earthquakesexamples on application and implementation <strong>of</strong> planning techniques to be used by localcommunities.Contact: Natural <strong>Hazard</strong>s Research and Applications Information CenterAddress: University <strong>of</strong> Colorado, 482 UCB, Boulder, CO 80309-0482Phone: (303) 492-6818Fax: (303) 492-2151<strong>Web</strong>site: http://www,colorado.edu/UCB/Research/IBS/hazards“Public Assistance Debris Management Guide”, FEMA (July 2000).The Debris Management Guide was developed to assist local <strong>of</strong>ficials in planning, mobilizing,organizing. and controlling large-scale debris clearance, removal, and disposal operations,Debris management is generally associated with post-disaster recovery. While it should becompliant with local and county emergency operations plans, developing strategies to ensurestrong debris management is a way to integrate debris management within mitigation activities.The “Public Assistance Debris Management Guide” is available in hard copy or on the FEMAwebsite.2006 PAGE 6 - 65
Natural <strong>Hazard</strong>s <strong>Mitigation</strong> PlanCity <strong>of</strong> <strong>Glendale</strong>, <strong>California</strong>SECTION 7:Section 7 – WildfiresWILDFIRESTable <strong>of</strong> ContentsWhy Are Wildfires A Threat To <strong>Glendale</strong>? ................................................................ 7-1Wildfire Characteristics ...............................................................................................................7-5Wildfire <strong>Hazard</strong> Identification ...................................................................................................7-8Vulnerability and Risk ................................................................................................................7-12Community Wildfire Issues ..........................................................................................7-14What Is Susceptible to Wildfire?............................................................................................. 7-14Fires After an Earthquake - The Threat <strong>of</strong> Urban Conflagration....................................7-16Wildfire <strong>Mitigation</strong> Activities ..................................................................................................7-17Wildfire <strong>Mitigation</strong> Action Items .............................................................................. 7-27Wildfire Resource Directory .......................................................................................7-32Local Resources ...........................................................................................................................7-32County Resources ........................................................................................................................7-33<strong>State</strong> Resources ............................................................................................................................7-33Federal Resources and Programs ............................................................................................ 7-34Additional Resources ..................................................................................................................7-36Publications ...................................................................................................................................7-362006 PAGE 7 - i
Natural <strong>Hazard</strong>s <strong>Mitigation</strong> PlanCity <strong>of</strong> <strong>Glendale</strong>, <strong>California</strong>SECTION 7:Section 7 – WildfiresWILDFIRESWhy are Wildfires a Threat to <strong>Glendale</strong>?Fires have always been a natural part <strong>of</strong> the ecosystem in southern <strong>California</strong> due to the region’sweather, topography and native vegetation. The typically mild, wet winters characteristic <strong>of</strong> ourMediterranean climate result in an annual growth <strong>of</strong> grasses and plants that dry out during thehot summer months. This dry vegetation <strong>of</strong>ten provides fuel for wildfires in the autumn, whenthe area is intermittently impacted by Santa Ana (or Santana) winds, the hot, dry winds thatblow across the region in the late fall. These winds <strong>of</strong>ten fan and help spread the fires.Furthermore, many <strong>of</strong> our native plants have a high oil content that makes them highlyflammable.Wildland fire is a natural process, and wildfires are a necessary part <strong>of</strong> the natural ecosystem <strong>of</strong>southern <strong>California</strong>. Many <strong>of</strong> the native plants require periodic burning to germinate andrecycle nutrients that enrich the soils. Wildfires become an issue, however, when they extendout <strong>of</strong> control into developed areas, with a resultant loss <strong>of</strong> property, and sometimesunfortunately, loss <strong>of</strong> life. The wildfire risk in the United <strong>State</strong>s has increased in the last fewdecades with the increasing encroachment <strong>of</strong> residences and other structures into the wildlandenvironment, and the increasing number <strong>of</strong> people living and playing in wildland areas. Today,approximately 10 percent <strong>of</strong> all wildland fires in the United <strong>State</strong>s are started by lightningstrikes, with humans causing the rest. The most common causes <strong>of</strong> wildfires are arson, sparksfrom brush-clearing equipment and vehicles, improperly maintained campfires, improperlydisposed cigarettes, and children playing with matches.Wildfires pose a substantial hazard to life and property in communities built within or adjacentto hillsides and mountainous areas, at the urban-wildland interface or UWI. Fires at the UWIcan be particularly dangerous and complex, posing a severe threat to public and firefightersafety, and causing devastating losses <strong>of</strong> life and property because when a wildland fireencroaches onto the built environment, ignited structures can then sustain and transmit the firefrom one building to the next (multiple ignitions develop as a result <strong>of</strong> “branding”, the term forwind transport <strong>of</strong> burning cinders over a distance <strong>of</strong> a mile or more). This is what happened atfour <strong>of</strong> the most devastating fires in <strong>California</strong>: the Oakland Hills/Berkeley Tunnel fire <strong>of</strong>October 1991, the Laguna fire <strong>of</strong> 1970 in northern San Diego County, the Laguna Beach fire <strong>of</strong>1993, and the 2003 firestorms in San Diego and San Bernardino Counties. In the Oakland Hillsfire, 25 lives were lost, and 2,900 structures were damaged for a total <strong>of</strong> $1.7 billion in insuredlosses. The September 1970 fire, which started as a result <strong>of</strong> downed power lines, burned175,425 acres, destroyed 382 structures and killed 5 people. The Laguna Beach fire <strong>of</strong> 1993burned 14,437 acres and destroyed 441 homes, but thankfully no lives were lost. More recently,the 2003 fires destroyed more than 4,800 homes and claimed 22 lives (see next section).Several historical fires have impacted the <strong>Glendale</strong> area and vicinity over the years. In fact, theentire northern two-thirds <strong>of</strong> the city have burned at some time in the last 125 years. Historicalrecords kept by the City and the County <strong>of</strong> Los Angeles indicate that significant acreage wasimpacted by fires in 1878, 1927, 1933, 1964, 1975, and 1980 (see Map 7.1, below). The mostrecent wildland fires in the Verdugo Mountains occurred in September2006 PAGE 7 - 1
Natural <strong>Hazard</strong>s <strong>Mitigation</strong> PlanCity <strong>of</strong> <strong>Glendale</strong>, <strong>California</strong>Section 7 – WildfiresMap 7.1: Historical Wildfires in the <strong>Glendale</strong> Area2002 (the Mountain Incident brush fire which burned 752 acres), and October 2005 (theBurbank fire that burned 700 acres but did not impact any structures). The worst fire in theCity’s history, however, is the College Hills fire <strong>of</strong> June 1990, which burned 100 acres anddestroyed 64 homes in the foothills <strong>of</strong> the San Rafael Hills.2006 PAGE 7 - 2
Natural <strong>Hazard</strong>s <strong>Mitigation</strong> PlanCity <strong>of</strong> <strong>Glendale</strong>, <strong>California</strong>Section 7 – WildfiresHistoric Fires in Southern <strong>California</strong>:As mentioned above, large fires have been part <strong>of</strong> the southern <strong>California</strong> landscape formillennia. Researchers have determined that Native Americans in <strong>California</strong> used fire toreduce fuel load and improve their ability to hunt and forage. It is estimated that asmuch as 12 percent <strong>of</strong> the <strong>State</strong> was burned every year by the various tribes (Coleman,1994). One <strong>of</strong> the largest fires in Los Angeles County (60,000 acres) occurred in 1878,and the largest fire in Orange County’s history, in 1889, burned over half a millionacres. In the early 20 th century, as development started to encroach onto the foothills,wildfires came to be unacceptable as they posed a hazard with the potential loss <strong>of</strong>property and even life. As a result, in the early 1920s, the fire service began to preventwildfires from occurring. Unfortunately, over time, this led to an increase in fuel loads.Wildfires that impact areas with fuel buildup are more intense and significantly moredamaging to the ecosystem than periodic, low-intensity fires. The 20 largest historicfires in <strong>California</strong> for the time period between 1961 and 2003 are listed in Table 7.1below.Table 7.1: Large Historic Fires in <strong>California</strong> for the period 1961-2003(in order <strong>of</strong> number <strong>of</strong> structures damaged)Fire Name Date County Acres Structures Deaths1 Tunnel October 1991 Alameda 1,600 2,900 252 Cedar October 2003 San Diego 273,246 2,820 143 Old October 2003 San Bernardino 91,281 1,003 64 Jones October 1999 Shasta 26,200 954 15 Paint June 1990 Santa Barbara 4,900 641 16 Fountain August 1992 Shasta 63,960 636 07 City <strong>of</strong> Berkeley September 1923 Alameda 130 584 08 Bel Air November 1961 Los Angeles 6,090 484 09 Laguna Fire October 1993 Orange 14,437 441 010 Paradise October 2003 San Diego 56,700 415 211 Laguna September 1970 San Diego 175,425 382 512 Panorama November 1980 San Bernardino 23,600 325 413 Topanga November 1993 Los Angeles 18,000 323 314 49er September 1988 Nevada 33,700 312 015 Simi October 2003 Ventura 108,204 300 016 Sycamore July 1977 Santa Barbara 805 234 017 Canyon September 1999 Shasta 2,580 230 018 Kannan October 1978 Los Angeles 25,385 224 019 Kinneloa October 1993 Los Angeles 5,485 196 119 Grand Prix October 2003 San Bernardino 59,448 196 020 Old Gulch August 1992 Calaveras 17,386 170 0http://www.fire.ca.gov/FireEmergencyResponse/HistoricalStatistics/<strong>PDF</strong>/20LSTRUCTURES.pdf“Structures" is meant to include all loss - homes and outbuildings, etc.The 2003 Southern <strong>California</strong> Fires:The fall <strong>of</strong> 2003 marked the most destructive wildfire season in <strong>California</strong> history (in terms <strong>of</strong>acreage burned). In a ten-day period, 12 separate fires raged across southern <strong>California</strong> in LosAngeles, Riverside, San Bernardino, San Diego and Ventura counties. The massive “Cedar” fire2006 PAGE 7 - 3
Natural <strong>Hazard</strong>s <strong>Mitigation</strong> PlanCity <strong>of</strong> <strong>Glendale</strong>, <strong>California</strong>Section 7 – Wildfiresin San Diego County alone consumed 2,800 homes and burned over a quarter <strong>of</strong> a million acres(see Table 7.2).Table 7.2: October 2003 Firestorm StatisticsCounty FireNameDateBeganAcresBurnedHomesLostHomesDamagedLivesLostRiverside Pass 10/21/03 2,397 3 7 0Los Angeles Padua 10/21/03 10,446 59 0 0San Bernardino Grand Prix 10/21/03 69,894 136 71 0San Diego Roblar 2 10/21/03 8,592 0 0 0Ventura Piru 10/23/03 63,991 8 0 0Los Angeles Verdale 10/24/03 8,650 1 0 0Ventura Simi 10/25/03 108,204 300 11 0San Diego Cedar 10/25/03 273,246 2,820 63 14San Bernardino Old 10/25/03 91,281 1,003 7 6San Diego Otay / 10/26/03 46,000 6 11 0MineRiverside Mountain 10/26/03 10,000 61 0 0San Diego Paradise 10/26/03 56,700 415 15 2Total Losses 749,401 4,812 185 22Source: http://www.fire.ca.gov/php/fire_er_content/downloads/2003LargeFires.pdfThe 2003 <strong>California</strong> fires caused an estimated $975 million in damages, a significant loss. Yet,this loss is still below the cost <strong>of</strong> fighting fires in previous years at the national level. Forexample, during the 2002 fire season, more than 6.9 million acres <strong>of</strong> public and private landsburned in the United <strong>State</strong>s, resulting in loss <strong>of</strong> property, damage to resources and disruption <strong>of</strong>community services. Taxpayers spent more than $1.6 billion to combat more than 88,400 firesnationwide. Many <strong>of</strong> these fires burned in wildland/urban interface areas and exceeded the firesuppression capabilities <strong>of</strong> those areas. Similar losses were reported in the year 2000. Table 7.3summarizes the fire suppression costs for state, private and federal lands for the years 2000through 2002.Table 7.3: National Fire Suppression CostsYear Suppression Costs Acres Burned Structures Burned2000 $1.3 billion 8,422,237 8612001 $0.5 billion 3,570,911 7312002 $1.6 billion 6,937,584 815http://research.yale.edu/gisf/assets/pdf/ppf/wildfire_report.pdfWildfire CharacteristicsThere are three categories <strong>of</strong> interface fire: The classic wildland/urban interface occurs wherewell-defined urban and suburban development presses up against open expanses <strong>of</strong> wildlandareas; the mixed wildland/urban interface characterized by isolated homes, subdivisions andsmall communities situated predominantly in wildland settings; and the occluded2006 PAGE 7 - 4
Natural <strong>Hazard</strong>s <strong>Mitigation</strong> PlanCity <strong>of</strong> <strong>Glendale</strong>, <strong>California</strong>Section 7 – Wildfireswildland/urban interface where islands <strong>of</strong> wildland vegetation occur inside a largely urbanizedarea. Certain conditions must be present for significant interface fires to occur. The mostcommon conditions include: hot, dry and windy weather; the inability <strong>of</strong> fire protection forces tocontain or suppress the fire; the occurrence <strong>of</strong> multiple fires that overwhelm committedresources; and a large fuel load (dense vegetation). Once a fire has started, several conditionsinfluence its behavior, including fuel, topography, weather, and degree <strong>of</strong> development,including dwelling density and accessibility, building construction (with emphasis on the use <strong>of</strong>fire-retardant construction materials and combustible ro<strong>of</strong>s), and the availability <strong>of</strong> localmitigation measures and resources (such as nearby fire stations, fire hydrants, roads, fuelmodification zones, fire sprinklers in structures, etc.). The most significant <strong>of</strong> these conditionsare discussed further below.• The Interface: One challenge southern <strong>California</strong> faces regarding its wildfire hazard isthe result <strong>of</strong> the increasing number <strong>of</strong> houses being built at the urban/wildlandinterface. Every year the growing population has expanded farther and farther into thehills and mountains, including forest lands. The increased "interface" betweenurban/suburban areas and the open spaces created by this expansion have produced asignificant increase in threats to life and property from fires, and have pushed existingfire protection systems beyond original or current design and capability. Propertyowners in the interface are not aware <strong>of</strong> the problems and threats they face. Therefore,many owners have done very little to manage or <strong>of</strong>fset the fire hazards on their ownproperties. Furthermore, human activities increase the incidence <strong>of</strong> fire ignition andpotential damage.• Fuel: Fuel is the material that feeds a fire and is a key factor in wildfire behavior. Fuelis classified by volume and by type. Volume is described in terms <strong>of</strong> "fuel loading," orthe amount <strong>of</strong> available vegetative fuel.The type <strong>of</strong> fuel also influences wildfire. Southern <strong>California</strong> has two distinct areas <strong>of</strong>risk for wildland fire: 1) The foothills and lower mountain areas most <strong>of</strong>ten coveredwith scrub brush or chaparral, and 2) the forested terrain at higher elevations, in themountains.Chaparral is a primary fuel <strong>of</strong> southern <strong>California</strong> wildfires. In southern <strong>California</strong>,chaparral habitat ranges in elevation from near sea level to over 5,000 feet. Chaparralcommunities experience long dry summers and receive most <strong>of</strong> their annualprecipitation from winter rains. Although chaparral is <strong>of</strong>ten considered as a singlespecies, there are two distinct types: hard chaparral and s<strong>of</strong>t chaparral. Within thesetwo types are dozens <strong>of</strong> different plants, each with its own particular characteristics.Chaparral communities have evolved so that they require fire to spawn regeneration.Many species invite fire through the production <strong>of</strong> plant materials with large surfaceto-volumeratios, volatile oils and periodic die-back <strong>of</strong> vegetation. These species havefurther adapted to display special reproductive mechanisms following fire. Forexample, several species produce vast quantities <strong>of</strong> seeds which lie dormant until firetriggers germination. The parent plant which produces these seeds defends itself fromfire with a thick layer <strong>of</strong> bark that allows enough <strong>of</strong> the plant to survive so that theplant can crown sprout following the blaze. In general, chaparral community plantshave adapted to fire through the following methods: a) fire induced flowering, b) budproduction and sprouting subsequent to fire, c) in-soil seed storage and fire-stimulatedgermination, and d) on-plant seed storage and fire-stimulated dispersal.2006 PAGE 7 - 5
Natural <strong>Hazard</strong>s <strong>Mitigation</strong> PlanCity <strong>of</strong> <strong>Glendale</strong>, <strong>California</strong>Section 7 – WildfiresChaparral vegetation creates one type <strong>of</strong> exposure, with fires burning through an arearather quickly, and typically at lower temperatures than forest fires. Studies alsosuggest that prescribed burning programs <strong>of</strong> chaparral-covered areas are not effectivein halting shrubland fires; under Santa Ana wind conditions, fires carry through allchaparral regardless <strong>of</strong> age <strong>of</strong> the vegetation stands (Dr. John Keeley, USGS fireresearcher).Forest fires pose a higher risk to the urban/widland interface, as exemplified by the2003 fires. The magnitude <strong>of</strong> these fires was the result <strong>of</strong> three primary factors: 1)severe drought, accompanied by a series <strong>of</strong> storms that produced thousands <strong>of</strong> lightningstrikes and windy conditions; 2) an infestation <strong>of</strong> bark beetles that has killed thousands<strong>of</strong> mature trees in the area; and 3) the effects <strong>of</strong> wildfire suppression over the pastcentury that has led to buildup <strong>of</strong> brush and small-diameter trees in the forests. Ourforests today are significantly denser than they were in the not too-distant past: Lewisand Clark, on their exploration <strong>of</strong> the American Northwest, reported that forest wererelatively open, with 20 to 25 mature trees per acre; forest density was controlled bylightning-started fires that would sweep through clearing out the underbrush and smalltrees. Today’s forests typically have 300 to 400 mature trees to an acre, along withthick underbrush. This density makes trees susceptible to disease, and less droughtandfire-resistant. The thick under-story causes forest fires to burn intensely, whichdestroys the mature trees, so that damaged forest take decades to recover, rather than afew years. Unfortunately, this change in our forests is the result <strong>of</strong> the well-intentionedbut misguided forest management programs started in the 1920s.An important element in understanding the danger <strong>of</strong> wildfire is the availability <strong>of</strong>diverse fuels in the landscape, such as natural vegetation, manmade structures andcombustible materials. A house surrounded by brushy growth rather than cleared spaceallows for greater continuity <strong>of</strong> fuel and increases the fire’s ability to spread. Afterdecades <strong>of</strong> fire suppression “dog-hair" thickets have accumulated, which enable highintensity fires to flare and spread rapidly.• Topography: Topography influences the movement <strong>of</strong> air, thereby directing a firecourse. For example, if the percentage <strong>of</strong> uphill slope doubles, the rate <strong>of</strong> spread inwildfire will likely double. Gulches and canyons can funnel air and act as chimneys,which intensify fire behavior and cause the fire to spread faster. Solar heating <strong>of</strong> dry,south-facing slopes produces up-slope drafts that can complicate fire behavior.Unfortunately, hillsides with hazardous topographic characteristics are also desirableresidential areas in many communities. This underscores the need for wildfire hazardmitigation and increased education and outreach to homeowners living in interfaceareas.Although <strong>Glendale</strong> is a highly urbanized community, there are several large areas in thecity that consist <strong>of</strong> undeveloped, grass- and chaparral-covered hillsides and mountains.The Verdugo Mountains, located in the western section <strong>of</strong> the city, are more than 2,300feet higher in elevation than the valley floor. Similarly, at their highest point, the SanRafael Hills rise more than 1,200 feet above the alluvial plain in the eastern section <strong>of</strong>the city. The San Gabriel Mountains to the north have an elevation gain <strong>of</strong> as much as2,700 feet within City limits. The rough topography that characterizes these areas notonly facilitates the spread <strong>of</strong> fire but also impedes or hinders responding fire-fightingpersonnel and equipment. Traffic congestion in the urban areas and long traveldistances and narrow, winding roads in the hillsides and mountains can also hinder firedepartment response to the urban-wildland interface areas. Thus, enhanced onsiteprotection for structures and people in or adjacent to these undeveloped areas is2006 PAGE 7 - 6
Natural <strong>Hazard</strong>s <strong>Mitigation</strong> PlanCity <strong>of</strong> <strong>Glendale</strong>, <strong>California</strong>Section 7 – Wildfires.absolutely necessary, with property owners assuming responsibility for maintenance <strong>of</strong>their properties and adhering to construction standards that make their houses morefire-resistant.• Weather: Weather patterns combined with certain geographic locations can create afavorable climate for wildfire activity. Areas where annual precipitation is less than 30inches per year are extremely fire susceptible. High-risk areas in southern <strong>California</strong>share a hot, dry season in late summer and early fall when high temperatures and lowhumidity favor fire activity. The so-called “Santa Ana” winds, which are heated bycompression as they flow southwestward from Utah to southern <strong>California</strong>, create aparticularly high risk, as they can rapidly spread what might otherwise be a small fire.The <strong>Glendale</strong> area typically has mild, wet winters that lead to an annual growth <strong>of</strong>grasses and plants. This vegetation dries out during the hot summer months and isexposed to Santa Ana wind conditions in the fall. During Santa Ana conditions, windsin excess <strong>of</strong> 40 miles per hour (mph) are typical; gusts in excess <strong>of</strong> 100 mph may occurlocally. Santa Ana winds are generally consistent in their direction, but when combinedwith winds generated from burning vegetation, the wind direction generally becomesextremely erratic. This can stress fire-fighting resources and reduce fire-fightingsuccess.Recent concerns about the effects <strong>of</strong> climate change, particularly drought, arecontributing to concerns about wildfire vulnerability. The term drought is applied to aperiod in which an unusual scarcity <strong>of</strong> rain causes a serious hydrological imbalance.Unusually dry winters, or significantly less rainfall than normal, can lead to relativelydrier conditions and leave reservoirs and water tables lower. Drought leads toproblems with irrigation and may contribute to additional fires, or additional difficultiesin fighting fires.• Urban Development: Growth and development in scrubland and forested areas isincreasing the number <strong>of</strong> human-made structures in the interface areas <strong>of</strong> southern<strong>California</strong>. Wildfire has an effect on development, yet development can also influencewildfire. Owners <strong>of</strong>ten prefer homes that are private, have scenic views, are nestled invegetation and use “natural” construction materials. A private setting may be far frompublic roads, or hidden behind a narrow, curving driveway. These conditions, however,make evacuation and fire fighting difficult. The scenic views found along mountainridges can also mean areas <strong>of</strong> dangerous topography. Natural vegetation contributes toscenic beauty, but it may also provide a ready trail <strong>of</strong> fuel leading a fire directly to thecombustible fuels <strong>of</strong> the home itself.In <strong>Glendale</strong>, some hillside areas have a historical legacy <strong>of</strong> narrow roads, difficult access,insufficient water supplies, and non-rated flammable building construction.Furthermore, an increasing number <strong>of</strong> people use the surrounding undeveloped areasfor recreation purposes, and as a result, there is an increased potential for fires to beaccidentally or purposely set in the difficult-to-reach portions <strong>of</strong> the city.Wildfire <strong>Hazard</strong> IdentificationWildfire hazard areas are commonly identified at the wildland/urban interface. Ranges <strong>of</strong> thewildfire hazard are further determined by the ease <strong>of</strong> fire ignition due to natural or humanconditions and the difficulty <strong>of</strong> fire suppression. The wildfire hazard is also magnified by severalfactors related to fire suppression/control such as the surrounding fuel load, weather,topography and property characteristics. Generally, hazard identification rating systems arebased on weighted factors <strong>of</strong> fuels, weather and topography. Since the early 1970s, several fire2006 PAGE 7 - 7
Natural <strong>Hazard</strong>s <strong>Mitigation</strong> PlanCity <strong>of</strong> <strong>Glendale</strong>, <strong>California</strong>Section 7 – Wildfireshazard assessment systems have been developed for the purpose <strong>of</strong> identifying and quantifyingthe severity <strong>of</strong> the hazard in a given area. Those that have been developed or used in <strong>California</strong>are described further below. Early systems characterized the fire hazard <strong>of</strong> an area based on aweighted factor that typically considered fuel, weather and topography. More recent systemsrely on the use <strong>of</strong> Geographic Information System (GIS) technology to integrate the factorslisted above to map the hazards, and to predict fire behavior and the impact on watersheds.• HUD Study System: In April 1973, the <strong>California</strong> Department <strong>of</strong> Forestry and FirePrevention (CDF) published a study funded by the Department <strong>of</strong> Housing and UrbanDevelopment (HUD) under an agreement with the Governor’s Office <strong>of</strong> Planning andResearch (Helm et al., 1973). As is <strong>of</strong>ten the case, the study was conducted in responseto a disaster: during September and October 1970, 773 wildfires burned more than580,000 acres <strong>of</strong> <strong>California</strong> land. The HUD mapping process relied on informationobtained from US Geological Survey (USGS) 15- and 7.5-minute quadrangle maps onfuel loading (vegetation type and density) and slope, and combined it with fire weatherinformation to determine the Fire <strong>Hazard</strong> Severity <strong>of</strong> an area.• <strong>California</strong> Department <strong>of</strong> Forestry and Fire Protection – <strong>State</strong> ResponsibilityAreas System: Legislative mandates passed in 1981 (Senate Bill 81, Ayala, 1981) and1982 (Senate Bill 1916, Ayala, 1982) that became effective on July 1, 1986, required theCDF to develop and implement a system to rank the fire hazards in <strong>California</strong>. Areaswere rated as moderate, high or very high based primarily on fuel types. Thirteendifferent fuel types were considered using the 7.5-minute quadrangle maps by the USGeological Survey as base maps (Phillips, 1983). Areas identified as having a fire hazardwere referred to as <strong>State</strong> Responsibility Areas (SRAs) (Public Resources Code Section4125). These are non-federal lands covered wholly or in part by timber, brush,undergrowth or grass, for which the <strong>State</strong> has the primary financial responsibility <strong>of</strong>preventing and suppressing fires.• Bates Bill Process: The Bates Bill (Assembly Bill 337, September 29, 1992) was adirect result <strong>of</strong> the great loss <strong>of</strong> lives and homes in the Oakland Hills Tunnel Fire <strong>of</strong>1991. Briefly, the <strong>California</strong> Department <strong>of</strong> Forestry and Fire Protection (CDF), incooperation with local fire authorities was tasked to identify Very High Fire <strong>Hazard</strong>Severity Zones (VHFHSZs) in Local Responsibility Areas (LRAs). To accomplish this,the CDF formed a working group comprised <strong>of</strong> state and local representatives thatdevised a point system that considers fuel (vegetation), slope, weather, and dwellingdensity. To qualify as a VHFHSZ, an area has to score ten or more points in thegrading scale.Once the boundaries <strong>of</strong> a VHFHSZ have been delineated, the CDF notifies the local fireauthorities that are responsible for fire prevention and suppression within that area.Since the <strong>State</strong> is not financially responsible for Local Responsibility Areas, localjurisdictions have final say regarding whether or not an area should be included in aVHFHSZ (Government Code Section 51178). As a result, although several areas in<strong>California</strong> have adopted the <strong>State</strong>-developed fire hazard maps, many local jurisdictionsdid not acknowledge the Bates system, and developed their own maps instead. Localjurisdictions that do not follow the Bates system are required to follow at a minimumthe model ordinance developed by the <strong>State</strong> Fire Marshal for mitigation purposes. TheCity <strong>of</strong> <strong>Glendale</strong> is one <strong>of</strong> the cities that has developed its own fire hazard map and hasadopted stringent hazard mitigation programs that have <strong>of</strong>ten been years ahead <strong>of</strong> <strong>State</strong>regulations. This will be discussed further in the following sections <strong>of</strong> this report.2006 PAGE 7 - 8
Natural <strong>Hazard</strong>s <strong>Mitigation</strong> PlanCity <strong>of</strong> <strong>Glendale</strong>, <strong>California</strong>Section 7 – Wildfires• <strong>California</strong> Fire Plan: The 1996 <strong>California</strong> Fire Plan is a cooperative effort between the<strong>State</strong> Board <strong>of</strong> Forestry and Fire Protection and the CDF (<strong>California</strong> Board <strong>of</strong> Forestry,1996). This system ranks the fire hazard <strong>of</strong> the wildland areas <strong>of</strong> the <strong>State</strong> using fourmain criteria: fuels, weather, assets at risk, and level <strong>of</strong> service (which is a measure <strong>of</strong>Fire Department’s success in initial-attack fire suppression). The <strong>California</strong> Fire Planuses GIS data layers to conduct the initial evaluations, and local CDF Ranger Units arethen tasked with field validation <strong>of</strong> the initial assessment. The final maps use a Fire Plangrid cell with an area <strong>of</strong> approximately 450 acres, which represents 1/81 <strong>of</strong> the area <strong>of</strong> a7.5-minute quadrangle map (called Quad 81). The fire hazard <strong>of</strong> an individual cell isranked as moderate, high or very high. This system is expected to replace the current<strong>State</strong> Responsibility Areas process, but at the time <strong>of</strong> this writing, the <strong>California</strong> FirePlan has not been implemented. For additional information regarding this system referto http://www.fire.ca.gov/FireEmergencyResponse/FirePlan/FirePlan.asp.• FireLine System: The Insurance Services Office (ISO) developed a program used bythe insurance industry to identify those areas where the potential loss due to wildfire isgreatest (ISO, 1997). ISO retained Pacific Meridian Resources <strong>of</strong> Emeryville, <strong>California</strong>to develop the FireLine s<strong>of</strong>tware, which uses satellite-imagery interpretation to evaluatethe factors <strong>of</strong> fuel types, slope and roads (access) to develop the risk rating. Mostinsurance companies that provide insurance services to homeowners in <strong>California</strong> nowuse this system. This s<strong>of</strong>tware is only available through ISO. Updated versions <strong>of</strong> thissystem are being developed that include the factors <strong>of</strong> elevation, aspect, and relativeslope position.• National Fire Plan: Funding for the National Fire Plan was authorized by Congress inOctober 2000 in response to the wildfires <strong>of</strong> that year. The plan is a cooperative effort<strong>of</strong> the US Department <strong>of</strong> Agriculture’s Forest Service, the Department <strong>of</strong> the Interior,and the National Association <strong>of</strong> <strong>State</strong> Foresters. National Fire Plan maps showcommunities that are within the vicinity <strong>of</strong> federal lands that are at high risk fromwildland fire. The plan uses hazardous fuel reduction treatment techniques (includingprescribed fire alone, mechanical treatment alone, mechanical treatment plus prescribedfire, and other/wildland fire use, such as allowing lightning-caused fires to burn) toreduce the impact <strong>of</strong> wildland fire on communities within the urban-wildland interface.For additional information refer to http://www.fireplan.gov/.A major component <strong>of</strong> the National Fire Plan is funding for projects designed to reducefire risks in developed areas and at the urban/wildland interface. A fundamental step inrealizing this goal was the identification <strong>of</strong> areas that are at high risk <strong>of</strong> damage fromwildfire. Federal fire managers authorized <strong>State</strong> Foresters to determine whichcommunities were under significant risk for wildland fire on Federal lands. The CDFundertook the task <strong>of</strong> generating the state's list <strong>of</strong> communities at risk. With<strong>California</strong>'s extensive Wildland-Urban Interface situation, the list <strong>of</strong> communitiesextends beyond just those on Federal lands. The CFA has identified 1,264 firethreatenedcommunities in <strong>California</strong>, one <strong>of</strong> which is <strong>Glendale</strong>. For additionalinformation refer to http://www.cafirealliance.org/.• FARSITE, BEHAVEPlus and FlamMap: These are PC-based programs that can beused by local fire managers to calculate potential fire behavior in a given area using GISdata inputs for terrain and fuels. The purpose <strong>of</strong> these models is to predict fire behavior.Data inputs that can be used in the analyses include elevation, slope, aspect, surface fuel,canopy cover, stand height, crown base height and crown bulk density.2006 PAGE 7 - 9
Natural <strong>Hazard</strong>s <strong>Mitigation</strong> PlanCity <strong>of</strong> <strong>Glendale</strong>, <strong>California</strong>Section 7 – WildfiresThe oldest <strong>of</strong> these models is the BEHAVE Fire Behavior Prediction and FuelModeling System (Burgan and Rothermel, 1984; Burgan, 1987; Andrews, 1986;Andrews and Chase, 1989; Andrews and Bradshaw, 1991) that has been used since 1984.A newer version <strong>of</strong> it is referred to as the BehavePlus Fire Modeling System (Andrewsand Bevins, 1999). This s<strong>of</strong>tware is undergoing additional updates to make it moreuser- friendly and provide additional fire modeling capabilities. FARSITE (Finney,1995, 1998) “simulates the growth and behavior <strong>of</strong> a fire as it spreads through variablefuel and terrain under changing weather conditions” (http://fire.org/cgibin/nav.cgi?pages=JFSP&mode=9).This s<strong>of</strong>tware can be used to project the growth <strong>of</strong>ongoing wildfires and prescribed fires, and can be used as a planning tool for firesuppression and prevention, and fuel assessment. The FlamMap fire behavior mappingand analysis system is still under preparation, although a prototype has been releasedand is being used for the Tahoe Basin project (http://fire.org/cgibin/nav.cgi?pages=JFSP&mode=11).FlamMap combines elements <strong>of</strong> the two oldermodels. The <strong>Glendale</strong> Fire Department is considering the use <strong>of</strong> some <strong>of</strong> thesecomputer models to simulate fire conditions and predict fire behavior in the fire hazardareas <strong>of</strong> the city.• Brian Barrette’s Structural Vulnerability System: This system starts with the <strong>State</strong>Responsibility Area fire hazard severity rating described above, but also includesstructural elements as rating factors (Barrette, 1999). The structural elementsconsidered include ro<strong>of</strong>ing, siding, vegetation clearance, roads and signage, chimneys,structural accessories, water supply, and the location <strong>of</strong> the structure in relation to thesurrounding conditions (see Table 7.4, below). Under this system, a score <strong>of</strong> 3 equalsthe most danger, whereas a score <strong>of</strong> 1 equals the least danger). This system is intendedfor use in assessing individual parcels, and is therefore not likely to be used by agencies,as it is time- and personnel-intensive. However, the system is easy to use and cantherefore be used by individual homeowners or insurance companies to determinewhether or not a specific property has a high fire hazard and is therefore a goodcandidate for specific fire hazard mitigation measures.Table 7.4: Sample <strong>Hazard</strong> Identification Rating SystemCategoryIndicatorRatingRoads and Signage Steep; narrow; poorly signed 3One or two <strong>of</strong> the above 2Meets all requirements 1Water Supply None, except domestic 3Hydrant, tank, or pool over 500 feet away 2Location <strong>of</strong> theStructureHydrant, tank, or pool within 500 feet 1Top <strong>of</strong> steep slope with brush/grass below 3Mid-slope with clearance 2Level with lawn, or watered groundcover 12006 PAGE 7 - 10
Natural <strong>Hazard</strong>s <strong>Mitigation</strong> PlanCity <strong>of</strong> <strong>Glendale</strong>, <strong>California</strong>Section 7 – WildfiresExterior Construction Combustible ro<strong>of</strong>ing, open eaves, Combustible siding 3One or two <strong>of</strong> the above 2Non-combustible ro<strong>of</strong>, boxed eaves, non-combustible siding 1As discussed above, in order to determine the "base hazard factor" <strong>of</strong> specific wildfire hazardsites and interface regions, several factors must be taken into account. Categories used to assessthe base hazard factor include: Topographic location, characteristics and fuels; Site/building construction and design; Site/region fuel pr<strong>of</strong>ile (landscaping); Defensible space; Accessibility; Fire protection response; and Water availability.The use <strong>of</strong> Geographic Information System (GIS) technology in recent years has been a greatasset to fire hazard assessment, allowing further integration <strong>of</strong> fuels, weather and topographydata for such ends as fire behavior prediction, watershed evaluation, mitigation strategies andhazard mapping.Vulnerability and RiskAs discussed previously, the city <strong>of</strong> <strong>Glendale</strong> is considered at risk from wildfire by the <strong>California</strong>Department <strong>of</strong> Forestry. Furthermore, the <strong>Glendale</strong> Fire Department rates almost two-thirds<strong>of</strong> the city as highly susceptible to wildland fires. The High Fire <strong>Hazard</strong> Areas in the citydefined by the <strong>Glendale</strong> Fire Department are shown on Map 7.2 (and Plate H-7). These areasare based on vegetation, access, zoning and topography.Notice that the <strong>Glendale</strong> Fire Department, consistent with the Bates Bill process describedabove, does not classify the fire hazard <strong>of</strong> an area as low, medium, high or extreme, but rather, aproperty is either in the fire hazard area, or it is not. [The City’s High Fire <strong>Hazard</strong> Areaincludes all areas with a medium, high or extreme brush fire hazard as delineated in the City’s1975 Safety Element.] The reason for this yes - no approach is that <strong>California</strong> <strong>State</strong> law requiresthat fire hazard areas be disclosed in real estate transactions; that is, real-estate sellers arerequired to inform prospective buyers whether or not a property is located within a wildlandarea that could contain substantial fire risks and hazards [Assembly Bill 6; Civil Code Section1103(c)(6)]. Real-estate disclosure requirements are important because in <strong>California</strong> theaverage period <strong>of</strong> ownership for residences is only five years (Coleman, 1994). This turnovercreates an information gap between the several generations <strong>of</strong> homeowners in fire hazard areas:Uninformed, new homeowners may attempt landscaping or structural modifications that couldbe a detriment to the fire-resistant qualities <strong>of</strong> the structure, with negative consequences.A vulnerability assessment <strong>of</strong> the interface areas <strong>of</strong> the city at risk from wildfire requiresknowledge about the population and total value <strong>of</strong> the property at risk, and an estimate <strong>of</strong> thearea that would be impacted by the fire. Other key factors that need to be considered in theassessment <strong>of</strong> wildfire risk include ignition sources, building materials and design, communitydesign, structural density, slope, vegetative fuel, fire occurrence and weather, as well as whetheror not the area is experiencing a drought, and if it is, how long have drought conditionspersisted. The National Wildland/Urban Fire Protection Program has developed theWildland/Urban Fire <strong>Hazard</strong> Assessment Methodology tool for communities to assess their2006 PAGE 7 - 11
Natural <strong>Hazard</strong>s <strong>Mitigation</strong> PlanCity <strong>of</strong> <strong>Glendale</strong>, <strong>California</strong>Section 7 – Wildfiresrisk to wildfire. For more information on wildfire hazard assessment refer tohttp://www.firewise.org.Unlike an earthquake, which has the potential to impact the entire region, wildfires at theurban/wildland interface are <strong>of</strong>ten contained thanks to the heroic efforts <strong>of</strong> the local firedepartments, in some cases with help from other regional, <strong>State</strong>, and Federal agencies.However, as discussed above, there are now some computer models available (FARSITE,BEHAVEPlus, and FlamMap) that, given reasonable inputs regarding slope, wind, fuelavailability, moisture conditions, and other parameters, can be used to forecast the area thatwould be impacted. Once the impacted area is determined, a risk assessment that looks at thepopulation and property within that area can be conducted, from which loss estimates can becalculated.2006 PAGE 7 - 12
Natural <strong>Hazard</strong>s <strong>Mitigation</strong> PlanCity <strong>of</strong> <strong>Glendale</strong>, <strong>California</strong>Section 7 – WildfiresMap 7.2: Fire <strong>Hazard</strong> Zones in <strong>Glendale</strong>2006 PAGE 7 - 13
Natural <strong>Hazard</strong>s <strong>Mitigation</strong> PlanCity <strong>of</strong> <strong>Glendale</strong>, <strong>California</strong>Section 7 – WildfiresCommunity Wildfire IssuesWhat is Susceptible to Wildfire?The hills and mountainous areas <strong>of</strong> southern <strong>California</strong> are considered to be at theurban/wildland interface. The development <strong>of</strong> homes and other structures has encroached andwill continue to encroach onto the wildlands, expanding the urban/wildland interface areas.The neighborhoods at the interface are characterized by a diverse mixture <strong>of</strong> housing structures,development patterns, ornamental and natural vegetation, and natural fuels. In the event <strong>of</strong> awildfire, this diverse mixture <strong>of</strong> vegetation, structures and development patterns, compoundedby the local topography and weather at that specific time, can result in an unwieldy andunpredictable fire. Factors important in fighting <strong>of</strong>such fires include access, firebreaks, proximity <strong>of</strong> water sources, distance from a fire station andavailable firefighting personnel and equipment. A review <strong>of</strong> past urban/wildland interface fireshas shown that many structures are destroyed or damaged for one or more <strong>of</strong> the followingreasons: Combustible ro<strong>of</strong>ing material; Wood construction; Structures with no defensible space; Fire department with poor access to structures; Subdivisions located in heavy natural fuel types; Structures located on steep slopes covered with flammable vegetation; Limited water supply; and Winds over 30 miles per hour.Road Access:Road access is a major issue for all emergency service providers. As development hasencroached into the rural areas <strong>of</strong> the county, the number <strong>of</strong> houses without adequate turnaroundspace has increased. In many single-family residential neighborhoods, there is notadequate space for emergency vehicle turnarounds, hindering emergency workers’ access to thehouses at risk. Narrow winding roads with inadequate turn-around space are particularlychallenging as fire trucks are too long to maneuver in these roads. In these cases, fire fightersmay evacuate the property owners and then leave themselves, unable to safely remain to savethe threatened structures.Fires at the urban-wildland interface tend to move quickly, with most <strong>of</strong> the damage or lossesgenerally occurring in the first few hours after the fire starts (Coleman, 1994). Therefore, accessto the urban-wildland interface for the purposes <strong>of</strong> emergency response is critical. This requiresstreets that meet minimum access and egress requirements so that they can be traversed by fireapparatus. The <strong>Glendale</strong> Municipal Code includes minimum width standards for local streetsand width and length standards for cul-de-sacs. The <strong>Glendale</strong> Fire Code (Volume VI, Article10, Section 10.207) requires an all-weather surface roadway with a minimum width <strong>of</strong> 20 feet(without parking) that can support loads <strong>of</strong> 55,000 pounds, minimum 13-feet 6-inches <strong>of</strong> verticalclearance, a grade that does not exceed 12 percent, and an approved turnaround when in excess<strong>of</strong> 150 feet in length. Chapter 28, Section 28-59 <strong>of</strong> the Municipal Code stipulates that any localstreet or cul-de-sac street that is abutted by more than ten residences shall be no less than 24feet wide from curb to curb, within a 28-foot wide dedication. The length <strong>of</strong> cul-de-sacs isregulated based on the number <strong>of</strong> dwelling units and distance from the point <strong>of</strong> dual access, butthe maximum distance for dead-end or no-outlet streets is 2,600 feet. In fire hazard areas, easyaccess for fire equipment shall be provided.Unfortunately, many streets in the hillside areas <strong>of</strong> <strong>Glendale</strong> are <strong>of</strong> insufficient width becausethey were built prior to the development <strong>of</strong> the current standards. Several other roads are non-2006 PAGE 7 - 14
Natural <strong>Hazard</strong>s <strong>Mitigation</strong> PlanCity <strong>of</strong> <strong>Glendale</strong>, <strong>California</strong>Section 7 – Wildfirescompliant because they are dead-end streets more than 1/2-mile long, or do not have aturnaround at their end. There are several non-compliant residential streets <strong>of</strong>f <strong>of</strong> East ChevyChase Drive, and in the southeastern corner <strong>of</strong> the city, <strong>of</strong>f <strong>of</strong> Adams Street. Several other roadsin the eastern and southern Verdugo Mountains are also narrow and do not have properturnarounds. The streets that do not meet <strong>Glendale</strong>’s Municipal Code requirements are shownon Plate 4-3. Although not shown on the map, the City’s Fire Department also considers theeast end <strong>of</strong> Glenoaks Boulevard, east <strong>of</strong> the <strong>Glendale</strong> Freeway as a potentially hazardous roadbecause it does not have a secondary outlet. A wildland fire, earthquake or another disaster inthe area could place a substantial number <strong>of</strong> people at risk <strong>of</strong> not being able to evacuate thisneighborhood if and when necessary.Water Supply:Fire fighters at the urban/wildland interface may be faced by limited water supply and lack <strong>of</strong>hydrant taps. Rural areas are characteristically outfitted with small-diameter pipe watersystems, inadequate for providing sustained fire-fighting flows.Areas at higher elevations may also be serviced by water that is pumped up to the higherelevations. In the event <strong>of</strong> a fire, there may be insufficient water pressure to do so. Emergencywater storage is also critical, especially when battling large wildland fires. During the 1993Laguna Beach (Orange County) fire, “water streams sprayed on burning houses sometimes fellto a trickle” (Orange County Fire Department, 1994), primarily because most water reservoirsin Laguna were located at lower elevations, and the water district could not supply water to thehigher elevations as fast as the fire engines were using it. Leaks and breaks in the waterdistribution system, including leaking irrigation lines and open valves in destroyed homes alsoreduced the amount <strong>of</strong> water available to the fire fighters. A seven-day emergency storagesupply is recommended, especially in areas likely to be impacted by fires after earthquakes, dueto the anticipated damage to the main water distribution system as a result <strong>of</strong> ground failure dueto fault rupture, liquefaction, or landsliding.Interface Fire Education Programs and Enforcement:Fire protection in urban/wildland interface areas relies more heavily on landowners takingmeasures personally to protect their properties. Property owners are more likely to take theinitiative if they are informed <strong>of</strong> the risk. Therefore, public education and awareness should playa greater role in interface areas. In those areas with strict fire codes, property owners whoresist maintaining the minimum brush clearances on their property should be cited for failure toclear brush.The Need for <strong>Mitigation</strong> Programs:Continued development into the urban/wildland interface will have a growing impact on thewildfire risk <strong>of</strong> the area. Wildfires in southern <strong>California</strong> occur periodically, <strong>of</strong>ten withcatastrophic results, with the history <strong>of</strong> deadly and expensive fires going back decades, if not acentury. Continued growth and development underscores the increased need for naturalhazards mitigation planning in southern <strong>California</strong>.Fires After an Earthquake – The Threat <strong>of</strong> Urban Conflagration:Although this section deals primarily with the hazard <strong>of</strong> wildfires, there is another type <strong>of</strong> firehazard that needs to be addressed. Specifically, large fires following an earthquake in an urbanregion, although rare, have the potential to cause great losses. The two largest peace-timeurban fires in history, the 1906 San Francisco and 1923 Tokyo, were both caused byearthquakes. The conflagration in San Francisco after the 1906 earthquake was the singlelargest urban fire, and the single largest earthquake loss, in U.S. history. Three days <strong>of</strong> firesconsumed more than 28,000 buildings within a 12-square-kilometer area. The cost isstaggering: $250 million in 1906 dollars, or about $5 billion at today’s prices. Although the2006 PAGE 7 - 15
Natural <strong>Hazard</strong>s <strong>Mitigation</strong> PlanCity <strong>of</strong> <strong>Glendale</strong>, <strong>California</strong>Section 7 – Wildfiresthreat that existed in San Francisco was and is far greater than that in <strong>Glendale</strong> today, there aresome sections <strong>of</strong> <strong>Glendale</strong> where, due to ground failure as a result <strong>of</strong> either fault rupture orliquefaction, breaks in the gas mains and the water distribution system could lead to asignificant fire-after-earthquake situation. Refer to the maps in Appendix H for informationregarding those areas <strong>of</strong> the city susceptible to surface fault rupture and liquefaction.The 1989 Loma Prieta earthquake, the 1994 Northridge earthquake, and the 1995 Kobe, Japanearthquake all demonstrate the current, real possibility <strong>of</strong> a fire-following-an earthquakedeveloping into a conflagration. In the United <strong>State</strong>s, all the elements that would hamper firefightingcapabilities are present: density <strong>of</strong> wooden structures, limited personnel and equipmentto address multiple fires, debris blocking the access <strong>of</strong> fire-fighting equipment, and a limitedwater supply.Of the examples above, let’s look at the earthquake closest to home. The moderately sized,M6.7 Northridge earthquake <strong>of</strong> 1994 caused several structural fires, many the result <strong>of</strong> brokengas mains: the earthquake caused 15,021 natural gas leaks that resulted in three street fires, 51structural fires (23 <strong>of</strong> these caused total ruin) and the destruction by fire <strong>of</strong> 172 mobile homes.In one incident, the earthquake severed a 22-inch gas transmission line and a motorist ignitedthe gas while attempting to restart his stalled vehicle. Response to this fire was impeded by theearthquake’s rupture <strong>of</strong> a water main; five nearby homes were destroyed. Elsewhere, one mobilehome fire started when a downed power line ignited a ruptured transmission line. In many <strong>of</strong>the destroyed mobile homes, fires erupted when inadequate bracing allowed the homes to slip<strong>of</strong>f their foundations, severing gas lines and igniting fires. There was a much greater incidence<strong>of</strong> mobile home fires (49.1 per thousand) than other structure fires (1.1 per thousand).The damages from the 1994 earthquake reminded researchers <strong>of</strong> the findings <strong>of</strong> a studypublished in 1988 by the <strong>California</strong> Division <strong>of</strong> Mines and Geology (Toppozada and others,1988). This study identified projected damages in the Los Angeles area as a result <strong>of</strong> anearthquake on the Newport-Inglewood fault. The earthquake scenario estimated that thousands<strong>of</strong> gas leaks would result from damage to pipelines, valves and service connections. This studyprompted the Southern <strong>California</strong> Gas Company to start replacing their distribution pipelineswith flexible plastic polyethylene pipe, and to develop ways to isolate and shut <strong>of</strong>f sections <strong>of</strong>supply lines when breaks are severe. Nevertheless, as a result <strong>of</strong> the 1994 Northridgeearthquake, the Southern <strong>California</strong> Gas Company reported 35 breaks in its natural gastransmission lines and 717 breaks in distribution lines. About 74 percent <strong>of</strong> its 752 leaks werecorrosion related. Furthermore, in the aftermath <strong>of</strong> the earthquake, 122,886 gas meters wereclosed by customers or emergency personnel. Thankfully, most <strong>of</strong> the leaks were small andcould be repaired at the time <strong>of</strong> service restoration, but the costs and time associated with theserepairs were considerable.History indicates that fires following an earthquake have the potential to severely tax the localfire suppression agencies, and develop into a worst-case scenario. Earthquake-induced fires canplace extraordinary demands on fire suppression resources because <strong>of</strong> multiple ignitions. Theprincipal causes <strong>of</strong> earthquake-related fires are open flames, electrical malfunctions, gas leaks,and chemical spills. Downed power lines may ignite fires if the lines do not automatically deenergize.Unanchored gas heaters and water heaters are common problems, as these readily tipover during strong ground shaking (<strong>State</strong> law now requires new and replaced gas-fired waterheaters to be attached to a wall or other support).Many factors affect the severity <strong>of</strong> fires following an earthquake, including ignition sources,types and density <strong>of</strong> fuel, weather conditions, functionality <strong>of</strong> the water systems, and the ability<strong>of</strong> firefighters to suppress the fires. Casualties, debris and poor access can all limit fire-fightingeffectiveness. Water availability in Los Angeles County following a major earthquake will most2006 PAGE 7 - 16
Natural <strong>Hazard</strong>s <strong>Mitigation</strong> PlanCity <strong>of</strong> <strong>Glendale</strong>, <strong>California</strong>Section 7 – Wildfireslikely be curtailed due to damage to the water distribution system — broken water mains,damage to the aqueduct system, damage to above-ground reservoirs, etc.Loss-estimation scenarios were conducted for the city <strong>of</strong> <strong>Glendale</strong> using HAZUS. Specifics <strong>of</strong>this analysis are discussed in detail in Section 6 – Earthquakes. Five different earthquakescenarios were considered for the city. The results <strong>of</strong> these loss estimations indicate that<strong>Glendale</strong> could experience between 3 and 11 ignitions immediately following an earthquake,with the San Andreas fault earthquake scenario triggering 3 ignitions, and the Verdugo andSierra Madre faults triggering 11 ignitions each. The Raymond and Hollywood faults are bothexpected to trigger 10 ignitions in the city. The burnt area resulting from these ignitions willvary depending on wind conditions. Normal wind conditions <strong>of</strong> about 10 miles per hour (mph)are expected to result in burn areas <strong>of</strong> between 1.9 and 6.7 percent <strong>of</strong> the region’s total area. IfSanta Ana wind conditions are present at the time <strong>of</strong> the earthquake, the burnt areas can beexpected to be significantly larger.The fires triggered by an earthquake on the San Andreas fault are anticipated to displace as fewas 30 people (if the winds are low), and as many as 308 people (if 30 mph winds are blowingthrough the area at the time). The fires triggered by the other earthquake scenarios areexpected to impact between 116 and 354 people (if winds are low), and as many as 2,047 to2,919 people (if 30 mph winds are present).Wildfire <strong>Mitigation</strong> Activities:<strong>Hazard</strong> mitigation programs in fire hazard areas currently include fire prevention, vegetationmanagement, legislated construction requirements, and public awareness. Each <strong>of</strong> theseprograms is described further below.Fire Prevention: Fire prevention aims to reduce the incidence and extent <strong>of</strong> fire by preventingwildfires from occurring in the first place. Over the years, a variety <strong>of</strong> fire prevention programshave been developed and implemented by Federal, <strong>State</strong>, and local agencies. These programstypically include education, engineering, patrolling, code enforcement, and signing (Greenleeand Sapsis, 1996). Smokey Bear is one <strong>of</strong> the best-known characters that both children andadults recognize, attesting to the success <strong>of</strong> public education programs aimed at fire prevention.Quantitative studies show that fire losses arising from human fires, especially those caused bychildren, have dropped substantially over the last 30 years or so, in some cases by as much as 80percent (Greenlee and Sapsis, 1996). Therefore, fire prevention is a well-understood programwith a high degree <strong>of</strong> success. However, as discussed above, by preventing fire from occurring,fuel loads are allowed to increase, with the potential for high intensity fires and resultantdamage. Therefore, fire prevention needs to be complemented with a variety <strong>of</strong> other programsthat will guarantee long-term success in reducing the losses resulting from fires.Fire Prevention can include limiting access to fire hazard areas during certain times <strong>of</strong> the year.Although not apparent from Map 7.2, the wildfire susceptibility <strong>of</strong> an area changes throughoutthe year, and from one year to the next, in response to local variations in precipitation,temperature, vegetation growth, and other conditions. When the fire danger in a High Fire<strong>Hazard</strong> Zone is deemed to be <strong>of</strong> special concern, local authorities can rely on increased mediacoverage and public announcements to educate the local population about being fire safe. Forexample, to reduce the potential for wildfires during fire season, the City <strong>of</strong> <strong>Glendale</strong> can opt toclose hazardous fire areas to public access during at least part <strong>of</strong> the year. By monitoring sitespecificwildfire susceptibility <strong>of</strong> a region, the Fire Department can establish regional preventionpriorities that help reduce the risk <strong>of</strong> wildland fire ignition and spread, and help improve theallocation <strong>of</strong> suppression forces and resources, which can lead to faster control <strong>of</strong> fires in areas <strong>of</strong>high concern.2006 PAGE 7 - 17
Natural <strong>Hazard</strong>s <strong>Mitigation</strong> PlanCity <strong>of</strong> <strong>Glendale</strong>, <strong>California</strong>Section 7 – WildfiresRestricted public access to hiking trails in and around the city <strong>of</strong> <strong>Glendale</strong> during the fire seasonmay help reduce the opportunity for human-caused wildfires in the area. Continued use <strong>of</strong> signsduring high and extreme fire conditions along the freeways and roads that cut through thewildland areas in the city and adjacent areas can also help reduce the fire hazard by alerting andeducating motorists and residents.The City <strong>of</strong> <strong>Glendale</strong> has a variety <strong>of</strong> fire prevention programs in place. Routine (annual or biannual)fire prevention inspections are conducted on a citywide basis by the Fire Department forresidential, commercial, and industrial-type occupancies. The Fire Prevention Bureau <strong>of</strong> theCity’s Fire Department inspects all new and existing public assemblies, educational facilities,institutions and hospitals, high-rise buildings, hazardous materials occupancies, malls and largeretail centers, and all new residential dwellings (<strong>Glendale</strong> Fire Department, 1994). Theinspections are conducted for the purpose <strong>of</strong> enforcing the Fire Code and hazardous materialsregulations, for Fire Department personnel from within that jurisdictional area to becomefamiliar with the premises (this is helpful in the event that they need to respond to a fire oremergency), and to instruct occupants about fire prevention methods and procedures. TheNeighborhood Services Section <strong>of</strong> the Community Development Department providesassistance with the inspection <strong>of</strong> single-family residential dwellings as part <strong>of</strong> a community-widebeautification program. All personnel that conduct these surveys have received training inhazard recognition from the Fire Department.<strong>Glendale</strong>’s Fire Prevention Bureau is comprised <strong>of</strong> several different units, each with specificresponsibilities. Fire Prevention Bureau members have the powers <strong>of</strong> a peace <strong>of</strong>ficer in enforcingthe City’s Fire Code. The responsibilities <strong>of</strong> each unit are described further below:oooooFire Code Inspection – conducts inspections <strong>of</strong> all new and existing structures.Development Plan Review – reviews proposed developments for conformance with fireprotection requirements including fire-resistive construction, landscaping, emergencyaccess, available fire flow, and built-in fire detection and suppression systems.Fire Investigation and Arson – investigates fire cause and origin, administersaggressive code enforcement, and analyzes cost recovery for negligent or malicious actscausing fire. All members <strong>of</strong> this unit have full police powers as set in <strong>California</strong> PenalCode Section 832 (Section 103.2.2.3 <strong>of</strong> the City’s Building and Safety Code).Vegetation Management – reviews existing properties for compliance with fuelmanagement requirements; administers and enforces the weed abatement and brushclearance program, and contracts for fire hazard reduction measures, including fuelbreaks, fire roads, and non-compliant parcels.<strong>Hazard</strong>ous Materials and Waste Management – administers hazardous materialsdisclosure laws and legislation, as well as conducts inspection <strong>of</strong> underground storagetanks and facilities that use or store hazardous materials for environmental compliance.o Public Education – provides public fire safety education for groups or individuals on thehazards associated with the urban-wildland interface area.Vegetation Management: Although, as discussed above, wildland fire is a significantpotential hazard in large portions <strong>of</strong> <strong>Glendale</strong>, there are several management tools that can beimplemented to reduce this hazard to manageable levels. Experience and research have shownthat vegetation management is an effective means <strong>of</strong> reducing the wildland fire hazard insouthern <strong>California</strong>. As a result, in areas identified as susceptible to wildland fire, jurisdictionstypically require property owners to use a combination <strong>of</strong> maintenance approaches aimed atreducing the amount and continuity <strong>of</strong> the fuel (vegetation) available.Fuel or vegetation treatments <strong>of</strong>ten used include mechanical, chemical, biological and otherforms <strong>of</strong> biomass removal (Greenlee and Sapsis, 1996) or hazard reduction within a given2006 PAGE 7 - 18
Natural <strong>Hazard</strong>s <strong>Mitigation</strong> PlanCity <strong>of</strong> <strong>Glendale</strong>, <strong>California</strong>Section 7 – Wildfiresdistance from habitable structures. The intent is to create a defensible space that slows the rateand intensity <strong>of</strong> the advancing fire, and provides an area at the urban-wildland interface wherefirefighters can set up to suppress the fire and save the threatened structures. Defensible space isdefined as an area, either natural or man-made, where plant materials and natural fuels havebeen treated, cleared, or modified. However, removal <strong>of</strong> the native vegetation and maintenance<strong>of</strong> a wide strip <strong>of</strong> bare ground is not aesthetically acceptable and it increases the potential forwater run<strong>of</strong>f and soil erosion. Native vegetation can be replaced with a green belt <strong>of</strong> low-lying,vegetation, but the increased use <strong>of</strong> water and maintenance requirements can make this optionundesirable.Another approach used in some areas <strong>of</strong> southern <strong>California</strong> is referred to as fuel modification.This method places emphasis on the space near structures that provides natural landscapecompatibility with wildlife, water conservation and ecosystem health. Immediate benefits <strong>of</strong> thisapproach include improved aesthetics, increased health <strong>of</strong> large remaining trees and othervalued plants, and enhanced wildlife habitat.The City <strong>of</strong> <strong>Glendale</strong> uses fuel modification to reduce its wildfire hazard. Specifically, in 1993,the City <strong>of</strong> <strong>Glendale</strong> adopted a Hillside Development Plan that provides guidelines regardinglandscaping and vegetation modification to promote fire safety while protecting the visualquality <strong>of</strong> the hillsides (City <strong>of</strong> <strong>Glendale</strong>, 1993). The landscape guidelines provide lists <strong>of</strong> plants(referred to as plant palettes) that are drought tolerant and help control erosion to be used onengineered slopes. By using these plants instead <strong>of</strong> non-native species, the visual contrastbetween the natural hillsides and the engineered slopes can be diminished, making the manmadeslopes resemble more closely the adjacent natural slopes. Two plant palettes are available:the naturalizing palette, which includes plants to be used on that portion <strong>of</strong> the engineeredslopes closer to the natural hillsides; and the ornamental palette, to be used on that section <strong>of</strong>the slope closer to structures, adjacent to the ornamental vegetation. On large enough slopes,both plant palettes can be blended along a 150-foot wide interface. For the most recent version<strong>of</strong> the plant palettes acceptable in <strong>Glendale</strong>, request a copy from the City’s PlanningDepartment.The Fire Zone Management Guidelines portion (Section 8.0) <strong>of</strong> <strong>Glendale</strong>’s LandscapeGuidelines Plan outlines the methods by which the two plant palettes discussed above are to beused around all flammable structures in the urban-wildland interface. A minimum bufferdistance <strong>of</strong> 100 feet is required around all structures; in some cases, at the discretion <strong>of</strong> theCity’s Fire Chief, this buffer distance may be increased to 200 feet. Within this buffer distance,the City requires four distinct Fire Management Zones to be established. Each <strong>of</strong> these zones isdescribed further below and shown graphically on Figure 1-1.o Zone 1: Zone 1 includes the natural, ungraded slope and continues to the edge <strong>of</strong> theengineered slope. Existing vegetation in this zone needs to be thinned selectively toreduce the fuel volume and lower the intensity <strong>of</strong> any fire that may approach buildings.Foliage mass reduction is accomplished by removing large shrubby plants and densegroupings. The thinning <strong>of</strong> these plants needs to be conducted in such a way as tocreate a natural appearance and not expose excess soil areas that would then besusceptible to erosion.o Zone 2: Zone 2 is the next zone inward from the natural, ungraded terrain, where low,slow-burning plantings should predominate. The volume <strong>of</strong> vegetation in this zoneneeds to be reduced and replaced with fire-resistant plant materials from both thenaturalizing and ornamental plant palettes. Their low growth and limited foliage masscan diminish the intensity <strong>of</strong> wildfires, and prevent erosion <strong>of</strong> the slope.2006 PAGE 7 - 19
Natural <strong>Hazard</strong>s <strong>Mitigation</strong> PlanCity <strong>of</strong> <strong>Glendale</strong>, <strong>California</strong>Section 7 – Wildfireso Zone 3: This zone can vary between 20 and 25 feet in width, depending upon thedegree <strong>of</strong> fire risk in the area, and consists <strong>of</strong> fire-retardant plantings. This zone isreferred to as the fire buffer zone or maximum fire prevention edge, and includes plantsfrom both the ornamental and naturalizing palettes that require regular irrigation andweed control. Although some drought tolerant plants may be acceptable in this area,higher water and maintenance demands actually help achieve the maximum fire barrier.The plants in this zone are typically ground covers and plants with low fuel volumes.o Zone 4: This zone is the area immediately surrounding the structure whereornamental plantings are preferred. The plants in this zone should be carefully selectedand placed. The amount <strong>of</strong> tall trees should be limited. Foliage should be thinned anddead branches and vegetation removed from those areas next to the building.Figure 7.1: <strong>Glendale</strong>’s Hillside Planting Zones(from the City <strong>of</strong> <strong>Glendale</strong> Landscape Guidelines for Hillside Development)Zone 4 Zone 3 Zone 2 Zone 1These standards require property owners in fire hazard areas, especially at the urban-wildlandinterface, to conduct maintenance, modifying or removing non-fire-resistive vegetation aroundtheir structures to reduce the fire danger. This affects any person who owns, leases, controls,operates, or maintains a building or structure in, upon, or adjoining the UWI area. Other2006 PAGE 7 - 20
Natural <strong>Hazard</strong>s <strong>Mitigation</strong> PlanCity <strong>of</strong> <strong>Glendale</strong>, <strong>California</strong>Section 7 – Wildfiresspecific maintenance actions that can be undertaken by property owners in the fire hazard areasinclude:‣ Remove all dead vegetation and keep grasses and weeds maintained within 100 feet <strong>of</strong> anybuilding and within 10 feet <strong>of</strong> any roadway. These provisions are part <strong>of</strong> an amendment tothe <strong>Hazard</strong>ous Vegetation Ordinance adopted in 1990. In extreme cases, clearance up to 200feet from a structure and 50 feet from a roadway may be required by the Fire Department.‣ Grasses and other vegetation located more than 30 feet from any building and less than 18inches in height may be maintained where necessary to prevent erosion. Large trees andshrubs in that area should be at least 18 feet apart.‣ Remove leafy foliage, dead wood, combustible ground cover, twigs, or branches within 3feet <strong>of</strong> the ground from mature trees located within 100 feet <strong>of</strong> any building or within 10feet <strong>of</strong> any roadway.‣ Remove dead limbs, branches, and other combustible matter from trees or other growingvegetation adjacent to or overhanging any structure.‣ Remove any portion <strong>of</strong> a tree that extends within 10 feet <strong>of</strong> a chimney or stovepipe.‣ Trim and maintain all vegetation away from the curb line up to a height <strong>of</strong> 13.5 feet toaccommodate emergency vehicles.‣ Maintain 5 feet vertical clearance between ro<strong>of</strong> surfaces and any overhanging portions <strong>of</strong>trees.‣ Property owners in the urban-wildland interface area can request that the Fire Departmentconduct a comprehensive fire safety survey <strong>of</strong> their homes and property. The FireDepartment inspects the residences for compliance with applicable regulations, and preparesa report for use by the homeowner to reduce its fire hazard. Implementation <strong>of</strong> therecommended mitigation measures may help the homeowner obtain a reduction in the cost<strong>of</strong> fire insurance.It is the philosophy <strong>of</strong> the <strong>Glendale</strong> Fire Department to prevent catastrophic brush firesthrough comprehensive code enforcement efforts and, when necessary, a rapid response <strong>of</strong>properly trained and equipped firefighters. Successfully preventing fires requires a partnershipbetween the community and the <strong>Glendale</strong> Fire Department to maintain the hill areas free <strong>of</strong>hazardous brush and combustible vegetation.Prescribed Fire: As discussed previously, before modern settlement began, the areaexperienced small but frequent wildfires that impacted primarily the grasses and low-lyingbushes, without severely damaging the tree stands. As man-made structures were built in thesefire-susceptible areas, there was a strong effort to suppress fires, since these would threaten thestructures and people living there. As a result, dense stands <strong>of</strong> vegetation have accumulatedlocally in the outlying areas, while increasingly larger numbers <strong>of</strong> people have moved into theurban-wildland interface. Over time, fire suppression and increasing populations have producedthese results:o Increased losses to life, property, and resources.o Difficulty <strong>of</strong> fire suppression, increased safety problems for firefighters, and reducedproductivity by fire crews on perimeter lines.o Longer periods between recurring fires for many vegetation types by a factor <strong>of</strong> 5 ormore.o Increased volume <strong>of</strong> fuel per acre.o Increased fire intensities.2006 PAGE 7 - 21
Natural <strong>Hazard</strong>s <strong>Mitigation</strong> PlanCity <strong>of</strong> <strong>Glendale</strong>, <strong>California</strong>Section 7 – Wildfireso Increased taxpayer costs and property losses.Recognition <strong>of</strong> these problems has led to vegetation management programs such as thosedescribed above, and in some areas, prescribed fires. A prescribed fire is deliberately set undercarefully controlled and monitored conditions. The purpose is to remove brush and otherundergrowth that can fuel uncontrolled fires. Prescribed fire is used to alter, maintain or restorevegetative communities, achieve desired resource conditions, and to protect life and propertythat would be degraded by wildland fire. Prescribed fire is only accomplished through managedignition and should be supported by planning documents and appropriate environmentalanalyses.Since 1981, prescribed fire has been the primary means <strong>of</strong> fuel management in Federal and <strong>State</strong>owned lands. Approximately 500,000 acres — an average <strong>of</strong> 30,000 acres a year — have beentreated with prescribed fire under the vegetation management program throughout the <strong>State</strong>. Inthe past, the typical vegetation management project targeted large wildland areas. Now,increasing development pressures (with increased populations) at the urban-wildland interface<strong>of</strong>ten preclude the use <strong>of</strong> large prescribed fires. Many still find the notion <strong>of</strong> “prescribed fire”difficult to accept since for the last 100 years or so, humans have attempted to suppress andfight fires. Prescribed fire also carries a risk, as recent experiences in New Mexico and Arizonahave shown. The Cerro Grande fire began when a prescribed burn escaped, destroying severalhundred homes in Los Alamos, New Mexico and burning more than 50,000 acres. It is likelythat this fire will lead to revisions in the guidelines for performing prescribed burns.Furthermore, a recent program review by the CDF has identified needed changes, with focus oncitizen and firefighter safety, and the creation <strong>of</strong> wildfire safety and protection zones.Prescribed fire is not presently being used in the City <strong>of</strong> <strong>Glendale</strong> to mitigate the wildland firehazard. However, the cities <strong>of</strong> <strong>Glendale</strong> and La Canada Flintridge have entered into acooperative agreement with Los Angeles County Fire Department to conduct prescribed fires inthe Descanso Gardens area. This effort will include open space areas within the City <strong>of</strong><strong>Glendale</strong> at the north end <strong>of</strong> the San Rafael Hills. The proposed plan has been approved by allparties involved and is ready to be implemented as soon as all conditions for a safe prescribedfire are met.<strong>Hazard</strong> Abatement Notices: Each spring, the <strong>Glendale</strong> Fire Department mails informationand hazard brush pamphlets to approximately 4,500 residences located in designated High Fire<strong>Hazard</strong> Areas. The purpose <strong>of</strong> this mailing is to remind and inform property owners <strong>of</strong> theirspecific responsibility to mitigate hazardous vegetation conditions. The mailing is followed-up,commencing May 1, by Fire Department fire company inspections <strong>of</strong> residences and lots toensure compliance. Fire department personnel are assigned inspection districts throughout theCity. Fire Department personnel survey the hillside areas and issue notices <strong>of</strong> violation forhazardous vegetation on an annual basis. If abatement work is not completed in a timelymanner, a ”Notice to Abate Fire <strong>Hazard</strong>” is sent and a compliance inspection is conducted 30days later. If abatement is still not satisfactory a “Notice <strong>of</strong> Intention to Abate Public Nuisance”is sent, and a final inspection made after 15 days to ensure compliance. If voluntary complianceis not achieved, the Fire Department may abate the hazardous vegetation using an approvedcontractor, and charge the owner or impose a lien on the property.At this time, per an agreement between <strong>Glendale</strong> and the County <strong>of</strong> Los Angeles, the LosAngeles County Agricultural Commissioner provides for weed abatement on non-compliantimproved properties and approximately 800 vacant lots in the City <strong>of</strong> <strong>Glendale</strong>.Legislated Construction Requirements in Fire <strong>Hazard</strong> Areas: Building constructionstandards for such items as ro<strong>of</strong> coverings, fire doors, and fire resistant materials help protect2006 PAGE 7 - 22
Natural <strong>Hazard</strong>s <strong>Mitigation</strong> PlanCity <strong>of</strong> <strong>Glendale</strong>, <strong>California</strong>Section 7 – Wildfiresstructures from external fires and contain internal fires for longer periods. That portion <strong>of</strong> astructure most susceptible to ignition from a wildland fire is the ro<strong>of</strong>, due to the deposition <strong>of</strong>burning cinders or brands. Burning brands are <strong>of</strong>ten deposited far in advance <strong>of</strong> the actual fireby winds. Ro<strong>of</strong>s can also be ignited by direct contact with burning trees and large shrubs(Fisher, 1995). The danger <strong>of</strong> combustible wood ro<strong>of</strong>s, such as wooden shingles and shakes, hasbeen known to fire fighting pr<strong>of</strong>essionals since 1923, when <strong>California</strong>’s first major urban firedisaster occurred in Berkeley. It was not until 1988, however, that <strong>California</strong> was able to passlegislation calling for, at a minimum, Class C ro<strong>of</strong>ing in fire hazard areas. Then, in the early1990s, there were several other major fires, including the Paint fire <strong>of</strong> 1990 in Santa Barbara,the 1991 Tunnel fire in Oakland/Berkeley, and the 1993 Laguna Beach fire, whose severe losseswere attributed in great measure to the large percentage <strong>of</strong> combustible ro<strong>of</strong>s in the affectedareas. In 1995-1996 new ro<strong>of</strong>ing materials standards were approved by the <strong>California</strong>legislature for Very High Fire <strong>Hazard</strong> Severity Zones.Significantly, the City <strong>of</strong> <strong>Glendale</strong> has been at the forefront <strong>of</strong> the <strong>State</strong> on this issue since theearly 1980s. Specifically, in 1984, <strong>Glendale</strong> adopted a Fire Safe Ro<strong>of</strong>ing Ordinance that requireda minimum Class B ro<strong>of</strong> covering for all new and re-ro<strong>of</strong> applications City-wide. In 1989,<strong>Glendale</strong> adopted legislation (the Fire Safe Ro<strong>of</strong>ing Code) that amended the City’s ro<strong>of</strong>ingrequirements to ban the installation <strong>of</strong> wood ro<strong>of</strong> material City-wide, and to upgrade theminimum classification from B to A in the high fire hazard areas. Today, <strong>Glendale</strong> requires allnew ro<strong>of</strong>s and re-ro<strong>of</strong>s amounting to more than 25 percent <strong>of</strong> the original ro<strong>of</strong> area to be donein Class A ro<strong>of</strong> covering.So what do these Classes A, B and C mean? To help consumers determine the fire resistance <strong>of</strong>the ro<strong>of</strong>ing materials they may be considering, ro<strong>of</strong>ing materials are rated as to their fireresistance into three categories that are based on the results <strong>of</strong> test fire conditions that thesematerials are subjected to under rigorous laboratory conditions, in accordance with test methodASTM-E-108 developed by the American Society <strong>of</strong> Testing Materials. The ratingclassification provides information regarding the capacity <strong>of</strong> the ro<strong>of</strong>ing material to resist a firethat develops outside the building on which the ro<strong>of</strong>ing material is installed (The Institute forLocal Self Government, 1992). The three ratings are as follows:Class A: Ro<strong>of</strong> coverings that are effective against severe fire exposures. Under such exposures,ro<strong>of</strong> coverings <strong>of</strong> this class:o Are not readily flammable;o Afford a high degree <strong>of</strong> fire protection to the ro<strong>of</strong> deck;o Do not slip from position; ando Do not produce flying brands.Class B: Ro<strong>of</strong> coverings that are effective against moderate fire exposures. Under suchexposures, ro<strong>of</strong> coverings <strong>of</strong> this class:o Are not readily flammable;o Afford a moderate degree <strong>of</strong> fire protection to the ro<strong>of</strong> deck;o Do not slip from position; ando Do not produce flying brands.Class C: Ro<strong>of</strong> coverings that are effective against light fire exposures. Under such exposures,ro<strong>of</strong> coverings <strong>of</strong> this class:o Are not readily flammable;o Afford a measurable degree <strong>of</strong> fire protection to the ro<strong>of</strong> deck;o Do not slip from position; ando Do not produce flying brands.2006 PAGE 7 - 23
Natural <strong>Hazard</strong>s <strong>Mitigation</strong> PlanCity <strong>of</strong> <strong>Glendale</strong>, <strong>California</strong>Section 7 – WildfiresNon-Rated Ro<strong>of</strong> coverings have not been tested for protection against fire exposure. Undersuch exposures, non-rated ro<strong>of</strong> coverings:o May be readily flammable;o May <strong>of</strong>fer little or no protection to the ro<strong>of</strong> deck, allowing fire to penetrate intoattic space and the entire building; ando May pose a serious fire brand hazard, producing brands that could ignite otherstructures a considerable distance away.Attic ventilation openings are also a concern regarding the fire survivability <strong>of</strong> a structure.Attics require significant amounts <strong>of</strong> cross-ventilation to prevent the degradation <strong>of</strong> woodrafters and ceiling joists. This ventilation is typically provided by openings to the outside <strong>of</strong> thestructure, but these openings can provide pathways for burning brands and flames to bedeposited within the attic. Therefore, it is important that all ventilation openings be properlyscreened to prevent this. Additional prevention measures that can be taken to reduce thepotential for ignition <strong>of</strong> attic spaces are to “use non-combustible exterior siding materials and tosite trees and shrubs far enough away from the walls <strong>of</strong> the house to prevent flame travel intothe attic even if a tree or shrub does torch” (Fisher, 1995).The type <strong>of</strong> exterior wall construction used can also help a structure survive a fire. Ideally,exterior walls should be made <strong>of</strong> non-combustible materials such as stucco or masonry. Duringa wildfire, the dangerous active burning at a given location typically lasts about 5 to 10 minutes(Fisher, 1995), so if the exterior walls are made <strong>of</strong> non-combustible or fire-resistant materials,the structure has a better chance <strong>of</strong> surviving. For the same reason, the type <strong>of</strong> windows usedin a structure can also help reduce the potential for fire to impact a structure. Single-pane,annealed glass windows are known for not performing well during fires; thermal radiation anddirect contact with flames cause these windows to break because the glass under the windowframe is protected and remains cooler than the glass in the center <strong>of</strong> the window. Thisdifferential thermal expansion <strong>of</strong> the glass causes the window to break. Larger windows aremore susceptible to fracturing when exposed to high heat than smaller windows. Multiple-panewindows, and tempered glass windows perform much better than single-pane windows,although they do cost more. Fisher (1995) indicates that in Australia, researchers have noticedthat the use <strong>of</strong> metal screens helps protect windows from thermal radiation. Some homeownersmay consider the use <strong>of</strong> exterior, heavy-duty metal blinds that are dropped down into position,at least on the windows in the exposed portion <strong>of</strong> the structure facing the wildland area.Fire sprinklers are very effective at controlling structural fires, saving property and lives. In1988, <strong>Glendale</strong> passed an ordinance requiring automatic fire sprinklers in existing structuresfour stories or more in height, and since 1989, the City <strong>of</strong> <strong>Glendale</strong> has required all new oneandtwo-family structures to have fire sprinklers. Fire sprinklers can help contain a fire thatstarts inside a structure from becoming a potential incendiary source, impacting other nearbystructures and brush. Fire sprinklers are not likely to protect a structure from an externalwildland fire, however. Sprinklers permanently mounted on the ro<strong>of</strong> have been suggested as adefensive measure, but most authorities argue against the value <strong>of</strong> external sprinklers as a viablealternative to fire-resistant ro<strong>of</strong>ing materials(http://www.fs.fed.us/psw/publications/documents/gtr-050/struct.html).The City <strong>of</strong> <strong>Glendale</strong> has adopted the <strong>California</strong> Building and Fire Codes with local additionsand amendments (City Ordinance 5329 - <strong>Glendale</strong> Building and Safety Code, Volume I, Section715 which deals with construction requirements in fire hazard areas, and Volume VI, whichpertains to fire and life-safety requirements). These additions and amendments make the<strong>Glendale</strong> Building and Safety Code more restrictive than the minimum <strong>State</strong> Code / modelordinance. For specific requirements regarding ro<strong>of</strong>ing standards (non-combustible Class Aro<strong>of</strong>s), construction materials and standards including fire resistive siding and eaves, the2006 PAGE 7 - 24
Natural <strong>Hazard</strong>s <strong>Mitigation</strong> PlanCity <strong>of</strong> <strong>Glendale</strong>, <strong>California</strong>Section 7 – Wildfiresorientation and placement <strong>of</strong> window glazing, sprinklers, etc., contact the Fire PreventionBureau and Building Section <strong>of</strong> the City <strong>of</strong> <strong>Glendale</strong>.Public Awareness: Individuals can make an enormous contribution to fire hazard reductionand need to be educated about their important role. The <strong>Glendale</strong> Fire Department has severaloutreach programs aimed at providing fire safety education to the public. These presentationsare given to local schools, service clubs and associations, homeowners groups, the Chamber <strong>of</strong>Commerce, Board <strong>of</strong> Realtors, businesses and other pr<strong>of</strong>essional organizations. The Jr. FireProgram, which is more than 50 years old, sends firefighters into all <strong>of</strong> the 5 th grade classes inthe area to teach fire safety and awareness. A picnic at the end <strong>of</strong> the school year is held tohonor those students that demonstrated exceptional participation in the program. EveryOctober, the Fire Department also contracts with a theater group to present fire safetyprograms to all elementary schools in <strong>Glendale</strong>.One <strong>of</strong> the most recent public education tools used by the Fire Department is the Fire SafetyTrailer, which is operated in conjunction with the Burbank and Pasadena Fire Departments.The trailer provides a scaled version <strong>of</strong> a house, where children can learn and practice lifesavingprocedures. These and many other public education and outreach programs that the FireDepartment <strong>of</strong>fers are described in the Fire Department’s effective web site(http://fire.ci.glendale.ca.us/). This web site is also an education tool that residents can refer t<strong>of</strong>or additional information regarding how to deal with fire and other natural and man-madehazards.The Fire Department has also prepared and distributes informational brochures to hillsideproperty owners. The brochures describe mitigation measures that can be implemented toreduce the fire hazard, and describe how property owners can help themselves to prevent loss <strong>of</strong>property or life as a result <strong>of</strong> a wildland fire. In addition to the specific requirements in theMunicipal Code mentioned in the sections above regarding appropriate landscaping andconstruction materials, there are other steps that homeowners can take to reduce the risk <strong>of</strong> fireon their property. Some <strong>of</strong> these are listed below. This list is not all-inclusive, but provides astarting point and framework to work from.‣ Mow and irrigate your lawn regularly.‣ Dispose <strong>of</strong> cuttings and debris promptly, according to local regulations.‣ Store firewood away from the house.‣ Be sure the irrigation system is well maintained.‣ Use care when refueling garden equipment and provide regular maintenance for yourgarden equipment.‣ Store and use flammable liquids properly.‣ Dispose <strong>of</strong> smoking materials carefully.‣ Do not light fireworks (in accordance with the Municipal Code).‣ Become familiar with local regulations regarding vegetation clearing, disposal <strong>of</strong> debris, andfire safety requirements for equipment.‣ Follow manufacturers’ instructions when using fertilizers and pesticides.‣ Keep the gutters, eaves, and ro<strong>of</strong> clear <strong>of</strong> leaves and other debris.‣ Occasionally inspect your home, looking for deterioration, such as breaks and spacesbetween ro<strong>of</strong> tiles, warping wood, or cracks and crevices in the structure.‣ Use non-flammable metal when constructing a trellis and cover it with high-moisture, nonflammablevegetation.‣ Install automatic seismic shut-<strong>of</strong>f valves for the main gas line to your house. Informationfor approved devices, as well as installation procedures, is available from the Southern2006 PAGE 7 - 25
Natural <strong>Hazard</strong>s <strong>Mitigation</strong> PlanCity <strong>of</strong> <strong>Glendale</strong>, <strong>California</strong>Section 7 – Wildfires<strong>California</strong> Gas Company.Other <strong>Mitigation</strong> Programs and Activities:Firewise: This is a program developed within the National Wildland/ Urban Interface FireProtection Program and it is the primary federal program addressing interface fire. It isadministered through the National Wildfire Coordinating Group whose extensive list <strong>of</strong>participants includes a wide range <strong>of</strong> federal agencies. The program is intended to empowerplanners and decision makers at the local level. Through conferences and informationdissemination, Firewise increases support for interface wildfire mitigation by educatingpr<strong>of</strong>essionals and the general public about hazard evaluation and policy implementationtechniques. Firewise <strong>of</strong>fers online wildfire protection information and checklists, as well aslistings <strong>of</strong> other publications, videos and conferences.The interactive home page allows users to ask fire protection experts questions and to registerfor new information as it becomes available.FireFree Program: This is a unique private/public program for interface wildfire mitigationinvolving partnerships between an insurance company and local government agencies. It is anexample <strong>of</strong> an effective non-regulatory approach to hazard mitigation. Originating in Bend,Oregon, the program was developed in response to the city's "Skeleton Fire" <strong>of</strong> 1996, whichburned over 17,000 acres and damaged or destroyed 30 homes and structures. Bend sought tocreate a new kind <strong>of</strong> public education initiative that emphasized local involvement. SAFECOInsurance Corporation was a willing collaborator in this effort. Bend's pilot program included:1. A short video production featuring local citizens as actors, made available at local videostores, libraries and fire stations;2. Two city-wide yard debris removal events;3. A 30-minute program on a model FireFree home, aired on a local cable televisionstation; and4. Distribution <strong>of</strong> brochures, featuring a property owner evaluation checklist and a listing<strong>of</strong> fire-resistant indigenous plants.Wildfire <strong>Mitigation</strong> Action ItemsAs stated in the Federal Wildland Fire Policy, “The problem is not one <strong>of</strong> finding new solutionsto an old problem but <strong>of</strong> implementing known solutions. Deferred decision making is as much aproblem as the fires themselves. If history is to serve us in the resolution <strong>of</strong> the wildland/urbaninterface problem, we must take action on these issues now. To do anything less is to guaranteeanother review process in the aftermath <strong>of</strong> future catastrophic fires.”The wildfire mitigation action items below provide direction on specific activities thatorganizations and residents <strong>of</strong> southern <strong>California</strong>, including <strong>Glendale</strong>, can undertake to reducerisk and prevent loss from wildfire events. Each action item is followed by ideas forimplementation, which can be used by the steering committee and local decision makers inpursuing strategies for implementation.Short Term – Wildfire #1:Action Item: Enhance outreach and education programs aimed at mitigating wildfire hazardsand reducing or preventing the exposure <strong>of</strong> citizens, public agencies, private property ownersand businesses to natural hazards.2006 PAGE 7 - 26
Natural <strong>Hazard</strong>s <strong>Mitigation</strong> PlanCity <strong>of</strong> <strong>Glendale</strong>, <strong>California</strong>Section 7 – WildfiresIdeas for Implementation:♦ Continue the hiring <strong>of</strong> fire prevention and education personnel to oversee educationprograms.♦ Continue to train in all areas <strong>of</strong> fire prevention.♦ Visit urban interface neighborhoods and rural areas and conduct education and outreachactivities.♦ Conduct specific community-based demonstration projects <strong>of</strong> fire prevention andmitigation in the urban interface.♦ Establish neighborhood "drive-through" activities that pinpoint site-specific mitigationactivities. Fire crews can give property owners suggestions and assistance.♦Perform public outreach and information activities at fire stations by creating "WildfireAwareness Week" activities. Fire stations can hold open houses and allow the public tovisit, see the equipment and discuss wildfire mitigation with the station crews.Coordinating Organization:Timeline:Plan Goals Addressed:Constraints:Fire DepartmentOngoingProtect Life and Property, Public AwarenessPending funding and available personnel2006 PAGE 7 - 27
Natural <strong>Hazard</strong>s <strong>Mitigation</strong> PlanCity <strong>of</strong> <strong>Glendale</strong>, <strong>California</strong>Section 7 – WildfiresShort Term – Wildfire #2:Action Item: Enhance emergency services to increase the efficiency <strong>of</strong> wildfire response andrecovery activities.Ideas for Implementation:♦ Continue to develop and increase training and outreach programs.♦ Evaluate internal and external notification systems that include all at-riskurban/wildland interface residents in the jurisdiction in order to contact them duringevacuations.Coordinating Organization:Timeline:Plan Goals Addressed:Constraints:Fire Department2 yearsEmergency ServicesPending funding and available personnelShort Term – Wildfire #3:Action Item: Educate agency personnel on federal cost-share and grant programs, FireProtection Agreements and other related federal programs so the full array <strong>of</strong> assistanceavailable to local agencies is understood.Ideas for Implementation:♦ Investigate potential funding opportunities for individual mitigation projects; and♦Develop, approve and promote Fire Protection Agreements and partnerships to clarifyroles and responsibilities and to provide for fire mitigation activities and suppressionpreparedness,Coordinating Organization:Timeline:Plan Goals Addressed:Constraints:Fire Department1-2 yearsProtect Life and Property, Public AwarenessPending funding and available personnelShort Term – Wildfire #4:Action Item: Inventory alternative firefighting water sources and encourage the development<strong>of</strong> additional sources.Ideas for Implementation:♦♦Advocate for water storage facilities with fire-resistant electrical pump or gravity fedsystems in facilities that are not connected to a community water or hydrant system.Review protocol for fire department and water district to communicate all hydrantoutages and water shortage information.Coordinating Organization: Fire, Planning, Water and PowerTimeline:1 yearPlan Goals Addressed:Protect Life and PropertyConstraints:Pending funding and availablepersonnel2006 PAGE 7 - 28
Natural <strong>Hazard</strong>s <strong>Mitigation</strong> PlanCity <strong>of</strong> <strong>Glendale</strong>, <strong>California</strong>Section 7 – WildfiresL ong Term – Wildfire #l:Action Item: Encourage development and dissemination <strong>of</strong> maps relating to the fire hazard tohelp educate and assist builders and homeowners in being engaged in wildfire mitigationactivities and to help guide emergency services during response.Ideas for Implementation:♦♦♦Update wildland/urban interface maps.Conduct risk analysis incorporating data and the created hazard maps using GIStechnology to identify risk sites and further assist in prioritizing mitigation activities.Encourage coordination between fire jurisdictions and sanitary districts to make surethat the most accurate elevation maps are being used.Coordinating Organization:Timeline:Plan Goals Addressed:Constraints:Fire Department1-3 yearsProtect Life and PropertyPending funding and available personnelL ong Term – Wildfire #2:Action Item: Increase communication, coordination and collaboration between wildland/urbaninterface property owners, local and county planners and fire prevention crews and <strong>of</strong>ficials toaddress risks, existing mitigation measures and federal assistance programs.Ideas for Implementation:♦♦♦♦♦Encourage single-family residences to have fire plans and practice evacuation routes.Encourage fire inspections in residential homes by fire departments to increaseawareness among homeowners and potential fire responders.Encourage a standard for the <strong>State</strong> Fire Marshal to evaluate fire plans and emergencyplans.Encourage fire department notification <strong>of</strong> new business applications to ensure thatappropriate fire plans have been developed.Encourage local zoning and planning entities to work closely with landowners and/ordevelopers who choose to build in the wildland/urban interface to identify and mitigateconditions that aggravate wildland/urban interface wildfire hazards, including:♦ Limited access for emergency equipment due to width and grade <strong>of</strong> roadways;♦ Inadequate water supplies and the spacing, consistency and species <strong>of</strong> vegetationaround structures;♦ Inadequate fuel breaks, or lack <strong>of</strong> defensible space;♦ Highly flammable construction materials;♦ Building lots and subdivisions that are not in compliance with state and local landuse and fire protection regulations;♦ Inadequate entry/escape routes.2006 PAGE 7 - 29
Natural <strong>Hazard</strong>s <strong>Mitigation</strong> PlanCity <strong>of</strong> <strong>Glendale</strong>, <strong>California</strong>Section 7 – Wildfires♦ Encourage all new homes and major remodels involving ro<strong>of</strong>s additions that are locatedin the interface to have fire resistant ro<strong>of</strong>s and residential sprinkler systems.♦Encourage the public to evaluate access routes to rural homes for fire-fighting vehiclesand to develop passable routes if they do not exist.Coordinating Organization: Fire Department, Building & Safety, Planning,Information ServicesTimeline:Plan Goals Addressed:OngoingProtect Life and Property, Public Awareness,Emergency Services, Partnerships and ImplementationConstraints : Pending funding and available personnelLong Term – Wildfire #3:Action Items: Encourage implementation <strong>of</strong> wildfire mitigation activities in a mannerconsistent with the goals <strong>of</strong> promoting sustainable ecological management and communitystability.Ideas for Implementation:♦ Employ mechanical or other appropriate thinning technique to abate the risk <strong>of</strong>catastrophic fire and restore the more natural regime <strong>of</strong> high frequency, low-intensityburns. Prescribed burning can provide benefit to ecosystems by thinning hazardousvegetation and restoring ecological diversity to areas homogenized by invasive plants.♦♦Clear trimmings, trees, brush and other debris completely from sites when performingroutine maintenance and landscaping to reduce fire risk.Enhance programs to coordinate and monitor adjacent areas that utilize prescribedburning techniques.Coordinating Organization: Fire DepartmentTimeline:Plan G oals Addressed:OngoingNatural SystemsConstraints:Pending funding and available personnel2006 PAGE 7 - 30
Natural <strong>Hazard</strong>s <strong>Mitigation</strong> PlanCity <strong>of</strong> <strong>Glendale</strong>, <strong>California</strong>Section 7 – WildfiresWildfire Resource DirectoryLocal Resources:<strong>Glendale</strong> Fire Department: The <strong>Glendale</strong> Fire Department is responsible for fire suppressionon all private lands within the city <strong>of</strong> <strong>Glendale</strong>. The <strong>Glendale</strong> Fire Department constantlymonitors the fire hazard in the city and has ongoing programs for investigation and alleviation<strong>of</strong> hazardous situations. Fire fighting resources in the immediate <strong>Glendale</strong> area are provided by<strong>Glendale</strong> Fire Department Station Nos. 21, 22, 23, 24, 25, 26, 27, 28, and 29. [Fire Stations 26and 29 are no longer adequate for the Fire Department’s needs due to the buildings’ age,physical condition and size. Efforts are ongoing to find adequate alternative locations for thesetwo stations. The preferred alternatives are expected to be located south <strong>of</strong> the 134 Freeway. ]The Fire Department is comprised <strong>of</strong> 12 fire companies with nine engine companies and threetruck companies. The Department also staffs four rescue ambulances. These data aresummarized by fire station on Table 7.4 below. Staffing at these stations is as follows: 4 crewper each ladder truck and engine company, and 2 firefighter paramedics per rescue ambulance.The <strong>Glendale</strong> Fire Department is a member <strong>of</strong> the Verdugo Fire Communications Center(VFCC) that provides dispatch services to nine cities, including <strong>Glendale</strong>.FireStationNo.Table 7.4: Fire Stations and Facilities in the City <strong>of</strong> <strong>Glendale</strong>Street AddressFire Companies and AmbulancesLadderTruckCompaniesEngineCompaniesRescueAmbulances21 421 Oak Street 1 1 122 1201 S. <strong>Glendale</strong> Ave. 1 0 023 3303 E. Chevy Chase Drive 1 0 024 1734 Canada Blvd. 1 0 025 353 N. Chevy Chase Drive 1 0 126 1145 N. Brand Blvd. 1 1 127 1127 Western Ave. 1 0 028 4410 New York Ave. 1 0 029 2465 Honolulu Ave. 1 1 1FacilityStreet AddressFire Mechanical Maintenance210 E. Palmer AvenueVerdugo Fire Communications Center421 Oak StreetFire Prevention Bureau420 Harvard StreetFire Training541 W. Chevy Chase DriveEnvironmental Management Center780 Flower Street<strong>Glendale</strong> has automatic aid agreements with the adjacent cities <strong>of</strong> Burbank, Pasadena, and LosAngeles, and with the County <strong>of</strong> Los Angeles. These agreements obligate the departments tohelp each other under pre-defined circumstances. Automatic aid agreements obligate thenearest fire company to respond to a fire regardless <strong>of</strong> the jurisdiction. Mutual aid agreementsobligate fire department resources to respond outside <strong>of</strong> their district upon request forassistance.2006 PAGE 7 - 31
Natural <strong>Hazard</strong>s <strong>Mitigation</strong> PlanCity <strong>of</strong> <strong>Glendale</strong>, <strong>California</strong>Section 7 – WildfiresThe <strong>Glendale</strong> Fire Department is party to an agreement that authorizes calls for emergencyresponse to be dispatched through the Verdugo Joint Fire Communications Center, whichcoordinates 33 different stations in the region. This “region” includes stations not only from<strong>Glendale</strong>, but also from Burbank, Pasadena, San Marino, South Pasadena, Monrovia, Arcadia,Sierra Madre and San Gabriel. The Verdugo Joint Fire Communications Center is located onthe third floor <strong>of</strong> Fire Station 21 in <strong>Glendale</strong>, at 421 Oak Street. Dialing 911 in any <strong>of</strong> the citiesserved by the Verdugo Fire Communications Center connects the caller to police or <strong>California</strong>Highway Patrol dispatchers, who determine the nature <strong>of</strong> the emergency, and transfer fire andparamedic calls to the Verdugo Communications Center. A dispatcher at Verdugo enters thepertinent details into the computer for transmittal via radio to the fire station that is dispatchedfor that particular incident. Emergency personnel are on the road within 1 to 2 minutes <strong>of</strong>receiving the call, and remain in constant radio contact with the Verdugo CommunicationsCenter as additional details are received.Numerous other agencies are available to assist the City if needed. Several Federal agencieshave roles in fire hazard mitigation, response, and recovery, including: the Fish and WildlifeService, National Park Service, US Forest Service, Natural Resource Conservation Service,Office <strong>of</strong> Aviation Services, National Weather Service, and National Association <strong>of</strong> <strong>State</strong>Foresters. The <strong>State</strong> Office <strong>of</strong> Emergency Services can be called upon for further aid ifnecessary, as can Federal agencies, including the Department <strong>of</strong> Agriculture, the Department <strong>of</strong>the Interior, and, in extreme cases, the Department <strong>of</strong> Defense. Private companies andindividuals may also assist.County Resources:Los Angeles County Fire Department1320 N. Eastern Ave.Los Angeles, CA. 90063Telephone: (323).881-2411http://www.lac<strong>of</strong>d.org/default.htm<strong>State</strong> Resources:<strong>California</strong> Division <strong>of</strong> Forestry & Fire Protection1416 9th StreetPO Box 944246Sacramento <strong>California</strong> 94244-2460(916) 653-5123http://www.fire.ca.gov/php/index.php2006 PAGE 7 - 32
Natural <strong>Hazard</strong>s <strong>Mitigation</strong> PlanCity <strong>of</strong> <strong>Glendale</strong>, <strong>California</strong>Section 7 – WildfiresOffice <strong>of</strong> the <strong>State</strong> Fire Marshal (OSFM)1131 "S" StreetSacramento, CA 95814PO Box 944246Sacramento, CA 94244-2460Tel. (916) 445-8200Fax. (916) 445-8509Federal Resources and Programs:The role <strong>of</strong> the federal land managing agencies in the wildland /urban interface is reducing fuelhazards on the lands they administer; cooperating in prevention and education programs;providing technical and financial assistance; and developing agreements, partnerships andrelationships with property owners, local protection agencies, states and other stakeholders inwildland/urban interface areas. These relationships focus on activities before a fire occurs,which render structures and communities safer and better able to survive a fire occurrence.Federal Emergency Management Agency (FEMA) Programs: FEMA is directlyresponsible for providing fire suppression assistance grants and, in certain cases, major disasterassistance and hazard mitigation grants in response to fires. The role <strong>of</strong> FEMA in the wildland/urban interface is to encourage comprehensive disaster preparedness plans and programs,increase the capability <strong>of</strong> state and local governments and provide for a greater understanding<strong>of</strong> FEMA programs at the Federal, <strong>State</strong> and local levels.• Fire Suppression Assistance Grants: Fire Suppression Assistance Grants may beprovided to a state with an approved hazard mitigation plan for the suppression <strong>of</strong> aforest or grassland fire that threatens to become a major disaster on public or privatelands. These grants are provided to protect life and improved property and encouragethe development and implementation <strong>of</strong> viable multi-hazard mitigation measures andprovide training to clarify FEMA's programs. The grant may include funds forequipment, supplies and personnel. A Fire Suppression Assistance Grant is the form <strong>of</strong>assistance most <strong>of</strong>ten provided by FEMA to a state for a fire.The grants are cost-shared with states. FEMA’s US Fire Administration (USFA)provides public education materials addressing wildland/urban interface issues and theUSFA's National Fire Academy provides training programs.• FEMA <strong>Hazard</strong> <strong>Mitigation</strong> Grant Program: Following a major disaster declaration,the FEMA <strong>Hazard</strong> <strong>Mitigation</strong> Grant Program provides funding for long-term hazardmitigation projects and activities to reduce the possibility <strong>of</strong> damages from all future firehazards and to reduce the costs to the nation for responding to and recovering from thedisaster.National Wildland/Urban Interface Fire Protection Program:Federal agencies can use the National Wildland/Urban Interface Fire Protection Program t<strong>of</strong>ocus on wildland/urban interface fire protection issues and actions. The Western Governors'Association (WGA) can act as a catalyst to involve state agencies, as well as local and privatestakeholders, with the objective <strong>of</strong> developing an implementation plan to achieve a uniform,integrated national approach to hazard and risk assessment and fire prevention and protectionin the wildland/urban interface. The program helps states develop viable and comprehensivewildland fire mitigation plans and performance-based partnerships.2006 PAGE 7 - 33
Natural <strong>Hazard</strong>s <strong>Mitigation</strong> PlanCity <strong>of</strong> <strong>Glendale</strong>, <strong>California</strong>Section 7 – WildfiresU.S. Forest Service:The U. S. Forest Service (USFS) is involved in a fuel-loading program implemented to assessfuels and reduce hazardous buildup on forest lands. The USFS is a cooperating agency and,while it has little to no jurisdiction in the lower valleys, it has an interest in preventing fires inthe interface, as fires <strong>of</strong>ten burn up the hills and into the higher elevation US forest lands.Other Federal and National Resources:Federal Wildland Fire Policy, Wildland/Urban Interface ProtectionThis is a report describing federal policy and interface fire. Areas <strong>of</strong> needed improvement areidentified and addressed through recommended goals and actions.http://www.fs.fed.us/land/wdfire7c.htmNational Fire Protection Association (NFPA)This is the principal federal agency involved in the National Wildland/Urban Interface FireProtection Initiative. NFPA has information on the Initiatives programs and documents.Public Fire Protection Division1 Battery March Park.P.O. Box 9101Quincy, MA 02269-9101Phone: (617) 770-3000National Interagency Fire Center (NIFC)The NIFC in Boise, Idaho is the nation’s support center for wildland firefighting. Seven federalagencies work together to coordinate and support wildland fire and disaster operations. Theseagencies include the Bureau <strong>of</strong> Indian Affairs, Bureau <strong>of</strong> Land Management, Forest Service, Fishand Wildlife Service, National Park Service, National Weather Service and Office <strong>of</strong> AircraftNational Interagency Fire Center3833 S. Development Ave.Boise, Idaho 83705(208) 387-5512http://www.nifc,gov/United <strong>State</strong>s Fire Administration (USFA) <strong>of</strong> the Federal Emergency ManagementAgency (FEMA)As an entity <strong>of</strong> the Federal Emergency Management Agency, the mission <strong>of</strong> the USFA is toreduce life and economic losses due to fire and related emergencies through leadership,advocacy, coordination and support.USFA, Planning Branch, <strong>Mitigation</strong> Directorate16825 S. Seton Ave.Emmitsburg, MD 21727(301) 447-1000http://www.fema.gov/hazards/fires/wildfires.shtm - Wildfire <strong>Mitigation</strong>http://www.usfa.fema.gov/index.htm - U.S. Fire AdministrationAdditional Resources:Firewise - The National Wildland/Urban Interface Fire programFirewise maintains a <strong>Web</strong>site designed for people who live in wildfire prone areas, but it alsocan be <strong>of</strong> use to local planners and decision makers. The site <strong>of</strong>fers online wildfire protectioninformation and checklists, as well as listings <strong>of</strong> other publications, videos and conferences.Firewise1 Battery March Park.P.O. Box 91012006 PAGE 7 - 34
Natural <strong>Hazard</strong>s <strong>Mitigation</strong> PlanCity <strong>of</strong> <strong>Glendale</strong>, <strong>California</strong>Section 7 – WildfiresQuincy, MA 02269-9101Phone: (617) 770-3000http://www.firewise.org/Publications:National Fire Protection Association Standard 299: Protection <strong>of</strong> Life and Property fromWildfire, National Wildland/Urban Interface Fire Protection Program, (1991), National FireProtection Association, Washington, D.C.This document, developed by the NFPA Forest and Rural Fire Protection Committee, providescriteria for fire agencies, land use planners, architects, developers and local governments to usein the development <strong>of</strong> areas that may be threatened by wildfire. To obtain this resource:National Fire Protection Association Publications(800) 344-3555http://www.nfpa.org or http://www.firewise.orgAn International Collection <strong>of</strong> Wildland- Urban Interface Resource Materials(Information Report NOR- 344). Hirsch, K., Pinedo, M., & Greenlee, J. (1996). Edmonton,Alberta: Canadian Forest Service.This is a comprehensive bibliography <strong>of</strong> interface wildfire materials. Over 2,000 resources areincluded, grouped under the categories <strong>of</strong> general and technical reports, newspaper articles andpublic education materials. The citation format allows the reader to obtain most items througha library or directly from the publisher. The bibliography is available in hard copy or diskette atno cost. It is also available in downloadable <strong>PDF</strong> form.Canadian Forest Service, Northern Forestry Centre, I-Zone SeriesPhone: (780) 435-7210http://www.prefire.ucfpl.ucop.edu/uwibib.htmWildland/Urban Interface Fire <strong>Hazard</strong> Assessment Methodology.National Wildland/Urban Interface Fire Protection Program, (1998).NFPA, Washington, D.C.Firewise (NFPA Public Fire Protection Division)Phone: (617) 984-7486http://www.firewise.orgFire Protection in the Wildland/Urban Interface: Everyone’s Responsibility.National Wildland/Urban Interface Fire Protection Program, (1998). Washington, D.C.Firewise (NFPA Public Fire Protection Division)Phone: (617) 984-7486http://www.firewise.org2006 PAGE 7 - 35
Natural <strong>Hazard</strong>s <strong>Mitigation</strong> PlanCity <strong>of</strong> <strong>Glendale</strong>, <strong>California</strong>SECTION 8:Section 8 – FloodsFLOODSTable <strong>of</strong> ContentsWhy Are Floods A Threat To The City Of <strong>Glendale</strong>? ............................................. 8-1History <strong>of</strong> Flooding in the City <strong>of</strong> <strong>Glendale</strong> ...........................................................................8-3Historic Flooding in Los Angeles County................................................................................8-5What Factors Create Flood Risk................................................................................................8-7How Are Flood-Prone Areas Identified? ...............................................................................8-10Flood Terminology......................................................................................................................8-11Storm Flooding Characteristics ................................................................................................8-12Dam Failure Flooding.................................................................................................................8-13Effect <strong>of</strong> Development on Floods? ...........................................................................................8-16<strong>Hazard</strong> Assessment .........................................................................................................8-17<strong>Hazard</strong> Identification ..................................................................................................................8-17Vulnerability Assessment ..........................................................................................................8-20Community Flood Issues ...............................................................................................8-21What is Susceptible to Damage During a Flood Event?…………………………..8-21Risk Analysis ................................................................................................................................8-21Community Issues Summary ....................................................................................................8-26Flood <strong>Mitigation</strong> Action Items ....................................................................................8-26Flood Resource Directory ............................................................................................8-29County Resources ........................................................................................................................8-30<strong>State</strong> Resources ............................................................................................................................8-30Federal Resources and Programs ............................................................................................8-30Other National Resources…………………………………………………………...8-31Publications ...................................................................................................................................8-342006 PAGE 8- i
Natural <strong>Hazard</strong>s <strong>Mitigation</strong> PlanCity <strong>of</strong> <strong>Glendale</strong>, <strong>California</strong>SECTION 8:Section 8 – FloodsFLOODSWhy are Floods a Threat to the City <strong>of</strong> <strong>Glendale</strong>?Floods are natural and recurring events that only become hazardous when man encroaches ont<strong>of</strong>loodplains, modifying the landscape and building structures in the areas meant to conveyexcess water during floods. Unfortunately, floodplains have been alluring to populations formillennia since they provide level ground and fertile soils suitable for agriculture, access towater supplies, and transportation routes. These benefits come with a price – flooding is one <strong>of</strong>the most destructive natural hazards, responsible for more deaths per year than any othergeologic hazard. Furthermore, average annual flood losses (in dollars) have increased steadilyover the last decades as development in floodplains has increased. In short, flooding poses athreat to life and safety, and can cause severe damage to public and private property.The city <strong>of</strong> <strong>Glendale</strong> and surrounding areas are, like most <strong>of</strong> southern <strong>California</strong>, subject tounpredictable seasonal rainfall. Most years, the scant winter rains are only enough to turn thehills green for a few weeks, but every few years the region is subjected to periods <strong>of</strong> intense andsustained precipitation that result in flooding. Flood events that occurred in 1969, 1978, 1980,1983, 1992, 1995, and 1998 have caused an increased awareness <strong>of</strong> the potential for public andprivate losses as a result <strong>of</strong> this hazard, particularly in highly urbanized parts <strong>of</strong> floodplains andalluvial fans. As the population in Los Angeles County increases, there is an increased pressureto build on flood-prone areas, and in areas upstream <strong>of</strong> already developed areas. With increaseddevelopment, there is also an increase in impervious surfaces, such as asphalt. Water that usedto be absorbed into the ground becomes run<strong>of</strong>f to downstream areas. If the storm drain systemsare not designed or improved to convey these increased flows, areas that may have not floodedin the past may be subject to flooding in the future. This is especially true for developments atthe base <strong>of</strong> the mountains and downstream from canyons that have the potential to conveymudflows.<strong>Glendale</strong> is drained by the south-, southwest-, and west-flowing Verdugo Wash and itstributaries (see Map 8.1). The Verdugo Wash ultimately drains onto the larger Los AngelesRiver at the city’s western boundary. Several streams are tributary to the Verdugo Wash. Fromnorth to south in <strong>Glendale</strong>, these include Cooks Canyon, Dunsmore Canyon, and Ward Canyon.Streams or channels that flow out <strong>of</strong> the San Gabriel Mountains, through the La Crescenta andLa Cañada – Flintridge areas and into Verdugo Wash include Shields Canyon, Eagle Canyon,Pickens Canyon, Hall Beckley Canyon, and Winery Canyon. Several streams emanate from thenorth and east sides <strong>of</strong> the Verdugo Mountains and make their way into Verdugo Wash as well.These include, again from north to south, La Tuna, Las Barras, Sheep Corral, Cunningham,Henderson, Engleheard, Deer and Dead Horse Canyons.In the western portion <strong>of</strong> the city, the Burbank Western Channel extends through a smallportion <strong>of</strong> <strong>Glendale</strong> on the channel’s final stretch before emptying into the Los Angeles River.Other canyons draining <strong>of</strong>f the south flank <strong>of</strong> the Verdugo Mountains include, from west to east,Childs, Brand, Idlewood, Sherer, Hillcrest, Toll, Brookman and Mand Canyons. Several smalland two large canyons drain the western and southwestern2006 PAGE 8- 1
Natural <strong>Hazard</strong>s <strong>Mitigation</strong> PlanCity <strong>of</strong> <strong>Glendale</strong>, <strong>California</strong>Section 8 – FloodsMap 8.1: Geomorphic Map <strong>of</strong> <strong>Glendale</strong> Showing the Canyons Referred to in the Textportions <strong>of</strong> the San Rafael Hills. Most <strong>of</strong> the small canyons in the northwestern portion <strong>of</strong> theSan Rafael Hills are unnamed, except for Kirby Canyon. The two large ones are SycamoreCanyon and Scholl Canyon. There are also a few unnamed streams in the San Rafael Hills2006 PAGE 8- 2
Natural <strong>Hazard</strong>s <strong>Mitigation</strong> PlanCity <strong>of</strong> <strong>Glendale</strong>, <strong>California</strong>Section 8 – Floodswhose headwaters are in <strong>Glendale</strong> but drain to the east, toward Arroyo Seco. Several <strong>of</strong> thecanyons in the San Gabriel and Verdugo Mountains have debris basins that were built for floodprotection purposes. Most <strong>of</strong> the streams <strong>of</strong>f the San Gabriel Mountains have been channelizedthrough the La Cañada Valley for flood-protection purposes. Similarly, Verdugo Wash ischannelized through <strong>Glendale</strong>.History <strong>of</strong> Flooding in the City <strong>of</strong> <strong>Glendale</strong>:Floods <strong>of</strong> consequence to the city <strong>of</strong> <strong>Glendale</strong> are typically <strong>of</strong> the flash flood type, <strong>of</strong> shortduration, but with high peak volumes and high velocities. This type <strong>of</strong> flooding occurs inresponse to the local geology and geography and the built environment (human-madestructures). The mountains in and north <strong>of</strong> the city consist <strong>of</strong> rock that is predominantlyimpervious to water so little precipitation infiltrates the ground; rainwater instead flows alongthe surface as run<strong>of</strong>f. When a major storm moves in, water collects rapidly and runs <strong>of</strong>f quickly,making a steep, rapid descent from the mountains onto the alluvial fans and ultimately intoVerdugo Wash.The most severe flood recorded in <strong>Glendale</strong> occurred in 1934. Intense precipitation on NewYear’s Eve, 1933 occurred locally in the La Cañada-Flintridge area, causing the Verdugo Washto swell and overflow its then natural channel. Extensive areas <strong>of</strong> the drainage basin had burnedearlier, in November 1933, causing large amounts <strong>of</strong> debris. The debris was carried by thestorm waters down the mountains, and into the alluvial valleys, where several roads werechoked. Damage was not confined to Verdugo Wash, but extended to several <strong>of</strong> the canyonsdraining the eastern and southern flanks <strong>of</strong> the Verdugo Mountains, and also in Sycamore andScholl Canyons. More than 40 people died, several bridges were washed out, and erosion andsedimentation damaged more than 400 properties (see Map 8.2). Verdugo Wash and most <strong>of</strong> itstributaries through the La Crescenta area were channelized in response to the 1934 flood.Several canyons near the <strong>Glendale</strong> area have also flooded in the past, impacting developmentswithin the canyons or areas downstream. For example, during the storms <strong>of</strong> 1969, the VerdugoHills and the city proper were impacted by debris flows and flood flows when tributary streamsreportedly overtopped their debris basins, causing damage (Waananen, 1969).Stream gage records show that maximum daily peak flows in the lower reaches <strong>of</strong> VerdugoWash are typically less than about 400 cubic feet per second (cfs), with many years actuallymeasuring peaks <strong>of</strong> considerably less than 100 cfs. However, maximum daily peak flows haveoccasionally exceeded 1,000 cfs (in 1937-38, 1942-43, 1965-66, 1968-69, 1977-78, 1982-83,1994-95, 1995-96, and 1996-97). In the decades between 1930 and 1990, maximum daily peakflows exceeding 1,000 cfs generally occurred only once in a decade, but in the1990s there werethree consecutive years when this channel had maximum daily peak flows exceeding 1,000 cfs(and in the 1997-98 water year, the maximum daily peak flow was 966 cfs, also high for thearea). The records show that annual discharges in the last decades are overall higher than themeasurements for the previous four decades. This may indicate that climate has been wetter inthe last few decades (possibly as a result <strong>of</strong> global warming), or it could mean that withincreased development in the Verdugo drainage area, the Verdugo Wash receives more run<strong>of</strong>f.2006 PAGE 8- 3
Natural <strong>Hazard</strong>s <strong>Mitigation</strong> PlanCity <strong>of</strong> <strong>Glendale</strong>, <strong>California</strong>Section 8 – FloodsMap 8.2: Effects <strong>of</strong> the 1934 Flood in <strong>Glendale</strong>The highest peak flow recorded in Verdugo Wash is for the water year <strong>of</strong> 1968-69, with amaximum daily peak flow <strong>of</strong> 1,850 cfs. However, there are two years for which there are norecords, in 1933-34, and 1983-84. The lack <strong>of</strong> data for 1933-34 is probably the result <strong>of</strong> the gagebeing washed out during the worst flood recorded for Verdugo Wash, as discussed above.2006 PAGE 8- 4
Natural <strong>Hazard</strong>s <strong>Mitigation</strong> PlanCity <strong>of</strong> <strong>Glendale</strong>, <strong>California</strong>Section 8 – FloodsSimilarly, the winter storms in 1983-84 caused considerable damage in southern <strong>California</strong>, andmay have also washed out the gage.The City <strong>of</strong> <strong>Glendale</strong> most recently experienced some destruction during the 2005 floods.Residents and business owners who were impacted by flooding and the rain storms were able toreceive disaster assistance through the Federal Emergency Management Agency and the City.On February 4, 2005, President Bush declared that a major disaster existed in <strong>California</strong> andordered Federal aid to supplement <strong>State</strong> and local recovery efforts.Historic Flooding in Los Angeles County:There are several rivers in the southern <strong>California</strong> region, but the river with the best-recordedhistory is the Los Angeles River. The flood history <strong>of</strong> the Los Angeles River is generallyindicative <strong>of</strong> the flood history <strong>of</strong> much <strong>of</strong> southern <strong>California</strong>. Records show that since 1811, theLos Angeles River has flooded 30 times, roughly about once every 6 years. But averages aredeceiving, for the Los Angeles basin goes through periods <strong>of</strong> drought and then periods <strong>of</strong> aboveaveragerainfall. For example, between 1868 and 1884, a period <strong>of</strong> 16 years, there were nomajor floods, but this was followed by a series <strong>of</strong> wet years with floods in 1885, 1886, 1889 and1891. A similar cluster <strong>of</strong> wet years was recorded in the 1990s, as discussed above.Year1770-17711771-17721775-17761779-1780Table 8-1: Historical Floods in Los Angeles CountyCommentsGreat flooding on the L.A. River recorded by Father Juan Crespi. River overflowed itschannel.Flooding recorded by Spanish Mission Fathers. San Gabriel Mission crops destroyed.Due to heavy flooding, San Gabriel Mission was moved about 6 miles back from the river.Flooding recorded by Spanish Mission Fathers. Flows filled riverbed and flooded the lowlandswhere wheat and barley had been planted.1811 Flooding reported, although records are sparse.1815 Flooding washes away the original Plaza in L.A. River changes course at Alameda and 4 thStreet to cut west and join Ballona Creek. From there it emptied into Santa Monica Bay.1822 A great flood on the L.A. River “covered all the lowlands and reached a greater height thanwas ever known before.”1824-25The greatest <strong>of</strong> the earlier recorded floods. L.A. River changed its course back from theBallona wetlands to San Pedro. Before this storm, the river would spread over the entire area,filling depressions at the surface and forming lakes, ponds and marshes, rarely discharging itswaters into the sea. The 1825 floods cut a riverway to the ocean, draining the marshlands andcausing the forests to disappear.1832 Heavy flooding caused the drainage near Compton to change so that many lakes and pondsthat “had been permanent, became dry a few years thereafter.” Drainage <strong>of</strong> these ponds andlakes completed the destruction <strong>of</strong> the forests that used to cover a large part <strong>of</strong> southern L.A.County.1849 –1860Floods <strong>of</strong> various magnitudes occurred in 1849-1850, 1851-1852, and 1859-1860.2006 PAGE 8- 5
Natural <strong>Hazard</strong>s <strong>Mitigation</strong> PlanCity <strong>of</strong> <strong>Glendale</strong>, <strong>California</strong>Section 8 – FloodsYear1861-621867-68CommentsThe “great flood” or the “Noachian deluge <strong>of</strong> <strong>California</strong>.” Fifty inches <strong>of</strong> rain fell duringDecember and January. The entire valley from Los Angeles to the ocean was a great lake.Part <strong>of</strong> the river split and drained into Ballona Creek. San Gabriel River also overflowed itsbanks and started a new channel.Floods spill over river channel and create a large, temporary lake out to Ballona Creek. SanGabriel River breaks out <strong>of</strong> its channel and washes thousands <strong>of</strong> acres <strong>of</strong> land.1884 Two periods <strong>of</strong> intense rainstorms separated by 6 to 8 days. The first storms caused littledamage. The second washed all but one <strong>of</strong> the bridges across the L.A. River, washed awaymany houses, and drowned several people. Parts <strong>of</strong> Los Angeles flooded 3 to 4 feet deep.1886-87A good part <strong>of</strong> Los Angeles was inundated. The levees were damaged and railwaycommunication was impossible for 2 to 3 weeks.1889 Flood on Christmas Day caused much damage; bridges and levees washed away; the old SanGabriel, new San Gabriel and L.A. Rivers joined near Downey and formed one body. L.A.River overtopped its channel.1914 Heavy flooding in January and February. Great damage to L.A. harbor.1916-1938Flooding in 1916. Minor floods causing damage in certain areas reported in 1918, 1921-1922,1926, 1927, 1931, 1932, 1934, 1936, and 1937.1934 Moderate to severe flooding starting January 1. Over 40 dead in La Cañada – <strong>Glendale</strong> area.Debris flow killed 12 people who had taken shelter in the Montrose Legion Hall.1938 Series <strong>of</strong> storms beginning December 1937. March floods exceeded all previous floods forwhich records were available. Large tracts inundated; bridges, highways and railroadsseverely damaged. 87 people killed, over $78 Million (1938 dollars) in damage.1941-1944Los Angeles River floods five times.1952 Moderate flooding.1969 Recurrent precipitation during January and February nearly approached the largest totalsince 1884. Nearly 40 people died as direct result <strong>of</strong> the floods in southern <strong>California</strong>, andmore than 10,000 had to be evacuated.1978 Two moderate floods.1979 Los Angeles experiences severe flooding and mudslides.1980 Flood tops banks <strong>of</strong> river in Long Beach. Sepulveda Basin spillway almost opened.1983 Flooding kills six people.1992 15-year flood. Motorists trapped in Sepulveda basin. Six people dead.1994-19951997-982003-20042004-05Heavy flooding throughout the <strong>State</strong>. The total damages are estimated at $2 billion.The 1997 floods caused extensive damage in 48 <strong>California</strong> counties, including Los AngelesCounty. Total damages were estimated at $1.8 billion. The 1998 El Niño storms also causeddamage, but this was less than it could have been because many had taken measures to reducetheir risk following the 1997 storms.The rains followed the extensive fires <strong>of</strong> 2003; in many areas, canyons chocked with ashes anddebris caused debris flows that did substantial damage downstream.The second-wettest year on record in the Los Angeles Basin; the rains caused extensivedamage in some areas, triggering landslides and debris flows.2006 PAGE 8- 6
Natural <strong>Hazard</strong>s <strong>Mitigation</strong> PlanCity <strong>of</strong> <strong>Glendale</strong>, <strong>California</strong>Section 8 – FloodsWhat Factors Create Flood Risk?Climate:Flooding occurs when climate, geology, and hydrology combine to create conditions wherewater flows outside <strong>of</strong> its usual course. In the city <strong>of</strong> <strong>Glendale</strong>, geography and climate maycombine to create seasonal flooding conditions. The Santa Monica, Santa Susana, and VerdugoMountains, which surround three sides <strong>of</strong> the San Fernando valley, seldom reach heights abovethree thousand feet. The western San Gabriel Mountains, in contrast, have elevations <strong>of</strong> morethan seven thousand feet. These higher ridges <strong>of</strong>ten trap east-moving winter storms. Althoughdowntown Los Angeles averages just fifteen inches <strong>of</strong> rain a year, some mountain peaks in theSan Gabriel Mountains receive more than forty inches <strong>of</strong> precipitation annually.Naturally, this rainfall moves rapidly down stream, <strong>of</strong>ten with severe consequences for anythingin its path. Storm events are likely to generate debris flows in the upper reaches <strong>of</strong> thewatershed. In extreme cases, flood-generated debris flows will roar down a canyon at speedsnear 40 miles per hour with a wall <strong>of</strong> mud, debris and water tens <strong>of</strong> feet high. Debris flows, suchas those that impacted <strong>Glendale</strong> in 1934, <strong>of</strong>ten occur in areas recently burned by wildfires,where vegetation has not yet formed a protective ground cover that helps keep the soil in place.Furthermore, the oils in the plants native to southern <strong>California</strong>, when burned, react with thesoils, making them water repellant. As a result, less rainwater than usual infiltrates the ground,and instead makes its way downslope as run<strong>of</strong>f, carrying ashes and other burned debris with it.Average yearly precipitation in the downtown <strong>Glendale</strong> area is about 17 to 18 inches, whereasthe northern reaches <strong>of</strong> the city, near La Crescenta, receive 23 to 24 inches per year, on average.In general, areas closer to the San Gabriel Mountains receive higher precipitation rates thanareas farther south from the mountains. This is because, as explained above, the mountains <strong>of</strong>tencapture precipitation from strong, east-moving Pacific storms. The mountains thereforeseparate the semi-arid environment to the west, within the Los Angeles basin, from the drydesert environment to the east, in the Mojave Desert.“Averages” are not particularly representative <strong>of</strong> rainfall in the southern <strong>California</strong> area, asillustrated with the following discussion about downtown Los Angeles: the average annualrainfall in Los Angeles for the last 125 years is 14.9 inches, but rainfall during this time periodhas ranged from only 4.35 inches in 2001-2002 to 38.2 inches in 1883-1884. In fact, in onlyfifteen <strong>of</strong> the past 125 years has the annual rainfall been within plus or minus 10 percent <strong>of</strong> the14.9-inch average, and in only 38 years has the annual rainfall been within plus or minus 20percent <strong>of</strong> the average value. This makes the Los Angeles basin a land <strong>of</strong> extremes in terms <strong>of</strong>annual precipitation.There are three types <strong>of</strong> storms that produce precipitation in southern <strong>California</strong>: winterstorms, local thunderstorms, and summer tropical storms (or monsoons). These are describedbelow.• Winter Rainfall: Winter storms are characterized by heavy and sometimes prolongedprecipitation over a large area. These storms usually occur between November andApril and are responsible for most <strong>of</strong> the precipitation recorded in southern <strong>California</strong>.The storms originate over the Pacific Ocean and move eastward (and inland). Themountains, such as the San Gabriel and San Bernardino Mountains, form a rain shadow,slowing down or stopping the eastward movement <strong>of</strong> this moisture. A significantportion <strong>of</strong> the moisture is dropped on the mountains as snow. If large storms arecoupled with snowmelt from these mountains, large peak discharges can be expected inthe main watersheds at the base <strong>of</strong> the mountains. Some <strong>of</strong> the severe winter stormseasons that have historically impacted the southern <strong>California</strong> area have been related to2006 PAGE 8- 7
Natural <strong>Hazard</strong>s <strong>Mitigation</strong> PlanCity <strong>of</strong> <strong>Glendale</strong>, <strong>California</strong>Section 8 – FloodsEl Niño events.El Niño is the name given to a phenomenon that starts every few years, typically inDecember or early January, in the southern Pacific <strong>of</strong>f the western coast <strong>of</strong> SouthAmerica, but whose impacts are felt worldwide. Briefly, warmer than usual waters inthe southern Pacific are statistically linked with increased rainfall in both thesoutheastern and southwestern United <strong>State</strong>s, droughts in Australia, western Africa andIndonesia, reduced number <strong>of</strong> hurricanes in the Atlantic Ocean, and increased number<strong>of</strong> hurricanes in the Eastern Pacific. Two <strong>of</strong> the largest and most intense El Niñoevents on record occurred during the 1982-83 and 1997-98 water years. [A water yearis the 12-month period from October 1 through September 30 <strong>of</strong> the second year. Oftena water year is identified only by the calendar year in which it ends, rather than bygiving the two years, as above.] These are also two <strong>of</strong> the worst storm seasons reportedin southern <strong>California</strong>.• Thunderstorms and Monsoons: Another relatively regular source <strong>of</strong> heavy rainfall,particularly in the mountains and adjoining cities, is from summer tropical storms.Tropical rains or monsoons are infrequent, and typically occur in the summer or earlyfall. These storms originate in the warm, southern waters <strong>of</strong>f Baja <strong>California</strong>, in thePacific Ocean, and move northward into southern <strong>California</strong>. Tropical storms that havedropped significant rainfall in the southern <strong>California</strong> area in the last 100 years or so arelisted in Table 8-2 below. Thunderstorms can occur at any time, but are usually moreprevalent in the higher mountains during the summer. Thunderstorms usually impactrelatively small areas.2006 PAGE 8- 8
Natural <strong>Hazard</strong>s <strong>Mitigation</strong> PlanCity <strong>of</strong> <strong>Glendale</strong>, <strong>California</strong>Section 8 – FloodsTable 8-2:Tropical Storms That Affected Southern <strong>California</strong> During the 20 th CenturyMonth- Date(s) Area(s) Affected RainfallJuly 1902 20th & 21st Deserts and southern mountains up to 2"Aug. 1906 18th & 19th Deserts and southern mountains up to 5"Sept. 1910 15th Mountains <strong>of</strong> Santa Barbara County 2"Aug. 1921 20th & 21st Deserts and southern mountains up to 2"Sept. 1921 30th Deserts up to 4"Sept. 1929 18th Southern mountains and deserts up to 4"Sept. 1932 28th - Oct Mountains and deserts, 15 fatalities up to 7Aug. 1935 25th Southern valleys, mountains and deserts up to 2"Sept. 19394th - 7th Southern mountains, southern and eastern deserts up to 711th & 12th Deserts, central and southern mountains up to 4"19th - 21st Deserts, central and southern mountains up to 3"25thLong Beach, with sustained winds <strong>of</strong> 50 MPH 5"Surrounding mountains 6 to 12"Sept. 1945 9th & 10th Central and southern mountains up to 2”Sept. 1946 30th - Oct Southern mountains up to 4"Aug. 1951 27th - 29th Southern mountains and deserts 2 to 5"Sept. 1952 19th - 21st Central and southern mountains up to 2"July 1954 17th - 19th Deserts and southern mountains up to 2"July 1958 28th & 29th Deserts and southern mountains up to 2"Sept. 1960 9th & 10th Julian 3.40"Sept. 1963 17th - 19th Central and southern mountains up to 7"Sept. 1967 1st - 3rd Southern mountains and deserts 2"Oct. 1972 6th Southeast deserts up to 2"Sept. 1976Aug. 197710th & 11thn/aCentral and southern mountains. Ocotillo was destroyed, 3fatalitiesLos Angeles 2"6 to 12"Mountains up to 8"Oct. 1977 6th & 7th Southern mountains and deserts up to 2Sept. 1978 5th & 6th Mountains 3"Sept. 1982 24th - 26th Mountains up to 4"Sept. 1983 20th & 21st Southern mountains and deserts up to 3"http://www.fema.gov/nwz97/eln_scal.shtmGeography and Geology:The local mountains are very steep and consist <strong>of</strong> rock types that are fairly impervious to water.Consequently, little precipitation infiltrates the ground; rainwater instead flows across thesurface as run<strong>of</strong>f, collecting in the major drainages that pass through the city. When a majorstorm moves in, water collects rapidly and runs <strong>of</strong>f quickly, making a steep, rapid descent from2006 PAGE 8- 9
Natural <strong>Hazard</strong>s <strong>Mitigation</strong> PlanCity <strong>of</strong> <strong>Glendale</strong>, <strong>California</strong>Section 8 – Floodsthe mountains into man-made and natural channels within developed areas. Because <strong>of</strong> the steepterrain, scarcity <strong>of</strong> vegetation, and the constant shedding <strong>of</strong> debris from mountain slopes(primarily as dry ravel and rock falls), flood flows <strong>of</strong>ten carry large amounts <strong>of</strong> mud, sand, androck fragments. Sheet flow occurs when the capacities <strong>of</strong> the existing channels (either natural orman-made) are exceeded and water flows over and into the adjacent areas.The greater Los Angeles Basin has been shaped by erosion and sedimentation for millennia.Most <strong>of</strong> the mountains that ring the valleys and coastal plain have and are being uplifted alongmovement on faults; this movement has fractured the bedrock, allowing for their brittle slopesto be readily eroded. Rivers and streams have then carried boulders, rocks, gravel, sand, and siltdown these slopes to the valleys and coastal plain. Over time, these sediments have collected inthe valley bottoms, so that locally these sediments are as much as twenty thousand feet thick.This sediment generally acts as a sponge, absorbing vast quantities <strong>of</strong> water received asprecipitation in those years when heavy rains follow a dry period. But like a sponge that is nearsaturation, the same soil fills up rapidly when a heavy rain follows a period <strong>of</strong> relatively wetweather. So, in some years <strong>of</strong> heavy rain, flooding is minimal because the ground is relativelydry. The same amount <strong>of</strong> rain following a wet period, when the ground is already saturated, cancause extensive flooding.Built Environment:The greater Los Angeles basin is essentially built out. This leaves precious little open land toabsorb rainfall. This lack <strong>of</strong> open ground forces water to remain on the surface and accumulaterapidly. If it were not for the massive flood control system that has been built over the years,with its concrete lined rivers and stream beds, flooding in the Los Angeles basin would be amuch more common occurrence. And the tendency is towards even less and less open land. Infillbuilding is becoming a much more common practice in many areas: Developers tear downolder homes, which typically cover up to 40% <strong>of</strong> the lots that they sit on, and replace each <strong>of</strong>them with three or four town homes or apartments, which may cover 90-95% <strong>of</strong> the lot. Thisincrease in impervious surfaces (including concrete walkways, and ro<strong>of</strong>s) results in a directincrease in run<strong>of</strong>f.Another potential reason for recurrent storm flooding in developed areas is “asphalt creep.”The street space between the curbs <strong>of</strong> a street is a part <strong>of</strong> the flood control system. Waterleaves the adjacent properties and accumulates in the streets, where it is directed towards theunderground portion <strong>of</strong> the flood control system. The carrying capacity <strong>of</strong> a given street isdetermined by the width <strong>of</strong> the street and the height <strong>of</strong> the curbs along the street. Often, whenstreets are being resurfaced, a one- to two-inch layer <strong>of</strong> asphalt is laid down over the existingasphalt. This added layer <strong>of</strong> asphalt subtracts from the rated capacity <strong>of</strong> the street to carrywater. Thus the original engineered capacity <strong>of</strong> the entire storm drain system is marginallyreduced over time. Subsequent re-paving <strong>of</strong> the street will further reduce its engineeredcapacity.How Are Flood-Prone Areas Identified:The Federal Emergency Management Agency (FEMA) is mandated by the National FloodInsurance Act <strong>of</strong> 1968 and the Flood Disaster Protection Act <strong>of</strong> 1973 to evaluate flood hazards.To promote sound land use and floodplain development, FEMA provides Flood Insurance RateMaps (FIRMs) for local and regional planners. Flood risk information presented on FIRMs isbased on historic, meteorological, hydrologic, and hydraulic data, as well as topographicsurveys, open-space conditions, flood control works, and existing development.Rainfall-run<strong>of</strong>f and hydraulic models are utilized by the FIRM program to analyze floodpotential, adequacy <strong>of</strong> flood protective measures, surface-water and groundwater interchangecharacteristics, and the variable efficiency <strong>of</strong> mobile (sand bed) flood channels. It is important to2006 PAGE 8- 10
Natural <strong>Hazard</strong>s <strong>Mitigation</strong> PlanCity <strong>of</strong> <strong>Glendale</strong>, <strong>California</strong>Section 8 – Floodsrealize that FIRMs only identify potential flood areas based on the conditions at the time <strong>of</strong> thestudy, and do not consider the impacts <strong>of</strong> future development. To prepare FIRMs that illustratethe extent <strong>of</strong> flood hazards in a flood-prone community, FEMA conducts engineering studiesreferred to as Flood Insurance Studies (FISs). Using information gathered in these studies,FEMA engineers and cartographers delineate Special Flood <strong>Hazard</strong> Areas (SFHAs) on FIRMs.SFHAs are those areas subject to inundation by a “base flood” which FEMA sets as a 100-yearflood (see definitions below).The NFIP also reduces flood losses through regulations that focus on building codes and soundfloodplain management. In the city <strong>of</strong> <strong>Glendale</strong>, the NFIP and related building code regulationswent into effect on August 31, 1984 (City ID No. – 065030). NFIP regulations (44 Code <strong>of</strong>Federal Regulations (CFR) Chapter 1, Section 60, 3) require that all new construction infloodplains must be elevated at or above base flood level.Flood TerminologyFloodplain:A floodplain is a land area adjacent to a river, stream, lake, estuary, or other water body that issubject to flooding. This area, if left undisturbed, acts to store excess floodwater. Thefloodplain is made up <strong>of</strong> two sections: the floodway and the flood fringe.100-Year Flood:The 100-year flooding event is the flood having a one percent chance <strong>of</strong> being equaled orexceeded in magnitude in any given year. Contrary to popular belief, it is not a flood occurringonce every 100 years. The 100-year floodplain is the area adjoining a river, stream, orwatercourse covered by water in the event <strong>of</strong> a 100-year flood. A 100-year flood is defined bylooking at the long-term average period between floods <strong>of</strong> a certain size, and identifying the size<strong>of</strong> flood that has a 1 percent chance <strong>of</strong> occurring during any given year. This base flood has a 26percent chance <strong>of</strong> occurring during a 30-year period, the length <strong>of</strong> most home mortgages.However, a recurrence interval such as “100 years” represents only the long-term averageperiod between floods <strong>of</strong> a specific magnitude; rare floods can in fact occur at much shorterintervals or even within the same year.Floodway:The floodway is one <strong>of</strong> two main sections that make up the floodplain. Floodways are definedfor regulatory purposes. Unlike floodplains, floodways do not reflect a recognizable geologicfeature. For National Flood Insurance Program (NFIP) purposes, floodways are defined as thechannel <strong>of</strong> a river or stream, and the overbank areas adjacent to the channel. The floodwaycarries the bulk <strong>of</strong> the floodwaters downstream and is usually the area where water velocitiesand forces are the greatest. NFIP regulations require that the floodway be kept open and freefrom development or other structures that would obstruct or divert flood flows onto otherproperties.<strong>Glendale</strong> regulations prohibit all development in the floodway. The NFIP floodway definitionis "the channel <strong>of</strong> a river or other watercourse and adjacent land areas that must be reserved inorder to discharge the base flood without cumulatively increasing the water surface elevationmore than one foot.” Floodways are not mapped for all rivers and streams but are generallymapped in developed areas.Flood Fringe:The flood fringe refers to the outer portions <strong>of</strong> the floodplain, beginning at the edge <strong>of</strong> thefloodway and continuing outward. Generally, the flood fringe is defined as "the land area whichis outside <strong>of</strong> the stream flood way but is subject to periodic inundation by regular flooding.”2006 PAGE 8- 11
Natural <strong>Hazard</strong>s <strong>Mitigation</strong> PlanCity <strong>of</strong> <strong>Glendale</strong>, <strong>California</strong>Section 8 – FloodsThis is the area where development is most likely to occur, and where precautions to protect lifeand property need to be taken.Development:For floodplain ordinance purposes, development is broadly defined as "any man-made change toimproved or unimproved real estate, including but not limited to buildings or other structures,mining, dredging, filling, grading, paving, excavation, or drilling operations located within thearea <strong>of</strong> special flood hazard." The definition <strong>of</strong> development for floodplain purposes is generallybroader and includes more activities than the definition <strong>of</strong> development used in other sections <strong>of</strong>local land use ordinances.Base Flood Elevation (BFE):The term "Base Flood Elevation" refers to the elevation (normally measured in feet above sealevel) that the base flood is expected to reach. Base flood elevations can be set at levels otherthan the 100-year flood. Some communities choose to use higher frequency flood events as theirbase flood elevation for certain activities, while using lower frequency events for others. Forexample, for the purpose <strong>of</strong> storm water management, a 25-year flood event might serve as thebase flood elevation, whereas the 500-year flood event may serve as base flood elevation for thetie down <strong>of</strong> mobile homes. The regulations <strong>of</strong> the NFIP focus on development in the 100-yearfloodplain.Storm Flooding CharacteristicsThree primary types <strong>of</strong> flooding have historically affected the southern <strong>California</strong> area,including the city <strong>of</strong> <strong>Glendale</strong>: riverine flooding, urban flooding, and debris flows (seedescriptions below). (Areas near the coastline are also susceptible to coastal flooding, but giventhat the city <strong>of</strong> <strong>Glendale</strong> is located inland, this type <strong>of</strong> flooding will not be discussed herein).• Riverine Flooding: Riverine flooding is the overbank flooding <strong>of</strong> rivers and streams.This process in a natural environment adds sediment and nutrients to the flooded area,cyclically enhancing the fertility <strong>of</strong> the soils, which is why floodplains have been thebreadbaskets <strong>of</strong> civilizations through the ages. However, large floods have the potentialto cause significant damage to man-made structures and causing significant loss <strong>of</strong> life.Flooding in large river systems typically results from large-scale weather systems thatgenerate prolonged rainfall over a wide geographic area, causing flooding in hundreds<strong>of</strong> smaller streams, which then drain into the major rivers.Shallow area flooding is a special type <strong>of</strong> riverine flooding. FEMA defines shallow floodhazards as areas that are inundated by the 100-year flood with flood depths <strong>of</strong> only oneto three feet. These areas are generally flooded by low velocity sheet flows <strong>of</strong> water.• Urban Flooding: As land is converted from agricultural fields or woodlands to roadsand parking lots, it loses its ability to absorb rainfall. Urbanization <strong>of</strong> a watershedchanges the hydrologic systems <strong>of</strong> the basin. Heavy rainfall collects and flows faster onimpervious concrete and asphalt surfaces. The water moves from the clouds, to theground, and into streams at a much faster rate in urban areas. Adding these elements tothe hydrological systems can result in floodwaters that rise very rapidly and peak withviolent force. The flooding <strong>of</strong> developed areas <strong>of</strong>ten occurs when the amount <strong>of</strong> watergenerated from rainfall and run<strong>of</strong>f exceeds the storm water system’s capability toremove it.Over 50 percent <strong>of</strong> the <strong>Glendale</strong> area has a high concentration <strong>of</strong> impervious surfacesthat either collect water, or concentrate the flow <strong>of</strong> water in channelized or man-2006 PAGE 8- 12
Natural <strong>Hazard</strong>s <strong>Mitigation</strong> PlanCity <strong>of</strong> <strong>Glendale</strong>, <strong>California</strong>Section 8 – Floodsimproved channels. During periods <strong>of</strong> urban flooding, streets can become swift movingrivers and basements can fill with water. Storm drains may also back up withvegetation and debris causing additional, localized flooding.• Debris Flows: Another flood related hazard that can affect certain parts <strong>of</strong> thesouthern <strong>California</strong> region is debris flows. Debris flows most <strong>of</strong>ten occur in mountaincanyons and at the foothills <strong>of</strong> the large mountains that serve as backdrop to the area.However, any hilly or mountainous area with intense rainfall and the proper geologicconditions may experience one <strong>of</strong> these very sudden and devastating events.Debris flows, sometimes referred to as mudslides, mudflows, or debris avalanches, arecommon types <strong>of</strong> fast-moving landslides that generally occur during periods <strong>of</strong> intenserainfall or rapid snow melt. They usually start on steep hillsides as shallow landslidesthat liquefy and accelerate to speeds that are typically about 10 miles per hour, but canexceed 35 miles per hour. The consistency <strong>of</strong> debris flows ranges from watery mud tothick, rocky mud that can carry large items such as boulders, trees, and cars. Debrisflows from many different sources can combine in channels, and their destructive powermay be greatly increased. They continue flowing down hills and through channels,growing in volume with the addition <strong>of</strong> water, sand, mud, boulders, trees, and othermaterials. When the flows reach flatter ground, the debris spreads over a broad area,sometimes accumulating in thick deposits that can wreak havoc in developed areas.Dam Failure FloodingSeismically induced inundation refers to flooding that results when water retention structures(such as dams) fail due to an earthquake. Failure <strong>of</strong> these structures can also result from othercauses, such as overtopping, foundation problems, or construction errors. Statutes governingdam safety are defined in Division 3 <strong>of</strong> the <strong>California</strong> <strong>State</strong> Water Code (<strong>California</strong> Department<strong>of</strong> Water Resources, 1986). These statutes empower the <strong>California</strong> Division <strong>of</strong> Dam Safety tomonitor the structural safety <strong>of</strong> dams that are greater than 25 feet in dam height or have morethan 50 acre-feet in storage capacity.Dams under <strong>State</strong> jurisdiction are required to have inundation maps that show the potentialflood limits in the remote, yet disastrous possibility, that a dam is catastrophically breached.Inundation maps are prepared by dam owners to help with contingency planning; theseinundation maps in no way reflect the structural integrity or safety <strong>of</strong> the dam in question.Because dam failure can have severe consequences, FEMA requires that all dam owners developEmergency Action Plans (EAP) for warning, evacuation, and post-flood actions. Although theremay be coordination with county <strong>of</strong>ficials in the development <strong>of</strong> the EAP, the responsibility fordeveloping potential flood inundation maps and facilitation <strong>of</strong> emergency response is theresponsibility <strong>of</strong> the dam owner. Dam owners are also required to prepare and submitemergency response plans to the <strong>State</strong> Office <strong>of</strong> Emergency Services, the lead <strong>State</strong> agency forthe <strong>State</strong> dam inundation-mapping program. Cities and counties are required by <strong>State</strong> law tohave in place emergency procedures for the evacuation and control <strong>of</strong> populated areas within thelimits <strong>of</strong> dam inundation. In addition, recent legislation requires real estate disclosure upon saleor transfer <strong>of</strong> properties in the inundation area (AB 1195 Chapter 65, June 9, 1998; Natural<strong>Hazard</strong> Disclosure <strong>State</strong>ment).There have been a total <strong>of</strong> 45 dam failures in <strong>California</strong> since the 19 th century. The mostsignificant dam failures in southern <strong>California</strong> are listed in Table 8-3, and the two mostsignificant dam failures, St. Francis Dam in 1928 and the Baldwin Hills Dam in 1963, aredescribed further below.Table 8-3: Dam Failures in Southern <strong>California</strong>2006 PAGE 8- 13
Natural <strong>Hazard</strong>s <strong>Mitigation</strong> PlanCity <strong>of</strong> <strong>Glendale</strong>, <strong>California</strong>Section 8 – FloodsDam Name Location Year Failure MechanismSheffield Santa Barbara 1925 Earthquake slidePuddingstone Pomona 1926 Overtopping during constructionLake Hemet Palm Springs 1927 OvertoppingSaint FrancisSan FrancisquitoCanyon1928 Sudden failure at full capacity through foundation,426 deaths.Cogswell Monrovia 1934 Breaching <strong>of</strong> concrete coverBaldwin Hills Los Angeles 1963 Leak through embankment turned into washout, 3deaths.St. Francis Dam, built in 1926 in the San Francisquito Canyon near Saugus, was 180 feet highand 600 feet long. Its failure, and the resulting loss <strong>of</strong> over 400 lives in the path <strong>of</strong> a roaringwall <strong>of</strong> water, was a scandal that resulted in the almost complete destruction <strong>of</strong> the reputation<strong>of</strong> its builder, William Mulholland. Mulholland was an immigrant from Ireland who rose upthrough the ranks <strong>of</strong> the Los Angeles City water department to the position <strong>of</strong> chief engineer. Itwas he who proposed, designed, and supervised the construction <strong>of</strong> the Los Angeles Aqueduct,which brought water from the Owens Valley to the city.St. Francis dam gave way on March 12, 1928, three minutes before midnight. Its waters sweptthrough the Santa Clara Valley toward the Pacific Ocean, about 54 miles away. Sixty-five miles<strong>of</strong> valley were devastated before the water finally made its way into the ocean between Oxnardand Ventura. At its peak, the wall <strong>of</strong> water was said to be 78 feet high; by the time it hit SantaPaula, 42 miles south <strong>of</strong> the dam, the water was estimated to be 25 feet deep. Almost everythingin its path was destroyed: livestock, structures, railways, bridges, and orchards. By the time itwas over, parts <strong>of</strong> Ventura County lay under 70 feet <strong>of</strong> mud and debris. Over 400 people werekilled and damage estimates topped $20 million.The Baldwin Hills dam, an earthen dam that created a 19-acre reservoir to supply drinkingwater to West Los Angeles residents, failed on December 14, 1963 at 3:38 in the afternoon.This is one <strong>of</strong> the first disaster events documented in a live helicopter broadcast - the livetelecast <strong>of</strong> the collapse from a KTLA-TV helicopter is considered the precursor to airbornenews coverage that is now routine everywhere. As a pencil-thin crack widened to a 75-footgash, 292 million gallons surged out. “The Baldwin Hills Dam collapsed with the fury <strong>of</strong> athousand cloudbursts, sending a 50-foot wall <strong>of</strong> water down Cloverdale Avenue and slamminginto homes and cars . . . Five people were killed. Sixty-five hillside houses were ripped apart,and 210 homes and apartments were damaged.” The flood swept northward in a V-shaped pathroughly bounded by La Brea Avenue and Jefferson and La Cienega boulevards.It took 77 minutes for the impounded reservoir to empty, but it took a generation for theneighborhood below to recover, illustrating the severe, long-term impact <strong>of</strong> these disasters.Furthermore, failure <strong>of</strong> this tank foreshadowed the end <strong>of</strong> urban-area earthen dams as a majorelement <strong>of</strong> the Department <strong>of</strong> Water and Power’s water storage system. It also prompted atightening <strong>of</strong> Division <strong>of</strong> Safety <strong>of</strong> Dams control over reservoirs throughout the <strong>State</strong>.2006 PAGE 8- 14
Natural <strong>Hazard</strong>s <strong>Mitigation</strong> PlanCity <strong>of</strong> <strong>Glendale</strong>, <strong>California</strong>Section 8 – FloodsFlooding due to Failure <strong>of</strong> Above-Ground Water Storage Tanks:Seismically induced inundation can also occur if strong ground shaking causes structuraldamage to above-ground water tanks. If a tank is not adequately braced and baffled, sloshingwater can lift a water tank <strong>of</strong>f its foundation, splitting the shell, damaging the ro<strong>of</strong>, and bulgingthe bottom <strong>of</strong> the tank (elephants foot) (EERI, 1992). Movement can also shear <strong>of</strong>f the pipesleading to the tank, releasing water through the broken pipes. These types <strong>of</strong> damage occurredduring southern <strong>California</strong>’s 1992 Landers, 1992 Big Bear, and 1994 Northridge earthquakes.The Northridge earthquake alone rendered about 40 steel tanks non-functional (EERI, 1995),including a tank in the Santa Clarita area that failed and inundated several houses below. As aBaldwin Hills Dam - Dark spot in upper right hand quadrantshows the beginning <strong>of</strong> the break in the dam.result <strong>of</strong> lessons learned from recent earthquakes, new standards for design <strong>of</strong> steel water tankswere adopted in 1994 (Lund, 1994). The new tank design includes flexible joints at theinlet/outlet connections to accommodate movement in any direction. All <strong>of</strong> <strong>Glendale</strong>’s watersteel tanks have been retr<strong>of</strong>fited with flexible expansion joints to allow for movement duringearthquakes.Water lost from tanks during an earthquake can significantly reduce the water resourcesavailable to suppress earthquake-induced fires. Damaged tanks and water mains can also limitthe amount <strong>of</strong> water available to residents. Furthermore, groundwater wells can be damagedduring an earthquake, also limiting the water available to the community after an earthquake.Therefore, it is <strong>of</strong> paramount importance that the water storage tanks in the area retain theirstructural integrity during an earthquake, so water demands after an earthquake can be met. Inaddition to evaluating and retr<strong>of</strong>itting to meet current standards, this also requires that thetanks be kept at near full capacity as much as practical.The Effect <strong>of</strong> Development on Floods:When structures or fill are placed in the floodway or floodplain, water is displaced.Development raises the river levels by forcing the river to compensate for the flow spaceobstructed by the inserted structures and/or fill. When structures or materials are added to the2006 PAGE 8- 15
Natural <strong>Hazard</strong>s <strong>Mitigation</strong> PlanCity <strong>of</strong> <strong>Glendale</strong>, <strong>California</strong>Section 8 – Floodsfloodway or floodplain and no fill is removed to compensate, serious problems can arise. Floodwaters may be forced away from historic floodplain areas. As a result, other existing floodplainareas may experience flood waters that rise above historic levels. Local governments must requireengineer certification to ensure that proposed developments will not adversely affect the flood carryingcapacity <strong>of</strong> the Special Flood <strong>Hazard</strong> Area (SFHA). Displacement <strong>of</strong> only a few inches <strong>of</strong> water canmean the difference between no structural damage occurring in a given flood event, and theinundation <strong>of</strong> many homes, businesses, and other facilities. Careful attention should be given todevelopment that occurs within the floodway to ensure that structures are prepared towithstand base flood events.In highly urbanized areas, increased paving can lead to an increase in volume and velocity <strong>of</strong>run<strong>of</strong>f after a rainfall event, exacerbating the potential flood hazards. Care should be taken inthe development and implementation <strong>of</strong> storm water management systems to ensure that theserun<strong>of</strong>f waters are dealt with effectively.How Building Codes Address Building In Known Flood Prone Areas:Flood Insurance Rate Maps (FIRM) and Flood Insurance Studies (FIS) Floodplain maps are thebasis for implementing floodplain regulations and for delineating flood insurance purchaserequirements. A Flood Insurance Rate Map (FIRM) is the <strong>of</strong>ficial map produced by FEMAwhich delineates SFHA in communities where NFIP regulations apply. FIRMs are also used byinsurance agents and mortgage lenders to determine if flood insurance is required and whatinsurance rates should apply.Water surface elevations are combined with topographic data to develop FIRMs. FIRMsillustrate areas that would be inundated during a 100-year flood, floodway areas, and elevationsmarking the 100-year-flood level. In some cases they also include base flood elevations (BFEs)and areas located within the 500-year floodplain. Flood Insurance Studies and FIRMs producedfor the NFIP provide assessments <strong>of</strong> the probability <strong>of</strong> flooding at a given location. FEMAconducted many Flood Insurance Studies in the late 1970s and early 1980s. These studies andmaps represent flood risk at the point in time when FEMA completed the studies. However, itis important to note that not all 100-year or 500-year floodplains have been mapped by FEMA.FEMA flood maps are not entirely accurate. These studies and maps represent flood risk at thepoint in time when FEMA completed the studies, and does not incorporate planning forfloodplain changes in the future due to new development. Although FEMA is consideringchanging that policy, it is optional for local communities. There is no FIRM map for the City <strong>of</strong><strong>Glendale</strong>.Flood Mapping Methods and Techniques:Although many communities rely exclusively on FIRMs to characterize the risk <strong>of</strong> flooding intheir area, there are some flood-prone areas that are not mapped but remain susceptible t<strong>of</strong>looding. These areas include locations next to small creeks, local drainage areas, and areassusceptible to man-made flooding.In order to address this lack <strong>of</strong> data, jurisdictions can take efforts to develop more localizedflood hazard maps. One method that has been employed includes using high-water marks fromflood events or aerial photos, in conjunction with the FEMA maps, to better reflect the trueflood risk. The use <strong>of</strong> GIS (Geographic Information System) is becoming an important tool forflood hazard mapping. FIRM maps can be imported directly into GIS, which allows for GISanalysis <strong>of</strong> flood hazard areas.Communities find it particularly useful to overlay flood hazard areas on tax assessment parcelmaps. This allows a community to evaluate the flood hazard risk for a specific parcel during2006 PAGE 8- 16
Natural <strong>Hazard</strong>s <strong>Mitigation</strong> PlanCity <strong>of</strong> <strong>Glendale</strong>, <strong>California</strong>Section 8 – Floodsreview <strong>of</strong> a development request. Coordination between FEMA and local planning jurisdictionsis the key to making a strong connection with GIS technology for the purpose <strong>of</strong> flood hazardmapping.FEMA and the Environmental Systems Research Institute (ESRI), a private company, haveformed a partnership to provide multi-hazard maps and information to the public via theInternet. ESRI produces GIS s<strong>of</strong>tware, including ArcViewC9 and ArcInfoC9 . The ESRI website has information on GIS technology and downloadable maps. The hazards maps providedon the ESRI site are intended to assist communities in evaluating geographic information aboutnatural hazards. Flood information for most communities is available on the ESRI web site.Visit www.esri.com for more information.<strong>Hazard</strong> Assessment<strong>Hazard</strong> Identification:<strong>Hazard</strong> identification is the first phase <strong>of</strong> flood-hazard assessment. Identification is the process<strong>of</strong> estimating: 1) the geographic extent <strong>of</strong> the floodplain (i.e., the area at risk from flooding); 2)the intensity <strong>of</strong> the flooding that can be expected in specific areas <strong>of</strong> the floodplain; and 3) theprobability <strong>of</strong> occurrence <strong>of</strong> flood events. This process usually results in the creation <strong>of</strong> afloodplain map. Floodplain maps provide detailed information that can assist jurisdictions inmaking policies and land-use decisions.Flood <strong>Hazard</strong> Mapping for the City <strong>of</strong> <strong>Glendale</strong>:On May 7, 1976 the Federal Insurance Administration (FIA) issued a Flood <strong>Hazard</strong> Boundarymap for the City <strong>of</strong> <strong>Glendale</strong>. However, a study <strong>of</strong> Verdugo Wash conducted in 1978 for the LosAngeles County Department <strong>of</strong> Public Works (LACDPW) showed that the channel couldaccommodate the estimated peak flows everywhere, except in the area immediately north <strong>of</strong>where Verdugo Wash joins the Los Angeles River. In fact, this area is known to flood regularlyduring winter storms (refer to following sections for further information on this). Based on theinformation provided by the LACDPW, stating “that for all practical purposes no part <strong>of</strong> thecommunity would be inundated by the base flood; that is, a flood having a one percent chance <strong>of</strong>being equaled or exceeded in any given year,” and therefore, that the entire community wouldbe classified as Zone C (area <strong>of</strong> minimal flood hazards where the purchase <strong>of</strong> flood insurance isnot mandatory), the Flood <strong>Hazard</strong> Boundary Map was rescinded by FIA on November 15, 1979.On a letter dated August 31, 1984, FEMA again informed the City that no Special Flood<strong>Hazard</strong> Areas were present within the corporate limits <strong>of</strong> the city at that time, and thus that theCity was placed in Zone D, which has no mandatory flood insurance purchase requirements. Asa result, there are no flood insurance rate maps for the city <strong>of</strong> <strong>Glendale</strong>, and <strong>Glendale</strong> is notlisted in FEMA’s Community Rating System. [The Community Rating System (CRS) is asystem for crediting communities that implement measures to protect the natural and beneficialfunctions <strong>of</strong> their floodplains, as well as managing their erosion hazard.] Although, there areno FIRM maps for the city, and <strong>Glendale</strong> is not currently listed in FEMA’s CRS <strong>of</strong> cities, theCity <strong>of</strong> <strong>Glendale</strong> has participated as a regular member in the NFIP since August 31, 1984 (CityID No. – 065030). Since the City is a participating member <strong>of</strong> the NFIP, flood insurance isavailable for individuals to purchase voluntarily. There is, however, a 30-day wait period afterthe policy is issued before the coverage becomes effective.Since these analyses were conducted, however, there has been substantial development in thehills <strong>of</strong> <strong>Glendale</strong>, increasing run<strong>of</strong>f into the city’s storm drains and flood-conveyance system.The studies also did not consider the impacts that debris flows could have on the city. Duringthe past 80 years, the Los Angeles County Department <strong>of</strong> Public Works (LACDPW) and theUS Army Corps <strong>of</strong> Engineers have constructed several detention or debris basins in the San2006 PAGE 8- 17
Natural <strong>Hazard</strong>s <strong>Mitigation</strong> PlanCity <strong>of</strong> <strong>Glendale</strong>, <strong>California</strong>Section 8 – FloodsGabriel Mountains, in or above <strong>Glendale</strong>, including debris basins in Cooks, Dunsmore, Shields,Eagle, Pickens and Hall Beckley Canyons. At least three other debris basins have been built inthe Verdugo Mountains, above the populated areas <strong>of</strong> the city. The LACDPW also has madechannel alterations consisting primarily <strong>of</strong> concrete side-slopes and linings for most <strong>of</strong> the majorchannels in the area. These flood control structures are presently owned and operated by theLACDPW, which has jurisdiction over the watercourses in the <strong>Glendale</strong> area, as well as theregional flood control system in the Los Angeles County. All <strong>of</strong> these structures help regulateflow in the Verdugo Channel, holding back some <strong>of</strong> the flow during intense rainfall periods thatcould otherwise overwhelm the storm drain system in the area.These storm drain facilities generally provide the city with adequate protection from a majorstorm except some isolated minor localized inundation. This type <strong>of</strong> localized inundation maymean that on major storms, a portion <strong>of</strong> the street may be flooded but the water level will becontained within the curbs. No flooding <strong>of</strong> private properties occurs unless there is a backup <strong>of</strong>local storm drains.Localized Flooding: One area in the city that may sporadically flood is at the terminus <strong>of</strong>Woodland Avenue. This street was cut with the construction <strong>of</strong> the Verdugo Wash, and is nowa dead-end residential street that is serving only 12 residential homes. A lateral <strong>of</strong> the VerdugoWash Channel was also constructed which terminated at the terminus <strong>of</strong> Woodland Avenue.Because <strong>of</strong> grade, three (3) 36-inch flap gates were installed at the end <strong>of</strong> that lateral. Undersevere storm conditions, the flap gates close and run<strong>of</strong>f from the street is retained within thestreet temporarily until the flow can be taken into the channel.Inundation due to Catastrophic Failure <strong>of</strong> Water Storage Structures: Loss <strong>of</strong> lifeand damage to structures, roads, and utilities may result from a dam failure. Economic lossescan also result from a lowered tax base and lack <strong>of</strong> utility pr<strong>of</strong>its. These effects would certainlyaccompany the failure <strong>of</strong> one <strong>of</strong> the major dams in the city <strong>of</strong> <strong>Glendale</strong>.There are seven dams in the <strong>Glendale</strong> area that fall under <strong>State</strong> jurisdiction. These dams areowned by the city <strong>of</strong> <strong>Glendale</strong> and retain small reservoirs in the Verdugo Mountains and SanRafael Hills. From west to east, they include the 10 th and Western, Brand Park, and Diederichdams in the Verdugo Mountains, and the Glorietta East, Chevy Chase 1290, Glenoaks 968 andChevy Chase 968 dams in the San Rafael Hills. Areas in <strong>Glendale</strong> within the dam inundationareas identified by the <strong>State</strong> are shown on Map 8-3 (and Plate H-10). All <strong>of</strong> these sevenconcrete reservoirs have inundations maps approved by the <strong>State</strong> Office <strong>of</strong> Emergency Services.These maps are included in the Dam Evaluation Plan for the City <strong>of</strong> <strong>Glendale</strong>. Two <strong>of</strong> thereservoirs, Brand Park and Chevy Chase 968, reportedly would empty in uninhabited areas ordirectly into a flood control channel. As a result, failure <strong>of</strong> these two dams would not create aneed for evacuation <strong>of</strong> areas downgradient from the dams (<strong>Glendale</strong> Water and Power writtencommunication, 2006).There are several other, smaller debris basins in the <strong>Glendale</strong> area that are not subject to <strong>State</strong>regulations because they are too small. These debris basins, and other flood controlimprovements, such as canals, culverts, and levees, may crack and suffer structural damageduring an earthquake, especially in areas prone to ground failure, such as that due toliquefaction or slope instability. These facilities could pose an inundation hazard to areasdownstream if they contain water at the time <strong>of</strong> the seismic event, or if they are not repairedprior to the next winter storm season.There are thirteen steel water storage tanks in the city <strong>of</strong> <strong>Glendale</strong>. Tanks located near the faulthazard management zones (identified in Section 6 <strong>of</strong> this report, see Plate H-4) are especiallyvulnerable to rupture due to ground deformation, strong ground shaking and even surfacefault rupture. While most water tanks in the <strong>Glendale</strong> area are not located near fault2006 PAGE 8- 18
Natural <strong>Hazard</strong>s <strong>Mitigation</strong> PlanCity <strong>of</strong> <strong>Glendale</strong>, <strong>California</strong>Section 8 – Floodsmanagement zones, three tanks near the base <strong>of</strong> the San Gabriel Mountains are located withinthe <strong>State</strong> mandated Alquist-Priolo Earthquake Fault Zone for the Sierra Madre fault. Becausethese water tanks have a heightened risk <strong>of</strong> rupturing catastrophically during an earthquake onthe Sierra Madre fault, their inundation paths should be identified to evaluate whether or nothabitable structures are located within the floodway. The evaluation should also addresswhether these water reservoirs are self-contained. In the event <strong>of</strong> a catastrophic breakage, willthe water be contained within the site, or will it be discharged to a storm drain or channel orwill it pose a hazard to properties downstream?Because the entire city <strong>of</strong> <strong>Glendale</strong> is susceptible to strong seismic ground motion, all watertanks should incorporate new earthquake resistant designs, including flexible pipe joints.According to <strong>Glendale</strong> Water and Power, all steel water tanks in <strong>Glendale</strong> have been fitted withflexible joints that can accommodate some movement during seismic events, reducing thepotential for breakage <strong>of</strong> the pipes, leading to accidental releases <strong>of</strong> water.Map 8.3: Dam Inundation Areas in the City <strong>of</strong> <strong>Glendale</strong>2006 PAGE 8- 19
Natural <strong>Hazard</strong>s <strong>Mitigation</strong> PlanCity <strong>of</strong> <strong>Glendale</strong>, <strong>California</strong>Section 8 – FloodsVulnerability Assessment:Vulnerability assessment is the second step <strong>of</strong> flood-hazard assessment. It combines thefloodprone areas identified previously with an inventory <strong>of</strong> the property within those areas.Understanding the population and property exposed to this hazard can assist in reducing riskand preventing loss from future events. Because site-specific inventory data and inundationlevels are not available for <strong>Glendale</strong> (according to FEMA there are no flood-prone areas in thecity), calculating the community’s vulnerability to flood events is difficult. Typically,2006 PAGE 8- 20
Natural <strong>Hazard</strong>s <strong>Mitigation</strong> PlanCity <strong>of</strong> <strong>Glendale</strong>, <strong>California</strong>Section 8 – Floodsvulnerability assessments <strong>of</strong> flooding hazards involve assessing the amount <strong>of</strong> property in thefloodplain, as well as the type and value <strong>of</strong> structures on those properties. Once that is done,then a working estimate for potential flood losses can be calculated. The HAZUS s<strong>of</strong>tware has acomponent to estimate losses due to flooding. Input to the program can include FEMA floodinundation zones, or site-specific engineering studies <strong>of</strong> flood potential prepared by othersrather than FEMA. Since there are no FEMA maps available for <strong>Glendale</strong>, nor are there morerecent and city-specific studies that identify potential flooding areas, this loss estimationanalysis was not conducted for this report. Should data be developed in the future to more fullymap this hazard, loss estimation analyses based on that mapping can then be conducted.Community Flood Issues:What is Susceptible to Damage During a Flood Event?The largest impact on communities from flood events is the loss <strong>of</strong> life and property. Duringcertain years, property losses resulting from flood damage are extensive. Property loss fromfloods strikes both private and public property. Although there has been no significant floodingin <strong>Glendale</strong> since at least 1969, as described above, localized flooding does occur sporadically.Furthermore, storm damage in the form <strong>of</strong> drips into structures, amounting to considerableamount <strong>of</strong> money in the form <strong>of</strong> repairs, have been reported as recently as with the storms <strong>of</strong>2005.Property Loss Resulting from Flooding Events: The type <strong>of</strong> property damage caused byflood events depends on the depth and velocity <strong>of</strong> the floodwaters. Faster moving floodwaterscan wash buildings <strong>of</strong>f their foundations and sweep cars downstream. Pipelines, bridges, andother infrastructure can be damaged when high waters combine with flood debris. Extensivedamage can be caused by basement flooding and landslide damage related to soil saturationfrom flood events. Most flood damage is caused by water saturating materials susceptible to loss(i.e., wood, insulation, wallboard, fabric, furnishings, floor coverings, and appliances). In manycases, flood damage to homes renders them unlivable.Risk Analysis:Risk analysis is the third and most advanced phase <strong>of</strong> a hazard assessment. It builds upon thehazard identification and vulnerability assessment. A flood risk analysis for the city <strong>of</strong> <strong>Glendale</strong>should include two components: 1) the life and value <strong>of</strong> property that may incur losses from aflood event (defined through the vulnerability assessment); and 2) the number and type <strong>of</strong> floodevents expected to occur over time. Within the broad components <strong>of</strong> a risk analysis, it ispossible to predict the severity <strong>of</strong> damage from a range <strong>of</strong> events. Flow velocity models canassist in predicting the amount <strong>of</strong> damage expected from different magnitudes <strong>of</strong> flood events.The data used to develop these models is based on hydrological analysis <strong>of</strong> landscape features.Changes in the landscape, <strong>of</strong>ten associated with human development, can alter the flow velocityand the severity <strong>of</strong> damage that can be expected from a flood event. Using GIS technology andflow velocity models, it is possible to map the damage that can be expected from flood eventsover time. It is also possible to pinpoint the effects <strong>of</strong> certain flood events on individualproperties. At the time <strong>of</strong> publication <strong>of</strong> this Plan, data was insufficient to conduct a riskanalysis for flood events in the city <strong>of</strong> <strong>Glendale</strong>.However, the current mapping projects will result in better data that will assist inunderstanding risk. This Plan includes recommendations for building partnerships that willsupport the development <strong>of</strong> a flood risk analysis in the City <strong>of</strong> <strong>Glendale</strong>Manufactured Homes:<strong>State</strong>wide, the 1996 floods destroyed 156 housing units. Of those units, 61 percent were mobile2006 PAGE 8- 21
Natural <strong>Hazard</strong>s <strong>Mitigation</strong> PlanCity <strong>of</strong> <strong>Glendale</strong>, <strong>California</strong>Section 8 – Floodshomes and trailers. Many older manufactured home parks are located in floodplain or low-lyingareas. Manufactured homes have a lower level <strong>of</strong> structural stability than stick-built homes, andmust be anchored to provide additional structural stability during flood events (and forearthquake preparedness, also). Because <strong>of</strong> confusion in the late 1980s resulting from multiplechanges in NFIP regulations, there are some communities that do not actively enforceanchoring requirements.Business/Industry:Storm-flooding events impact businesses by damaging property and by interrupting business.Flood events can cut <strong>of</strong>f customer access to a business as well as close a business for repairs.Ro<strong>of</strong> leaks can impact the contents; in extreme cases, leaks can cause damage to sensitiveelectrical equipment, with the potential to cause the affected business thousands <strong>of</strong> dollars inmaterial losses and potential loss <strong>of</strong> revenue. A quick response to the needs <strong>of</strong> businessesaffected by flood events can help a community maintain economic vitality in the face <strong>of</strong> flooddamage. Responses to business damages can include funding to assist owners in elevating orrelocating flood-prone business structures, and loans to make building improvements, such asnew ro<strong>of</strong>s.Public Infrastructure:Publicly owned facilities are a key component <strong>of</strong> daily life for all citizens <strong>of</strong> Los Angeles County,including <strong>Glendale</strong> residents. Damage to public water and sewer systems, transportationnetworks, flood control facilities, emergency facilities, and <strong>of</strong>fices can hinder the ability <strong>of</strong> thegovernment to deliver services. Government can take action to reduce risk to publicinfrastructure from flood events, as well as craft public policy that reduces risk to privateproperty from flood events.Roads:During natural hazard events, or any type <strong>of</strong> emergency or disaster, dependable roadconnections are critical for providing emergency services. Roads systems in the city <strong>of</strong> <strong>Glendale</strong>are maintained by multiple jurisdictions. Federal, <strong>State</strong>, county, and city governments all have astake in protecting roads from flood damage. Road networks <strong>of</strong>ten traverse floodplains andfloodway areas. Transportation agencies responsible for road maintenance are typically aware<strong>of</strong> roads at risk from flooding.Bridges:Bridges are key points <strong>of</strong> concern during flood events because they are important links in roadnetworks, river crossings, and they can be obstructions in watercourses, inhibiting the flow <strong>of</strong>water during flood events. Scour at highway bridges involves sediment-transport and erosionprocesses that cause streambed material to be removed from the bridge vicinity. Nationwide,several catastrophic collapses <strong>of</strong> highway and railroad bridges have occurred due to scouringand a subsequent loss <strong>of</strong> support <strong>of</strong> foundations. This has led to a nationwide inventory andevaluation <strong>of</strong> bridges (Richardson and others, 1993).Scour processes are generally classified into separate components, including pier scour,abutment scour, and contraction scour. Pier scour occurs when flow impinges against theupstream side <strong>of</strong> the pier, forcing the flow in a downward direction and causing scour <strong>of</strong> thestreambed adjacent to the pier. Abutment scour happens when flow impinges against theabutment, causing the flow to change direction and mix with adjacent main-channel flow,resulting in scouring forces near the abutment toe. Contraction scour occurs when flood-plainflow is forced back through a narrower opening at the bridge, where an increase in velocity canproduce scour. Total scour for a particular site is the combined effects from all threecomponents. Scour can occur within the main channel, on the flood plain, or both. Whiledifferent materials scour at different rates, the ultimate scour attained for different materials is2006 PAGE 8- 22
Natural <strong>Hazard</strong>s <strong>Mitigation</strong> PlanCity <strong>of</strong> <strong>Glendale</strong>, <strong>California</strong>Section 8 – Floodssimilar and depends mainly on the duration <strong>of</strong> peak stream flow acting on the material (Lagasseand others, 1991).The <strong>State</strong> <strong>of</strong> <strong>California</strong> participates in the bridge scour inventory and evaluation program and astate-designated inspector must inspect all state, county, and city bridges every two years. Theinspections are rigorous, looking at everything from seismic capability to erosion and scour.The bridges in the city <strong>of</strong> <strong>Glendale</strong> are <strong>State</strong>, county, city, or privately owned. To date, wehave not found any records to indicate that the bridges in the <strong>Glendale</strong> area have beenevaluated. Nevertheless, since the Verdugo Wash is channelized in the city, the potential forbridge scour to occur along the Verdugo Wash is considered low to nil. The most significant,although unlikely concern regarding bridge scour is if unusually high surface water flows in theSycamore and Scholl Canyons were to reach the <strong>Glendale</strong> (2) Freeway, impacting the bridges atChase Drive and Glenoaks Boulevard. Privately owned bridges are not inspected, so thosebridges extending across unlined creeks could be at risk <strong>of</strong> failure due to scour.Storm Water Systems:As indicated above, drainage problems are known to occur sporadically in some specific areas <strong>of</strong><strong>Glendale</strong>. However, the City does not consider these drainage issues more than a nuisance, andhas pumping equipment to deal with flooding in these low spots when necessary.Inadequate maintenance can also contribute to the flood hazard in urban areas. As long as theCity conducts a regular inspection <strong>of</strong> culverts and storm drains to remove debris that mayobstruct the flow <strong>of</strong> water during storms, most areas should not be impacted by flooding.Water/Wastewater Treatment Facilities:The city <strong>of</strong> <strong>Glendale</strong> is a part <strong>of</strong> the Sanitation Districts <strong>of</strong> Los Angeles County. The SanitationDistricts are a confederation <strong>of</strong> independent special districts serving about 5 million people inLos Angeles County. There are no wastewater treatment facilities in <strong>Glendale</strong>.Water Quality:Environmental quality problems include bacteria, toxins, and pollution. “Out <strong>of</strong> sight, out <strong>of</strong>mind” has traditionally been a common approach to dealing with trash, sediment, used motoroil, unused paint and thinner, and other hazardous substances that people dump into the seweror storm drains. What we <strong>of</strong>ten forget is that these substances eventually make their way intothe rivers and oceans, where they can sicken surfers and swimmers, and endanger wildlife. TheClean Water Act <strong>of</strong> 1972 originally established the National Pollutant Discharge EliminationSystem (NPDES) to control wastewater discharges from various industries and wastewatertreatment plants, known as “point sources.” Point sources are defined by the EPA as discreteconveyances such as pipes or direct discharges from businesses or public agencies. Then, in1987, the Water Quality Act amended the NPDES permit system to include “nonpoint source”pollution (NPS pollution). NPS pollution refers to the introduction <strong>of</strong> bacteria, sediment, oiland grease, heavy metals, pesticides, fertilizers and other chemicals into our rivers, bays andoceans from less defined sources. These pollutants are washed away from roadways, parkinglots, yards, and other areas by rain and dry-weather urban run<strong>of</strong>f, entering the storm drains,and ultimately the area’s streams, bays and ocean. NPS pollution is now thought to account formost water quality problems in the United <strong>State</strong>s. Therefore, strict enforcement <strong>of</strong> thisprogram at the local level, with everybody doing his or her part to reduce NPS pollution, canmake a significant difference.The National Pollutant Discharge Elimination System (NPDES) permit program controlswater pollution by regulating point and nonpoint sources that discharge pollutants into waters<strong>of</strong> the United <strong>State</strong>s. The City <strong>of</strong> <strong>Glendale</strong> is a member <strong>of</strong> the Los Angeles County StormwaterProgram. This program regulates and controls storm water and urban run<strong>of</strong>f into the LosAngeles River, San Gabriel River, Santa Clara River, tributaries to these rivers, and ultimately,2006 PAGE 8- 23
Natural <strong>Hazard</strong>s <strong>Mitigation</strong> PlanCity <strong>of</strong> <strong>Glendale</strong>, <strong>California</strong>Section 8 – Floodsthe Pacific Ocean. The Los Angeles County Stormwater Program is the local enforcer <strong>of</strong> theNPDES program. In the <strong>Glendale</strong> Area, NPDES permits are filed with the <strong>California</strong> RegionalWater Quality Control Board, Los Angeles Region. This permit was required by all countieswith a storm drain system that serves a population <strong>of</strong> 100,000 or more. On October 29, 1999,Phase II <strong>of</strong> NPDES was signed into law. Under this phase <strong>of</strong> NPDES, areas with 50,000 ormore residents, and construction sites one acre or more in size, must file for and obtain anNPDES permit. Under NPDES, the local regulator is responsible for the following controlmeasures:• Public education and outreach on storm water impacts,• Public involvement/participation,• Illicit discharge detection and elimination,• Construction <strong>of</strong> site storm water run<strong>of</strong>f control,• Post-construction storm water management in new development and redevelopment,and• Pollution prevention/good housekeeping for municipal operations.The NPDES permit area that includes <strong>Glendale</strong> is 3,100 square miles in area, with a population<strong>of</strong> 11.4 million. In conformance with the Federal requirements listed above, one <strong>of</strong> the majortasks <strong>of</strong> the Los Angeles County Stormwater Program is to educate the local population aboutkeeping the water that flows into our rivers and ocean clean by eliminating discharges <strong>of</strong>hazardous materials into storm drains and other point sources. Signs are typically painted bystorm drains that drain to the local rivers and ultimately into the Pacific Ocean to encouragepeople from not disposing motor oil or other potentially hazardous substances into the drains.Existing Flood <strong>Mitigation</strong> Activities:Flood mitigation activities listed here include current mitigation programs and activities thatare being implemented by the City <strong>of</strong> <strong>Glendale</strong> agencies or organizations.The City <strong>of</strong> <strong>Glendale</strong> uses building codes, zoning codes, and various planning strategies toaddress the goals which aim at restricting development in areas <strong>of</strong> known hazards, and applyingthe appropriate safeguards.Acquisition and Protection <strong>of</strong> Open Space in the Floodplain:Current efforts to increase public open space in the southern <strong>California</strong> area been paired withthe need to restore and preserve natural systems that provide wildlife habitat and help tomitigate flood events. Public parks and publicly owned open spaces can provide a bufferbetween flood hazards and private property.Water Districts:Many water districts in the region are in the process <strong>of</strong> replacing old cast iron pipes with moreductile iron pipes, which will be more resilient in disaster situations. Water districts in theregion are committed to working together during a disaster to provide water to the area’sresidents as soon as possible in the event that the water distribution system fails locally. Forexample, <strong>Glendale</strong>’s Department <strong>of</strong> Water and Power has built inter-ties with the MetropolitanWater District for emergency situations.Stormwater Systems:There are several surface water management providers in the county that manage water qualityand storm water run<strong>of</strong>f from new development. The primary one, and the one that providesflood control services for the city <strong>of</strong> <strong>Glendale</strong> is the Los Angeles County Department <strong>of</strong> PublicWorks.2006 PAGE 8- 24
Natural <strong>Hazard</strong>s <strong>Mitigation</strong> PlanCity <strong>of</strong> <strong>Glendale</strong>, <strong>California</strong>Section 8 – FloodsFlood Management Projects:Flood management structures can assist in regulating flood levels by adjusting water flowsupstream <strong>of</strong> flood-prone areas. The main flood control systems in the <strong>Glendale</strong> area include theVerdugo Wash Flood Control Channel and Sycamore Canyon Channel. In addition, there areseveral detention or debris basins in the San Gabriel Mountains, in or above <strong>Glendale</strong> thatprovide flood protection.Verdugo Wash Flood Control Channel: The city <strong>of</strong> <strong>Glendale</strong> is primarily served by theVerdugo Wash Flood Control Channel. This Channel was designed for a 100-year capital stormto carry the storm water run-<strong>of</strong>f from the hillsides at the northern portion <strong>of</strong> the city (in the LaCrescenta area), and outlets into the Los Angeles River. Other tributaries <strong>of</strong> the Verdugo Washinclude: Halls Canyon Channel, Pickens Canyon Channel, Eagle Shields Canyon Channel, CooksCanyon Channel and the Dunsmuir Canyon Channel. A debris basin was also constructed acrossthe Verdugo Wash Channel downstream from all the tributary channels to filter debris thatcould potentially clog the channel and reduce its capacity.Sycamore Canyon Channel: The eastern portion <strong>of</strong> the city is served by the SycamoreCanyon Channel. This channel was built during the 1930s. Although many developments haveoccurred within its drainage area, it is generally adequate for storm water protection, except fora small portion <strong>of</strong> the “Adams Hill Area,” where there is a dip on Cottage Grove Avenue,between Palmer Street and Green Street. This dip acts as drainage channel, and during heavyrains, this dip may be subjected to minor flooding. However, private properties are notadversely affected.Community Issues Summary:Flooding issues in <strong>Glendale</strong> are considered minor, however, recent storms have shown thatstorm damages to structures and businesses can cost thousands if not millions <strong>of</strong> dollars torepair. In most cases, these loss estimates do not even include lost revenue due to businessinterruption.The city <strong>of</strong> <strong>Glendale</strong> works to address its localized flooding problems as they arise. However,given that some areas in <strong>Glendale</strong> appear to be more susceptible to flooding issues, due in greatpart to urban run <strong>of</strong>f and modification <strong>of</strong> the natural environment, proactive measures thataddress the issues before flooding occurs could be implemented.Flood <strong>Mitigation</strong> Action ItemsThe flood mitigation action items provide direction on specific activities that organizations andresidents in the city <strong>of</strong> <strong>Glendale</strong> can undertake to reduce risk and prevent loss from floodevents. Each action item is followed by ideas for implementation, which can be used by thesteering committee and local decision makers in pursuing strategies for implementation.Short Term – Flood #l:Action Item: Analyze each repetitive flood property within the City <strong>of</strong> <strong>Glendale</strong> and identifyfeasible mitigation options.Ideas for Implementation:♦ Identify appropriate and feasible mitigation activities for identified repetitive floodproperties. Funding may be available through FEMA' s <strong>Hazard</strong> <strong>Mitigation</strong> Grant andFlood <strong>Mitigation</strong> Assistance Programs and the Pre-disaster <strong>Mitigation</strong> Program.2006 PAGE 8- 25
Natural <strong>Hazard</strong>s <strong>Mitigation</strong> PlanCity <strong>of</strong> <strong>Glendale</strong>, <strong>California</strong>Section 8 – Floods♦ Contact repetitive loss property owners to discuss mitigation opportunities, anddetermine interest should future project opportunities arise.♦ Explore options for incentives to encourage property owners to engage in mitigation.Coordinating Organization:Timeline:Plan Goals Addressed:Constraints:<strong>Hazard</strong> <strong>Mitigation</strong> Advisory Committee1-2 yearsProtect Life and Property, Partnerships andImplementationPending Funding and Available PersonnelShort Term – Flood #2:Action Item: Recommend revisions to requirements for development within the floodplain,where appropriate.Ideas for Implementation:♦♦♦♦Evaluate elevation requirements for new residential and nonresidential structures in theunincorporated floodplain area.Explore raising the base elevation requirement for new residential construction to twoor three feet above base flood elevation, or greater. An increased elevation standard isone activity the county can engage in to receive credit from the NFIP CommunityRating System Program.Identify opportunities to upgrade Federal Insurance Rate Map, and arrange forCooperative Technical Partnership mapping upgrades for select areas.Identify alternatives to reduce development in the floodplain.Coordinating Organization:Timeline:Plan Goals Addressed:Constraints:Public Works, County Department <strong>of</strong> Transportation,Information Services2 yearsProtect Life and PropertyPending Funding and Available PersonnelShort Term – Flood #3:Action Item: Develop better flood warning systems.Ideas for Implementation:♦Coordinate with appropriate organizations to evaluate the need for more stream gauges.♦ Distribute information regarding flooding to the general public efficiently.Coordinating Organization: County Emergency Management, County PublicWorks, County Department <strong>of</strong> TransportationTimeline:2 yearsPlan Goals Addressed:Protect Life and Property, Emergency ServicesConstraints:Pending Funding and Available Personnel2006 PAGE 8- 26
Natural <strong>Hazard</strong>s <strong>Mitigation</strong> PlanCity <strong>of</strong> <strong>Glendale</strong>, <strong>California</strong>Section 8 – FloodsLong Term – Flood #l:Action Item: Enhance data and mapping for floodplain information within the county, andidentify and map flood-prone areas outside <strong>of</strong> designated floodplains.Ideas for Implementation:♦ Apply for FEMA's cooperative technical partnership using the 2-foot contour intervalfloodplain mapping data acquired by the City <strong>of</strong> <strong>Glendale</strong> GIS.♦ Use WES inventory and mapping data to update the flood-loss estimates for the city <strong>of</strong><strong>Glendale</strong>.♦ Encourage the development <strong>of</strong> floodplain maps for all local streams not currentlymapped on Flood Insurance Rate Maps or county maps, with special attention focusedon mapping rural and unincorporated areas. The maps should show the expectedfrequency <strong>of</strong> flooding, the level <strong>of</strong> flooding, and the areas subject to inundation. Themaps can be used for planning, risk analysis, and emergency management.Coordinating Organization: County Geographic Information Services, CountyDepartment <strong>of</strong> Transportation, County Public WorksTimeline:3 years (as funding allows)Plan Goals Addr essed: Protect Life and PropertyConstraints:Pending Funding and Available PersonnelL ong Term – Flood #2:Action Item: Encourage development <strong>of</strong> acquisition and management strategies to preserveopen space for flood mitigation, fish habitat, and water quality in the floodplain.Ideas for Implementation:♦ Develop a comprehensive strategy for acquiring and managing floodplain open space inthe City <strong>of</strong> <strong>Glendale</strong>.♦♦♦♦♦Explore funding for property acquisition from federal (e,g" FEMA <strong>Hazard</strong> <strong>Mitigation</strong>Grant Program), state, regional, and local governments, as well as private and nonpr<strong>of</strong>itorganizations, trails programs, fish programs as well as options for specialappropriations.Develop a regional partnership between flood mitigation, fish habitat, and water qualityenhancement organizations/programs to improve educational programs.Identify sites where environmental restoration work can benefit flood mitigation, fishhabitat, and water quality.Work with landowners to develop flood management practices that provide healthy fishhabitat.Identify existing watershed education programs and determine which programs wouldsupport a flood education component.Coordin ating Organization: County Department <strong>of</strong> Transportation, County PublicWorksTimeline:5 years2006 PAGE 8- 27
Natural <strong>Hazard</strong>s <strong>Mitigation</strong> PlanCity <strong>of</strong> <strong>Glendale</strong>, <strong>California</strong>Plan Goals Addressed:Constraints:Section 8 – FloodsNatural Systems, Protect Life and PropertyPending Funding and Available PersonnelL ong Term – Flood #3:Action Item: Identify surface water drainage obstructions in the city <strong>of</strong> <strong>Glendale</strong>.Ideas for Implementation:♦ Map culverts in the city.♦ Prepare an inventory <strong>of</strong>them for retr<strong>of</strong>itting.culverts that historically create flooding problems and target♦Prepare an inventory <strong>of</strong> major urban drainage problems, and identify causes andpotential mitigation actions for urban drainage problem areas.Coordinating Organization:Timeline:Plan Goals Addressed:Constraints:County Public Works, County Geographic InformationSystems5 yearsProtect Life and PropertyPending Funding and Available PersonnelL ong Term – Flood #4:Action Item: Establish a framework to compile and coordinate surface water managementplans and data throughout the City.Ideas for Implementation:♦ Develop surface water management plans for areas that are not currently within surfacewater management plan boundaries.Coordinating Organization: County Public Works, County Planning Division,Geographic Information SystemsTimeline:5 yearsPlan Goals Addressed: Protect Life and Property, Partnerships andImplementationConstraints:Pending Funding and Available PersonnelFlood Resource DirectoryThe following resource directory lists the resources and programs that can assist countycommunities and organizations. The resource directory will provide contact information forlocal, county, regional, <strong>State</strong> and Federal programs that deal with natural hazards. Foradditional information, refer to Appendix A.2006 PAGE 8- 28
Natural <strong>Hazard</strong>s <strong>Mitigation</strong> PlanCity <strong>of</strong> <strong>Glendale</strong>, <strong>California</strong>Section 8 – FloodsCounty Resources:Los Angeles County Public Works Department900 S. Fremont Ave.Alhambra, CA 91803Ph: 626-458-5100Sanitation District <strong>of</strong> Los Angeles County1955 Workman Mill RoadWhittier, CA 90607Ph: 562-699-7411 x2301<strong>State</strong> Resources:Governor’s Office <strong>of</strong> Emergency Services (OES)P.O. Box 419047Rancho Cordova, CA 95741-9047Ph: 916 845- 8911Fx: 916 845- 8910<strong>California</strong> Resources Agency1416 Ninth Street, Suite 1311Sacramento, CA 95814Ph: 916-653-5656<strong>California</strong> Department <strong>of</strong> Water Resources (DWR)1416 9th StreetSacramento, CA 95814Ph: 916-653-6192<strong>California</strong> Department <strong>of</strong> Conservation: Southern <strong>California</strong> Regional Office655 S. Hope Street, #700Los Angeles, CA 90017-2321Ph: 213-239-0878Fx: 213-239-0984Federal Resources and Programs:Federal Emergency Management Agency (FEMA)FEMA provides maps <strong>of</strong> flood hazard areas, various publications related to flood mitigation,funding for flood mitigation projects, and technical assistance. FEMA also operates the NationalFlood Insurance Program. FEMA' s mission is to reduce loss <strong>of</strong> life and property and protectthe nation’s critical infrastructure from all types <strong>of</strong> hazards through a comprehensive, riskbased,emergency management program <strong>of</strong> mitigation, preparedness, response and recovery.Federal Emergency Management Agency, Region IX1111 Broadway, Suite 1200Oakland, CA 94607Ph: 510-627-71002006 PAGE 8- 29
Natural <strong>Hazard</strong>s <strong>Mitigation</strong> PlanCity <strong>of</strong> <strong>Glendale</strong>, <strong>California</strong>Section 8 – FloodsFx: 510-627-7112Federal Emergency Management Agency, <strong>Mitigation</strong> Division500 C Street, S.W.Washington, D.C. 20472Ph: 202-566-1600FEMA' s List <strong>of</strong> Flood Related <strong>Web</strong>sitesThis site contains a long list <strong>of</strong> flood related Internet sites from “American Heritage Rivers" to"The Weather Channel" and is a good starting point for flood information on the Internet.Contact: Federal Emergency Management Agency, Phone: (800) 480-2520<strong>Web</strong>site: http://www.fema.gov/nfip/related.htmNational Flood Insurance Program (NFIP)In southern <strong>California</strong>, many cities lie within flood zones as defined in FEMA Flood Maps. TheCity <strong>of</strong> <strong>Glendale</strong> is not a community within a designated flood zone. Nevertheless, floodinsurance is available to citizens in communities that adopt and implement NFIP buildingstandards. The standards are applied to development that occurs within a delineated floodplain,a drainage hazard area, and properties' within 250 feet <strong>of</strong> a floodplain boundary. These areas aredepicted on federal Flood Insurance Rate Maps available through the county.National Floodplain Insurance Program (NFIP)500 C Street, S.W.Washington, D.C. 20472Ph: 202-566-1600Other National Resources:The Floodplain Management AssociationThe Floodplain Management website was established by the Floodplain ManagementAssociation (FMA) to serve the entire floodplain management community. It includes full-textarticles, a calendar <strong>of</strong> upcoming events, a list <strong>of</strong> positions available, an index <strong>of</strong> publicationsavailable free or at nominal cost, a list <strong>of</strong> associations, a list <strong>of</strong> firms and consultants infloodplain management, an index <strong>of</strong> newsletters dealing with flood issues (with hypertext linksif available), a section on the basics <strong>of</strong> floodplain management, a list <strong>of</strong> frequently askedquestions (FAQs) about the <strong>Web</strong>site, and a catalog <strong>of</strong> <strong>Web</strong> links.Floodplain Management AssociationP.O. Box 50891Sparks, NV 89435-0891Ph: 775-626-6389Fx: 775-626-6389The Association <strong>of</strong> <strong>State</strong> Floodplain ManagersThe Association <strong>of</strong> <strong>State</strong> Floodplain Managers is an organization <strong>of</strong> pr<strong>of</strong>essionals involved infloodplain management, flood hazard mitigation, the National Flood Insurance Program, andflood preparedness, warning, and recovery. ASFPM fosters communication among thoseresponsible for flood hazard activities, provides technical advice to governments and otherentities about proposed actions or policies that will affect flood hazards, and encourages floodhazard research, education, and training. The ASFPM <strong>Web</strong> site includes information on how tobecome a member, the organization’s constitution and bylaws, directories <strong>of</strong> <strong>of</strong>ficers andcommittees, a publications list, information on upcoming conferences, a history <strong>of</strong> theassociation, and other useful information and Internet links.Contact: The Association <strong>of</strong> <strong>State</strong> Floodplain ManagersAddress: 2809 Fish Hatchery Road, Madison, WI 53713 Phone: (608) 274-0123<strong>Web</strong>site: http://www.floods,org2006 PAGE 8- 30
Natural <strong>Hazard</strong>s <strong>Mitigation</strong> PlanCity <strong>of</strong> <strong>Glendale</strong>, <strong>California</strong>Section 8 – FloodsNational Weather ServiceThe National Weather Service provides flood watches, warnings, and informational statementsfor rivers in the City <strong>of</strong> <strong>Glendale</strong>.National Weather Service520 North Elevar StreetOxnard, CA 93030Ph: 805-988- 6615Office <strong>of</strong> Hydrology, National Weather ServiceThe National Weather Service s Office <strong>of</strong> Hydrology (OH) and its Hydrological InformationCenter <strong>of</strong>fer information on floods and other aquatic disasters, This site <strong>of</strong>fers current andhistorical data including an archive <strong>of</strong> past flood summaries, information on current hydrologicconditions, water supply outlooks, an Automated Local Flood Warning Systems Handbook,Natural Disaster Survey Reports, and other scientific publications on hydrology and flooding.National Weather Service, Office <strong>of</strong> Hydrologic Development1325 East West Highway, SSMC2Silver Spring, MD 20910Ph: 301-713-1658Fx: 301-713-0963National Resources Conservation Service (NRCS), US Department <strong>of</strong> AgricultureNRCS provides a suite <strong>of</strong> federal programs designed to assist state and local governments andlandowners in mitigating the impacts <strong>of</strong> flood events. The Watershed Surveys and PlanningProgram and the Small Watershed Program provide technical and financial assistance to helpparticipants solve natural resource and related economic problems on a watershed basis. TheWetlands Reserve Program and the Flood Risk Reduction Program provide financial incentivesto landowners to put aside land that is either a wetland resource, or that experiences frequentflooding. The Emergency Watershed Protection Program (EWP) provides technical andfinancial assistance to clear debris from clogged waterways, restore vegetation, and stabilizingriverbanks. The measures taken under EWP must be environmentally and economically soundand generally benefit more that one property.National Resources Conservation Service14th and Independence Ave., SW, Room 5105-AWashington, DC 20250Ph: 202-720-7246Fx: 202-720-76902006 PAGE 8- 31
Natural <strong>Hazard</strong>s <strong>Mitigation</strong> PlanCity <strong>of</strong> <strong>Glendale</strong>, <strong>California</strong>Section 8 – FloodsUSGS Water ResourcesThis web page <strong>of</strong>fers current US water news; extensive current (including real-time) andhistorical water data; numerous fact sheets and other publications; various technical resources;descriptions <strong>of</strong> ongoing water survey programs; local water information; and connections toother sources <strong>of</strong> water information.USGS Water Resources6000 J Street Placer HallSacramento, CA 95819-6129Ph: 916-278-3000Fx: 916-278-3070Bureau <strong>of</strong> ReclamationThe mission <strong>of</strong> the Bureau <strong>of</strong> Reclamation is to manage, develop, and protect water and relatedresources in an environmentally and economically sound manner in the interest <strong>of</strong> the Americanpublic. The Bureau provides leadership and technical expertise in water resources developmentand in the efficient use <strong>of</strong> water through initiatives including conservation, reuse, and research.It protects the public and the environment through the adequate maintenance and appropriateoperation <strong>of</strong> Reclamation's facilities and manages Reclamation's facilities to fulfill water usercontracts and protect and/or enhance conditions for fish, wildlife, land, and cultural resources.Mid Pacific Regional OfficeFederal Office Building2800 Cottage WaySacramento CA 95825-1898Ph: 916- 978-5000Fax 916- 978-5599http://www.usbr.gov/Army Corps <strong>of</strong> EngineersThe Corps <strong>of</strong> Engineers administers a permit program to ensure that the nation’s waterways areused in the public interest. Any person, firm, or agency planning to work in waters <strong>of</strong> theUnited <strong>State</strong>s must first obtain a permit from the Army Corps <strong>of</strong> Engineers. The Corps isresponsible for the protection and development <strong>of</strong> the nation’s water resources, includingnavigation, flood control, energy production through hydropower management, water supplystorage and recreation.US Army Corps <strong>of</strong> EngineersP.O. Box 532711Los Angeles CA 90053- 2325Ph: 213-452- 3921American Public Works Association2345 Grand Boulevard, Suite 500Kansas City, MO 64108-2641Ph: 816-472-6100Fx: 816-472-16102006 PAGE 8- 32
Natural <strong>Hazard</strong>s <strong>Mitigation</strong> PlanCity <strong>of</strong> <strong>Glendale</strong>, <strong>California</strong>Section 8 – FloodsPublications:NFlP Community Rating System Coordinator’s ManualIndianapolis, IN.This informative brochure explains how the Community Rating System works and what thebenefits are to communities. It explains in detail the CRS point system, and what activitiescommunities can pursue to earn points. These points then add up to the "rating" for thecommunity, and flood insurance premium discounts are calculated based upon that "rating."The brochure also provides a table on the percent discount realized for each rating (1-10).Instructions on how to apply to be a CRS community are also included.Contact: NFIP Community Rating SystemPhone: (800) 480-2520 or (317) 848-2898<strong>Web</strong>site: http://www.fema.gov/nfip/crsFloodplain Management: A Local Floodplain Administrator’s Guide to the NFlPThis document discusses floodplain processes and terminology. It contains floodplainmanagement and mitigation strategies, as well as information on the NFIP, CRS, CommunityAssistance Visits, and floodplain development standards.Contact: National Flood Insurance Program Phone: (800) 480-2520<strong>Web</strong>site: http://www.fema,gov/nfip/Flood <strong>Hazard</strong> <strong>Mitigation</strong> Planning: A Community Guide, (June 1997).Massachusetts Department <strong>of</strong> Environmental Management.This informative guide <strong>of</strong>fers a 10-step process for successful flood hazard mitigation. Stepsinclude: map hazards, determine potential damage areas, take an inventory <strong>of</strong> facilities in theflood zone, determine what is or is not being done about flooding, identify gaps in protection,brainstorm alternatives and actions, determine feasible actions, coordinate with others,prioritize actions, develop strategies for implementation, and adopt and monitor the plan.Contact: Massachusetts Flood <strong>Hazard</strong> Management Program Phone: (617) 626-1250<strong>Web</strong>site: http://www.magnetstate.ma.us/dem/programs/mitigateReducing Losses in High Risk Flood <strong>Hazard</strong> Areas: A Guidebook for Local Officials,(February 1987), FEMA-116.This guidebook <strong>of</strong>fers a table on actions that communities can take to reduce flood losses. Italso <strong>of</strong>fers a table with sources for floodplain mapping assistance for the various types <strong>of</strong>flooding hazards. There is information on various types <strong>of</strong> flood hazards with regard to existingmitigation efforts and options for action (policy and programs, mapping, regulatory, nonregulatory).Types <strong>of</strong> flooding which are covered include alluvial fan, areas behind levees, areasbelow unsafe dams, coastal flooding, flash floods, fluctuating lake level floods, ground failuretriggered by earthquakes, ice jam flooding, and mudslides.Contact: Federal Emergency Management Agency Phone: (800) 480-2520<strong>Web</strong>site: http://www.fema,gov2006 PAGE 8- 33
Natural <strong>Hazard</strong>s <strong>Mitigation</strong> PlanCity <strong>of</strong> <strong>Glendale</strong>, <strong>California</strong>SECTION 9:Section 9 – LandslidesLANDSLIDESTable <strong>of</strong> ContentsWhy Are Landslides A Threat To The City Of <strong>Glendale</strong>?.................................................... 9-1What is a Landslide? .................................................................................................................................... 9-2What is a Debris Flow?................................................................................................................................ 9-3Historic Southern <strong>California</strong> Landslides ................................................................................................. 9-4Conditions Conducive to Slope Failures ................................................................................................. 9-5Landslide <strong>Hazard</strong> Assessment ..................................................................................................... 9-7<strong>Hazard</strong> Identification ................................................................................................................................... 9-7Vulnerability and Risk ................................................................................................................................. 9-9Community Landslide Issues .....................................................................................................9-10What Is Susceptible to Landslides? ........................................................................................................9-10Landslide <strong>Mitigation</strong> Activities ...............................................................................................................9-12Landslide <strong>Mitigation</strong> Action Items ..........................................................................................9-13Landslide Resource Directory ...................................................................................................9-15County Resources .......................................................................................................................................9-15<strong>State</strong> Resources ............................................................................................................................................9-15Federal Resources and Programs ...........................................................................................................9-16Publications ..................................................................................................................................................9-172006 PAGE 9 - i
Natural <strong>Hazard</strong>s <strong>Mitigation</strong> PlanCity <strong>of</strong> <strong>Glendale</strong>, <strong>California</strong>SECTION 9:Section 9 – LandslidesLANDSLIDESWhy are Landslides a Threat to the City <strong>of</strong> <strong>Glendale</strong>?Landslides are a serious geologic hazard in almost every state in America. Nationally, landslidescause 25 to 50 deaths each year. The best estimate <strong>of</strong> direct and indirect costs <strong>of</strong> landslidedamage in the United <strong>State</strong>s ranges between $1 and $2 billion annually. In <strong>California</strong>, landslidesare a significant problem, in part because <strong>of</strong> the region’s seismic activity, and in part because theregion is underlain by weak soils and rocks, especially when saturated. Some landslides resultin private property damage, whereas other landslides impact transportation corridors, fuel andenergy conduits, and communication facilities. They can also pose a serious threat to humanlife.The San Gabriel Mountains are located in the central part <strong>of</strong> the Transverse Ranges, wherethey rise abruptly to heights <strong>of</strong> more than 7,000 feet above the valley floor (several peaks aremore than 9,000 feet high and Mount Baldy is the highest at 10,064 feet). Bounded by the SanAndreas fault system on the north and the Sierra Madre fault zone on the south, the mountainsare essentially a large block <strong>of</strong> the Earth’s crust that has been squeezed up and thrust over thevalley floor by north-south compression along the Big Bend portion <strong>of</strong> the San Andreas tectonicplate boundary. Tectonic forces that initiated the rise <strong>of</strong> the mountains are thought to havestarted about 3.5 million years ago, at a time when scientists now believe there was a change inthe relative motion <strong>of</strong> the Pacific and North American tectonic plates from strike-slip (slippinghorizontally past one another) to transpressive (oblique movement that is a combination <strong>of</strong>strike-slip and compression). Uplift <strong>of</strong> the mountains accelerated in mid-Pleistocene time, about500,000 years ago, and continues today (Wright, 1991). The current rate <strong>of</strong> uplift, in thecontext <strong>of</strong> geologic time, is one <strong>of</strong> the fastest in the world.The steep southern flank <strong>of</strong> the San Gabriel Mountains is deeply incised by gorges and canyonsthat drain south into the La Cañada Valley, where they have been channelized, conveying theirflows south to Verdugo Wash. The three canyons that are located mostly within city <strong>of</strong><strong>Glendale</strong> limits include Ward, Dunsmore, and Cooks. Several other streams draining the SanGabriel Mountains that are also channelized through the La Crescenta area and into thenorthern portion <strong>of</strong> <strong>Glendale</strong>; these include the Eagle Canyon, Pickens, Hills and WineryCanyon channels (see Plate H-1 in Appendix H). Nearly all the tributaries flowing northerlyand easterly out <strong>of</strong> the Verdugo Mountains and westerly out <strong>of</strong> the San Rafael Hills also emptyinto Verdugo Wash. South <strong>of</strong> the mountains, Verdugo Wash turns to the west-southwest andjoins the Los Angeles River near the junction <strong>of</strong> Highway 134 with the 5 Freeway (Interstate 5).Drainage from the southwestern slope <strong>of</strong> the Verdugo Mountains flows directly across thealluvial fan and into the Los Angeles River. As discussed further in Section 8, Verdugo Washhas been confined to a man-made channel through most <strong>of</strong> <strong>Glendale</strong> to reduce the potential forit to flood the city.Nearly half <strong>of</strong> the land in <strong>Glendale</strong> consists <strong>of</strong> steep hillslopes and rugged mountains. Theseareas have for the most part been preserved in their near natural state, while most <strong>of</strong> thedevelopment in the city occurs in the flat to gently sloping alluvial surfaces at the base <strong>of</strong> themountains. However, some development (primarily residential) is present in and adjacent tosteep hillsides. These areas include the canyons within the Verdugo Mountains and the SanRafael Hills, and the alluvial fans situated at the front <strong>of</strong> the San Gabriel and VerdugoMountains. Such areas are locally vulnerable to slope instability, particularly in winters <strong>of</strong>heavy rainfall and in winters following wildfires.What is a Landslide?2006 PAGE 9 - 1
Natural <strong>Hazard</strong>s <strong>Mitigation</strong> PlanCity <strong>of</strong> <strong>Glendale</strong>, <strong>California</strong>Section 9 – LandslidesLandslides are downslope movements <strong>of</strong> relatively large landmasses, either as nearly intactbedrock blocks, or as jumbled mixes <strong>of</strong> bedrock blocks, fragments, debris, and soil. Landslidesare a type <strong>of</strong> “mass wasting” which denotes any down slope movement <strong>of</strong> soil and rock under thedirect influence <strong>of</strong> gravity. The term “landslide” encompasses events such as rock falls, topples,slides, spreads, and flows, and in general, landslides can be broken down into two categories: 1)rapidly moving (generally known as debris flows), and 2) slow moving. Rapidly movinglandslides or debris flows pose the greatest risk to human life, and people living in or travelingthrough areas prone to rapidly moving landslides are at increased risk <strong>of</strong> serious injury. Slowmoving landslides can cause significant property damage, but are less likely to result in serioushuman injuries.Geologists also describe the type <strong>of</strong> movement <strong>of</strong> a landslide as either 1) translational (wheremovement occurs along a flat surface), 2) rotational (where sliding material moves along acurved surface) or 3) wedge (where movement occurs on a wedge-shaped block formed byintersecting planes <strong>of</strong> weakness, such as fractures, faults and bedding). The size <strong>of</strong> a landslideusually depends on the geology and the initial cause <strong>of</strong> the landslide. Landslides vary greatly intheir volume <strong>of</strong> rock and soil, the length, width, and depth <strong>of</strong> the area affected, frequency <strong>of</strong>occurrence, and speed <strong>of</strong> movement. Slow-moving landslides can occur on relatively gentleslopes and can cause significant property damage, but are far less likely to result in seriousinjuries than rapidly moving landslides. Rotational and translational slides are generally slowmoving and can be deep; whereas wedge failures generally occur suddenly and are shallow.Slumps are small rotational slides that are generally shallow.Landslides can be initiated by rainfall, earthquakes, volcanic activity, changes in ground water,disturbance and change <strong>of</strong> a slope by man-made construction activities, or any combination <strong>of</strong>these factors. Landslides can also occur underwater, causing tidal waves and damage to coastalareas. The potential for slope failure is dependent on many factors, including slope height, slopesteepness, shear strength and orientation <strong>of</strong> the underlying geologic unit, as well as moisturecontent. For example, water can increase the plasticity <strong>of</strong> weak clays lining joints or shears,forming planes <strong>of</strong> weakness along which a landmass can fail.For engineering <strong>of</strong> earth materials, these factors are combined in calculations to determine if aslope meets a minimum safety standard. The generally accepted standard is a factor <strong>of</strong> safety <strong>of</strong>1.5 or greater (where 1.0 is equilibrium, and less than 1.0 is failure). Natural slopes, gradedslopes, or graded/natural slope combinations must meet these minimum engineering standardswhere they impact planned homes, subdivisions, or other types <strong>of</strong> developments. Slopesadjacent to areas where the risk <strong>of</strong> economic losses from landsliding is small, such as parks andmountain roadways, are <strong>of</strong>ten allowed a lesser factor <strong>of</strong> safety. From an engineeringperspective, landslides are generally unstable (may be subject to reactivation), and may becompressible, especially around the margins, which are typically highly disturbed and broken.The headscarp area above the landslide mass is also unstable, since it is typically oversteepened,cracked, and subject to additional failures. Although existing landslides are not widespread inthe <strong>Glendale</strong> area, it is probable that many <strong>of</strong> the steeper hillsides do not meet the minimumfactor <strong>of</strong> safety, and slope stabilization may be needed if development reaches these areas.Failure <strong>of</strong> a slope occurs when the force that is pulling the slope downward (gravity) exceedsthe strength <strong>of</strong> the earth materials that compose the slope. They can move slowly, (millimetersper year) or can move quickly and disastrously, as is the case with debris-flows. Debris-flowscan travel down a hillside <strong>of</strong> speeds up to 200 miles per hour (more commonly, 30 – 50 miles perhour), depending on the slope angle, water content, and type <strong>of</strong> earth and debris in the flow.These flows are initiated by heavy, usually sustained, periods <strong>of</strong> rainfall, but sometimes canhappen as a result <strong>of</strong> short bursts <strong>of</strong> concentrated rainfall in susceptible areas. Burned areascharred by wildfires are particularly susceptible to debris flows, given certain soil characteristicsand slope conditions.2006 PAGE 9 - 2
Natural <strong>Hazard</strong>s <strong>Mitigation</strong> PlanCity <strong>of</strong> <strong>Glendale</strong>, <strong>California</strong>Section 9 – LandslidesWhat is a Debris Flow?This type <strong>of</strong> failure is the most dangerous and destructive <strong>of</strong> all types <strong>of</strong> slope failure. A debrisflow (also called mudflow, mudslide, and debris avalanche) is a rapidly moving slurry <strong>of</strong> water,mud, rock, vegetation and debris. Larger debris flows are capable <strong>of</strong> moving trees, largeboulders, and even cars. This type <strong>of</strong> failure is especially dangerous as it can move at greatspeeds, is capable <strong>of</strong> crushing buildings, and can strike with very little warning. As with soilslips, the development <strong>of</strong> debris flows is strongly tied to exceptional storm periods <strong>of</strong> prolongedrainfall. Failure occurs during an intense rainfall event, following saturation <strong>of</strong> the soil byprevious rains.A debris flow most commonly originates as soil slip in the rounded, soil-filled “hollow” at thehead <strong>of</strong> a drainage swale or ravine. The rigid soil mass is deformed into a viscous fluid thatmoves down the drainage, incorporating into the flow additional soil and vegetation scouredfrom the channel. Debris flows also occur on canyon walls, <strong>of</strong>ten in soil-filled swales that do nothave topographic expression. The velocity <strong>of</strong> the flow depends on the viscosity, slope gradient,height <strong>of</strong> the slope, roughness and gradient <strong>of</strong> the channel, and the baffling effects <strong>of</strong> vegetation.Even relatively small amounts <strong>of</strong> debris can cause damage from inundation and/or impact(Ellen and Fleming, 1987; Reneau and Dietrich, 1987). Recognition <strong>of</strong> this hazard led FEMA tomodify its National Flood Insurance Program to include inundation by “mudslides.”Watersheds that have been recently burned typically yield greater amounts <strong>of</strong> soil and debristhan those that have not burned. Erosion rates during the first year after a fire are estimated tobe 15 to 35 times greater than normal, and peak discharge rates range from 2 to 35 timeshigher. These rates drop abruptly in the second year, and return to normal after about 5 years(Tan, 1998). In addition, debris flows in burned areas are unusual in that they can occur inresponse to small storms and do not require a long period <strong>of</strong> antecedent rainfall. These kinds <strong>of</strong>flows are common in small gullies and ravines during the first rains after a burn, and canbecome catastrophic when a severe burn is followed by an intense storm season (Wells, 1987).The United <strong>State</strong>s Geological Survey (USGS), as part <strong>of</strong> its National Landslide <strong>Hazard</strong>sProgram, is currently developing tools and methodologies to identify and quantify slopestability hazards posed by burned watersheds. Such tools will help communities withemergency planning and in dealing with post-fire rehabilitation (USGS, 2001).2006 PAGE 9 - 3
Natural <strong>Hazard</strong>s <strong>Mitigation</strong> PlanCity <strong>of</strong> <strong>Glendale</strong>, <strong>California</strong>Section 9 – LandslidesHistoric Southern <strong>California</strong> Landslides:Historically, there have been many landslides in the southern <strong>California</strong> area. Landslidesrecorded in the 20 th century alone caused losses <strong>of</strong> more than $5 billion (in 2000 dollars). Many<strong>of</strong> these landslides have occurred after particularly wet winters, others in response to strongground shaking during an earthquake. Some <strong>of</strong> the most dramatic <strong>of</strong> these cases are brieflydescribed below.1956 Portuguese Bend Landslide, Palos Verdes:Cost: $14.6 million (2000 dollars), on <strong>California</strong> Highway 14 in the Palos Verdes Hills. ThePortuguese Bend landslide is a reactivated ancient slide that began its modern movement inAugust 1956, when displacement was noticed at its northeast margin. Movement graduallyextended downslope so that the entire eastern edge <strong>of</strong> the slide mass was moving within 6weeks. By the summer <strong>of</strong> 1957, the entire slide mass was sliding towards the sea.1969 Glendora, Los Angeles County:Cost: $26.9 million (2000 dollars), in Los Angeles County. The winter <strong>of</strong> 1969 was one <strong>of</strong> thewettest on record in the southern <strong>California</strong> area. The rain caused many <strong>of</strong> the canyons at thebase <strong>of</strong> the San Gabriel Mountains to overflow, causing debris flows that damaged 175 housesin the Glendora area alone.1977-1980 Monterey Park and Repetto Hills, Los Angeles County:Cost, $14.6 million (2000 dollars); 100 houses damaged due to debris flows.1978 Bluebird Canyon, Orange County:Cost: $52.7 million (2000 dollars); 60 houses destroyed or damaged. On October 2, 1978, aportion <strong>of</strong> the Bluebird Canyon slope gave way, in great part due to the unusually heavy rains inMarch that may have contributed to initiation <strong>of</strong> the landslide. Although the 1978 slide area wasapproximately 3.5 acres, it is suspected to be a portion <strong>of</strong> a larger, ancient landslide.1979 Big Rock, <strong>California</strong>, Los Angeles County:Cost: approximately $1.08 billion (2000 dollars; rockslide causing damage to <strong>California</strong>Highway 1.1980 Southern <strong>California</strong> slides:Cost: $1.1 billion in damage (2000 dollars). Heavy winter rainfall in 1979-90 caused damage insix southern <strong>California</strong> counties. A sequence <strong>of</strong> five days <strong>of</strong> continuous rain that started onFebruary 8 dropped more than 7 inches <strong>of</strong> water by February 14. Slope failures began todevelop by February 15 and then very high-intensity rainfall occurred on February 16. Asmuch as 8 inches <strong>of</strong> rain fell in a 6-hour period in many locations. Records and personalobservations in the field on February 16 and 17 showed that the mountains and slopes literallyfell apart on those last two days.1983 San Clemente, Orange County:Cost: $65 million (2000 dollars), <strong>California</strong> Highway 1. Litigation associated with this landslideultimately cost approximately $43.7 million (2000 dollars).1983 Big Rock Mesa, Malibu, Los Angeles County:Cost: $706 million (2000 dollars) in legal claims; 13 houses condemned and 300 morethreatened due to rockslide triggered by intense rainfall.1978-1979, 1980 San Diego County:Experienced major damage from storms in 1978, 1979, and 1979-80, as did neighboring areas <strong>of</strong>Los Angeles and Orange County, <strong>California</strong>. One hundred and twenty landslides were reportedto have occurred in San Diego County during these 2 years. Rainfall for the rainy seasons <strong>of</strong> 78-79 and 79-80 was 14.82 and 15.61 inches (37.6 and 39.6 cm) respectively, compared to a 125-2006 PAGE 9 - 4
Natural <strong>Hazard</strong>s <strong>Mitigation</strong> PlanCity <strong>of</strong> <strong>Glendale</strong>, <strong>California</strong>Section 9 – Landslidesyear average (1850-1975) <strong>of</strong> 9.71 inches (24.7 cm). Significant landslides occurred in the FriarsFormation, a unit known to be slide-prone. [Of the nine landslides that caused damage in thenorthern part <strong>of</strong> San Diego County in excess <strong>of</strong> $1 million, seven occurred in the FriarsFormation, and two in the Santiago Formation.]1994 Northridge Earthquake Landslides:As a result <strong>of</strong> the magnitude 6.7 Northridge earthquake, more than 11,000 landslides occurredover an area <strong>of</strong> 10,000 km 2 . Most were in the Santa Susana Mountains and in mountains north<strong>of</strong> the Santa Clara River Valley. The landslides destroyed dozens <strong>of</strong> homes, blocked roads, anddamaged oil-field infrastructure.March 1995 Los Angeles and Ventura Counties:Above normal rainfall triggered damaging debris flows, deep-seated landslides, and flooding.Several deep-seated landslides were triggered by the storms, the most notable being the LaConchita landslide, which in combination with a local debris flow, destroyed or badly damaged11 to 12 homes in the small town <strong>of</strong> La Conchita, about 20 km west <strong>of</strong> Ventura. There also waswidespread debris-flow and flood damage to homes, commercial buildings, and roads andhighways in areas along the Malibu coast that had been devastated by wildfire two years before.2005 Landslide in La Conchita, Ventura CountyCost – undetermined yet. On January 10, 2005 a landslide struck the sea-side community <strong>of</strong> LaConchita destroying 36 homes and killing 10 people. The landslide occurred in an area knownfor prior landslide activity (more recently in 1995), and was the direct result <strong>of</strong> intense rainfallin the area, compounded by weak sediments and steep slopes.2005 Blue Bird Canyon Landslide, Laguna Beach, Orange CountyCost – undetermined yet, but probably in the billions, in great part due to litigation. On June 1,a landslide began moving in the area, almost certainly in response to the extremely wet winterrains earlier that year, in January and February. This landslide occurred in the same generalarea as the 1978 landslides. More than two dozen homes were damaged.Conditions Conducive to Slope FailuresLocations at risk from landslides or debris flows include the following: On or close to steep hills; Steep road-cuts or excavations; Existing landslides or places <strong>of</strong> known historic landslides (such sites <strong>of</strong>ten have tiltedpower lines, trees tilted in various directions, cracks in the ground, and irregularsurfacedground); Steep areas where surface run<strong>of</strong>f is channeled, such as below culverts, V-shaped valleys,canyon bottoms, and steep stream channels; Fan-shaped areas <strong>of</strong> sediment and boulder accumulation at the outlets <strong>of</strong> canyons; and Canyon areas below hillside and mountains that have recently (within 1-6 years) beensubjected to a wildland fire.The conditions leading to failure can be varied. The most common <strong>of</strong> these are described indetail below.Natural Conditions:Natural processes can cause landslides or re-activate historical landslide sites. The removal orundercutting <strong>of</strong> shoreline-supporting material along bodies <strong>of</strong> water by currents and wavesproduces countless small slides each year. Seismic tremors can trigger landslides on slopeshistorically known to have landslide movement. Earthquakes can also cause additional failure2006 PAGE 9 - 5
Natural <strong>Hazard</strong>s <strong>Mitigation</strong> PlanCity <strong>of</strong> <strong>Glendale</strong>, <strong>California</strong>Section 9 – Landslides(lateral spreading) that can occur on gentle slopes above steep streams and riverbanks.Weathering and the decomposition <strong>of</strong> geologic materials produces conditions conducive tolandslides, while human activity <strong>of</strong>ten further exacerbates many landslide problems. Manylandslides are difficult to mitigate, particularly in areas <strong>of</strong> large historic movement with weakunderlying geologic materials.Rock falls occur when blocks <strong>of</strong> material come loose on steep slopes. Weathering, erosion, orexcavations, such as those along highways, can cause falls where the road has been cut throughbedrock. They are fast moving with the materials free falling or bouncing down the slope. Infalls, material is detached from a steep slope or cliff. The volume <strong>of</strong> material involved isgenerally small, but large boulders or blocks <strong>of</strong> rock can cause significant damage.As the list <strong>of</strong> historical landslides suggests, landslides are <strong>of</strong>ten triggered by periods <strong>of</strong> heavyrainfall. Earthquakes, subterranean water flow and excavations may also trigger landslides.Certain geologic formations are more susceptible to landslides than others. Human activities,including locating development near steep slopes, can increase susceptibility to landslide events.Landslides on steep slopes are more dangerous because movements can be rapid.Wildland fires in hills covered with chaparral are <strong>of</strong>ten a precursor to debris flows in burned outcanyons. The extreme heat <strong>of</strong> a wildfire can create a soil condition in which the earth becomesimpervious to water by creating a waxy-like layer just below the ground surface. Since thewater cannot be absorbed into the soil, it rapidly accumulates on slopes, <strong>of</strong>ten gathering looseparticles <strong>of</strong> soil in to a sheet <strong>of</strong> mud and debris. Debris flows can <strong>of</strong>ten originate miles awayfrom unsuspecting persons, and approach them at a high rate <strong>of</strong> speed with little warning.Impacts <strong>of</strong> Development:As communities continue to modify the terrain and influence natural processes, it is importantto be aware <strong>of</strong> the physical properties <strong>of</strong> the underlying soils as they, along with climate, createlandslide hazards. Even with proper planning, landslides will continue to threaten the safety <strong>of</strong>people, property, and infrastructure, but without proper planning, landslide hazards will be evenmore common and more destructive. The increasing scarcity <strong>of</strong> build-able land, particularly inurban areas, increases the tendency to build on geologically marginal land. Additionally,hillside housing developments in southern <strong>California</strong> are prized for the view lots that theyprovide.Thus, although landslides are a natural occurrence, human impacts can substantially affect thepotential for landslide failures to occur. Proper planning and geotechnical engineering can beexercised to reduce the threat <strong>of</strong> safety <strong>of</strong> people, property, and infrastructure. Grading for roadconstruction and development can increase slope steepness. Grading and construction candecrease the stability <strong>of</strong> a hill slope by adding weight to the top <strong>of</strong> the slope, removing supportat the base <strong>of</strong> the slope, and increasing water content. Other human activities effectinglandslides include excavation, drainage and groundwater alterations, and changes in vegetation.Excavation and Grading:Slope excavation is common in the development <strong>of</strong> home sites or roads on sloping terrain.Grading these slopes <strong>of</strong>ten results slopes steeper than the pre-existing natural slopes. Sinceslope steepness is a major factor in landslides, these steeper slopes can be at an increased risk forlandslides. The added weight <strong>of</strong> fill placed on slopes can also result in an increased landslidehazard. Small landslides can be fairly common along roads, in either the road cut or the road fillsections. Landslides occurring below new construction sites are indicators <strong>of</strong> the potentialimpacts stemming from excavation.Alterations to Drainage and Groundwater Systems:Water flowing through or above ground is <strong>of</strong>ten the trigger <strong>of</strong> landslides. Any activity that2006 PAGE 9 - 6
Natural <strong>Hazard</strong>s <strong>Mitigation</strong> PlanCity <strong>of</strong> <strong>Glendale</strong>, <strong>California</strong>Section 9 – Landslidesincreases the amount <strong>of</strong> water flowing into landslide-prone slopes can increase landslidehazards. Broken or leaking water or sewer lines can be especially problematic, as can waterretention facilities that direct water onto slopes. However, even lawn irrigation in landslidepronelocations can result in damaging landslides. Ineffective storm water management andexcess run<strong>of</strong>f can also cause erosion and increase the risk <strong>of</strong> landslide hazards. Drainage can beaffected naturally by the geology and topography <strong>of</strong> an area. Development that results in anincrease in impervious surface impairs the ability <strong>of</strong> the land to absorb water and may redirectwater to other areas. Channels, streams, ponding, and erosion on slopes all indicate potentialslope problems.Road and driveway drains, gutters, downspouts, and other constructed drainage facilities canconcentrate and accelerate run<strong>of</strong>f flow. Ground saturation and concentrated velocity flow aremajor causes <strong>of</strong> slope problems and may trigger landslides.Changes in Vegetation:Removing vegetation from very steep slopes can increase landslide hazards. Areas thatexperience wildfire and land clearing for development may have long periods <strong>of</strong> increasedlandslide hazard. Also, certain types <strong>of</strong> non-native ground covers require extensive irrigation toremain green. As a result, clearing and replacement <strong>of</strong> native ground covers with non-nativecovers can lead to an increase in slope failures.Landslide <strong>Hazard</strong> Assessment<strong>Hazard</strong> Identification:Identifying hazardous locations is an essential step towards implementing more informedmitigation activities. Evidence <strong>of</strong> past slope failures are found throughout the mountain andfoothill regions <strong>of</strong> the City <strong>of</strong> <strong>Glendale</strong>. The crystalline rock <strong>of</strong> the San Gabriel Mountains,weakened by fracturing, shearing, and crushing along numerous fault zones, particularly nearthe range front, combined with the moderate to extremely steep slopes that have resulted fromrapid uplift <strong>of</strong> the mountains, are important elements that create the setting for the development<strong>of</strong> slope failures. Similar conditions are present in the Verdugo Mountains and the San RafaelHills, where rocks are highly weathered and slope gradients <strong>of</strong> 30 degrees or steeper arecommon.Significantly, however, areas <strong>of</strong> gross instability such as large deep-seated landslides have notbeen mapped in the <strong>Glendale</strong> area, primarily because the highly fractured crystalline rocks thatunderlie the San Gabriel and Verdugo Mountains and the San Rafael Hills rarely fail as largecohesive units. Three small landslides (Qls) <strong>of</strong> probable Holocene age have been mapped on theslopes <strong>of</strong> the Verdugo Mountains and the San Rafael Hills. Because the bedrock in these areas ishighly fractured and weathered, the slides consist <strong>of</strong> small blocks and rock fragments ratherthan large cohesive masses. These landslides are shown on Plates H-2 and H-11. Numerousother smaller landslides have also occurred in the area, but their size is too small to show on themaps that accompany this report. Large prehistoric landslides have been mapped in the SanGabriel Mountains just to the east <strong>of</strong> the city, but not in the <strong>Glendale</strong> area. The distribution <strong>of</strong>existing landslides in the <strong>Glendale</strong> area and vicinity was compiled from various publications,including Morton and Streitz, (1969), Crook et al. (1987), and Dibblee, (1989a, 1989b, 1991a,1991b, 2002).Areas <strong>of</strong> surficial instability are common along the steep slopes and canyons <strong>of</strong> the San GabrielMountains, Verdugo Mountains and San Rafael Hills. Unfortunately detailed maps showingprevious sites <strong>of</strong> surficial slope failures, such as small landslides, slumps, soil slips, and rockfallshave not been compiled or published for the <strong>Glendale</strong> area. However, an unpublishedengineering geology report records several talus rockfalls on steep slopes and roadcuts in the2006 PAGE 9 - 7
Natural <strong>Hazard</strong>s <strong>Mitigation</strong> PlanCity <strong>of</strong> <strong>Glendale</strong>, <strong>California</strong>Section 9 – LandslidesVerdugo Mountains (R. T. Frankian & Associates, 1968). The common occurrence <strong>of</strong> rockfallscan also be inferred by the abundant talus at the base <strong>of</strong> steep slopes and in canyons <strong>of</strong> the SanGabriel Mountains.The Southern <strong>California</strong> Area Mapping Project (SCAMP), a cooperative effort between the USGeological Survey (USGS) and the <strong>California</strong> Geological Survey (CGS), has produced a series <strong>of</strong>Debris-Flow Occurrence Maps, at a scale <strong>of</strong> 1:100,000, that predict in a general way areas thatwill be prone to debris flows in normally vegetated hillsides (SCAMP, 2001). The maps arebased on their studies <strong>of</strong> recent El Nino events, specifically relating the relationships betweenrainfall thresholds, terrain, and past debris flow events. Their studies indicate that in uplandareas underlain by sedimentary rock and fractured crystalline rock (such as that found in themountains <strong>of</strong> <strong>Glendale</strong>), essentially all past debris flows have occurred on slopes with gradients<strong>of</strong> 26 degrees or steeper. The mapped debris flow susceptibility areas in the San GabrielMountains include most slopes steeper than 26 degrees, but do not include the heads <strong>of</strong> thelarge alluvial fans at the base <strong>of</strong> the mountains because the flood control dams and debris basinsthat have been built in these areas are thought to be adequate to contain flows from unburnedareas.However, flows can overwhelm flood control structures during periods <strong>of</strong> extreme rainfall on arecently burned hillside. For instance, during winters <strong>of</strong> exceptional rainfall (such as 1934,1969, 1978, and 1980), debris flows caused widespread property damage and loss <strong>of</strong> life incommunities in and near the base <strong>of</strong> the San Gabriel Mountains, with areas below burnedwatersheds receiving the bulk <strong>of</strong> the damage. For example, in November 1933, there was a largefire in the Montrose-La Crescenta area that burned more than 5,000 acres. Then, on January 1,1934, intense rainfall fell on the same area that had burned. La Crescenta and <strong>Glendale</strong> receivedthe brunt <strong>of</strong> the damage. Several people died, swept away by debris-ladden flows thatovertopped the canyons in the area. Streets were clogged with debris, and several bridges werewashed out (see Plate H-9). In 1978, several canyons within burned watersheds near the<strong>Glendale</strong> area overtopped their debris basins (Davis, 1980). These canyons include ZachauCanyon located north <strong>of</strong> Sunland, Shields Canyon north <strong>of</strong> La Crescenta, and Rubio Canyonnorth <strong>of</strong> Altadena. In 1980, the Rubio basin again overflowed, partially inundating one homeand threatening several others (Davis, 1980). Therefore, if the right conditions are met, such ashigh rainfall within burned watersheds, the possibility that debris flows will overtop basins inthe <strong>Glendale</strong> area cannot be precluded.A recent detailed study <strong>of</strong> burned watersheds (including in the San Gabriel Mountains duringand after the 1997-1998 winter rains) indicate that less than half <strong>of</strong> the drainage basinsproduced debris flows, although the debris flows that did occur were most frequently inresponse to the initial heavy rainfall. In addition to rainfall and slope steepness, the studyhighlights the many other factors that contribute to the formation <strong>of</strong> post-fire debris flows,including the underlying rock type, the shape <strong>of</strong> the drainage basin, and the presence or absence<strong>of</strong> water-repellent soils. The goal <strong>of</strong> these studies is a better understanding <strong>of</strong> the processes andconditions that generate this hazard, an understanding that is needed in order for communitiesto make appropriate decisions on public safety and slope mitigation (Cannon, 2001).Vulnerability and Risk:Vulnerability assessment for landslides will assist in predicting how different types <strong>of</strong> propertyand population groups will be affected by a hazard. Data that includes specific landslide-proneand debris flow locations in the city can be used to assess the population and total value <strong>of</strong>property at risk from future landslide occurrences.The potential for slope failure is dependent on many factors and their interrelationships. Some<strong>of</strong> the most important factors include slope height, slope steepness, sheer strength, andorientation <strong>of</strong> weak layers in the underlying geologic unity, as well as pore water pressures.2006 PAGE 9 - 8
Natural <strong>Hazard</strong>s <strong>Mitigation</strong> PlanCity <strong>of</strong> <strong>Glendale</strong>, <strong>California</strong>Section 9 – LandslidesJoints and shears, which weaken the rock fabric, allow penetration <strong>of</strong> water leading to deeperweathering <strong>of</strong> the rock along with increasing the pore pressures, increasing the plasticity <strong>of</strong>weak clays, and increasing the weight <strong>of</strong> the landmass. For engineering <strong>of</strong> earth materials,these factors are combined in calculations to determine if a slope meets a minimum safetystandard. The generally accepted standard is a factor <strong>of</strong> safety <strong>of</strong> 1.5 or greater (where 1.0equilibrium, and less than 1.0 is failure).Although existing landslides are not widespread in the area, it is probable that many <strong>of</strong> thesteeper hillsides do not meet the minimum factor <strong>of</strong> safety and slope stabilization may be neededif development reaches these areas. Natural slopes, graded slopes, or graded/natural slopecombinations must meet minimum engineering standards where they impact planned homes,subdivisions, or other types <strong>of</strong> developments. Slopes adjacent to areas where the risk <strong>of</strong>economic losses from landsliding is small, such as parks and mountain roadways, are <strong>of</strong>tenallowed a lesser factor <strong>of</strong> safety.While a quantitative vulnerability assessment (an assessment that describes number <strong>of</strong> lives oramount <strong>of</strong> property exposed to the hazard <strong>of</strong> landslides) has not yet been conducted for city <strong>of</strong><strong>Glendale</strong>, there are many qualitative factors that point to potential vulnerability. Landslides canimpact major transportation arteries, blocking residents from essential services and businesses.Past landslide events have caused major property damage or significantly impacted cityresidents, and continuing to map city landslide and debris flow areas will help in preventingfuture loss.Factors included in assessing landslide risk include population and property distribution in thehazard area, the frequency <strong>of</strong> landslide or debris flow occurrences, slope steepness, soilcharacteristics, and precipitation intensity. This type <strong>of</strong> analysis could generate estimates <strong>of</strong> thedamages to the City due to a specific landslide or debris flow event. At the time <strong>of</strong> publication <strong>of</strong>this plan, data were insufficient to conduct a risk analysis and the s<strong>of</strong>tware needed to conductthis type <strong>of</strong> analysis was not available.Community Landslide IssuesWhat is Susceptible to Landslides?The City’s mountain and foothill areas are vulnerable to the types <strong>of</strong> slope instability mentionedabove. Steep-sided slopes along Verdugo Wash and other incised drainages may also be locallysusceptible to slope instability. Table 9-1 below is a general summary <strong>of</strong> the geologic conditionsin various parts <strong>of</strong> the city that provide the environment for slope instability to occur. Theseconditions usually include such factors as terrain steepness, rock or soil type, condition <strong>of</strong> therock (such as degree <strong>of</strong> fracturing and weathering), internal structures within the rock (such asbedding, foliation, faults) and the prior occurrence <strong>of</strong> slope failures. Catalysts that ultimatelyallow slope failures to occur in vulnerable terrain are most <strong>of</strong>ten water (heavy and prolongedrainfall), erosion and undercutting by streams, man-made alterations to the slope, or seismicshaking. The summary in Table 9-1 was derived from the Geologic Map (Plate H-2), and otherresources. The information in Table 9-1 was then used to prepare the Slope Instability Map for<strong>Glendale</strong> (Plate H-11).Landslides can affect utility services, transportation systems, and critical lifelines. Communitiesmay suffer immediate damages and loss <strong>of</strong> service. Disruption <strong>of</strong> infrastructure, roads, andcritical facilities may also have a long-term effect on the economy. Utilities, including potablewater, wastewater, telecommunications, natural gas, and electric power are all essential toservice community needs. Loss <strong>of</strong> electricity has the most widespread impact on other utilitiesand on the whole community. Natural gas pipes may also be at risk <strong>of</strong> breakage from landslidemovementsas small as an inch or two. Some <strong>of</strong> these issues are discussed in more detail below.2006 PAGE 9 - 9
Natural <strong>Hazard</strong>s <strong>Mitigation</strong> PlanCity <strong>of</strong> <strong>Glendale</strong>, <strong>California</strong>Section 9 – LandslidesRoads and Bridges:It is not cost-effective to mitigate all slides because <strong>of</strong> limited funds and the fact that somehistorical slides are likely to become active again even with mitigation measures. The Cityalleviates problem areas by grading slides, and by installing new drainage systems on the slopesto divert water from the landslides.This type <strong>of</strong> response activity is <strong>of</strong>ten the most cost-effective in the short-term, but is onlytemporary. Unfortunately, many property owners are unaware <strong>of</strong> slides and the dangersassociatedwith them.2006 PAGE 9 - 10
Natural <strong>Hazard</strong>s <strong>Mitigation</strong> PlanCity <strong>of</strong> <strong>Glendale</strong>, <strong>California</strong>Section 9 – LandslidesTable 9-1: General Slope Instability Potential within the City <strong>of</strong> <strong>Glendale</strong>AreaSan GabrielMountainsSan RafaelHills (north <strong>of</strong>Highway 134)Geologic ConditionsSteep to extremely steep rockslopes, most in excess <strong>of</strong> 40 degrees;Highly fractured, sheared, faulted,and crushed crystalline bedrock;Soils and loose debris in tributarydrainages;Stream terrace deposits along majordrainage channels;No known landslides in <strong>Glendale</strong>.Moderate to very steep rock slopes,most in excess <strong>of</strong> 26 degrees, manyin excess <strong>of</strong> 40 degrees;Highly fractured and weatheredcrystalline rock;Soils and loose debris in tributarydrainages and swales;Several small existing landslides.Types <strong>of</strong> PotentialSlope InstabilityMost Probable:Rockfalls, soil slips on steep slopes, soilslumps on the edges <strong>of</strong> active streamchannels, small to large debris flows.Less Probable:Large, deep-seated landslides.Most Probable:Soil slips and slumps on moderate to steepslopes and in drainage swales, small debrisflows, small slides or rockfalls, surficialsoil failures on steep man-made slopes.Less Probable:Large, deep-seated landslides.VerdugoMountainsMajor DrainageChannels –Verdugo WashValley PlainModerately steep to extremely steeprock slopes, most between 26 and 40degrees, with some slopes steeperthen 40 degrees;Highly fractured, sheared, faulted,and crushed crystalline bedrock;Soils and loose debris in tributarydrainages;A few remnant stream terracedeposits along major drainagechannels;Several small existing landslides;Rockfalls common according to R.T.Frankian & Associates (1968).Gentle to moderate sloping channelwalls with steeper channel banks(26-40 degrees) in a few isolatedareas;Poorly bedded Holocene alluviumconsisting <strong>of</strong> silt, sand and gravel,with coarse sand, gravel andboulders near the mountain front;No mapped landslides.Very gentle slopes, typically about10 degrees or less;Poorly bedded Holocene andPleistocene alluvium consisting <strong>of</strong>silt, sand and gravel;No mapped landslides.Most Probable:Soil slips and slumps on moderate to steepslopes and in drainage swales, small debrisflows, small slides or rockfalls, surficialsoil failures on steep man-made slopes.Less Probable:Large, deep-seated landslides.Slope instability generally not an issue.Slope instability generally not an issue.2006 PAGE 9 - 11
Natural <strong>Hazard</strong>s <strong>Mitigation</strong> PlanCity <strong>of</strong> <strong>Glendale</strong>, <strong>California</strong>Section 9 – LandslidesLifelines and Critical Facilities:Lifelines and critical facilities should remain accessible, if possible, during a natural hazardevent. The impact <strong>of</strong> closed transportation arteries may be increased if the closed road orbridge is critical for hospitals and other emergency facilities. Therefore, inspection and repair <strong>of</strong>critical transportation facilities and routes is essential and should receive high priority. Losses <strong>of</strong>power and phone service are also potential consequences <strong>of</strong> landslide events. Due to heavyrains, soil erosion in hillside areas can be accelerated, resulting in loss <strong>of</strong> soil support beneathhigh voltage transmission towers in hillsides and remote areas. Flood events can also causelandslides, which can have serious impacts on gas lines that are located in vulnerable soils.Landslide <strong>Mitigation</strong> Activities:Landslide mitigation activities include current mitigation programs and activities that are beingimplemented by local or city organizations.All proposed development projects require a site-specific geotechnical evaluation <strong>of</strong> any slopesthat may impact the future use <strong>of</strong> the property. This includes existing slopes that are to remain,and any proposed graded slopes. The investigation typically includes borings to collectgeologic data and soil samples, laboratory testing to determine soil strength parameters, andengineering calculations. Numerous soil-engineering methods are available for stabilizingslopes that pose a threat to development. These methods include designed buttresses (replacingthe weak portion <strong>of</strong> the slope with engineered fill); reducing the height <strong>of</strong> the slope; designingthe slope at a flatter gradient; and adding reinforcements such as soil cement or layers <strong>of</strong>geogrid (a tough polymeric net-like material that is placed between the horizontal layers <strong>of</strong> fill).Most slope stabilization methods include a subdrain system to remove excessive ground waterfrom the slope area. If it is not feasible to mitigate the slope stability hazard, building setbacksare typically imposed.For debris flows, assessment <strong>of</strong> this hazard for individual sites should focus on structureslocated or planned in vulnerable positions. This generally includes canyon areas; at the toes <strong>of</strong>steep, natural slopes; and at the mouth <strong>of</strong> small to large drainage channels. <strong>Mitigation</strong> <strong>of</strong> soilslips, earthflows, and debris flows is usually directed at containment (debris basins), or diversion(impact walls, deflection walls, diversion channels, and debris fences). A system <strong>of</strong> baffles maybe added upstream to slow the velocity <strong>of</strong> a potential debris flow. Other methods includeremoval <strong>of</strong> the source material, placing subdrains in the source area to prevent pore waterpressure buildup, or avoidance by restricting building to areas outside <strong>of</strong> the potential debrisflow path.There are numerous methods for mitigating rock falls. Choosing the best method depends onthe geological conditions (i.e., slope height, steepness, fracture spacing, bedding orientation),safety, type and cost <strong>of</strong> construction repair, and aesthetics. A commonly used method is toregrade the slope. This ranges from locally trimming hazardous overhangs, to completelyreconfiguring the slope to a more stable condition, possibly with the addition <strong>of</strong> benches tocatch small rocks. Another group <strong>of</strong> methods focuses on holding the fractured rock in place bydraping the slope with wire mesh, or by installing tensioned rock bolts, tie-back walls, or evenretaining walls. Shotcrete is <strong>of</strong>ten used on the slope face to prevent raveling in highly fracturedrock, but its primary purpose is to <strong>of</strong>fer surface protection only. A third type <strong>of</strong> mitigationincludes catchment devices at the toe <strong>of</strong> the slope, such as ditches, walls, or combinations <strong>of</strong>both. Designing the width <strong>of</strong> the catchment structure requires analysis <strong>of</strong> how the rock will fall.For instance, the slope gradient and roughness <strong>of</strong> the slope determines if rocks will fall, bounce,or roll to the bottom. Rock slope stabilization may also include the addition <strong>of</strong> drains in orderto reduce water pressure within the slope (Wyllie and Norrish, 1996).There are a number <strong>of</strong> options for management <strong>of</strong> potential slope instability in developedhillsides.2006 PAGE 9 - 12
Natural <strong>Hazard</strong>s <strong>Mitigation</strong> PlanCity <strong>of</strong> <strong>Glendale</strong>, <strong>California</strong>Section 9 – Landslides1. Complete a detailed survey and assessment <strong>of</strong> existing developments in areasrecognized to be vulnerable to potential slope failures (for instance, the VerdugoMountains, the San Rafael Hills, and at the base <strong>of</strong> the San Gabriel Mountains).2. Protect existing development and population where appropriate by physical controlssuch as drainage, slope-geometry modification, protective barriers, and retainingstructures.3. Implement monitoring or warning systems. For instance, in the San Francisco Bayarea, the USGS, in cooperation with the National Weather Service, operated a systemfor real-time warnings for storm-related slope failures (Keefer et al., 1987). Using acombination <strong>of</strong> tracking storm systems, measuring actual rainfall with a network <strong>of</strong> raingauges, and comparing thresholds for the initiation <strong>of</strong> debris flows, they were able toissue Flash Flood/Debris Watches during the most intense storms (Wilson, 1997).This would be especially valuable for developments adjacent to burned watersheds.4. Post warning signs in areas <strong>of</strong> potential slope instability5. Encourage homeowners to use landscaping methods that help stabilize the hillsides.6. Incorporate recommendations for potential slope instability into geologic and soilengineering reports for additions and new grading.7. Educate the public about slope stability, including the importance <strong>of</strong> maintainingdrainage devices. USGS Fact Sheet FS-071-00 (May, 2000) and the CGS Note 33(November, 2001) provide public information on landslide and mudslide hazards. Theseare available on the internet (see Appendices A and B).Landslide <strong>Mitigation</strong> Action ItemsThe landslide mitigation action items below provide direction on specific activities that the City,organizations, and residents <strong>of</strong> <strong>Glendale</strong> can undertake to reduce risk and prevent loss fromlandslide events. Each action item is followed by ideas for implementation, which can be usedby the steering committee and local decision makers in pursuing strategies for implementation.Short Term - Landslide #l:Action Item: Improve knowledge <strong>of</strong> landslide hazard areas and understanding <strong>of</strong> vulnerabilityand risk to life and property in hazard-prone areas.2006 PAGE 9 - 13
Natural <strong>Hazard</strong>s <strong>Mitigation</strong> PlanCity <strong>of</strong> <strong>Glendale</strong>, <strong>California</strong>Section 9 – LandslidesIdeas for Implementation:♦ Update the landslide map for the city <strong>of</strong> <strong>Glendale</strong> to show areas where rockfalls,debris flows and surficial mass wasting events are reported, especially during wetwinters.♦ Develop public information to emphasize economic risk when building onpotential or historical landslide areas.Coordinating Organization:Timeline:Plan Goals Addressed:Constraints:<strong>Hazard</strong> <strong>Mitigation</strong> Advisory Committee1 -2 YearsProtect Life and PropertyPending Funding and Available PersonnelShort Term - Landslide #2:Action Item: Encourage construction and subdivision design that can be applied to steepslopes to reduce the potential adverse impacts from development.Ideas for Implementation:♦Increase communication and coordination between the City’s Departments.Coordinating Organization:Timeline:Plan Goals Addressed:Constraints:<strong>Hazard</strong> <strong>Mitigation</strong> Advisory Committee1 – 2 YearsIncrease awareness <strong>of</strong> mitigation issues through thecoordination <strong>of</strong> all City resources and departments.Pending Funding and Available PersonnelShort Term - Landslide #3:Action Item: Identify safe evacuation routes in high-risk debris flow and landslide areas.Ideas for Implementation:♦ Identify potential debris removal resources.♦ Increase participation in regional committee planning for emergencytransportation routes.♦ Identify and publicize information regarding emergency transportation routes.Coordinating Organization: Public Works, EngineeringTimeline:1 – 3 YearsPlan Goals Addr essed: Protection <strong>of</strong> Life and more efficient response <strong>of</strong>emergency personnel.Constraints:Pending Funding and AvailablePersonnel2006 PAGE 9 - 14
Natural <strong>Hazard</strong>s <strong>Mitigation</strong> PlanCity <strong>of</strong> <strong>Glendale</strong>, <strong>California</strong>Section 9 – LandslidesLong Term - Landslide #l:Action Item: Review local ordinances regarding building and development in landslide proneareas.Ideas for Implementation:♦ Create committee <strong>of</strong> local stakeholders to study issue and make recommendationsto staff.Coordinating Organization:Timeline:Plan Goals Addressed:Constraints:Building and Safety3 – 5 YearsProtect Life and PropertyPending Funding and Available PersonnelLong Term - Landslide #2:Action Item: Limit activities in identified potential and historical landslide areas throughregulation and public outreach.Ideas for Implementation:♦ Analyze existing regulations regarding development in landslide prone areas.♦ Identify existing mechanisms for public outreach / develop new methods <strong>of</strong>outreach.Coordinating Organization:Timeline:Plan Goals Addressed:Constraints:<strong>Hazard</strong> <strong>Mitigation</strong> Advisory Committee, Public AffairsDepartment3 – 5 YearsProtect Life and PropertyPending Funding and Available PersonnelLandslide Resource DirectoryCounty Resources:Los Angeles County Department <strong>of</strong> Public Works900 S. Freemont AvenueAlhambra, CA 91803Ph: 626-458-5100<strong>State</strong> Resources:<strong>California</strong> Department <strong>of</strong> Conservation: Southern <strong>California</strong> Regional Office655 S. Hope Street, #700Los Angeles, CA 90017-2321Ph: 213-239-0878Fax: 213-239-0984<strong>California</strong> Geological Survey801 K Street2006 PAGE 9 - 15
Natural <strong>Hazard</strong>s <strong>Mitigation</strong> PlanCity <strong>of</strong> <strong>Glendale</strong>, <strong>California</strong>Section 9 – LandslidesSacramento, CA 95814Ph: 916-445-1825Fax: 916-445-5718<strong>California</strong> Division <strong>of</strong> Forestry1416 9 th StreetPO Box 944246Sacramento, CA 94244-2460Ph: 916-653-5123<strong>California</strong> Department <strong>of</strong> Water Resources1416 9 th StreetSacramento, CA 95814Ph: 916-653-6192Governor’s Office <strong>of</strong> Emergency Services (OES)P.O. Box 419047Rancho Cordova, CA 95741-9047Ph: 916-845-8911Fax: 916-845-8910<strong>California</strong> Department <strong>of</strong> Transportation (Cal Trans)120 S. Spring StreetLos Angeles, CA 90012Ph: 213-897-3656F ederal Resources and Programs:Federal Emergency Management Agency (FEMA) – Region IX1111 Broadway, Suite 1200Oakland, CA 94607Ph: 510-627-7100Fax: 510-627-7112Natural Resource Conservation Service (NRCS)PO Box 2890Washington, DC 20013Ph: 202-690-2621US Geological Survey, National Landslide Information Center345 Middlefield RoadMenlo Park, CA 94025Ph: 650-853-83002006 PAGE 9 - 16
Natural <strong>Hazard</strong>s <strong>Mitigation</strong> PlanCity <strong>of</strong> <strong>Glendale</strong>, <strong>California</strong>Section 9 – LandslidesPublications:Olshansky, Robert B., Planning for Hillside Development (1996) American PlanningAssociation.This document describes the history, purpose, and functions <strong>of</strong> hillside development andregulation and the role <strong>of</strong> planning, and provides excerpts from hillside plans, ordinances, andguidelines from communities throughout the US.Olshansky, Robert B. & Rogers, J. David, Unstable Ground: Landslide Policy in theUnited <strong>State</strong>s (1987) Ecology Law Quarterly.This is about the history and policy <strong>of</strong> landslide mitigation in the US.Public Assistance Debris Management Guide (July 2000) Federal EmergencyManagement Agency.The Debris Management Guide was developed to assist local <strong>of</strong>ficials in planning, mobilizing,organizing, and controlling large-scale debris clearance, removal, and disposal operations.Debris management is generally associated with post-disaster recovery. While it should becompliant with local and city emergency operations plans, developing strategies to ensurestrong debris management is a way to integrate debris management within mitigation activities.The Guide is available in hard copy or on the FEMA website.USGS Landslide Program Brochure. National Landslide Information Center (NLIC),United <strong>State</strong>s Geologic Survey.The brochure provides good, general information in simple terminology on the importance <strong>of</strong>landslide studies and a list <strong>of</strong> databases, outreach, and exhibits maintained by the NLLC. Thebrochure also includes information on the types and causes <strong>of</strong> landslides, rock falls, and earthflows.2006 PAGE 9 - 17
Natural <strong>Hazard</strong>s <strong>Mitigation</strong> PlanCity <strong>of</strong> <strong>Glendale</strong>, <strong>California</strong>APPENDIX A:Appendix A – Master Resource DirectoryMASTER RESOURCEDIRECTORYThe Resource Directory provides contact information for local, regional, <strong>State</strong>, and Federalagencies and organizations that are currently involved in hazard mitigation activities. The<strong>Hazard</strong> <strong>Mitigation</strong> Advisory Committee may refer to the organizations on the following pagesfor resources and technical assistance. The Resource Directory provides a foundation forpotential partners in action item implementation.The <strong>Hazard</strong> <strong>Mitigation</strong> Advisory Committee will maintain and update this master resourcedirectory. This directory may be used by various community members interested in hazardmitigation information and projects.American Public Works AssociationLevel: National <strong>Hazard</strong>: Multi http://www.apwa.net2345 Grand Boulevard Suite 500Kansas City, MO 64108-2641 Ph: 800-848-APWA Fax: 816-472-1610Notes: The American Public Works Association is an international educational andpr<strong>of</strong>essional association <strong>of</strong> public agencies, private sector companies, and individuals dedicatedto providing high quality public works goods and services.Association <strong>of</strong> <strong>State</strong> Floodplain ManagersLevel: Federal <strong>Hazard</strong>: Flood www.floods.org2809 Fish Hatchery RoadMadison, WI 53713 Ph: 608-274-0123 Fax: 608-274-0696Notes: The Association <strong>of</strong> <strong>State</strong> Floodplain Managers is an organization <strong>of</strong> pr<strong>of</strong>essionalsinvolved in floodplain management, flood hazard mitigation, the National Flood InsuranceProgram, and flood preparedness, warning and recoveryBuilding Seismic Safety Council (BSSC)Level: National <strong>Hazard</strong>: Earthquake www.bssconline.org1090 Vermont Avenue, NW Suite 700Washington, DC 20005 Ph: 202-289-7800 Fax: 202-289-109Notes: The Building Seismic Safety Council (BSSC) develops and promotes buildingearthquake risk mitigation regulatory provisions for the nation.2006 PAGE A - 1
Natural <strong>Hazard</strong>s <strong>Mitigation</strong> PlanCity <strong>of</strong> <strong>Glendale</strong>, <strong>California</strong>Appendix A – Master Resource Directory<strong>California</strong> Department <strong>of</strong> Transportation (CalTrans)Level: <strong>State</strong> <strong>Hazard</strong>: Multi http://www.dot.ca.gov/120 S. Spring StreetLos Angeles, CA 90012 Ph: 213-897-3656 Fax:Notes: CalTrans is responsible for the design, construction, maintenance, and operation <strong>of</strong> the<strong>California</strong> <strong>State</strong> Highway System, as well as that portion <strong>of</strong> the Interstate Highway systemwithin the <strong>State</strong>'s boundaries. Alone and in partnership with Amtrak, Caltrans is also involvedin the support <strong>of</strong> intercity passenger rail service in <strong>California</strong>.<strong>California</strong> Resources AgencyLevel: <strong>State</strong> <strong>Hazard</strong>: Multi http://resources.ca.gov/1416 Ninth Street Suite 1311Sacramento, CA 95814 Ph: 916-653-5656 Fax:Notes: The <strong>California</strong> Resources Agency restores, protects and manages the state's natural,historical and cultural resources for current and future generations using solutions based onscience, collaboration and respect for all the communities and interests involved.<strong>California</strong> Division <strong>of</strong> Forestry and Fire Protection (CDF)Level: <strong>State</strong> <strong>Hazard</strong>: Multi http://www.fire.ca.gov/php/index.php2524 Mullberry StreetRiverside, CA 92501 Ph: 951-782-4140 Fax:Notes: The <strong>California</strong> Department <strong>of</strong> Forestry and Fire Protection protects over 31 millionacres <strong>of</strong> <strong>California</strong>'s privately owned wildlands. CDF emphasizes the management andprotection <strong>of</strong> <strong>California</strong>'s natural resources.<strong>California</strong> Geological Survey (CGS)Level: <strong>State</strong> <strong>Hazard</strong>: Multi http://www.consrv.ca.gov/CGS/801 K Street MS 12-30Sacramento, CA 95814 Ph: 916-445-1825 Fax: 916-445-5718Notes: The <strong>California</strong> Geological Survey develops and disseminates technical information andadvice on <strong>California</strong>’s geology, geologic hazards, and mineral resources.<strong>California</strong> Environmental Resources Evaluation System (CERES)Level: <strong>State</strong> <strong>Hazard</strong>: Multi http://ceres.ca.gov/900 N Street Suite 250Sacramento, CA 95814 Ph: 916-653-2238 Fax:Notes: CERES is an excellent website for access to environmental information and links toother websites.2006 PAGE A - 2
Natural <strong>Hazard</strong>s <strong>Mitigation</strong> PlanCity <strong>of</strong> <strong>Glendale</strong>, <strong>California</strong>Appendix A – Master Resource Directory<strong>California</strong> Department <strong>of</strong> Water Resources (DWR)Level: <strong>State</strong> <strong>Hazard</strong>: Flood http://wwwdwr.water.ca.gov1416 9th StreetSacramento, CA 95814 Ph: 916-653-6192 Fax:Notes: The Department <strong>of</strong> Water Resources manages the water resources <strong>of</strong> <strong>California</strong> incooperation with other agencies, to benefit the <strong>State</strong>'s people, and to protect, restore, andenhance the natural and human environments.<strong>California</strong> Department <strong>of</strong> Conservation: Southern <strong>California</strong> Regional OfficeLevel: <strong>State</strong> <strong>Hazard</strong>: Multi www.consrv.ca.gov655 S. Hope Street #700Los Angeles, CA 90017-2321 Ph: 213-239-0878 Fax: 213-239-0984Notes: The Department <strong>of</strong> Conservation provides services and information that promoteenvironmental health, economic vitality, informed land-use decisions and sound management<strong>of</strong> our <strong>State</strong>'s natural resources.<strong>California</strong> Planner’s Information NetworkLevel: <strong>State</strong> <strong>Hazard</strong>: Multi www.calpin.ca.govNotes: The Governor's Office <strong>of</strong> Planning and Research (OPR) publishes basic information onlocal planning agencies, known as the <strong>California</strong> Planners' Book <strong>of</strong> Lists. This local planninginformation is available on-line with new search capabilities and up-to-the- minute updates.EPA, Region 9Ph:Fax:Level: Regional <strong>Hazard</strong>: Multi http://www.epa.gov/region0975 Hawthorne StreetSan Francisco, CA 94105 Ph: 415-947-8000 Fax: 415-947-3553Notes: The mission <strong>of</strong> the U.S. Environmental Protection Agency is to protect human healthand to safeguard the natural environment through the themes <strong>of</strong> air and global climatechange, water, land, communities and ecosystems, and compliance and environmentalstewardship.Federal Emergency Management Agency, Region IXLevel: Federal <strong>Hazard</strong>: Multi www.fema.gov1111 Broadway Suite 1200Oakland, CA 94607 Ph: 510-627-7100 Fax: 510-627-7112Notes: The Federal Emergency Management Agency is tasked with responding to, planningfor, recovering from and mitigating against disasters.2006 PAGE A - 3
Natural <strong>Hazard</strong>s <strong>Mitigation</strong> PlanCity <strong>of</strong> <strong>Glendale</strong>, <strong>California</strong>Appendix A – Master Resource DirectoryFederal Emergency Management Agency, <strong>Mitigation</strong> DivisionLevel: Federal <strong>Hazard</strong>: Multi www.fema.gov/fima/planhowto.shtm500 C Street, S.W.Washington, D.C. 20472 Ph: 202-566-1600 Fax:Notes: The <strong>Mitigation</strong> Division manages the National Flood Insurance Program and overseesFEMA's mitigation programs. It has a number <strong>of</strong> programs and activities that provide forcitizens’ Protection, with flood insurance; Prevention, with mitigation measures; andPartnerships, with communities throughout the country.Floodplain Management AssociationLevel: Federal <strong>Hazard</strong>: Flood www.floodplain.orgP.O. Box 712080Santee, CA 92071-2081 Ph: 619-204-4380 Fax:Notes: The Floodplain Management Association is a non-pr<strong>of</strong>it educational associationestablished in 1990 to promote the reduction <strong>of</strong> flood losses and to encourage the protectionand enhancement <strong>of</strong> natural floodplain values. Members include representatives from Federal,<strong>State</strong> and local government agencies, as well as private firms.Governor’s Office <strong>of</strong> Emergency Services (OES)Level: <strong>State</strong> <strong>Hazard</strong>: Multi www.oes.ca.govP.O. Box 419047Rancho Cordova, CA 95741-9047 Ph: 916 845- 8911 Fax: 916 845- 8910Notes: The Governor's Office <strong>of</strong> Emergency Services coordinates overall <strong>State</strong> agencyresponse to major disasters in support <strong>of</strong> local government. The <strong>of</strong>fice is responsible forassuring the state's readiness to respond to and recover from natural, man-made, and warcausedemergencies, and for assisting local governments in their emergency preparedness,response and recovery efforts.Landslide <strong>Hazard</strong>s Program, USGSLevel: Federal <strong>Hazard</strong>: Landslide http://landslides.usgs.gov/index.html12201 Sunrise Valley Drive MS 906Reston, VA 20192 Ph: 703-648- 4000 Fax:Notes: Their website provides good information on available programs and resources thataddress landslides. The website includes information on the National Landslide <strong>Hazard</strong>sProgram Information Center, a bibliography, publications, and current projects. USGSscientists are working to reduce long-term losses and casualties from landslide hazardsthrough better understanding <strong>of</strong> the causes and mechanisms <strong>of</strong> ground failure both nationallyand worldwide.2006 PAGE A - 4
Natural <strong>Hazard</strong>s <strong>Mitigation</strong> PlanCity <strong>of</strong> <strong>Glendale</strong>, <strong>California</strong>Appendix A – Master Resource DirectoryLos Angeles County Economic Development CorporationLevel: Regional <strong>Hazard</strong>: Multi www.laedc.org444 S. Flower Street 34th FloorLos Angeles, CA 90071 Ph: 213-622-4300 Fax: 213-622-7100Notes: The LAEDC is a private, non-pr<strong>of</strong>it 501(c)3 organization established in 1981 with themission to attract, retain and grow businesses and jobs in the Los Angeles region. TheLAEDC is widely relied upon for its Southern <strong>California</strong> Economic Forecasts and IndustryTrend Reports. Lead by the renowned Jack Kyser (Sr. Vice President, Chief Economist), histeam <strong>of</strong> researchers produces numerous publications to help business, media and governmentnavigate the LA region's diverse economy.Los Angeles County Public Works DepartmentLevel: County <strong>Hazard</strong>: Multi http://ladpw.org900 S. Fremont AvenueAlhambra, CA 91803 Ph: 626-458-5100 Fax:Notes: The Los Angeles County Department <strong>of</strong> Public Works protects property andpromotes public safety through Flood Control, Water Conservation, Road Maintenance,Bridges, Buses and Bicycle Trails, Building and Safety, Land Development, Waterworks,Sewers, Engineering, Capital Projects and Airports.National Wildland/Urban Interface Fire ProgramLevel: Federal <strong>Hazard</strong>: Wildfire www.firewise.org/1 Batterymarch ParkQuincy, MA 02169-7471 Ph: 617-770-3000 Fax: 617 770-0700Notes: Firewise maintains a <strong>Web</strong>site designed for people who live in wildfire- prone areas, butit also can be <strong>of</strong> use to local planners and decision makers. The site <strong>of</strong>fers online wildfireprotection information and checklists, as well as listings <strong>of</strong> other publications, videos, andconferences.National Resources Conservation ServiceLevel: Federal <strong>Hazard</strong>: Multi http://www.nrcs.usda.gov/14th and Independence Avenue, SW Room 5105-AWashington, DC 20250 Ph: 202-720-7246 Fax: 202-720-7690Notes: NRCS assists private property owners to conserve their soil, water, and other naturalresources by delivering technical assistance based on sound science and suited to a customer'sspecific needs. Cost shares and financial incentives are available in some cases.2006 PAGE A - 5
Natural <strong>Hazard</strong>s <strong>Mitigation</strong> PlanCity <strong>of</strong> <strong>Glendale</strong>, <strong>California</strong>Appendix A – Master Resource DirectoryNational Interagency Fire Center (NIFC)Level: Federal <strong>Hazard</strong>: Wildfire www.nifc.gov3833 S. Development AvenueBoise, Idaho 83705-5354 Ph: 208-387- 5512 Fax:Notes: The NIFC is the nation’s support center for wildland firefighting. Seven federalagencies work together to coordinate and support wildland fire and disaster operations.National Fire Protection Association (NFPA)Level: National <strong>Hazard</strong>: Wildfire http://www.nfpa.org/1 Batterymarch ParkQuincy, MA 02169-7471 Ph: 617-770-3000 Fax: 617 770-0700Notes: The mission <strong>of</strong> the international, non-pr<strong>of</strong>it NFPA is to reduce the worldwide burden<strong>of</strong> fire and other hazards on the quality <strong>of</strong> life by providing and advocating scientifically basedconsensus codes and standards, research, training and education.National Floodplain Insurance Program (NFIP)Level: Federal <strong>Hazard</strong>: Flood www.fema.gov/nfip/500 C Street, S.W.Washington, D.C. 20472 Ph: 202-566-1600 Fax:Notes: The <strong>Mitigation</strong> Division manages the National Flood Insurance Program and overseesFEMA's mitigation programs. It has <strong>of</strong> a number <strong>of</strong> programs and activities, including floodinsurance for private property owners, mitigation measures to encourage prevention <strong>of</strong> flooddisasters, and partnerships with communities throughout the country.National Oceanic /Atmospheric AdministrationLevel: Federal <strong>Hazard</strong>: Multi www.noaa.gov14th Street & Constitution Avenue, NW Room 6217Washington, DC 20230 Ph: 202-482-6090 Fax: 202-482-3154Notes: NOAA's historical role has been to predict environmental changes, protect life andproperty, provide decision makers with reliable scientific information, and foster globalenvironmental stewardship.National Weather Service, Office <strong>of</strong> Hydrologic DevelopmentLevel: Federal <strong>Hazard</strong>: Flood http://www.nws.noaa.gov/1325 East West HighwaySilver Spring, MD 20910 Ph: 301-713-1658 Fax: 301-713-0963Notes: The Office <strong>of</strong> Hydrologic Development (OHD) enhances National Weather Serviceproducts by infusing new hydrologic science, developing hydrologic techniques foroperational use, managing hydrologic development by NWS field <strong>of</strong>fices, and providingadvanced hydrologic products to meet needs identified by NWS customers.2006 PAGE A - 6
Natural <strong>Hazard</strong>s <strong>Mitigation</strong> PlanCity <strong>of</strong> <strong>Glendale</strong>, <strong>California</strong>Appendix A – Master Resource DirectoryNational Weather ServiceLevel: Federal <strong>Hazard</strong>: Multi http://www.wrh.noaa.gov/lox/520 North Elevar StreetOxnard, CA 93030 Ph: 805-988-6610 Fax:Notes: The National Weather Service is responsible for providing weather service to thenation. It is charged with the responsibility <strong>of</strong> observing and reporting the weather and withissuing forecasts and warnings <strong>of</strong> weather and floods in the interest <strong>of</strong> national safety andeconomy. Briefly, the priorities for service to the nation are: 1) protection <strong>of</strong> life, 2) protection<strong>of</strong> property, and 3) promotion <strong>of</strong> the nation's welfare and economy.Sanitation Districts <strong>of</strong> Los Angeles CountyLevel: County <strong>Hazard</strong>: Flood http://www.lacsd.org/1955 Workman Mill RoadWhittier, CA 90607 Ph: 562-908-4288 x2301 Fax:Notes: The Sanitation Districts provide wastewater and solid waste management for over halfthe population <strong>of</strong> Los Angeles County and turn waste products into resources such asreclaimed water, energy, and recyclable materials.Santa Monica Mountains ConservancyLevel: Regional <strong>Hazard</strong>: Multi http://smmc.ca.gov/570 West Avenue Twenty-Six Suite 100Los Angeles, CA 90065 Ph: 323-221-8900 Fax: 323-221-9001Notes: The Santa Monica Mountains Conservancy helps to preserve over 55,000 acres <strong>of</strong>parkland in both wilderness and urban settings, and has improved more than 114 publicrecreational facilities throughout Southern <strong>California</strong>.South Coast Air Quality Management District (AQMD)Level: Regional <strong>Hazard</strong>: Multi http://www.aqmd.gov/21865 Copley DriveDiamond Bar, CA 91765 Ph: 800-CUT-SMOG Fax: 909-326-2000Notes: AQMD is a regional government agency that seeks to achieve and maintain healthfulair quality through a comprehensive program <strong>of</strong> research, regulations, enforcement, andcommunication. The AQMD covers Los Angeles and Orange Counties, and parts <strong>of</strong> Riversideand San Bernardino Counties.2006 PAGE A - 7
Natural <strong>Hazard</strong>s <strong>Mitigation</strong> PlanCity <strong>of</strong> <strong>Glendale</strong>, <strong>California</strong>Appendix A – Master Resource DirectorySouthern <strong>California</strong> Earthquake Center (SCEC)Level: Regional <strong>Hazard</strong>: Earthquake http://www.scec.org/3651 Trousdale Parkway Suite 169Los Angeles, CA 90089-0742 Ph: 213-740-5843 Fax: 213-740-0011Notes: The Southern <strong>California</strong> Earthquake Center (SCEC) gathers new information aboutearthquakes in southern <strong>California</strong>, integrates this information into a comprehensive andpredictive understanding <strong>of</strong> earthquake phenomena, and communicates this understanding toend-users and the general public in order to increase earthquake awareness, reduce economiclosses, and save lives.Southern <strong>California</strong> Association <strong>of</strong> Governments (SCAG)Level: Regional <strong>Hazard</strong>: Multi http://www.scag.ca.gov/818 W. Seventh Street 12th FloorLos Angeles, CA 90017 Ph: 213-236-1800 Fax: 213-236-1825Notes: The Southern <strong>California</strong> Association <strong>of</strong> Governments functions as the MetropolitanPlanning Organization for six counties: Los Angeles, Orange, San Bernardino, Riverside,Ventura and Imperial. As the designated Metropolitan Planning Organization, theAssociation <strong>of</strong> Governments is mandated by the Federal government to research and draw upplans for transportation, growth management, hazardous waste management, and air quality.<strong>State</strong> Fire Marshal (SFM)Level: <strong>State</strong> <strong>Hazard</strong>: Wildfire http://osfm.fire.ca.gov1131 "S" StreetSacramento, CA 95814 Ph: 916-445-8200 Fax: 916-445-8509Notes: The Office <strong>of</strong> the <strong>State</strong> Fire Marshal (SFM) supports the mission <strong>of</strong> the <strong>California</strong>Department <strong>of</strong> Forestry and Fire Protection (CDF) by focusing on fire prevention. SFMregulates buildings in which people live, controls substances which may cause injuries, deathand destruction by fire; provides statewide direction for fire prevention within wildland areas;regulates hazardous liquid pipelines; reviews regulations and building standards; and trainsand educates in fire protection methods and responsibilities.The Community Rating System (CRS)Level: Federal <strong>Hazard</strong>: Flood http://www.fema.gov/nfip/crs.shtm500 C Street, S.W.Washington, D.C. 20472 Ph: 202-566-1600 Fax:Notes: The Community Rating System (CRS) recognizes community floodplain managementefforts that go beyond the minimum requirements <strong>of</strong> the NFIP. Property owners within theCounty would receive reduced NFIP flood insurance premiums if the County implementsfloodplain management practices that qualify it for a CRS rating. For further information onthe CRS, visit FEMA’s website.2006 PAGE A - 8
Natural <strong>Hazard</strong>s <strong>Mitigation</strong> PlanCity <strong>of</strong> <strong>Glendale</strong>, <strong>California</strong>Appendix A – Master Resource DirectoryUnited <strong>State</strong>s Geological Survey (USGS)Level: Federal <strong>Hazard</strong>: Multi http://www.usgs.gov/345 Middlefield RoadMenlo Park, CA 94025 Ph: 650-853-8300 Fax:Notes: The USGS provides reliable scientific information to describe and understand theEarth; minimize loss <strong>of</strong> life and property from natural disasters; manage water, biological,energy, and mineral resources; and enhance and protect our quality <strong>of</strong> life.US Army Corps <strong>of</strong> Engineers, Los Angeles DistrictLevel: Federal <strong>Hazard</strong>: Multi http://www.scag.ca.gov/P.O. Box 532711Los Angeles, CA 90053- 2325 Ph: 213-452- 3908 Fax:Notes: The United <strong>State</strong>s Army Corps <strong>of</strong> Engineers works in engineering and environmentalmatters. A workforce <strong>of</strong> biologists, engineers, geologists, hydrologists, natural resourcemanagers and other pr<strong>of</strong>essionals provides engineering services to the nation includingplanning, designing, building and operating water resources and other civil works projects.USDA Forest ServiceLevel: Federal <strong>Hazard</strong>: Wildfire http://www.fs.fed.us1400 Independence Ave. SWWashington, D.C. 20250-0002 Ph: 202-205-8333 Fax:Notes: The Forest Service is an agency <strong>of</strong> the U.S. Department <strong>of</strong> Agriculture. The ForestService manages public lands in national forests and grasslands.USGS Water ResourcesLevel: Federal <strong>Hazard</strong>: Multi http://ca.water.usgs.gov/6000 J Street Placer HallSacramento, CA 95819-6129 Ph: 916-278-3000 Fax: 916-278-3070Notes: The USGS Water Resources’ mission is to provide water information that benefits theNation's citizens; this information is presented in the form <strong>of</strong> publications, data, maps, andapplications s<strong>of</strong>tware.Western <strong>State</strong>s Seismic Policy Council (WSSPC)Level: Regional <strong>Hazard</strong>: Earthquake www.wsspc.org/home.html1644 Emerson Street Suite 22Palo Alto, CA 94301 Ph: 650-330-1101 Fax: 650-330-1973Notes: WSSPC is a regional earthquake consortium funded mainly by FEMA. Its website is agreat resource, with information clearly categorized - from policy to engineering to education.U.S. Department <strong>of</strong> Homeland Security (DHS)Level: Federal <strong>Hazard</strong>: Multi http://www.dhs.gov/dhspublic/index.jsp2006 PAGE A - 9
Natural <strong>Hazard</strong>s <strong>Mitigation</strong> PlanCity <strong>of</strong> <strong>Glendale</strong>, <strong>California</strong>Appendix A – Master Resource DirectoryWashington, D.C. 20528 Ph: 202-282-8000 Fax:Notes: In the event <strong>of</strong> a terrorist attack, natural disaster or other large-scale emergency, theDHS assumes primary responsibility for ensuring that emergency response pr<strong>of</strong>essionals areprepared for any situation. This entails providing a coordinated, comprehensive federalresponse to any large-scale crisis and mounting a swift and effective recovery effort. DHSalso prioritizes the important issue <strong>of</strong> citizen preparedness. Educating America's families onhow best to prepare their homes for a disaster and tips for citizens on how to respond in acrisis will be given special attention at DHS.Los Angeles County Office <strong>of</strong> Emergency Management (OEM)Level: Regional <strong>Hazard</strong>: Multi http://lacoa.org/Ph: 323-980-2260Notes: The OEM was established by County Code with responsibility for organizing anddirecting the preparedness efforts <strong>of</strong> the Emergency Management Organization <strong>of</strong> LosAngeles County. OEM is the day-to-day Los Angeles County Operational Area coordinatorfor the entire geographic area <strong>of</strong> the county.Los Angeles County Department <strong>of</strong> Public Health ServicesLevel: Local <strong>Hazard</strong>: Multi http://lapublichealth.org/313 North Figueroa StreetFax:Los Angeles, CA 90012 Ph: 800-427-8700 Fax:Notes: Their mission is to protect and improve the health <strong>of</strong> all Angelenos. This meansproviding you and your family with protection from the basic threats to public health such ascommunicable disease outbreaks, toxic exposures, and preventable injury, as well as workingto prevent chronic diseases such as heart disease, cancer, and diabetes.U.S Census BureauLevel: Federal <strong>Hazard</strong>: Multi http://www.census.gov/15350 Sherman Way Suite 300Van Nuys, CA 91406-4224 Ph: 800-992-3530 Fax: 818-904-6427Notes: Offers many statistics, some <strong>of</strong> which are available by metropolitan statistical area orby county. The Census Bureau publications collection also includes many current andhistorical censuses on population and housing. Older census data, which present datadescribing the people and the economy <strong>of</strong> each state and county from 1790 to 1960, are alsoavailable.2006 PAGE A - 10
Natural <strong>Hazard</strong>s <strong>Mitigation</strong> PlanCity <strong>of</strong> <strong>Glendale</strong>, <strong>California</strong>Appendix A – Master Resource DirectoryMetropolitan Water District <strong>of</strong> Southern <strong>California</strong> (MWD)Level: Regional <strong>Hazard</strong>: Multi http://www.mwdh2o.com/700 North Alameda StreetLos Angeles, CA 90012-2944 Ph: 213-217-6000 Fax:Notes: The MWD is a consortium <strong>of</strong> 26 cities, including <strong>Glendale</strong>, and water districts thatprovide drinking water to nearly 18 million people in Los Angeles, Orange, San Diego,Riverside, San Bernardino and Ventura counties. The mission <strong>of</strong> the MWD is to provide itsservice area with adequate and reliable supplies <strong>of</strong> high-quality water to meet present andfuture needs in an environmentally and economically responsible way.2006 PAGE A - 11
Natural <strong>Hazard</strong>s <strong>Mitigation</strong> PlanCity <strong>of</strong> <strong>Glendale</strong>, <strong>California</strong>Appendix B:Appendix B – Public Participation ProcessPUBLIC PARTICIPATIONPROCESSThe Public Participation ProcessPublic participation is a key component to strategic planning processes. Citizen participation<strong>of</strong>fers citizens the chance to voice their ideas, interests, and opinions. The Federal EmergencyManagement Agency also requires public input during the development <strong>of</strong> mitigation plans.The City <strong>of</strong> <strong>Glendale</strong> Local <strong>Hazard</strong>s <strong>Mitigation</strong> Plan integrates a cross-section <strong>of</strong> citizen inputthroughout the planning process. To accomplish this goal, the <strong>Glendale</strong> <strong>Hazard</strong> <strong>Mitigation</strong>Advisory Committee developed a public participation process that consisted <strong>of</strong> four maincomponents: (1) development <strong>of</strong> a project Steering Committee comprised <strong>of</strong> knowledgeableindividuals from City agencies that are already tasked with natural hazard reduction programsand that are representative <strong>of</strong> the community; (2) stakeholder interviews to obtain input fromspecific individuals with expertise in or knowledgeable about natural hazards and their impacton populations at risk; (3) public workshops and meetings to identify common concerns andideas regarding hazard mitigation and to discuss specific goals and actions <strong>of</strong> the mitigationplan, and (4) publication <strong>of</strong> the Draft Plan in the City’s <strong>Web</strong> site with links that allow for publiccomment and input regarding the document. Furthermore, integrating public participationduring the development <strong>of</strong> the City <strong>of</strong> <strong>Glendale</strong> Local <strong>Hazard</strong>s <strong>Mitigation</strong> Plan and the City’sLong Range Planning efforts has ultimately resulted in increased public awareness. Throughcitizen involvement, the <strong>Mitigation</strong> Plan reflects community issues, concerns, and new ideas andperspectives on mitigation opportunities and plan action items.Steering and Advisory Committees:<strong>Hazard</strong> mitigation in the city <strong>of</strong> <strong>Glendale</strong> is overseen by the <strong>Hazard</strong> <strong>Mitigation</strong> AdvisoryCommittee. This committee includes representatives from various City departments, and otherpublic agencies. A smaller group <strong>of</strong> members from the Advisory Committee form the SteeringCommittee. These committee members have an understanding <strong>of</strong> how the community isstructured and how residents, businesses, and the environment may be affected by naturalhazard events. The Advisory Committee guided the development <strong>of</strong> the Plan, and assisted indeveloping plan goals and action items, identifying stakeholders, and sharing local expertise tocreate a more comprehensive Plan. The Steering Committee has provided the resourcesnecessary to prepare the Plan, and is tasked with the implementation and review <strong>of</strong> the Plan’seffectiveness.Table B.1 below lists the various organizations represented in the City <strong>of</strong> <strong>Glendale</strong> Natural<strong>Hazard</strong> <strong>Mitigation</strong> Advisory Committee:2006 PAGE B - 1
Natural <strong>Hazard</strong>s <strong>Mitigation</strong> PlanCity <strong>of</strong> <strong>Glendale</strong>, <strong>California</strong>Appendix B – Public Participation ProcessTable B.1: <strong>Hazard</strong> <strong>Mitigation</strong> Committees and ReviewersPROJECT STEERING COMMITTEE:City <strong>of</strong> <strong>Glendale</strong> Fire Department and Emergency ServicesCity <strong>of</strong> <strong>Glendale</strong> Planning DepartmentCity <strong>of</strong> <strong>Glendale</strong> Public Works DepartmentCity <strong>of</strong> <strong>Glendale</strong> Management ServicesPROJECT ADVISORY COMMITTEE:City <strong>of</strong> <strong>Glendale</strong> Emergency Services CoordinatorCity <strong>of</strong> <strong>Glendale</strong> Water and PowerCity <strong>of</strong> <strong>Glendale</strong> Information ServicesCity <strong>of</strong> <strong>Glendale</strong> Development ServicesCity <strong>of</strong> <strong>Glendale</strong> Parks, Recreation, and Community Services<strong>Glendale</strong> Unified School District<strong>Glendale</strong> Memorial HospitalVerdugo Hills HospitalPROJECT REVIEWERS:City <strong>of</strong> <strong>Glendale</strong> – City ManagerCity <strong>of</strong> <strong>Glendale</strong> – City CouncilProcess Followed:Disaster mitigation planning in the city <strong>of</strong> <strong>Glendale</strong> has been an ongoing process since at leastApril 2001, when the City put out a Request for Proposals to update their Safety Element <strong>of</strong> theGeneral Plan. Earth Consultants International, Inc. responded to and won the bid to preparethis document for the City. The contract was signed on March 12, 2002, and work on theSafety Element began immediately thereafter. A kick-<strong>of</strong>f meeting was conducted on April 24,2002 at the <strong>of</strong>fices <strong>of</strong> the City’s Planning Department to introduce the consultant and City staffthat would work on the project. This meeting was also designed to identify and address keyissues <strong>of</strong> concern to City staff regarding disaster planning and response, with an emphasis onareas in the city particularly vulnerable to natural hazards. Based on this meeting, the initialdraft <strong>of</strong> the Technical Background Report to the Safety Element was prepared and submitted inAugust 2002 for review by City staff. An internal meeting with personnel from the PlanningDepartment was held on August 26, 2002, and another meeting to receive input from the rest <strong>of</strong>the Safety Element review committee was held on September 23, 2002. Based on discussionswith the review committee, the report was expanded to more thoroughly describe the wildfirehazard in the city, and the City’s existing programs to deal with this hazard. Less substantialmodifications were made to other sections <strong>of</strong> the report, typically in the form <strong>of</strong> additionalinformation provided by various City departments in response to the first draft.Once the second draft <strong>of</strong> the Technical Background Report was completed and reviewed, aCommunity Open House meeting was held on April 14, 2003. Oversized printouts <strong>of</strong> all <strong>of</strong> the2006 PAGE B - 2
Natural <strong>Hazard</strong>s <strong>Mitigation</strong> PlanCity <strong>of</strong> <strong>Glendale</strong>, <strong>California</strong>Appendix B – Public Participation Processhazard maps prepared for the Safety Element (the same hazard maps included with thisdocument) were placed around the conference room at the Planning Department (633 E.Broadway), either on easels or pinned to the wall, to allow for easy viewing by the participants.The consultant was present to answer any questions. Unfortunately, approximately only abouteight individuals attended this event. Therefore, the Planning Department took thepresentation “on the road,” addressing various homeowners association and real estate groups,and members <strong>of</strong> the local Chamber <strong>of</strong> Commerce. Concurrent with these activities, the SafetyElement Review Committee took on the task <strong>of</strong> prioritizing the action items (policies andprograms) that the consultant submitted as part <strong>of</strong> the Draft Safety Element. The City <strong>of</strong><strong>Glendale</strong> opted to be very proactive – each policy statement is the Safety Element identifies theagency responsible for implementation and the timeline for implementation, similar to therequirements <strong>of</strong> a Local <strong>Hazard</strong> <strong>Mitigation</strong> Plan, but not typical <strong>of</strong> most <strong>California</strong> SafetyElements <strong>of</strong> the General Plan. Televised presentations (broadcast on <strong>Glendale</strong>’s communitytelevision channel – GTV6) were given to the <strong>Glendale</strong>’s Planning Commission on September 8,2003. Then, on October 7, 2003, <strong>Glendale</strong>’s updated Safety Element was adopted by CityCouncil, following a televised presentation by personnel <strong>of</strong> the City’s Planning Department andthe consultant to City Council members.Work on the Local <strong>Hazard</strong> <strong>Mitigation</strong> Plan began in 2005, following presentation <strong>of</strong> a proposalby Earth Consultants International, Inc. to the City in 2004. The consultant and the <strong>Hazard</strong><strong>Mitigation</strong> Advisory Committee started preparation <strong>of</strong> the Plan by holding a kick-<strong>of</strong>f meetingon May 2, 2005. The following paragraphs summarize the results <strong>of</strong> this meeting, andsubsequent meetings held between the consultant and the Advisory Committee.Meeting #1: May 2, 2005, 10 a.m. to 12 p.m.The purpose <strong>of</strong> this kick-<strong>of</strong>f meeting was to set in motion the process to create the Local <strong>Hazard</strong><strong>Mitigation</strong> Plan for the City <strong>of</strong> <strong>Glendale</strong>, as required by the Disaster <strong>Mitigation</strong> Act <strong>of</strong> 2000.The attendees are listed in Table B.2, below. The consultant presented a PowerPointpresentation that described the requirements <strong>of</strong> the Robert T. Stafford Disaster Relief andEmergency Assistance Act, and the work already accomplished with preparation <strong>of</strong> the 2003Safety Element. The function <strong>of</strong> the City in regards to the Plan and public input and processwas discussed. Members <strong>of</strong> the committee were interviewed, via a written questionnaire,regarding information on existing hazard mitigation efforts within their own divisions andorganizations, and ideas on how to best conduct the public outreach requirements <strong>of</strong> thisproject. The information obtained from these individuals was reviewed and compiled as part <strong>of</strong>this effort, and is included herein as an attachment to this appendix. Ways to gather publicinput, an important part <strong>of</strong> the process, were suggested, such as the use <strong>of</strong> the City’s cabletelevision channel, City’s website, and flyers for distribution to citizen groups.2006 PAGE B - 3
Natural <strong>Hazard</strong>s <strong>Mitigation</strong> PlanCity <strong>of</strong> <strong>Glendale</strong>, <strong>California</strong>Appendix B – Public Participation ProcessTable B.2: Attendees, Advisory Committee Meeting on May 2, 2005NameJames FrawleyDoug NicklesDaniel RodriguezKathy DuarteLou LeBlancWilliam A’HearnWilliam HallOliver TetreaultYasmin BeersRobert DoyleVasken DemirjianMark MunizRio CordovaJohn FentonJulie SchaefferMatthew SandovalTania GonzalezDepartment / OrganizationFire / Emergency ServicesFireParks, Recreations and Community ServicesPlanningCity Engineers Office – Public WorksPublic WorksWater and PowerWater and PowerManagement ServicesFireFire / Environmental Management<strong>Glendale</strong> Memorial HospitalVerdugo Hills Hospital<strong>Glendale</strong> Unified School DistrictFire / Emergency Services<strong>Glendale</strong> Memorial HospitalEarth Consultants International, Inc.Table B.3: Goal Areas and Ideas DiscussedGoal AreaProperty ProtectionNatural SystemsPublic AwarenessPartnershipsEmergency ServicesIdeaReduce losses from chronic hazard events while promoting insurancecoverage for catastrophic hazards. Focus resources on activities encouragingproperty owners to mitigate hazards on their properties and enforceactivities designed to mitigate natural hazards by use <strong>of</strong> the adoptedbuilding and fire codes, and the programs in the Safety Element.Evaluate and make recommendations for city guidelines, codes, andpermitting processes in addressing natural hazard mitigation anddevelopment in vulnerable areas.Develop and implement education programs that will increase the public’sawareness <strong>of</strong> natural hazards. Develop and conduct outreach programs toincrease the number <strong>of</strong> local, county, and regional activities implemented bypublic and private sector organizations. Ideas suggested include stories inthe local newspapers, presentations to schools, increased use <strong>of</strong> the localtelevision channel (GTV6) to promote disaster preparedness activities;development <strong>of</strong> instruction films to show practical ways for the public totake action; increase public participation via recreation programs, etc.Strengthen communication and coordinate participation in and betweenpublic agencies, citizens, non-pr<strong>of</strong>it organizations, business, and industry.Document the process and resources that will reduce the administrativeburden on the requestors/recipients <strong>of</strong> grant funds. Identify mitigationprograms that can be funded with Federal or <strong>State</strong> money.Establish policy to encourage mitigation for critical facilities, services, andinfrastructure. Strengthen emergency operations by increasingcollaboration and coordination among public agencies, non-pr<strong>of</strong>itorganizations, business, and industry.2006 PAGE B - 4
Natural <strong>Hazard</strong>s <strong>Mitigation</strong> PlanCity <strong>of</strong> <strong>Glendale</strong>, <strong>California</strong>Appendix B – Public Participation ProcessImplementationGuide Developmentand Use <strong>of</strong> VulnerableAreasPromote leadership within public agencies to implement natural hazardmitigation activities. Attain participation and funding to implementmitigation activities by creating a dynamic document, which is continuallyupdated and revised.Identify a clear process by which planners can identify and illustrate topotential developers the natural hazards that are present, the threat theypose, and how their development will be mitigated, regulated, and possiblylimited. Improve hazard identification, assessment and summarize hazardsdata and possible mitigation strategies to address those hazards in apalatable formatMeeting No. 2: December 15, 2005This meeting <strong>of</strong> the <strong>Glendale</strong> <strong>Hazard</strong> Advisory Committee was held in the workroom <strong>of</strong> theEmergency Operations Center. Individuals who attended this meeting are listed in Table B.4below.Table B.4 – Attendees, Advisory Committee Meeting on December 15, 2005NameJames FrawleyRio CordovaRon ReedAmanda WatkinsJulie SchaefferJohn FentonRobert DoyleApril FitzpatrickVasken DemirjianKathy DuarteDoug NicklesLewiS GuayYasmin BeersTania GonzalezDepartment / OrganizationFire / EOCVerdugo Hills HospitalVerdugo Hills HospitalFire / EOCFire / EOC<strong>Glendale</strong> Unified School DistrictFirePublic WorksFire / EMCPlanningFirePoliceManagement ServicesEarth Consultants International, Inc.This meeting was held after the Draft Plan had been submitted to the Advisory Committee forreview, although not all members had had the opportunity to read the document. The maintopics <strong>of</strong> meeting included: 1) review <strong>of</strong> the contents <strong>of</strong> the Plan, 2) format used, 3) preparationand prioritization <strong>of</strong> the action items, and 4) steps necessary to complete the Plan and getapproval from FEMA. The consultant gave a PowerPoint presentation describing each <strong>of</strong> thesemain topics. It was discussed that the format <strong>of</strong> the document followed closely the formatpreviously used by other communities that had already submitted their Plans to FEMA and hadreceived approval from FEMA, and as a result, it appeared prudent to follow the same.Committee members were tasked with reviewing the draft action items proposed by theconsultant and to develop new action items as they saw fit, and prioritize the action items basedon a perceived need for implementation and the resources available to do so.Over the course <strong>of</strong> the next few months, the various City departments represented in theAdvisory Committee did just that. Captain Eric Indermill from the <strong>Glendale</strong> Fire Departmentwas tasked to direct and facilitate this effort. Captain Indermill met with the consultant onApril 13, 2006 to discuss the public participation process and action item needs. Following thismeeting, Captain Indermill contacted all the City departments involved in the process to obtaintheir input and feedback. He then forwarded the information received to the consultant, who2006 PAGE B - 5
Natural <strong>Hazard</strong>s <strong>Mitigation</strong> PlanCity <strong>of</strong> <strong>Glendale</strong>, <strong>California</strong>Appendix B – Public Participation Processincorporated it into the second draft <strong>of</strong> Section 4, Goals and Action Items. Captain Indermillalso obtained and forwarded a copy <strong>of</strong> <strong>Glendale</strong> Memorial Hospital’s Draft <strong>Hazard</strong> <strong>Mitigation</strong>Plan to the consultant for review and use as appropriate.Public Meetings:As shown above, <strong>Glendale</strong>’s Local Natural <strong>Hazard</strong>s <strong>Mitigation</strong> Plan is the result <strong>of</strong> acollaborative effort between various City Departments and their consultant, and public agenciesand non-pr<strong>of</strong>it organizations in the <strong>Glendale</strong> area. This section discusses how the voices <strong>of</strong> theprivate sector and local citizens have also been considered in the process. Essentially, publicparticipation played a key role in the development <strong>of</strong> goals and action items. Informationregarding the various natural hazards that can impact the city <strong>of</strong> <strong>Glendale</strong> has been madeavailable to the public in a variety <strong>of</strong> forums since 2003, when the City’s Safety Element <strong>of</strong> theGeneral Plan was updated. This Plan builds on the work begun in 2003; the chapters on naturalhazards are similar to those in the Technical Report to the Safety Element, but additionalinformation on each <strong>of</strong> these hazards, formatted in accordance with the Federal EmergencyManagement Agency’s (FEMA) requirements for these documents, is included herein.Presentations to various stakeholders have been made across the city, both as part <strong>of</strong> theoriginal Safety Element work, and for this project. The Draft version <strong>of</strong> the Plan was posted onthe City’s website to allow for, and provide ongoing citizen/stakeholder information andparticipation. A link to post comments and questions regarding the Draft document wasprovided on the City’s website. Finally, and most importantly, the City <strong>of</strong> <strong>Glendale</strong> held 13meetings as part <strong>of</strong> its Long Range Planning process (see Table B.5). These meetings, althoughnot originally designed to address the Local <strong>Hazard</strong> <strong>Mitigation</strong> Plan, were used as aspringboard to present specific aspects <strong>of</strong> the Plan to the public, and to receive public input.The meetings were announced through several media, including local newspapers, the City’swebsite, and flyers. The flyers were printed in English, Armenian and Spanish; translationservices were provided at the meetings to involve all attending the event. To increaseparticipation, the City <strong>of</strong>fered door prices, refreshments and child care. The meetings were alsobroadcast on Charter Cable (GTV6), and two call-in shows were also held, the first on January19, 2006 at 7:00 p.m. and the second on February 2, 2006 at 7:00 p.m. Combined, a total <strong>of</strong>more than 600 people attended these meetings.Table B.5: Long Range Planning Meetings Held in <strong>Glendale</strong>Date and Time Location AttendanceJanuary 26, 20066:00 – 9:00 p.m.Chevy Chase Baptist Church1209 E. Garfield, <strong>Glendale</strong>January 28, 200611:00 a.m. – 2:00 p.m.Civic Auditorium Lower Level1401 N. Verdugo Road, <strong>Glendale</strong>February 4, 20062:00 p.m. – 5:00 p.m.Pacific Community Center501 S. Pacific Avenue, <strong>Glendale</strong>February 6, 2006 Glenoaks Elementary School6:00 – 9:00 p.m. 2015 E. Glenoaks Blvd.,<strong>Glendale</strong>February 8, 20066:00 – 9:00 p.m.Brand Library1601 W. Mountain St. <strong>Glendale</strong>February 16, 2006 Sparr Heights Senior Center6:00 – 9:00 p.m.February 25, 200611 a.m. – 2:00 p.m.1613 Glencoe Way, <strong>Glendale</strong>Franklin Elementary School1610 Lake St., <strong>Glendale</strong>2006 PAGE B - 6
Natural <strong>Hazard</strong>s <strong>Mitigation</strong> PlanCity <strong>of</strong> <strong>Glendale</strong>, <strong>California</strong>Appendix B – Public Participation ProcessFebruary 27, 20066:00 – 9:00 p.m.Clark Magnet High School4747 New York AvenueLa CrescentaMarch 8, 2006 Leadership <strong>Glendale</strong> 25 peopleMarch 15, 2006 St. Mary’s Armenian Apostolic120 peopleChurchMarch 22, 2006 West <strong>Glendale</strong> Gateway Kiwanis25 peopleClubApril 12, 2006 <strong>Glendale</strong> Adventist Medical50 peopleCenterApril 27, 2006 <strong>California</strong> Healthy Cities andCommunities35 peopleResults:Specific comments - transcribed directly from the hand-written notes - received from the publicregarding the City’s efforts to prepare its Local <strong>Hazard</strong> <strong>Mitigation</strong> Plan are provided below. Inmost cases, the comments refer to the question posed to the local residents in attendance atthese meetings regarding how much value they placed on safety and where they want the Cityto invest future resources. The common thread to these comments is that <strong>Glendale</strong>’s residentswant the City to invest more on disaster preparedness.- Disaster preparedness.- This is the core function <strong>of</strong> any municipality. Should be #1 priority.- Educate about disaster preparedness. Community safety for children (ie. Walking to school).- The City needs to be able to respond to residents in a more timely manner during a disaster.- Disaster awareness/drill for residents.- Help neighborhoods establish disaster preparation schemes.- Does the city have a disaster plan? Money from federal government.- There is an urgent need to expand disaster preparedness. i.e. The ability to respond in a majorearthquake. Volunteer resources (C.E.R.T.) needs to be pushed with a major city campaign.- Living in earthquake country, the city must be prepared for major disasters. If the city is looking7 years ahead, terrorism must be considered.- More disaster training for local residents.- <strong>Glendale</strong> is doing a pretty good job with community safety, but I think that we have tocommunicate and improve more about disaster preparedness.- Disaster preparedness is very important.- Support police/fire – new paramedic and disaster preparedness.- What disaster plan??- (Translated from Spanish) I think It’s important to prepare for disasters.- City should encourage neighborhoods to become organized and self-reliant for disasterpreparedness.- In relations with emergency funds, disaster funds and building safety and code compliance isimportant to protect our city from having to come up with large amounts <strong>of</strong> money when abuilding falls or a disaster occurs. By preparing funds set for disasters, we’re protecting our cityand our citizens and as far as building safety and code compliance, we’d be saving money byputting attention towards quality <strong>of</strong> the buildings instead <strong>of</strong> spending money to fix buildings thataren’t built correctly and safely.- With all concerns on natural disasters and collapsing buildings, we need to make stronger wallsto protect and it should be made stronger.- CPR and 1 st for disaster preparedness classes.- Disaster preparedness should be a focus.2006 PAGE B - 7
Natural <strong>Hazard</strong>s <strong>Mitigation</strong> PlanCity <strong>of</strong> <strong>Glendale</strong>, <strong>California</strong>Appendix B – Public Participation Process- One never knows what can happen. Ever since 9/11 unknown weather disasters, floods andearthquakes.- City <strong>of</strong> <strong>Glendale</strong> needs more places for training nurses or other medical fields.- Be prepared financially for emergencies and disasters.- Is <strong>Glendale</strong> prepared in case <strong>of</strong> a disaster like Katrina?- Emergency prep. Business retention.- Support the decision to increase police presence especially in traffic enforcement. Get the fulladditional 100 cops. Execute the decision already in place fund it. Make sure <strong>Glendale</strong> getsevery available state and federal $ to spend on police, fire & disaster preparedness.- Disaster preparedness.- Educate about disaster preparedness.- There is an urgent need to expand disaster preparedness. ie. The ability to respond in a majorearthquake. Volunteer resources (C.E.R.T.) needs to be pushed with a major city campaign.2006 PAGE B - 8
Natural <strong>Hazard</strong>s <strong>Mitigation</strong> PlanCity <strong>of</strong> <strong>Glendale</strong>, <strong>California</strong>Appendix C – Economic AnalysisAPPENDIX C: ECONOMIC ANALYSIS OFNATURAL HAZARD MITIGATIONPROJECTSBenefit/cost analysis is a key mechanism used by the <strong>State</strong> Office <strong>of</strong> Emergency Services (OES),the Federal Emergency Management Agency, and other <strong>State</strong> and Federal agencies inevaluating hazard mitigation projects, and is required by the Robert T. Stafford Disaster Reliefand Emergency Assistance Act, Public Law 93-288, as amended.This appendix outlines several approaches for conducting economic analysis <strong>of</strong> natural hazardmitigation projects. It describes the importance <strong>of</strong> implementing mitigation activities, differentapproaches to economic analysis <strong>of</strong> mitigation strategies, and methods to calculate costs andbenefits associated with mitigation strategies. Information in this section is derived in part from:The Interagency <strong>Hazard</strong>s <strong>Mitigation</strong> Team, <strong>State</strong> <strong>Hazard</strong> <strong>Mitigation</strong> Plan, (Oregon <strong>State</strong> Police– Office <strong>of</strong> Emergency Management, 2000), and Federal Emergency Management AgencyPublication 331, Report on Costs and Benefits <strong>of</strong> Natural <strong>Hazard</strong> <strong>Mitigation</strong>.This section is not intended to provide a comprehensive description <strong>of</strong> benefit/cost analysis, noris it intended to provide the details <strong>of</strong> economic analysis methods that can be used to evaluatelocal projects. It is intended to (1) raise benefit/cost analysis as an important issue, and (2)provide some background on how economic analysis can be used to evaluate mitigation projects.Why Evaluate <strong>Mitigation</strong> Strategies?<strong>Mitigation</strong> activities reduce the cost <strong>of</strong> disasters by minimizing property damage, injuries, andthe potential for loss <strong>of</strong> life, and by reducing emergency response costs, which would otherwisebe incurred.Evaluating natural hazard mitigation provides decision-makers with an understanding <strong>of</strong> thepotential benefits and costs <strong>of</strong> an activity, as well as a basis upon which to compare alternativeprojects. Evaluating mitigation projects is a complex and difficult undertaking, which isinfluenced by many variables. First, natural disasters affect all segments <strong>of</strong> the communitiesthey strike, including individuals, businesses, and public services such as fire, police, utilities,and schools. Second, while some <strong>of</strong> the direct and indirect costs <strong>of</strong> disaster damages aremeasurable, some <strong>of</strong> the costs are non-financial and difficult to quantify in dollars. Third, many<strong>of</strong> the impacts <strong>of</strong> such events produce “ripple-effects” throughout the community, greatlyincreasing the disaster’s social and economic consequences.While not easily accomplished, there is value, from a public policy perspective, in assessing thepositive and negative impacts from mitigation activities, and obtaining an instructivebenefit/cost comparison. Otherwise, the decision to pursue or not pursue various mitigationoptions would not be based on an objective understanding <strong>of</strong> the net benefit or loss associatedwith these actions.What are Some Economic Analysis Approaches for<strong>Mitigation</strong> Strategies?The approaches used to identify the costs and benefits associated with natural hazard mitigationstrategies, measures, or projects fall into two general categories: benefit/cost analysis and costeffectivenessanalysis. The distinction between the two methods is the way in which the relative2006 PAGE C - 1
Natural <strong>Hazard</strong>s <strong>Mitigation</strong> PlanCity <strong>of</strong> <strong>Glendale</strong>, <strong>California</strong>Appendix C – Economic Analysiscosts and benefits are measured. Additionally, there are varying approaches to assessing thevalue <strong>of</strong> mitigation for public sector and private sector activities.Benefit/Cost AnalysisBenefit/cost analysis is used in natural hazards mitigation to show if the benefits to life andproperty protected through mitigation efforts exceed the cost <strong>of</strong> the mitigation activity.Conducting benefit/cost analysis for a mitigation activity can assist communities in determiningwhether a project is worth undertaking now, in order to avoid disaster related damages later.Benefit/cost analysis is based on calculating the frequency and severity <strong>of</strong> a hazard, avoidedfuture damages, and risk.In benefit/cost analysis, all costs and benefits are evaluated in terms <strong>of</strong> dollars, and a netbenefit/cost ratio is computed to determine whether a project should be implemented (i.e., if netbenefits exceed net costs, the project is worth pursuing). A project must have a benefit/costratio greater than 1 in order to be funded.Cost-Effectiveness AnalysisCost-effectiveness analysis evaluates how best to spend a given amount <strong>of</strong> money to achieve aspecific goal. This type <strong>of</strong> analysis, however, does not necessarily measure costs and benefits interms <strong>of</strong> dollars. Determining the economic feasibility <strong>of</strong> mitigating natural hazards can also beorganized according to the perspective <strong>of</strong> those with an economic interest in the outcome.Hence, economic analysis approaches are covered for both public and private sectors as follows.• Investing in Public Sector <strong>Mitigation</strong> ActivitiesEvaluating mitigation strategies in the public sector is complicated because it involvesestimating all <strong>of</strong> the economic benefits and costs regardless <strong>of</strong> who realizes them, whichcould potentially be a large number <strong>of</strong> people and economic entities. Furthermore, somebenefits cannot be evaluated monetarily, but still affect the public in pr<strong>of</strong>ound ways.Economists have developed methods to evaluate the economic feasibility <strong>of</strong> publicdecisions that involve a diverse set <strong>of</strong> beneficiaries and non-market benefits.• Investing in Private Sector <strong>Mitigation</strong> ActivitiesPrivate sector mitigation projects may occur on the basis <strong>of</strong> one <strong>of</strong> two approaches: itmay be mandated by a regulation or standard, or it may be economically justified on itsown merits. A building or landowner, whether a private entity or a public agency,required to conform to a mandated standard may consider the following options:1. Request cost sharing from public agencies;2. Dispose <strong>of</strong> the building or land either by sale or demolition;3. Change the designated use <strong>of</strong> the building or land and change the hazardmitigation compliance requirement; or4. Evaluate the most feasible alternatives and initiate the most cost-effective hazardmitigation alternative.Estimating the costs and benefits <strong>of</strong> a hazard mitigation plan strategycan be a complex process.Employing the services <strong>of</strong> a specialist can assist in this process.The sale <strong>of</strong> a building or land triggers another set <strong>of</strong> concerns. For example, real estate2006 PAGE C - 2
Natural <strong>Hazard</strong>s <strong>Mitigation</strong> PlanCity <strong>of</strong> <strong>Glendale</strong>, <strong>California</strong>Appendix C – Economic Analysisdisclosure laws can be developed which require sellers <strong>of</strong> real property to discloseknown defects and deficiencies in the property, including earthquake weaknesses andhazards to prospective purchasers. Correcting deficiencies can be expensive and timeconsuming, but their existence can prevent the sale <strong>of</strong> the building. Conditions <strong>of</strong> a saleregarding the deficiencies and the price <strong>of</strong> the building can be negotiated between abuyer and seller.How Can an Economic Analysis be Conducted?Benefit/cost analysis and cost-effectiveness analysis are important tools in evaluating whetheror not to implement a mitigation activity. A framework for evaluating alternative mitigationactivities is outlined below:1. Identify the Alternatives: Alternatives for reducing risk from natural hazards caninclude structural projects to enhance disaster resistance, education and outreach, andacquisition or demolition <strong>of</strong> exposed properties, among others. Different mitigationprojects can assist in minimizing the risk to natural hazards, but do so at varyingeconomic costs.2. Calculate the Costs and Benefits: Choosing economic criteria is essential tosystematically calculate the costs and benefits <strong>of</strong> mitigation projects and select the mostappropriate alternative. Potential economic criteria to evaluate alternatives include:• Determine the Project Cost. This may include initial project development costs,and repair and operating costs <strong>of</strong> maintaining projects over time.• Estimate the Benefits. Projecting the benefits, or cash flow resulting from aproject can be difficult. Expected future returns from the mitigation effort dependon the correct specification <strong>of</strong> the risk and the effectiveness <strong>of</strong> the project, whichmay not be well known. Expected future costs depend on the physical durabilityand potential economic obsolescence <strong>of</strong> the investment. This is difficult to project.These considerations will also provide guidance in selecting an appropriate salvagevalue. Future tax structures and rates must be projected. Financing alternatives,such as retained earnings, bond and stock issues, and commercial loans, must beresearched.• Consider Costs and Benefits to Society and the Environment. These are noteasily measured, but can be assessed through a variety <strong>of</strong> economic tools includingexistence value or contingent value theories. These theories provide quantitativedata on the value people attribute to physical or social environments. Even withouthard data, however, impacts <strong>of</strong> structural projects to the physical environment or tosociety should be considered when implementing mitigation projects.• Determine the Correct Discount Rate. Determination <strong>of</strong> the discount rate canrefer only to the risk-free cost <strong>of</strong> capital, but it may also include the decision maker’stime preference and also a risk premium. Inflation should also be considered.3. Analyze and Rank the Alternatives: Once costs and benefits have been quantified,economic analysis tools can be used to rank the alternatives. Two methods fordetermining the best alternative given varying costs and benefits include netpresent value and internal rate <strong>of</strong> return.2006 PAGE C - 3
Natural <strong>Hazard</strong>s <strong>Mitigation</strong> PlanCity <strong>of</strong> <strong>Glendale</strong>, <strong>California</strong>Appendix C – Economic Analysis• Net Present Value. Net present value is the value <strong>of</strong> the expected future return onan investment minus the value <strong>of</strong> expected future cost expressed in today’s dollars.If the net present value is greater than the project’s costs, the project may bedeemed feasible for implementation.• Internal Rate <strong>of</strong> Return. Using the internal rate <strong>of</strong> return method to evaluatemitigation projects provides the interest rate equivalent to the dollar returnsexpected from the project. Once the rate has been calculated, it can be compared torates earned by investing in alternative projects. Projects may be feasible toimplement when the internal rate <strong>of</strong> return is greater than the total costs <strong>of</strong> theproject.Once the mitigation projects are ranked on the basis <strong>of</strong> economic criteria, decision-makers canconsider other factors, such as risk, project effectiveness, and economic, environmental, andsocial returns in choosing the appropriate project for implementation.How are the Benefits <strong>of</strong> <strong>Mitigation</strong> Calculated?Economic Returns <strong>of</strong> Natural <strong>Hazard</strong> <strong>Mitigation</strong>The estimation <strong>of</strong> economic returns, which accrue to a building or landowner as a result <strong>of</strong>natural hazard mitigation, is difficult. Owners evaluating the economic feasibility <strong>of</strong> mitigationshould consider reductions in physical damages and financial losses. A partial list follows:• Building damages avoided• Content damages avoided• Inventory damages avoided• Rental income losses avoided• Relocation and disruption expenses avoided• Proprietor’s income losses avoidedThese parameters can be estimated using observed prices, costs, and engineering data. Thedifficult part is to correctly determine the effectiveness <strong>of</strong> the hazard mitigation project and theresulting reduction in damages and losses. Equally as difficult is assessing the probability thatan event will occur. The damages and losses should only include those that will be borne by theowner. The salvage value <strong>of</strong> the investment can be important in determining economicfeasibility. Salvage value becomes more important as the time horizon <strong>of</strong> the owner declines.This is important because most businesses depreciate assets over a period <strong>of</strong> time.Additional Costs from Natural <strong>Hazard</strong>sProperty owners should also assess changes in a broader set <strong>of</strong> factors that can change as aresult <strong>of</strong> a large natural disaster. These are usually termed “indirect” effects, but they can havea very direct effect on the economic value <strong>of</strong> the owner’s building or land. They can be positiveor negative, and include changes in the following:• Commodity and resource prices• Availability <strong>of</strong> resource supplies• Commodity and resource demand changes• Building and land values• Capital availability and interest rates• Availability <strong>of</strong> labor• Economic structure2006 PAGE C - 4
Natural <strong>Hazard</strong>s <strong>Mitigation</strong> PlanCity <strong>of</strong> <strong>Glendale</strong>, <strong>California</strong>Appendix C – Economic Analysis• Infrastructure• Regional exports and imports• Local, state, and national regulations and policies• Insurance availability and ratesChanges in the resources and industries listed above are more difficult to estimate and requiremodels that are structured to estimate total economic impacts. Total economic impacts are thesum <strong>of</strong> direct and indirect economic impacts. Total economic impact models are usually notcombined with economic feasibility models. Many models exist to estimate total economicimpacts <strong>of</strong> changes in an economy.Decision makers should understand the total economic impacts <strong>of</strong> natural disasters in order tocalculate the benefits <strong>of</strong> a mitigation activity. This suggests that understanding the localeconomy is an important first step in being able to understand the potential impacts <strong>of</strong> adisaster, and the benefits <strong>of</strong> mitigation activities.Additional ConsiderationsConducting an economic analysis for potential mitigation activities can assist decision-makers inchoosing the most appropriate strategy for their community to reduce risk and prevent lossfrom natural hazards. Economic analysis can also save time and resources from being spent oninappropriate or unfeasible projects. Several resources and models (see list below) are availableto help in conducting an economic analysis for natural hazard mitigation activities.Benefit/cost analysis is complicated, and the numbers may divert attention from otherimportant issues. It is important to consider the qualitative factors <strong>of</strong> a project associated withmitigation that cannot be evaluated economically. There are alternative approaches toimplementing mitigation projects. Many communities are looking towards developing multiobjectiveprojects. With this in mind, opportunity rises to develop strategies that integratenatural hazard mitigation with projects related to watersheds, environmental planning,community economic development, and small business development, among others.Incorporating natural hazard mitigation with other community projects can increase theviability <strong>of</strong> project implementation.ResourcesCUREe Kajima Project, Methodologies For Evaluating The Socio-Economic Consequences <strong>of</strong>Large Earthquakes, Task 7.2 Economic Impact Analysis, Prepared by University <strong>of</strong><strong>California</strong>, Berkeley Team, Robert A. Olson, VSP Associates, Team Leader; John M.Eidinger, G&E Engineering Systems; Kenneth A. Goettel, Goettel and Associates Inc.;and Gerald L. Horner, <strong>Hazard</strong> <strong>Mitigation</strong> Economics Inc., 1997.Federal Emergency Management Agency, Benefit/Cost Analysis <strong>of</strong> <strong>Hazard</strong> <strong>Mitigation</strong> Projects,Riverine Flood, Version 1.05, <strong>Hazard</strong> <strong>Mitigation</strong> Economics Inc., 1996.Federal Emergency Management Agency Report on Costs and Benefits <strong>of</strong> Natural <strong>Hazard</strong><strong>Mitigation</strong>. Publication 331, 1996.Goettel & Horner Inc., Earthquake Risk Analysis Volume III: The Economic Feasibility <strong>of</strong>Seismic Rehabilitation <strong>of</strong> Buildings in the City <strong>of</strong> Portland, Submitted to the Bureau <strong>of</strong>Buildings, City <strong>of</strong> Portland, August 30, 1995.2006 PAGE C - 5
Natural <strong>Hazard</strong>s <strong>Mitigation</strong> PlanCity <strong>of</strong> <strong>Glendale</strong>, <strong>California</strong>Appendix C – Economic AnalysisGoettel & Horner Inc., Benefit/Cost Analysis <strong>of</strong> <strong>Hazard</strong> <strong>Mitigation</strong> Projects Volume V,Earthquakes, Prepared for FEMA’s <strong>Hazard</strong> <strong>Mitigation</strong> Branch, October 25, 1995.Horner, Gerald, Benefit/Cost Methodologies for Use in Evaluating the Cost Effectiveness <strong>of</strong>Proposed <strong>Hazard</strong> <strong>Mitigation</strong> Measures, Robert Olson Associates, Prepared for Oregon<strong>State</strong> Police, Office <strong>of</strong> Emergency Management, July 1999.Interagency <strong>Hazard</strong>s <strong>Mitigation</strong> Team, <strong>State</strong> <strong>Hazard</strong> <strong>Mitigation</strong> Plan, (Oregon <strong>State</strong> Police –Office <strong>of</strong> Emergency Management, 2000).Risk Management Solutions, Inc., Development <strong>of</strong> a Standardized Earthquake Loss EstimationMethodology, National Institute <strong>of</strong> Building Sciences, Volume I and II, 1994.VSP Associates, Inc., A Benefit/Cost Model for the Seismic Rehabilitation <strong>of</strong> Buildings,Volumes 1 & 2, Federal Emergency Management Agency, FEMA, PublicationNumbers 227 and 228, 1991.VSP Associates, Inc., Benefit/Cost Analysis <strong>of</strong> <strong>Hazard</strong> <strong>Mitigation</strong> Projects: Section 404 <strong>Hazard</strong><strong>Mitigation</strong> Program and Section 406 Public Assistance Program, Volume 3: Seismic<strong>Hazard</strong> <strong>Mitigation</strong> Projects, 1993.VSP Associates, Inc., Seismic Rehabilitation <strong>of</strong> Federal Buildings: A Benefit/Cost Model,Volume 1, Federal Emergency Management Agency, FEMA, Publication Number 255,1994.2006 PAGE C - 6
Natural <strong>Hazard</strong>s <strong>Mitigation</strong> PlanCity <strong>of</strong> <strong>Glendale</strong>, <strong>California</strong>APPENDIX D:Appendix D – AcronymsACRONYMSFederal AcronymsAASHTOATCB/CABFEBLMBSSCCDBGCFRCRSEDAEPAEREWPFASFEMAFIRMFMAFTEGISGNSGSAHAZUSHMGPHMSTHUDIBHSICCIHMTNCDCNFIPNFPANHMPNIBSNIFCNMFSNOAANPSNRCSNWSSBASEAOSHMOTORUGBURMUSACEUSBRUSDAUSFAAmerican Association <strong>of</strong> <strong>State</strong> Highway and Transportation OfficialsApplied Technology CouncilBenefit/Cost AnalysisBase Flood ElevationBureau <strong>of</strong> Land ManagementBuilding Seismic Safety CouncilCommunity Development Block GrantCode <strong>of</strong> Federal RegulationsCommunity Rating SystemEconomic Development AdministrationEnvironmental Protection AgencyEmergency ReliefEmergency Watershed Protection (NRCS Program)Federal Aid SystemFederal Emergency Management AgencyFlood Insurance Rate MapFlood <strong>Mitigation</strong> Assistance (FEMA Program)Full Time EquivalentGeographic Information SystemInstitute <strong>of</strong> Geological and Nuclear Sciences (International)General Services Administration<strong>Hazard</strong>s U.S.<strong>Hazard</strong> <strong>Mitigation</strong> Grant Program<strong>Hazard</strong> <strong>Mitigation</strong> Survey TeamHousing and Urban Development (United <strong>State</strong>s, Department <strong>of</strong>)Institute for Business and Home SafetyIncreased Cost <strong>of</strong> ComplianceInteragency <strong>Hazard</strong> <strong>Mitigation</strong> TeamNational Climate Data CenterNational Flood Insurance ProgramNational Fire Protection AssociationNatural <strong>Hazard</strong> <strong>Mitigation</strong> Plan (also known as "409 Plan")National Institute <strong>of</strong> Building SciencesNational Interagency Fire CenterNational Marine Fisheries ServiceNational Oceanic and Atmospheric AdministrationNational Park ServiceNatural Resources Conservation ServiceNational Weather ServiceSmall Business AdministrationStructural Engineers Association <strong>of</strong> Oregon<strong>State</strong> <strong>Hazard</strong> <strong>Mitigation</strong> OfficerTransfer <strong>of</strong> Development RightsUrban Growth BoundaryUnreinforced MasonryUnited <strong>State</strong>s Army Corps <strong>of</strong> EngineersUnited <strong>State</strong>s Bureau <strong>of</strong> ReclamationUnited <strong>State</strong>s Department <strong>of</strong> AgricultureUnited <strong>State</strong>s Fire Administration2006 PAGE D - 1
Natural <strong>Hazard</strong>s <strong>Mitigation</strong> PlanCity <strong>of</strong> <strong>Glendale</strong>, <strong>California</strong>Appendix D – AcronymsUSFSUSGSWSSPCUnited <strong>State</strong>s Forest ServiceUnited <strong>State</strong>s Geological SurveyWestern <strong>State</strong>s Seismic Policy Council<strong>California</strong> and <strong>Glendale</strong> AcronymsA&WAAAARADDIARCARPATC20ATC21BCPBSACAERCalARPCalBOCalEPACalREPCALSTARSCalTRANSCBOCDCDBGCDFCECCEPECCESRSCGSCHIPCHMIRSCHPCLETSCSTICUEACUPADADDFODGSDHSRHBDMACDODOCDOEDOFDOJDPADPIGDRDSADSRAlert and WarningAdministering AreasAfter Action ReportAmerican Dream Downpayment InitiativeAmerican Red CrossAccidental Risk PreventionApplied Technology Council20Applied Technology Council21Budget Change Proposal<strong>California</strong> Bureau <strong>of</strong> <strong>State</strong> AuditsCommunity Awareness & Emergency Response<strong>California</strong> Accidental Release Prevention<strong>California</strong> Building Officials<strong>California</strong> Environmental Protection Agency<strong>California</strong> Radiological Emergency Plan<strong>California</strong> <strong>State</strong> Accounting Reporting System<strong>California</strong> Department <strong>of</strong> TransportationCommunity Based OrganizationCivil DefenseCommunity Development Block Grant<strong>California</strong> Department <strong>of</strong> Forestry and Fire Protection<strong>California</strong> Energy Commission<strong>California</strong> Earthquake Prediction Evaluation Council<strong>California</strong> Emergency Services Radio System<strong>California</strong> Geological Survey<strong>California</strong> <strong>Hazard</strong>ous Identification Program<strong>California</strong> <strong>Hazard</strong>ous Materials Incident Reporting System<strong>California</strong> Highway Patrol<strong>California</strong> Law Enforcement Telecommunications System<strong>California</strong> Specialized Training Institute<strong>California</strong> Utilities Emergency AssociationCertified Unified Program AgencyDisaster Assistance Division (<strong>of</strong> the state Office <strong>of</strong> Emergency Svcs)Disaster Field Office<strong>California</strong> Department <strong>of</strong> General Services<strong>California</strong> Department <strong>of</strong> Health Services, Radiological Health BranchLos Angeles County Office <strong>of</strong> Disaster Management, Area CDuty OfficerDepartment Operations CenterDepartment <strong>of</strong> Energy (U.S.)<strong>California</strong> Department <strong>of</strong> Finance<strong>California</strong> Department <strong>of</strong> Justice<strong>California</strong> Department <strong>of</strong> Personnel AdministrationDisaster Preparedness Improvement GrantDisaster ResponseDivision <strong>of</strong> the <strong>State</strong> ArchitectDamage Survey Report2006 PAGE D - 2
Natural <strong>Hazard</strong>s <strong>Mitigation</strong> PlanCity <strong>of</strong> <strong>Glendale</strong>, <strong>California</strong>Appendix D – AcronymsDSWDWREASEDISEERIEMAEMIEMMAEMSEOCEOPEPAEPEDATEPIEPICESCFAYFDAAFEATFFYFIRFIRESCOPEFMAFSRFYGISHAZMATHAZMITHAZUSHADHEICSHEPGHIAHMEPHMGPHOMEIDEIAIFGIRGIPALADOTLAMSALANLEMMALEPCMARACMHIDMTAMOUNBCNEMANEMISDisaster Service Worker<strong>California</strong> Department <strong>of</strong> Water ResourcesEmergency Alerting SystemEmergency Digital Information SystemEarthquake Engineering Research InstituteEmergency Management AssistanceEmergency Management InstituteEmergency Managers Mutual AidEmergency Medical ServicesEmergency Operations CenterEmergency Operations PlanEnvironmental Protection Agency (U.S.)Early Post Earthquake Damage Assessment ToolEmergency Public InformationEmergency Public Information CouncilEmergency Services CoordinatorFederal Award YearFederal Disaster Assistance AdministrationGovernor's Flood Emergency Action TeamFederal Fiscal YearFinal Inspection ReportsFirefighting Resources <strong>of</strong> So. Calif Organized for Potential EmergenciesFlood Management AssistanceFeasibility Study ReportFiscal YearGeographical Information System<strong>Hazard</strong>ous Materials<strong>Hazard</strong>ous <strong>Mitigation</strong><strong>Hazard</strong>s United <strong>State</strong>s (an earthquake damage assessment prediction tool)Housing and Community DevelopmentHospital Emergency Incident Command SystemHospital Emergency Planning Guidance<strong>Hazard</strong> Identification and Analysis Unit<strong>Hazard</strong>ous Materials Emergency Preparedness<strong>Hazard</strong> <strong>Mitigation</strong> Grant ProgramHome Investment Partnership ProgramInitial Damage EstimateIndividual AssistanceIndividual & Family Grant (program)Incident Response Geographic Information SystemInformation and Public Affairs (<strong>of</strong> state Office <strong>of</strong> Emergency Services)City <strong>of</strong> Los Angeles Department <strong>of</strong> TransportationLos Angeles Metropolitan Statistical AreaLocal Area NetworkLaw Enforcement Master Mutual AidLocal Emergency Planning CommitteeMutual Aid Regional Advisory CouncilMultihazard IdentificationMetropolitan Transportation AuthorityMemorandum <strong>of</strong> UnderstandingNuclear, Biological, ChemicalNational Emergency Management AgencyNational Emergency Management Information System2006 PAGE D - 3
Natural <strong>Hazard</strong>s <strong>Mitigation</strong> PlanCity <strong>of</strong> <strong>Glendale</strong>, <strong>California</strong>Appendix D – AcronymsNFIPNOAANPPNSFNWSOAOASISOCCOCDOEPOESOSHPDOSPRPAPCPDAPIOPOSTPPA/CAPSAPTABPTRRARADEFRAMPRAPIDRDORDMHCREOCREPIRESRIMSRMPRPURRTSAMSARASAVPSBASCECSCOSEMSSEPICSLASONGSSOPSWEPCTECTRUTTTUPAUPSUSARNational Flood Insurance ProgramNational Oceanic and Atmospheric AssociationNuclear Power PlantNational Science FoundationNational Weather ServiceOperational AreaOperational Area Satellite Information SystemOperations Coordination CenterOffice <strong>of</strong> Civil DefenseOffice <strong>of</strong> Emergency Planning<strong>California</strong> Governor's Office <strong>of</strong> Emergency ServicesOffice <strong>of</strong> <strong>State</strong>wide Health Planning and DevelopmentOil Spill Prevention and ResponsePublic AssistancePersonal ComputerPreliminary Damage AssessmentPublic Information OfficePolice Officer Standards and TrainingPerformance Partnership Agreement/Cooperative Agreement (FEMA)Public Service AnnouncementPlanning and Technological Assistance BranchProject Time ReportRegional Administrator (OES)Radiological Defense (program)Regional Assessment <strong>of</strong> <strong>Mitigation</strong> PrioritiesRailroad Accident Prevention & Immediate DeploymentRadiological Defense OfficerRegional Disaster Medical Health CoordinatorRegional Emergency Operations CenterReserve Emergency Public InformationRegional Emergency StaffResponse Information Management SystemRisk Management PlanRadiological Preparedness Unit (OES)Regional Response Team<strong>State</strong> Administrative ManualSuperfund Amendments & Reauthorization ActSafety Assessment Volunteer ProgramSmall Business AdministrationSouthern <strong>California</strong> Earthquake Center<strong>California</strong> <strong>State</strong> Controller's OfficeStandardized Emergency Management System<strong>State</strong> Emergency Public Information Committee<strong>State</strong> and Local AssistanceSan On<strong>of</strong>re Nuclear Generating StationStandard Operating Procedure<strong>State</strong>wide Emergency Planning CommitteeTravel Expense ClaimTransuranicTrain the TrainerUnified Program AccountUninterrupted Power SourceUrban Search and Rescue2006 PAGE D - 4
Natural <strong>Hazard</strong>s <strong>Mitigation</strong> PlanCity <strong>of</strong> <strong>Glendale</strong>, <strong>California</strong>Appendix D – AcronymsUSGSWCWANWIPPUnited <strong>State</strong>s Geological Survey<strong>California</strong> <strong>State</strong> Warning CenterWide Area NetworkWaste Isolation Pilot Project2006 PAGE D - 5
Natural <strong>Hazard</strong>s <strong>Mitigation</strong> PlanCity <strong>of</strong> <strong>Glendale</strong>, <strong>California</strong>Appendix E – GlossaryAPPENDIX E:GLOSSARYAccelerationActive faultAftershocksAlluviumAssetAttenuationA zoneBase floodBase Flood Elevation(BFE)BedrockBlind thrust faultBuildingThe rate <strong>of</strong> change <strong>of</strong> velocity with respect to time. Acceleration dueto gravity at the earth's surface is 9.8 meters per second squared. Thatmeans that every second that something falls toward the surface <strong>of</strong>earth its velocity increases by 9.8 meters per second.For implementation <strong>of</strong> Alquist-Priolo Earthquake Fault Zoning Act(APEFZA) requirements, an active fault is one that shows evidence <strong>of</strong>,or is suspected <strong>of</strong> having experienced surface displacement within thelast 11,000 years. APEFZA classification is designed for land usemanagement <strong>of</strong> surface rupture hazards. A more general definition(National Academy <strong>of</strong> Science, 1988), states "a fault that on the basis<strong>of</strong> historical, seismological, or geological evidence has the finiteprobability <strong>of</strong> producing an earthquake" (see potentially active fault).Minor earthquakes following a greater one and originating at or nearthe same place.Surficial sediments <strong>of</strong> poorly consolidated gravels, sand, silts, andclays deposited by flowing water.Any man-made or natural feature that has value, including, but notlimited to people, buildings, infrastructure like bridges, roads, andsewer and water systems; lifelines like electricity and communicationresources; or environmental, cultural, or recreational features likeparks, dunes, wetlands, or landmarks.The reduction in amplitude <strong>of</strong> a wave with time or distance traveled.Under the National Flood Insurance Program, area subject toinundation by the 100-year flood where wave action does not occur orwhere waves are less than 3 feet high, designated Zone A, AE, A1-A30, A0, AH, or AR on a Flood Insurance Rate Map (FIRM).Flood that has a 1 percent probability <strong>of</strong> being equaled or exceeded inany given year. Also known as the 100-year flood.Elevation <strong>of</strong> the base flood in relation to a specified datum, such as theNational Geodetic Vertical Datum <strong>of</strong> 1929. The Base Flood Elevationis used as the standard for the National Flood Insurance Program.The solid rock that underlies loose material, such as soil, sand, clay, orgravel.A thrust fault is a low-angle reverse fault (top block pushed overbottom block). A "blind" thrust fault refers to one that does not reachthe surface.A structure that is walled and ro<strong>of</strong>ed, principally above ground andpermanently affixed to a site. The term includes a manufactured homeon a permanent foundation on which the wheels and axles carry noweight.2006 PAGE E - 1
Natural <strong>Hazard</strong>s <strong>Mitigation</strong> PlanCity <strong>of</strong> <strong>Glendale</strong>, <strong>California</strong>Appendix E – GlossaryBuilding codeCode <strong>of</strong>ficialCommunity RatingSystem (CRS)Computer-AidedDesign And Drafting(CADD)ContourCoseismic ruptureCritical facilityDebrisDebris impact loadsDebris flowDebris lineDeformationDesign floodDigitizeRegulations adopted by local governments that establish standards forconstruction, modification, and repair <strong>of</strong> buildings and otherstructures.Officer or other designated authority charged with the administrationand enforcement <strong>of</strong> the code, or a duly authorized representative, suchas a building, zoning, planning, or floodplain management <strong>of</strong>ficial.An NFIP program that provides incentives for NFIP communities tocomplete activities that reduce flood hazard risk. When thecommunity completes specified activities, the insurance premiums <strong>of</strong>policyholders in these communities are reduced.A computerized system enabling quick and accurate electronic 2-Dand 3-D drawings, topographic mapping, site plans, and pr<strong>of</strong>ile/crosssectiondrawings.A line <strong>of</strong> equal ground elevation on a topographic (contour) map.Ground rupture occurring during an earthquake but not necessarilyon the causative fault.Facilities that are critical to the health and welfare <strong>of</strong> the populationand that are especially important following hazard events. Criticalfacilities include, but are not limited to, shelters, police and firestations, and hospitals.(Seismic) The scattered remains <strong>of</strong> something broken or destroyed;ruins; rubble; fragments. (Flooding, Coastal) Solid objects or massescarried by or floating on the surface <strong>of</strong> moving water.Debris ––Loads imposed on a structure by the impact <strong>of</strong> floodborne debris.These loads are <strong>of</strong>ten sudden and large. Though difficult to predict,debris impact loads must be considered when structures are designedand constructed. See Loads.A saturated, rapidly moving saturated earth flow with 50 percent rockfragments coarser than 2 mm in size which can occur on natural andgraded slopes.Line left on a structure or on the ground by the deposition <strong>of</strong> debris. Adebris line <strong>of</strong>ten indicates the height or inland extent reached by floodwaters.A general term for the process <strong>of</strong> folding, faulting, shearing,compression, or extension <strong>of</strong> rocks.The greater <strong>of</strong> either (1) the base flood or (2) the flood associated withthe flood hazard area depicted on a community’s flood hazard map, orotherwise legally designated.To convert electronically points, lines, and area boundaries shown onmaps into x, y coordinates (e.g., latitude and longitude, universaltransverse mercator (UTM), or table coordinates) for use in computerapplications.2006 PAGE E - 2
Natural <strong>Hazard</strong>s <strong>Mitigation</strong> PlanCity <strong>of</strong> <strong>Glendale</strong>, <strong>California</strong>Appendix E – GlossaryDisplacement timeDurationEarth flowEarthquakeEngineeringgeologistEpicenterErosionErosion hazard areaEssential facilityExpansive soilExtentExtratropicalcycloneThe average time (in days) which the building's occupants typicallymust operate from a temporary location while repairs are made to theoriginal building due to damages resulting from a hazard event.How long a hazard event lasts.Imperceptibly slow-moving surficial material in which 80 percent ormore <strong>of</strong> the fragments are smaller than 2 mm, including a range <strong>of</strong>rock and mineral fragments.Vibratory motion propagating within the Earth or along its surfacecaused by the abrupt release <strong>of</strong> strain from elastically deformed rockby displacement along a fault.A geologist who is certified by the <strong>State</strong> as qualified to apply geologicdata, principles, and interpretation to naturally occurring earthmaterials so that geologic factors affecting planning, design,construction, and maintenance <strong>of</strong> civil engineering works are properlyrecognized and used. An engineering geologist is particularly neededto conduct investigations, <strong>of</strong>ten with geotechnical engineers, <strong>of</strong> siteswith potential ground failure hazards.The point at the Earth's surface directly above where an earthquakeoriginated.Under the National Flood Insurance Program, the process <strong>of</strong> thegradual wearing away <strong>of</strong> landmasses. In general, erosion involves thedetachment and movement <strong>of</strong> soil and rock fragments, during a floodor storm or over a period <strong>of</strong> years, through the action <strong>of</strong> wind, water,or other geologic processes.Area anticipated to be lost to shoreline retreat over a given period <strong>of</strong>time. The projected inland extent <strong>of</strong> the area is measured bymultiplying the average annual long-term recession rate by thenumber <strong>of</strong> years desired.Elements that are important to ensure a full recovery <strong>of</strong> a communityor state following a hazard event. These would include: governmentfunctions, major employers, banks, schools, and certain commercialestablishments, such as grocery stores, hardware stores, and gasstations.A soil that contains clay minerals that take in water and expand. If asoil contains sufficient amount <strong>of</strong> these clay minerals, the volume <strong>of</strong>the soil can change significantly with changes in moisture, withresultant structural damage to structures founded on these materials.The size <strong>of</strong> an area affected by a hazard or hazard event.Cyclonic storm events like Nor'easters and severe winter low-pressuresystems. Both West and East coasts can experience these non-tropicalstorms that produce gale-force winds and precipitation in the form <strong>of</strong>heavy rain or snow. These cyclonic storms, commonly calledNor'easters on the East Coast because <strong>of</strong> the direction <strong>of</strong> the stormwinds, can last for several days and can be very large – 1,000-milewide storms are not uncommon.2006 PAGE E - 3
Natural <strong>Hazard</strong>s <strong>Mitigation</strong> PlanCity <strong>of</strong> <strong>Glendale</strong>, <strong>California</strong>Appendix E – GlossaryFaultFault slip rateFederal EmergencyManagementAgency (FEMA)Federal InsuranceAdministration(FIA)FillFire Potential Index(FPI)Flash floodFloodFlood depthFlood elevationFlood hazard areaFlood insuranceFlood InsuranceRate Map (FIRM)A fracture in the continuity <strong>of</strong> a rock formation caused by a shifting ordislodging <strong>of</strong> the earth's crust, in which adjacent surfaces aredifferentially displaced parallel to the plane <strong>of</strong> fracture.The average long-term movement <strong>of</strong> a fault (measured in cm/year ormm/year) as determined from geologic evidence.Independent agency created in 1978 to provide a single point <strong>of</strong>accountability for all Federal activities related to disaster mitigationand emergency preparedness, response and recovery.The component <strong>of</strong> the Federal Emergency Management Agency directlyresponsible for administering the flood insurance aspects <strong>of</strong> theNational Flood Insurance Program.Material such as soil, gravel, or crushed stone placed in an area toincrease ground elevations or change soil properties.Developed by USGS and USFS to assess and map fire hazardpotential over broad areas. Based on such geographic information,national policy makers and on-the-ground fire managers establishedpriorities for prevention activities in the defined area to reduce therisk <strong>of</strong> managed and wildfire ignition and spread. Prediction <strong>of</strong> firehazard shortens the time between fire ignition and initial attack byenabling fire managers to pre-allocate and stage suppression forces tohigh fire risk areas.A flood event occurring with little or no warning where water levelsrise at an extremely fast rate.A general and temporary condition <strong>of</strong> partial or complete inundation<strong>of</strong> normally dry land areas from (1) the overflow <strong>of</strong> inland or tidalwaters, (2) the unusual and rapid accumulation or run<strong>of</strong>f <strong>of</strong> surfacewaters from any source, or (3) mudflows or the sudden collapse <strong>of</strong>shoreline land.Height <strong>of</strong> the flood water surface above the ground surface.Height <strong>of</strong> the water surface above an established elevation datum suchas the National Geodetic Vertical Datum, North American Vertical Datum,or mean sea level.The greater <strong>of</strong> the following: (1) the area <strong>of</strong> special flood hazard, asdefined under the National Flood Insurance Program, or (2) the areadesignated as a flood hazard area on a community’s legally adoptedflood hazard map, or otherwise legally designated.Insurance coverage provided under the National Flood InsuranceProgram.Under the National Flood Insurance Program, an <strong>of</strong>ficial map <strong>of</strong> acommunity, on which the Federal Emergency Management Agency hasdelineated both the special hazard areas and the risk premium zonesapplicable to the community. (Note: The latest FIRM issued for acommunity is referred to as the effective FIRM for that community.)2006 PAGE E - 4
Natural <strong>Hazard</strong>s <strong>Mitigation</strong> PlanCity <strong>of</strong> <strong>Glendale</strong>, <strong>California</strong>Appendix E – GlossaryFlood InsuranceStudy (FIS)FloodplainFloodplainmanagementFloodplainmanagementregulationsFrequencyFunctionaldowntimeGeographic areaimpactedGeographicInformation Systems(GIS)GeotechnicalengineerGround motionGround ruptureUnder the National Flood Insurance Program, an examination,evaluation, and determination <strong>of</strong> flood hazards and, if appropriate,corresponding water surface elevations, or an examination, evaluation,and determination <strong>of</strong> mudslide (i.e., mudflow) and/or flood-relatederosion hazards in a community or communities. (Note: The NationalFlood Insurance Program regulations refer to Flood Insurance Studiesas “flood elevation studies.”)Any land area, including watercourse, susceptible to partial orcomplete inundation by water from any source.Operation <strong>of</strong> an overall program <strong>of</strong> corrective and preventivemeasures for reducing flood damage, including but not limited toemergency preparedness plans, flood control works, and floodplainmanagement regulations.Under the National Flood Insurance Program, zoning ordinances,subdivision regulations, building codes, health regulations, specialpurpose ordinances (such as floodplain ordinance, grading ordinance,and erosion control ordinance), and other applications <strong>of</strong> police power.The term describes such state or local regulations, in any combinationthere<strong>of</strong>, which provide standards for the purpose <strong>of</strong> flood damageprevention and reduction.A measure <strong>of</strong> how <strong>of</strong>ten events <strong>of</strong> a particular magnitude are expectedto occur. Frequency describes how <strong>of</strong>ten a hazard <strong>of</strong> a specificmagnitude, duration, and/or extent typically occurs, on average.Statistically, a hazard with a 100-year recurrence interval is expectedto occur once every 100 years on average, and would have a 1 percentchance – its probability – <strong>of</strong> happening in any given year. Thereliability <strong>of</strong> this information varies depending on the kind <strong>of</strong> hazardbeing considered.The average time (in days) during which a function (business orservice) is unable to provide its services due to a hazard event.The physical area in which the effects <strong>of</strong> the hazard are experienced.A computer s<strong>of</strong>tware application that relates physical features on theEarth to a database to be used for mapping and analysis.A licensed civil engineer who is also certified by the <strong>State</strong> as qualifiedfor the investigation and engineering evaluation <strong>of</strong> earth materialsand their interaction with earth retention systems, structuralfoundations, and other civil engineering works.The vibration or shaking <strong>of</strong> the ground during an earthquake. When afault ruptures, seismic waves radiate, causing the ground to vibrate.The severity <strong>of</strong> the vibration increases with the amount <strong>of</strong> energyreleased and decreases with distance from the causative fault orepicenter, but s<strong>of</strong>t soils can further amplify ground motionsDisplacement <strong>of</strong> the earth's surface as a result <strong>of</strong> fault movementassociated with an earthquake.2006 PAGE E - 5
Natural <strong>Hazard</strong>s <strong>Mitigation</strong> PlanCity <strong>of</strong> <strong>Glendale</strong>, <strong>California</strong>Appendix E – Glossary<strong>Hazard</strong><strong>Hazard</strong> event<strong>Hazard</strong> identification<strong>Hazard</strong> mitigation<strong>Hazard</strong> pr<strong>of</strong>ileHazUS (<strong>Hazard</strong>sU.S.)HoloceneHurricaneHydrologyInfrastructureIntensityLandslideLateral spreadsA source <strong>of</strong> potential danger or adverse condition. <strong>Hazard</strong>s in thishow to series will include naturally occurring events such as floods,earthquakes, tornadoes, tsunami, coastal storms, landslides, andwildfires that strike populated areas. A natural event is a hazard whenit has the potential to harm people or property.A specific occurrence <strong>of</strong> a particular type <strong>of</strong> hazard.The process <strong>of</strong> identifying hazards that threaten an area.Sustained actions taken to reduce or eliminate long-term risk fromhazards and their effects.A description <strong>of</strong> the physical characteristics <strong>of</strong> hazards and adetermination <strong>of</strong> various descriptors including magnitude, duration,frequency, probability, and extent. In most cases, a community canmost easily use these descriptors when they are recorded anddisplayed as maps.A GIS-based nationally standardized earthquake loss estimation tooldeveloped by FEMA.An epoch <strong>of</strong> the Quaternary period spanning from the end <strong>of</strong> thePleistocene to the present time (the past about 11,000 years).An intense tropical cyclone, formed in the atmosphere over warmocean areas, in which wind speeds reach 74-miles-per-hour or moreand blow in a large spiral around a relatively calm center or "eye."Hurricanes develop over the north Atlantic Ocean, northeast PacificOcean, or the south Pacific Ocean east <strong>of</strong> 160°E longitude. Hurricanecirculation is counter-clockwise in the Northern Hemisphere andclockwise in the Southern Hemisphere.The science <strong>of</strong> dealing with the waters <strong>of</strong> the earth. A flood dischargeis developed by a hydrologic study.Refers to the public services <strong>of</strong> a community that have a direct impacton the quality <strong>of</strong> life. Infrastructure includes communicationtechnology such as phone lines or Internet access, vital services suchas public water supplies and sewer treatment facilities, and includes anarea's transportation system such as airports, heliports; highways,bridges, tunnels, roadbeds, overpasses, railways, bridges, rail yards,depots; and waterways, canals, locks, seaports, ferries, harbors,drydocks, piers and regional dams.A measure <strong>of</strong> the effects <strong>of</strong> a hazard event at a particular place.A general term covering a wide variety <strong>of</strong> mass-movement landformsand processes involving the downslope transport, under gravitationalinfluence, <strong>of</strong> soil and rock material en masse.Lateral movements in a fractured mass <strong>of</strong> rock or soil which resultfrom liquefaction or plastic flow or subjacent materials.2006 PAGE E - 6
Natural <strong>Hazard</strong>s <strong>Mitigation</strong> PlanCity <strong>of</strong> <strong>Glendale</strong>, <strong>California</strong>Appendix E – GlossaryLiquefactionLoadsLowest floorMagnitudeMajor earthquakeMaximumMagnitudeEarthquake (Mmax)Maximum ProbableEarthquake (MPE)Moderate earthquake<strong>Mitigation</strong> planNational FloodInsurance Program(NFIP)National GeodeticVertical Datum <strong>of</strong>1929 (NGVD)Changing <strong>of</strong> soils (unconsolidated alluvium) from a solid state toweaker state unable to support structures; where the material behavessimilar to a liquid as a consequence <strong>of</strong> earthquake shaking. Thetransformation <strong>of</strong> cohesionless soils from a solid or liquid state as aresult <strong>of</strong> increased pore pressure and reduced effective stress.Forces or other actions that result from the weight <strong>of</strong> all buildingmaterials, occupants and their possessions, environmental effects,differential movement, and restrained dimensional changes.Permanent loads are those in which variations over time are rare or <strong>of</strong>small magnitude. All other loads are variable loads.Under the NFIP, the lowest floor <strong>of</strong> the lowest enclosed area(including basement) <strong>of</strong> a structure.A measure <strong>of</strong> the strength <strong>of</strong> a hazard event. The magnitude (alsoreferred to as severity) <strong>of</strong> a given hazard event is usually determinedusing technical measures specific to the hazard.Capable <strong>of</strong> widespread, heavy damage up to 50+ miles from epicenter;generally near Magnitude range 6.5 to 7.0 or greater, but can be less,depending on rupture mechanism, depth <strong>of</strong> earthquake, locationrelative to urban centers, etcThe highest magnitude earthquake a fault is capable <strong>of</strong> producingbased on physical limitations, such as the length <strong>of</strong> the fault or faultsegment.The design size <strong>of</strong> the earthquake expected to occur within a timeframe <strong>of</strong> interest, for example within 30 years or 100 years, dependingon the purpose, lifetime or importance <strong>of</strong> the facility.Magnitude/frequency relationships are based on historic seismicity,fault slip rates, or mathematical models. The more critical the facility,the longer the time period considered.Capable <strong>of</strong> causing considerable to severe damage, generally in therange <strong>of</strong> Magnitude 5.0 to 6.0 (Modified Mercalli Intensity
Natural <strong>Hazard</strong>s <strong>Mitigation</strong> PlanCity <strong>of</strong> <strong>Glendale</strong>, <strong>California</strong>Appendix E – GlossaryNational WeatherService (NWS)Non-coastal A zoneNor'easterNorth AmericanVertical Datum(NAVD)OutflowPeak GroundAcceleration (PGA)Peak floodPlanimetricPlanningPotentially activefaultProbabilityQuaternaryRecurrence intervalReinforced concreteRepetitive losspropertyPrepares and issues flood, severe weather, and coastal storm warningsand can provide technical assistance to Federal and state entities inpreparing weather and flood warning plans.The portion <strong>of</strong> the Special Flood <strong>Hazard</strong> Area in which the principalsource <strong>of</strong> flooding is run<strong>of</strong>f from rainfall, snowmelt, or a combination<strong>of</strong> both. In non-coastal A zones, flood waters may move slowly orrapidly, but waves are usually not a significant threat to buildings. SeeA zone and coastal A zone. (Note: the National Flood Insurance Programregulations do not differentiate between non-coastal A zones andcoastal A zones.)An extra-tropical cyclone producing gale-force winds andprecipitation in the form <strong>of</strong> heavy snow or rain.Datum used as a basis for measuring flood, ground, and structuralelevations. NAVD is used in many recent Flood Insurance Studiesrather than the National Geodetic Vertical Datum.Follows water inundation creating strong currents that rip atstructures and pound them with debris, and erode beaches and coastalstructures.The greatest amplitude <strong>of</strong> acceleration measured for a singlefrequency on an earthquake accelerogram. The maximum horizontalground motion generated by an earthquake. The measure <strong>of</strong> thismotion is the acceleration <strong>of</strong> gravity (equal to 32 feet per secondsquared, or 980 centimeter per second squared), and generallyexpressed as a percentage <strong>of</strong> gravity.The highest discharge or stage value <strong>of</strong> a flood.Describes maps that indicate only man-made features like buildings.The act or process <strong>of</strong> making or carrying out plans; the establishment<strong>of</strong> goals, policies and procedures for a social or economic unit.A fault showing evidence <strong>of</strong> movement within the last 1.6 millionyears (750,000 years according to the U.S. Geological Survey) butbefore about 11,000 years ago, and that is capable <strong>of</strong> generatingdamaging earthquakes.A statistical measure <strong>of</strong> the likelihood that a hazard event will occur.The second period <strong>of</strong> the Cenozoic era, consisting <strong>of</strong> the Pleistoceneand Holocene epochs; covers the last approximately two million years.The time between earthquakes <strong>of</strong> a given magnitude, or within agiven magnitude range, on a specific fault or within a specific area.Structural concrete reinforced with steel bars.A property that is currently insured for which two or more NationalFlood Insurance Program losses (occurring more than ten days apart)<strong>of</strong> at least $1000 each have been paid within any 10-year period since1978.2006 PAGE E - 8
Natural <strong>Hazard</strong>s <strong>Mitigation</strong> PlanCity <strong>of</strong> <strong>Glendale</strong>, <strong>California</strong>Appendix E – GlossaryReplacement valueRetr<strong>of</strong>itRichter scaleRiskRiverineScaleScarpScourSedimentSeicheSeismicitySlumpSpecial Flood<strong>Hazard</strong> Area (SFHA)The cost <strong>of</strong> rebuilding a structure. This is usually expressed in terms<strong>of</strong> cost per square foot, and reflects the present-day cost <strong>of</strong> labor andmaterials to construct a building <strong>of</strong> a particular size, type and quality.Any change made to an existing structure to reduce or eliminatedamage to that structure from flooding, erosion, high winds,earthquakes, or other hazardsA numerical scale <strong>of</strong> earthquake magnitude devised by seismologistC.F. Richter in 1935. Seismologists no longer use this magnitudescale because <strong>of</strong> limitations in how it measures large earthquakes, andprefer instead to use moment magnitude as a measure <strong>of</strong> the energyreleased during an earthquake.The estimated impact that a hazard would have on people, services,facilities, and structures in a community; the likelihood <strong>of</strong> a hazardevent resulting in an adverse condition that causes injury or damage.Risk is <strong>of</strong>ten expressed in relative terms such as a high, moderate orlow likelihood <strong>of</strong> sustaining damage above a particular threshold dueto a specific type <strong>of</strong> hazard event. It also can be expressed in terms <strong>of</strong>potential monetary losses associated with the intensity <strong>of</strong> the hazard.Of or produced by a river.A proportion used in determining a dimensional relationship; the ratio<strong>of</strong> the distance between two points on a map and the actual distancebetween the two points on the earth's surface.A steep slope.Removal <strong>of</strong> soil or fill material by the flow <strong>of</strong> floodwaters. The term isfrequently used to describe storm-induced, localized conical erosionaround pilings and other foundation supports where the obstruction <strong>of</strong>flow increases turbulence.Solid fragmental material that originates from weathering <strong>of</strong> rocksand is transported or deposited by air, water, ice, or that accumulatesby other natural agents, such as chemical precipitation from solution,and that forms in layers on the Earth's surface in a loose,unconsolidated form.A free or standing-wave oscillation <strong>of</strong> the surface <strong>of</strong> water in anenclosed or semi-enclosed basin (such as a lake, bay, or harbor), that isinitiated chiefly by local changes in atmospheric pressure, aided bywinds, tidal currents, and earthquakes, and that continues, pendulumfashion,for a time after cessation <strong>of</strong> the originating force.Describes the likelihood <strong>of</strong> an area being subject to earthquakes.A landslide characterized by a shearing and rotary movement <strong>of</strong> agenerally independent mass <strong>of</strong> rock or earth along a curved slipsurface.Under the National Flood Insurance Program, an area having specialflood, mudslide (i.e., mudflow) and/or flood-related erosion hazards,and shown on a Flood <strong>Hazard</strong> Boundary Map or Flood Insurance RateMap as Zone A, AO, A1-A30, AE, A99, AH, V, V1-V30, VE, M or E.2006 PAGE E - 9
Natural <strong>Hazard</strong>s <strong>Mitigation</strong> PlanCity <strong>of</strong> <strong>Glendale</strong>, <strong>California</strong>Appendix E – GlossaryStafford Act<strong>State</strong> <strong>Hazard</strong><strong>Mitigation</strong> Officer(SHMO)Structural engineerStructureSubstantial damageSuper typhoonSurface faultingTectonic plateTopographicTornadoTropical cycloneTropical depressionThe Robert T. Stafford Disaster Relief and Emergency AssistanceAct, PL 100-107 was signed into law November 23, 1988 andamended the Disaster Relief Act <strong>of</strong> 1974, PL 93-288. The Stafford Actis the statutory authority for most Federal disaster response activities,especially as they pertain to FEMA and its programs.The representative <strong>of</strong> state government who is the primary point <strong>of</strong>contact with FEMA, other state and Federal agencies, and local units<strong>of</strong> government in the planning and implementation <strong>of</strong> pre- andpostdisaster mitigation activities.A licensed civil engineer certified by the <strong>State</strong> as qualified to designand supervise the construction <strong>of</strong> engineered structures.Something constructed, such as a building, or part <strong>of</strong> one. Forfloodplain management purposes under the National flood InsuranceProgram, a walled and ro<strong>of</strong>ed building, including a gas or liquidstorage tank, that is principally above ground, as well as amanufactured home. For insurance coverage purposes under theNFIP, structure means a walled and ro<strong>of</strong>ed building, other than a gasor liquid storage tank, that is principally above ground and affixed toa permanent site, as well as a manufactured home on a permanentfoundation. For the latter purpose, the term includes a building whilein the course <strong>of</strong> construction, alteration, or repair, but does notinclude building materials or supplies intended for use in suchconstruction, alteration, or repair, unless such materials or suppliesare within an enclosed building on the premises.Damage <strong>of</strong> any origin sustained by a structure in a Special Flood<strong>Hazard</strong> Area whereby the cost <strong>of</strong> restoring the structure to its beforedamagedcondition would equal or exceed 50 percent <strong>of</strong> the marketvalue <strong>of</strong> the structure before the damage.A typhoon with maximum sustained winds <strong>of</strong> 150 mph or more.The differential movement <strong>of</strong> two sides <strong>of</strong> a fracture – in other words,the location where the ground breaks apart. The length, width, anddisplacement <strong>of</strong> the ground characterize surface faults.Torsionally rigid, thin segments <strong>of</strong> the earth's lithosphere that may beassumed to move horizontally and adjoin other plates. It is the frictionbetween plate boundaries that cause seismic activity.Characterizes maps that show natural features and indicate thephysical shape <strong>of</strong> the land using contour lines. These maps may alsoinclude manmade features.A violently rotating column <strong>of</strong> air extending from a thunderstorm tothe ground.A generic term for a cyclonic, low-pressure system over tropical orsubtropical waters.A tropical cyclone with maximum sustained winds <strong>of</strong> less than 39mph.2006 PAGE E - 10
Natural <strong>Hazard</strong>s <strong>Mitigation</strong> PlanCity <strong>of</strong> <strong>Glendale</strong>, <strong>California</strong>Appendix E – GlossaryTropical stormTsunamiTyphoonUnconsolidatedsedimentsVulnerabilityVulnerabilityassessmentWildfireZoneA tropical cyclone with maximum sustained winds greater than 39mph and less than 74 mph.Great sea wave produced by a submarine earthquake, landslide, orvolcanic eruption.A special category <strong>of</strong> tropical cyclone peculiar to the western NorthPacific Basin, frequently affecting areas in the vicinity <strong>of</strong> Guam andthe North Mariana Islands. Typhoons whose maximum sustainedwinds attain or exceed 150 mph are called super typhoons.A deposit that is loosely arranged or unstratified, or whose particlesare not cemented together, occurring either at the surface or at depth.Describes how exposed or susceptible to damage an asset is.Vulnerability depends on an asset's construction, contents, and theeconomic value <strong>of</strong> its functions. Like indirect damages, thevulnerability <strong>of</strong> one element <strong>of</strong> the community is <strong>of</strong>ten related to thevulnerability <strong>of</strong> another. For example, many businesses depend onuninterrupted electrical power – if an electric substation is flooded, itwill affect not only the substation itself, but a number <strong>of</strong> businesses aswell. Often, indirect effects can be much more widespread anddamaging than direct ones.The extent <strong>of</strong> injury and damage that may result from a hazard event<strong>of</strong> a given intensity in a given area. The vulnerability assessmentshould address impacts <strong>of</strong> hazard events on the existing and futurebuilt environment.An uncontrolled fire spreading through vegetative fuels, exposing andpossibly consuming structures.A geographical area shown on a Flood Insurance Rate Map (FIRM)that reflects the severity or type <strong>of</strong> flooding in the area.2006 PAGE E - 11
Natural <strong>Hazard</strong>s <strong>Mitigation</strong> PlanCity <strong>of</strong> <strong>Glendale</strong>, <strong>California</strong>APPENDIX F:Appendix F – <strong>California</strong> DisastersCALIFORNIA DISASTERSSINCE 1950<strong>State</strong> Federal # <strong>of</strong> # <strong>of</strong> Cost <strong>of</strong><strong>Hazard</strong> Type Disaster Name Disaster # Year Counties and Cities Declared Declaration Declaration Deaths Injuries DamageFlood Floods OCD 50-01 1950 <strong>State</strong>wide 11/21/50 Not declared 9 $32,183,000Flood Fire, Flood, and DR-28 1954 Los Angeles, San Bernardino 2/5/54 2/5/54 Not AvailErosionFlood Floods DR-47 1955 <strong>State</strong>wide 12/22/55 12/23/55 74 $200,000,000Fire Fires DR-65 1956 Los Angeles (Malibu area), Ventura 12/29/56 1 Several $70,000,000hundredSevere Storm, Unseasonal and N/A 1957 Cherry producing areas <strong>of</strong> Northern 5/20/57 Not declared 2 $6,000,000Economic Heavy Rainfall<strong>California</strong>Fire Fires CDO 58-01 1958 Los Angeles 1/3/58 Not declared 1 23 Not availableTsunami High Tides CDO 58-02 1958 City <strong>of</strong> Imperial Beach, San Diego 1/31/58 Not declared Not availableCountyFlood Storm & Flood CDO 58-03 1958 Northern <strong>California</strong> (Southern 2/26/58 Not declared Not availableDamageboundaries <strong>of</strong> Santa Cruz, Santa Clara,Stanislaus, Tuolumne, Alpine countiesto the Oregon border)Flood Storm & FloodDamageN/A 1958 <strong>State</strong>wide 4/2/58 82 13 $24,000,000Flood,LandslidePotential FloodDamage andLandsides as aResult <strong>of</strong> FiresCDO 59-01 1959 Los Angeles 1/8/59 Not declared NotapplicableSevere Storm Unseasonal and N/A 1959 Tokay grape producing areas <strong>of</strong> 9/17/59 Not declared 2 $100,000Heavy RainfallNorthern <strong>California</strong>Fire Major andN/A 1960 Los Angeles, San Bernardino 7/21-22/60 Not declared 12 $10,000,000Widespread FiresFire Major andN/A 1960 Lassen Plumas, Shasta, Sierra,8/16/60 Not declared $3,075,000Widespread FiresTehamaFire Bel Air Fires DR-119 1961 Los Angeles 11/16/61 103 Between$50,000,000-$100,000,000Fire Widespread Fires N/A 1961 Amador, Butte, El Dorado, Napa, 9/8/61 Not declared $5,696,813Nevada, Placer, San Diego, Sonoma,TehamaFlood High Tides and N/A 1961 Ventura 1/16/61 Not declared Not availableWaves Caused ByStorms At SeaFlood Flood and DR-122 1962 Los Angeles, Ventura 2/16/62 & 3/6/62 Not availableRainstorm2/23/62Fire Fires andExplosionsN/A 1962 Alameda 9/14/62 Not declared 1 12 $500,000FloodFloodFloodSevere Storm,FloodFloodFireFire,WindstormFlood andRainstormBaldwin Hills DamFailureHigh Tides andHeavy SurfAbnormally Heavyand ContinuousRainfallFlood andRainstormMajor WidespreadFires (WeldonFire)Major andWidespread Fires1962 Alameda, Butte, Contra Costa, Modoc,Napa San Mateo, Sierra, Sutter, Yuba,Placer, Trinity, Lassen10/17/62,10/25/62,10/30,62, &11/4/62138(10/24/62)2006 PAGE F - 1$4,000,000DR-161 1963 Los Angeles 12/16/63 12/21/63 $5,233,203N/A 1963 Orange, City <strong>of</strong> Redondo Beach Not declared 5 $500,000N/A 1963 Northern <strong>California</strong> (boundaries <strong>of</strong>San Luis Obispo, Ventura, LosAngeles, and San Bernardino countiesto the Oregon <strong>State</strong> LineUnknown 1963 Alpine, Nevada, Placer, Plumas,Sierra, Amador, Colusa, El Dorado,Glenn, Lake, Lassen, Tehama, SantaClara, Santa Cruz, Siskiyou, Yolo,Tulare, Mono, Trinity, Yuba2/14/64 Not declared NotAvailable2/7/63,2/26/63,2/29/63, &4/22/63145 (2/25/63) Not availableN/A 1964 Los Angeles 3/16/64 Not declared $2,000,000N/A 1964 Napa, Sonoma, Santa Barbara 9/22/64,9/23/64, &Not declared $16,500,000
Natural <strong>Hazard</strong>s <strong>Mitigation</strong> PlanCity <strong>of</strong> <strong>Glendale</strong>, <strong>California</strong>Appendix F – <strong>California</strong> Disasters<strong>State</strong> Federal # <strong>of</strong> # <strong>of</strong> Cost <strong>of</strong><strong>Hazard</strong> Type Disaster Name Disaster # Year Counties and Cities Declared Declaration Declaration Deaths Injuries Damageand Excessively9/25/64High WindsFlood Storms N/A 1964 Los Angeles 4/3/64 Not declared 1,610,300Severe Storm, Abnormally Heavy N/A 1964 Humboldt 2/10/64 Not declared $1,407,000Flood and ContinuousTsunamiFloodRainfallTsunami Causedby 1964Earthquake inAlaska1964 Late WinterStormsN/A 1964 Marin 9/15/64 Not declared NotapplicableUnknown 1964 Del Norte, Humboldt, Shasta,Mendocino, Colusa, Glenn, Lassen,Plumas, Sierra, Siskiyou, Sonoma,Sutter, Tehama, Trinity, Amador,Butte, El Dorado, Modoc, Nevada,Placer, Yuba, Alpine, Lake,Sacramento, Yolo, Marin12/22/64,12/23/64,12/28/64,1/5/65, &1/1/6512/29/64 $213,149,000Tsunami Tsunami Caused Unknown 1964 Del Norte 3/28/64 169 (4/1/64) 12 $10,000,000by AlaskaEarthquakeCivil Unrest Riots N/A 1965 Los Angeles 8/14/65 Not declared 32 874 $44,991,000Fire Major andN/A 1965 Marin, Napa, Placer, Solano, Sonoma 9/18/65 Not declared Not availableFlood,LandslideWidespread FiresFlooding and HillSlides Caused byHeavy RainsN/A 1965 City <strong>of</strong> Burbank, Los Angeles 1/5/65 Not declared NotAvailableLandslide Slide Damage N/A 1965 City <strong>of</strong> Los Angeles 6/21/65 Not declared $6,488,600Flood, Severe 1965 Heavy1965 Riverside, San Bernardino, Ventura, 11/24/65, 12/7/65 $21,843,739Storm RainfallSan Diego11/26/65,12/23/65Flood Continuous DR-211 1966 Humboldt 1/14/66 212 (1/22/66) $6,918,000.0Rainfall0Civil Unrest Riots N/A 1966 San Francisco 9/27/66 Not declared 42 Not availableLandslide Earth slides N/A 1966 Redwood City 12/16/66 Not declared $100,000Flood 1966 Winter1/2/67 $28,761,041.Storms00Unknown 1966 Kern, Riverside, Tulare, SanBernardino, San Luis Obispo,Monterey, City <strong>of</strong> Escondido, Inyo12/9/66,12/13/66,12/16/66,12/16/66, &12/23/66Fire Major andN/A 1967 Los Angeles, Orange, San Diego, 1/7/67 Not declared $11,345,000Widespread FiresVenturaCivil Unrest Riots and OtherConditionsN/A 1968 City <strong>of</strong> Richmond 8/2/68 Not declared NotapplicableCivil Unrest Riots N/A 1969 City <strong>of</strong> Berkeley 2/5/69 Not declared 0 20 Not availableFreeze Extremely Severe N/A 1969 San Diego 2/5/69 Not declared $10,000,000Weather; FreezingHazMat Major Oil Spill N/A 1969 Coastal Areas <strong>of</strong> Southern <strong>California</strong> Not declared Not availableFlood 1969 Storms Unknown 1969 Los Angeles, San Luis Obispo, Fresno,Inyo, Riverside, San Bernardino, SantaBarbara, Tulare, Ventura, Amador, ElDorado, Kern, Kings, Madera, Modoc,Mono, Monterey, Orange, Placer,Sacramento, San Joaquin, Shasta,Solano, Stanislaus, Tuolumne,Mariposa, Merced, Calaveras, SanBenito, Sierra, Contra Costa,Humboldt, Mendocino, Sonoma,Plumas, Tehama, Yuba, Butte, Marin,Yolo1/23/69,1/25,69,1/28/69,1/29/69,2/8/69,2/10/69,2/16/69,3/12/691/26/69 47 161 $300,000,000Flood Heavy SnowRun<strong>of</strong>f1969 Kings 1/28/96 8/15/69 $2,812,500.00Civil Unrest Riots andN/A 1970 Santa Barbara 2/26/70 Not declared 12+ $300,000DisordersFire Large Fire N/A 1970 City <strong>of</strong> Sonora, Tuolumne 2/26/70 Not declared $2,300,000Fire Widespread Fires N/A 1970 Riverside 12/22/70 Not declared $3,200,000Flood Storms and Floods N/A 1970 Contra Costa 4/10/70 Not declared Not availableFreezeFreezingConditionsN/A1970 Napa, Sonoma, Mendocino, SanJoaquin, Lake5/1/70,5/19/70,6/8/70,Not declared $19,749,2002006 PAGE F - 2
Natural <strong>Hazard</strong>s <strong>Mitigation</strong> PlanCity <strong>of</strong> <strong>Glendale</strong>, <strong>California</strong>Appendix F – <strong>California</strong> Disasters<strong>State</strong> Federal # <strong>of</strong> # <strong>of</strong> Cost <strong>of</strong><strong>Hazard</strong> Type Disaster Name Disaster # Year Counties and Cities Declared Declaration Declaration Deaths Injuries Damage6/10/70,7/24/70Landslide Slide Damage N/A 1970 City <strong>of</strong> Oakland 2/10/70 Not declared $11,500,000Caused by HeavyRains and StormsLandslide Slide Damage N/A 1970 City <strong>of</strong> Los Angeles 3/10/70 Not declared $8,500,000Caused by HeavyRains and StormsFlood Northern<strong>California</strong>Flooding2/16/70 $27,657,478Unknown 1970 Butte, Colusa, Glenn, Lake, Lassen,Marin, Modoc, Plumas, Shasta,Siskiyou, Tehama, Trinity, Sutter,Yuba, Del Norte, Alameda, El Dorado,MendocinoFire <strong>State</strong>wide Fires 1970 City <strong>of</strong> Oakland, Los Angeles,Ventura, San Diego, Kern, SanBernardino, Monterey, Riverside1/26/60,2/3/60,2/10/60,3/2/609/24/70,9/28/70,10/1/70,10/2/70,10/20/70,11/14/709/29/70 19 $223,611,000Earthquake San Fernando DR-299 1971 Los Angeles 2/9/71 2/9/71 58 2,000 $483,957,000EarthquakeFire Widespread Fires N/A 1971 Santa Barbara 10/13/71 Not declared 4 $9,000,000Flood High Ocean Tidesand Wind-drivenWavesN/A 1971 Ventura 5/19/71 Not declared $250,000Flood 1972 Storms DR-316 1972 Santa Barbara 1/3/72 2/11/72 $2,660,000Flood Andrus island DR-342 1972 Sacramento 6/21/72 6/27/72 $23,681,630Levee BreakAgricultural Exotic Newcastle N/A 1972 Los Angeles, Orange, Riverside, San 4/10/72, Not declared $10,000,000Disease EpidemicBernardino, San Diego, Ventura,Santa Barbara5/22/72Drought DroughtN/A 1972 Glenn, San Benito, Santa Clara 7//73 Not declared $8,000,000ConditionsFlood Heavy Rains and N/A 1972 Monterey 10/24/72 Not declared $720,000Mud SlidesSevere Storm Severe WeatherConditionsN/A 1972 Sutter 9/3/72 Not declared $2,004,300Severe Storm,FreezeFreeze and SevereWeatherConditionsN/A1972 Fresno, Kings, Tulare, Merced, Kern,Madera, San Benito, Stanislaus, ElDorado, Tehama, Placer, Nevada, SanJoaquin, Colusa, Siskiyou, Modoc,Santa ClaraFlood 1972 ContinuingStormsFlood Coastal Flooding DR-364 1973 Marin, San Luis Obispo, City <strong>of</strong> SouthSan Francisco, Santa Barbara, Solano,VenturaFireSouthern PacificRailroad Fires andExplosions(Roseville)4/17/72,5/22/72,5/22/72,5/31/72Not declared $111,517,2601972 Del Norte, Humboldt 2/28/72 4/5/72 $6,817,6181/23/73,1/30/73,2/8/73,2/28/732/3/73 $17,998,250N/A 1973 Sacramento, placer 4/30/73 Not declared 0 37 $2,925,000Fire Boulder Fire N/A 1973 San Diego 12/12/73 Not declared 0 $215,700Flood High Ocean Tides N/A 1973 Ventura 2/1/73 Not declared $1,027,000and Wind-drivenWavesFlood Storms and Floods N/A 1973 Colusa, Glenn, Napa, Placer, Sutter, 2/28/73 Not declared $1,864,000YubaFlood Storms and Floods N/A 1973 Mendocino 3/15/73 Not declared $1,523,200Flood Storms and Floods N/A 1973 City <strong>of</strong> Pacifica 4/11/73 Not declared $700,000Freeze Freeze N/A 1973 Butte 2/28/73 Not declared $300,000Freeze,EconomicEucalyptus TreeFreezeUnknown 1973 Alameda, Contra Costa 4/4/73 5/25/73 $8,000,000to$10,000,000Fire Fires N/A 1973 Los Angeles 7/16/73 Not declared $1,300,000Flood Storms DR-412 1974 Humboldt, Shasta, Siskiyou, Trinity, 1/17/74, 1/25/74 $35,192,500Glenn, Mendocino, Tehama1/18/74Flood Storms DR-432 1974 Mendocino 4/23/74 5/7/74 $4,475,900Economic Gasoline N/A 1974 Alameda, Contra Costa, Los Angeles, 2/28/74, Not declared2006 PAGE F - 3
Natural <strong>Hazard</strong>s <strong>Mitigation</strong> PlanCity <strong>of</strong> <strong>Glendale</strong>, <strong>California</strong>Appendix F – <strong>California</strong> Disasters<strong>State</strong> Federal # <strong>of</strong> # <strong>of</strong> Cost <strong>of</strong><strong>Hazard</strong> Type Disaster Name Disaster # Year Counties and Cities Declared Declaration Declaration Deaths Injuries DamagePurchasingProblemsOrange, Riverside, San Mateo, Solano,Santa Clara, Ventura3/4/74,3/10/74Flood Storms N/A 1974 Santa Cruz 2/28/74 Not declared $763,267Fire Fires N/A 1975 Los Angeles 11/24/75 Not declared $19,486,960Drought Drought N/A 1976 Alpine, Calaveras, Colusa, Fresno,Glenn, Madera, Merced, San Diego,2/9/76,2/13,76,Not declared $2,664,000,000San Joaquin, Solano, Stanislaus,Sutter, Tuolumne, Alameda, Butte,Contra Costa, Kings, Los Angeles,Riverside, San Luis Obispo, Tulare,Yolo, Amador, Monterey, Napa,Nevada, San Benito, San Bernardino,Tehama, San Mateo, Marin2/24/76,3/26/76,7/6/76Severe Storm 1976 High Winds DR-521 1976 Imperial, Riverside, San Bernardino, 9/13/76, 9/21/76 $120,132,771and FloodingSan Diego9/22/76Fire Sycamore Fire N/A 1977 Santa Barbara 7/27/77 Not declared 0 $25,540,755Flood Imperial County N/A 1977 Imperial 8/23/77 Not declared $28,498,469FloodingFlood, Threat <strong>of</strong>N/A 1977 Monterey, Riverside 9/8/77 Not declared $6,110,000Landslide Floods/Mud SlidesSevere Storm Storms N/A 1977 San Diego, Kern, Humboldt, City <strong>of</strong>Arvin1/10/78,12/23/77,1/22/77,12/21/77Not declared $38,009,035Landslide Laguna Landslide DR-566 1978 City <strong>of</strong> Laguna Beach 10/5/78 10/9/78 $16,595,000Fire 1978 Los Angeles EM-3067 1978 Los Angeles 10/24/78 10/29/78 1 $61,279,374FireEarthquake Santa Barbara N/A 1978 Santa Barbara 8/15/78 Not declared 0 65 $12,987,000EarthquakeMiscellaneous PSA Air Crash N/A 1978 City <strong>of</strong> San Diego 1/15/79 Not declared 150Severe Storm Storms N/A 1978 Humboldt, Mendocino, Santa Cruz 1/27/78, Not declared $6,126,4091/20/78Severe Storm StormsUnknown 1978 Inyo, Mono, San Diego, San Luis 3/9/78, 2/15/78 14 21 $117,802,785Obispo, Kings, Monterey, Kern, LosAngeles, Orange, Riverside, SanBernardino, Santa Barbara, Tulare,Ventura2/27,78,2/13/78Severe Storm Severe Storms DR-594 1979 Riverside 7/26/80 7/27/79 $25,867,100Earthquake ImperialDR-609 1979 Imperial 10/16/79 10/16/79 0 91 $21,197,250EconomicEarthquakeGasoline ShortageEmergencyN/A1979 Alameda, Contra Costa, Los Angeles,Marin, Monterey, Orange, Riverside,San Francisco, San Diego, SantaClara, Santa Cruz, San Mateo,Ventura, San Bernardino, Sonoma,Contra Costa, Los Angeles, Orange,Santa ClaraFire Fires N/A 1979 Santa Barbara, Ventura, Los Angeles,El DoradoFlood1980 WinterStormsDR-6151980 Santa Barbara, Los Angeles, Orange,Riverside, Ventura, San Bernardino,San Diego5/8/79 -11/13/799/28/79,9/21/79,9/20/792/21/80,2/7/80Not declaredNot declared $9,970,1192/21/80Flood Jones Tract Levee DR-633 1980 San Joaquin 9/30/80 9/30/80 $21,510,956BreakFire SouthernDR-635 1980 San Bernardino, Los Angeles, Orange, 11/18/80 11/18/80 $64,795,200<strong>California</strong> FiresRiversideFlood Delta Levee Break EM-3078 1980 Contra Costa, Sacramento, San 1/23/80 1/23/80 $17,388,013JoaquinEarthquake Owens Valley N/A 1980 Mono 5/28/80 Not declared 0 9 $2,000,000EarthquakeFlood Storms N/A 1980 Stanislaus, Monterey, Solano, Santa 3/5/80 Not declared $316,640,817CruzEconomic MediterraneanFruit FlyInfestationN/A 1981 Contra Costa, Los Angeles, SanBenito, Stanislaus, Santa Cruz, SanMateo8/8/81 -9/25/81Not declared $22,000,000Fire Atlas Peak Fire N/A 1981 Napa 6/24/81 Not declared 0 $31,000,000Flood 1982 Winter DR-651 1982 Alameda, Santa Clara, Solano, San 1/5/82 - 1/7/82 33 481 $273,850,000StormsJoaquin, Contra Costa, Humboldt, 1/9/822006 PAGE F - 4
Natural <strong>Hazard</strong>s <strong>Mitigation</strong> PlanCity <strong>of</strong> <strong>Glendale</strong>, <strong>California</strong>Appendix F – <strong>California</strong> Disasters<strong>State</strong> Federal # <strong>of</strong> # <strong>of</strong> Cost <strong>of</strong><strong>Hazard</strong> Type Disaster Name Disaster # Year Counties and Cities Declared Declaration Declaration Deaths Injuries DamageMarin, San Mateo, Santa Cruz,SonomaFire Orange Fire DR-657 1982 Orange, City <strong>of</strong> Redondo Beach 4/21/82 4/21/82 $50,877,040Flood McDonald IslandLevee BreakDR-669 1982 MacDonald Island 8/24/82 8/24/82 $11,561,870DR-6771982, 1983 2/9/83 0 0 $523,617,032Flood, SevereStormAgricultural1982-83 WinterStormsRains CausingAgriculturalLossesN/A1982 Contra Costa, San Joaquin,Sacramento, Marin, San Mateo, LosAngeles, San Diego, Alameda, Orange,San Benito, Santa Barbara, SantaClara, Santa Cruz, Shasta, Sonoma,Ventura, Trinity, Colusa, Lake,Mendocino, Monterey, San LuisObispo, Solano, Yolo, Butte, Glenn,Kern, Kings, San Bernardino, Sutter,Tehama, Merced, Del Norte, Fresno,madera, Napa, Placer, Riverside,Stanislaus, Tulare, Humboldt,Mariposa, Nevada, Yuba1982 Fresno, Madera, Merced, Monterey,kenr Tulare, Sacramento, San Joaquin,Solano, Stanislaus, Yolo10/26/82 Not declared $345,195,974Fire Dayton Hills Fire N/A 1982 Los Angeles, Orange, Ventura 10/10/82 Not declared 0 $19,277,102Flood, High Tides, N/A 1982 Contra Costa, Sacramento, San 12/8/82 Not declared $6,964,998Windstorm Strong Winds, andRainsJoaquinSevere Storm, Heavy Rains/ N/A 1982 Inyo 9/27/82 Not declared $6,161,320Flood FloodingFlood Winter Storms Unknown 1982 Contra Costa, San Joaquin,Sacramento, Marin, San Mateo, LosAngeles, San Diego, Alameda, orange,San Benito, Santa Barbara, SantaClara, Santa Cruz, Shasta, Sonoma,Ventura, Trinity, Colusa, LakeMendocino, Monterey, San LuisObispo, Solano, Yolo, Butte, Glenn,Kern, Kings, San Bernardino, Sutter,Tehama, Merced, Del Norte, Fresno,Madera, Napa, Placer, Riverside,Stanislaus, Tulare, Humboldt,Mariposa, Nevada, Yuba12/8/82-3/21/832/9/83 $523,617,032Earthquake CoalingaDR-682 1983 Fresno 5/2/83 5/3/83 0 47 $31,076,300EarthquakeFlood Colorado River DR-682 1983 Riverside, San Bernardino, Imperial 6/23/83, 7/1/83 $4,640,315Flooding6/28/83Flood 1983 Summer DR-690 1983 Inyo, Riverside, San Bernardino 8/29/83 8/29/83 3 $34,689,155StormsEconomic Mexican Fruit Fly N/A 1983 Los Angeles 11/4/83 Not declaredSevere Storm, Levee Failure, N/A 1983 Contra Costa, Alameda 12/9/83, Not declared $10,909,785Flood High Winds, HighTides, Floods,Storms, WindDriven Water1/18/84Earthquake Morgan Hill EM-4043 1984 Santa Clara 4/25/84 0 27 $7,265,000EarthquakeSevere Storm Storms N/A 1984 Kern, Riverside, Tulare, SanBernardino, San Luis Obispo,Not declared $1,600,000Monterey, City <strong>of</strong> Escondido, InyoFire <strong>State</strong>wide Fires DR-739 1985 San Diego, City <strong>of</strong> Lost Angeles, SanLuis Obispo, Monterey, Santa Clara,Santa Cruz, Ventura7/1/85 -7/11/854/25/84 3 470 $64,845,864Fire Wheeler Fire N/A 1985 Ventura 10/14/85 Not declared 1 2Miscellaneous HydrillaN/A 1985 Shasta 9/13/85 Not declaredProliferationSevere Storm Storms DR-758 1986 Humboldt, Napa, Sonoma, Glenn,Lake, Marin, Modoc, Sacramento,Santa Clara, Santa Cruz, Solano, Yuba,Alpine, Amador, Butte, Calaveras,Colusa, El Dorado, Lassen,Mendocino, Nevada, Placer, Plumas,San Joaquin, Sierra, Sutter, Tehama,2/18-86 -3/12/862/18/86 13 $407,538,9042006 PAGE F - 5
Natural <strong>Hazard</strong>s <strong>Mitigation</strong> PlanCity <strong>of</strong> <strong>Glendale</strong>, <strong>California</strong>Appendix F – <strong>California</strong> Disasters<strong>State</strong>DeclarationFederalDeclaration# <strong>of</strong>Deaths# <strong>of</strong>Injuries2006 PAGE F - 6Cost <strong>of</strong>Damage<strong>Hazard</strong> Type Disaster Name Disaster # Year Counties and Cities DeclaredTuolumne, Yolo, Fresno, Madera, SanMateo, Alameda, Contra Costa, DelNorte, Trinity, Mono, San Benito,ShastaFlood Heavy Rains N/A 1986 Monterey, Siskyou 3/26/86 Not declared $400,000Miscellaneous Plane Crash N/A 1986 City <strong>of</strong> Cerritos 8/31/86 Not declared 67 2EarthquakeEarthquakeEconomicFireWhittierEarthquakeImperial CountyEarthquakeMediterraneanFruit FlyForest Fire - DelNorte Fire, PebbleBeachDR-799 1987 Monterey park, City <strong>of</strong> Whittier, Los 10/2/87 - 10/7/87 9 200 $358,052,144Angeles, Orange10/5/87N/A 1987 Imperial 11/23/87 Not declared 0 94 $2,638,833N/A 1987 Los Angeles 8/25/87 Not declaredN/A 1987 Monterey Not declared 0 8 $15,000,000Fire Acorn Fire N/A 1987 Alpine 8/3/87 Not declared 0 3 $8,500,000Fire Wildland Fires N/A 1987 Colusa, Del Norte, Butte, Fresno,Humboldt, Inyo, Kern, Lake, Lassen,Mariposa, Mendocino, Modoc, Mono,Nevada, Placer, Plumas, Riverside,San Bernardino, Shasta, Sierra,Siskiyou, Trinity, Tulare, Tuolumne9/10/87,9/3/87Not declared 3 76 $18,000,000EarthquakeLoma PrietaEarthquakeDR-8451989 Alameda, Monterey, San Benito, SanMateo, Santa Clara, Santa Cruz, SanFrancisco, Contra Costa, Marin, City<strong>of</strong> Isleton, City <strong>of</strong> Tracy, SolanoEconomic MediterraneanFruit FlyEconomic MediterraneanFruit FlyEconomic MediterraneanFruit FlyEconomic MediterraneanFruit FlyFire Santa Barbara DR-872 1990 Los Angeles, Santa Barbara, Riverside,FiresSan BernardinoFreeze Freeze DR-894 1990 Santa Cruz, Fresno, Glenn, imperial,Kern, Mendocino, Monterey,Riverside, San Benito, San Bernardino,San Diego, San Mateo, Santa Barbara,Santa Clara, Solano, Sonoma, Tulare,Ventura, Alameda, Butte, Colusa, LosAngeles, Madera, Marin, Merced,Napa, San Joaquin, San Luis Obispo,Sutter, Yolo, Yuba, Stanislaus,Tehama10/18/89 -10/30/89N/A 1989 Los Angeles 8/9/89 Not declaredN/A 1989 Santa Clara 9/6/89 Not declaredN/A 1989 San Bernardino 10/3/89 Not declaredN/A 1989 Orange 11/20/89 Not declaredFire Wildfires/N/A 1987 San Diego 11/19/87 Not declared $5,371,150Flooding/ MudSlidesSevere Storm Coastal Storms DR-812 1988 Los Angeles, Orange, San Diego 1/21/88 2/5/88 0Fire Fires - 49er, DR-815 1988 Shasta, Solano, Yuba, Nevada 9/11/88- 9/13/88 0 $31,247,534Miller, and Fern9/20/88Economic Mediterranean N/A 1988 Los Angeles 7/21/88 Not declaredFruit FlyFire Wildland Fires N/A 1988 Calaveras 7/21/88 Not declaredFire, Fire and Wind N/A 1988 City <strong>of</strong> Redondo Beach 6/15/88 Not declared 0 $25,000,000Windstorm Driven WavesFire, Fires/ High N/A 1988 Los Angeles 12/9/88 Not declared 0 2 $12,400,000Windstorm WindsSevere Storm Storms N/A 1988 Santa Barbara, City <strong>of</strong> SanBuenaventura1/26/88 Not declared $49,416,2006/28/90,6/29/9012/19/90-1/18/9110/18/89 63 3,757 $5,900,000,0006/30/90 3 89 $300,000,0002/11/91 $856,329,675Drought Drought N/A 1990 City <strong>of</strong> Santa Barbara 7/17/90 Not declaredDrought Drought N/A 1990 Santa Barbara 11/13/90 Not declaredEarthquake UplandN/A 1990 Los Angeles, San Bernardino 3/9/90, Not declared 0 38 $12,034,150Earthquake3/13/90Economic Mediterranean N/A 1990 Riverside 4/18/90 Not declaredFruit FlyEconomic Mexican Fruit Fly N/A 1990 Los Angeles, San Diego 5/14/90 Not declaredFire Finley Fire/ N/A 1990 Mariposa, Kern, Tehama 8/13/90, Not declared 1 84 $548,000,000
Natural <strong>Hazard</strong>s <strong>Mitigation</strong> PlanCity <strong>of</strong> <strong>Glendale</strong>, <strong>California</strong>Appendix F – <strong>California</strong> Disasters<strong>State</strong> Federal # <strong>of</strong> # <strong>of</strong> Cost <strong>of</strong><strong>Hazard</strong> Type Disaster Name Disaster # Year Counties and Cities Declared Declaration Declaration Deaths Injuries DamageYosemite Fire 8/14/90Severe Storm Severe Storms N/A 1990 Butte, Nevada 2/22/90 Not declared 1 17 $11,500,000Fire East Bay Hills Fire DR-919 1991 Alameda County 10/20/91 10/22/91 25 150 $1,700,000,000Economic Sweet potato N/A 1991 Imperial, Riverside Not declared $120,567,949WhiteflyHazMat Cantara Spill N/A 1991 Shasta, Siskyou 300 $38,000,000Severe Storm 1992 Winter DR-935 1992 Los Angeles, Ventura, City <strong>of</strong> Los 2/12/92, 2/25/92 5 $123,240,531StormsAngeles, kern, orange, San Bernardino 2/19/92Civil Unrest Los Angeles Civil DR-942 1992 Los Angeles 4/29/92 5/22/92 53 2,383 $800,000,000DisorderEarthquake Cape Mendocino DR-943 1992 Humboldt 4/25/92 5/5/92 0 356 $48,271,137EarthquakesEarthquake Big Bear - Landers DR-947 1992 Riverside, San Bernardino 6/28/92 6/28/92 1 $402 $91,079,376EarthquakesFire Shasta/Calaveras DR-958 1992 Calaveras, Shasta 8/21/92 8/29/92 0 $8 $54,108,500FloodFire1992 Late WinterStormsDR-9791992 Alpine, Los Angeles, Humboldt, Napa,Santa Barbara, Culver City, City <strong>of</strong>Los Angeles, Contra Costa,Mendocino, Sonoma, Fresno, imperial,Madera, Monterey, San Bernardino,Sierra, Tehama, Trinity, Tulare,Modoc, Orange, Riverside, Lassen,Siskiyou, Plumas, San Diego1/7/93 -2/19/931/15/93 20 10 $600,000,000HazMat Sewage Spill N/A 1992 San Diego, City <strong>of</strong> Chula Vista, City <strong>of</strong> 2/6/92, Not declaredCoronado, San Diego2/7/92Fire Southern<strong>California</strong>DR-1005 1993 Los Angeles, Ventura, San Diego,Orange, Riverside, San Bernardino10/27/93,10/28/9310/28/93 4 162 $1,000,000,000FirestormsEconomic Mediterranean N/A 1993 Riverside 5/21/94 Not declaredFruit FlyHazMat Tijuana River N/A 1993 San Diego 9/10/93 Not declaredPollutionHazMat New RiverN/A 1993 Imperial 10/6/93 Not declaredPollutionEarthquake NorthridgeEarthquakeDR-1008 1994 Los Angeles, Ventura, Orange 1/17/94,1/24/941/17/94 57 11,846 $40,000,000,000Economic Salmon fisheries DR-1038 1994 Del Norte, Humboldt, Mendocino, 5/20/94 9/20/94 $28,300,000SonomaEarthquake HumboldtN/A 1994 Humboldt 12/29/94 Not declared $1,300,000EarthquakeEconomic Mediterranean N/A 1994 Ventura 10/7/94 Not declaredFruit FlyFire San Luis Obispo N/A 1994 San Luis Obispo 8/24/94 Not declared 12 $6,382,235Fire - Hwy 41Severe Storm Severe WinterStormsSevere Storm, Late WinterFlood StormsFire Southern<strong>California</strong>FirestormsFlood January 1997FloodsDR-1044 1995 Los Angeles, Orange, Humboldt, Lake, Sonoma, Butte, Colusa, Contra Costa,Del Norte, Glenn, Kern, Lassen,Mendocino, Modoc, Monterey, Napa,placer, Plumas, San Luis Obispo,Santa Barbara, Santa Clara, SantaCruz, Tehama, Ventura, Yolo, Yuba,Alpine, Amador, Nevada, Riverside,Sacramento, San Bernardino, SanMateo, Shasta, Sutter, Trinity, SanDiego, Alameda, Marin, Fresno,Kings, El Dorado, Madera, Solano,Siskiyou1/6/95 -3/14/951/13/95 11 $741,400,000DR-1046 1995 All counties except Del Norte 1/10/95 17 $1,100,000,000EM-3120 1996 Los Angeles, Orange, San Diego 10/1/96 5 $40,000,0002003 Alpine, Amador, Butte, Colusa, DelNorte, El Dorado, Glenn, Humboldt,Lake, Lassen, Modoc, Napa, Nevada,Plumas, Sacrament, San Joaquin,Sierra, Siskiyou, Solano, Sonoma,1/2/97 -1/31/972006 PAGE F - 78 $1,800,000,000
Natural <strong>Hazard</strong>s <strong>Mitigation</strong> PlanCity <strong>of</strong> <strong>Glendale</strong>, <strong>California</strong>Appendix F – <strong>California</strong> Disasters<strong>Hazard</strong> Type Disaster Name Disaster # Year Counties and Cities DeclaredSutter, Tehama, Trinity, Yuba,Calaveras, Madera, Mono, Monterey,Placer, San Benito, San Luis Obispo,San Mateo, Santa Cruz, Shasta,Stanislaus, Tuolumne, Yolo, ContraCosta, Fresno, Marin, Tulare,Mariposa, Merced, Santa Clara,Alameda, San Francisco, Kings,Flood El Nino 1998 Alameda, Amador, Butte, Calaveras,Colusa, Contra Costa, Fresno, GlennHumboldt, Kern, Kings, Lake, LosAngeles, Marin, Mendocino, Merced,Monterey, Napa, Orange, Riverside,Sacramento, San Benito, SanBernardino, San Diego, San Francisco,San Joaquin, San Luis Obispo, SanMateo, Santa Barbara, Santa Clara,Santa Cruz, Siskiyou, Solano, Sonoma,Stanislaus, Sutter, Tehama, Trinity,Tulare, Ventura, Yolo, Yuba<strong>State</strong>DeclarationFreeze Freeze 1998 Fresno, Kern, Kings, Madera, Merced,Monterey, Tulare, VenturaFire Fire 1999 Various Counties 8/26/99Road Damage 1999 Sonoma 3/29/99Earthquake Earthquake 2000 Napa 9/6/00Drought Water Shortage 2001 City <strong>of</strong> Rio Dell 3/16/01FederalDeclaration2/9/99 2/9/99# <strong>of</strong>Deaths# <strong>of</strong>InjuriesCost <strong>of</strong>Damage17 $550,000,000Earthquake Sierra Madre N/A 2003 Los Angeles 7/5/91 Not declared 1 30 $33,500,000EarthquakeFire Widespread Fires N/A 2003 Madera Not declared 2 Not availableSevere Storm, Freeze and Snow N/A 2003 Lake 7/13/72 Not declared $357,000Freeze ConditionsDrought Drought 2003 Modoc, Siskiyou 5/4/01Economic Exotic Newcastle2003 15 Northern Counties 2/21/03Disease EpidemicEconomic Bark Beetle2003 San Bernardino, San Diego, Riverside 3/7/03InfestationFire Wildfire 2003 Calaveras 9/10/01Fire SouthernDR-1498 2003 Ventura, Los Angeles, San10/24-26/03 10/27/03 $317,000,000<strong>California</strong>WildfiresBernardino, Riverside, San DiegoEarthquake San Simeon DR-1505 2003 San Luis Obispo, Santa Barbara 12/23/03 1/13/04 $21,100,000EarthquakeFlood Levee Break DR-1529 2004 San Joaquin 6/4/04 6/30/04 $53,000,000Landslide La ConchitaMudslide2005 La Conchita, Ventura County 1/12/05 Not Declared 10 22Severe Storm, SouthernFlood, Debris <strong>California</strong> SevereFlow, StormMudslideSevere Storm,Flood, DebrisFlow,Landslide,MudslideSouthern<strong>California</strong> SevereStormSources:DR-1577 2005 Kern, Los Angeles, Orange, Riverside,San Bernardino, San Diego, SantaBarbara, Ventura1/6/05,1/15/05DR-1585 2005 Kern, San Bernardino and San Diego 1/15/05 4/22/052/4/05 22<strong>California</strong> Governor’s Office <strong>of</strong> Emergency Services (http://www.oes.ca.gov)FEMA (http://www.fema.gov/news/disasters.fema)2006 PAGE F - 8
Natural <strong>Hazard</strong>s <strong>Mitigation</strong> PlanCity <strong>of</strong> <strong>Glendale</strong>, <strong>California</strong>APPENDIX G:Appendix G – Los Angeles County DamsMAJOR DAMS INLOS ANGELES COUNTYFacility NameCASTAICPrimary Contact IDRoland WilliamsSecondary Contact IDBruce JacksonTypeERTHCA <strong>State</strong> Dam NumberNational IDCountyOwnerContact1-058CA00044LOS ANGELES<strong>State</strong> <strong>of</strong> <strong>California</strong>-WRDick ButlerCapacityStoragePct FullThomas Guide PageInundation Map Number4369-J39 -11323700Facility NamePEARBLOSSOM SPREADINGBASINPrimary Contact IDSecondary Contact IDRoland WilliamsBruce JacksonTypeERTHCA <strong>State</strong> Dam NumberNational IDCountyOwnerContact1-061CA00047LOS ANGELES<strong>State</strong> <strong>of</strong> <strong>California</strong>-WRArea Control Center - OperatorCapacityStoragePct FullThomas Guide PageInundation Map Number437-8106Facility NamePYRAMIDPrimary Contact IDRoland WilliamsSecondary Contact IDBruce JacksonTypeROCKCA <strong>State</strong> Dam NumberNational IDCountyOwnerContact1-066CA00052LOS ANGELES<strong>State</strong> <strong>of</strong> <strong>California</strong>-WRDick ButlerCapacityStoragePct FullThomas Guide PageInundation Map Number48 -31800002006 PAGE G - 1
Natural <strong>Hazard</strong>s <strong>Mitigation</strong> PlanCity <strong>of</strong> <strong>Glendale</strong>, <strong>California</strong>Appendix G – Los Angeles County DamsFacility NameJ W WISDAPrimary Contact IDBob HeidingerSecondary Contact IDGilbert HernandezTypeERTHCA <strong>State</strong> Dam NumberNational IDCountyOwnerContact1-067CA00053LOS ANGELES<strong>State</strong> <strong>of</strong> <strong>California</strong>-P&RBob HeidingerCapacityStoragePct FullThomas Guide PageInundation Map NumberN/A45Facility NameRESERVOIR NO 1Primary Contact IDAlbert LopezSecondary Contact IDKevin MitchellTypeERTHCA <strong>State</strong> Dam NumberNational IDCountyOwnerContact4-004CA00058LOS ANGELESCity <strong>of</strong> BurbankAlbert LopezCapacityStoragePct FullThomas Guide PageInundation Map Number533-H549 -121Facility NameRESERVOIR NO 4Primary Contact IDAlbert LopezSecondary Contact IDKevin MitchellTypeRECTCA <strong>State</strong> Dam NumberNational IDCountyOwnerContact4-006CA00059LOS ANGELESCity <strong>of</strong> BurbankAlbert LopezCapacityStoragePct FullThomas Guide PageInundation Map Number533-H650 -134Facility NameRESERVOIR NO 5Primary Contact IDAlbert LopezSecondary Contact IDKevin MitchellTypeRECTCA <strong>State</strong> Dam NumberNational IDCountyOwnerContact4-007CA00060LOS ANGELESCity <strong>of</strong> BurbankAlbert LopezCapacityStoragePct FullThomas Guide PageInundation Map Number 533-E351 -1772006 PAGE G - 2
Natural <strong>Hazard</strong>s <strong>Mitigation</strong> PlanCity <strong>of</strong> <strong>Glendale</strong>, <strong>California</strong>Appendix G – Los Angeles County DamsFacility NameBRAND PARKPrimary Contact IDMartin NixtSecondary Contact IDDonald R. FroelichTypeERTHCA <strong>State</strong> Dam NumberNational IDCountyOwnerContact5-000CA00061LOS ANGELESCity <strong>of</strong> <strong>Glendale</strong>Dennis MaxwellCapacityStoragePct FullThomas Guide PageInundation Map Number534-C68 -132Facility Name10TH AND WESTERNPrimary Contact IDMartin NixtSecondary Contact IDDonald R. FroelichTypeERTHCA <strong>State</strong> Dam NumberNational IDCountyOwnerContact5-004CA00062LOS ANGELESCity <strong>of</strong> <strong>Glendale</strong>Dennis MaxwellCapacityStoragePct FullThomas Guide PageInundation Map Number53446Facility NameCHEVY CHASE 968Primary Contact IDMartin NixtSecondary Contact IDDonald R. FroelichTypeERTHCA <strong>State</strong> Dam NumberNational IDCountyOwnerContact5-005CA00063LOS ANGELESCity <strong>of</strong> <strong>Glendale</strong>Dennis MaxwellCapacityStoragePct FullThomas Guide PageInundation Map Number56512 -146Facility NameCA <strong>State</strong> Dam NumberNational IDCountyOwnerContactDIEDERICH RESERVOIR5-006CA00064LOS ANGELESCity <strong>of</strong> <strong>Glendale</strong>Dennis MaxwellPrimary Contact ID Martin NixtSecondary Contact ID Donald R. FroelichTypeERTHCapacity174StoragePct FullThomas Guide Page564Inundation Map Number2006 PAGE G - 3
Natural <strong>Hazard</strong>s <strong>Mitigation</strong> PlanCity <strong>of</strong> <strong>Glendale</strong>, <strong>California</strong>Appendix G – Los Angeles County DamsFacility NameGLENOAKS 968 RESERVOIRPrimary Contact IDMartin NixtSecondary Contact IDDonald R. FroelichTypeERTHCA <strong>State</strong> Dam NumberNational IDCountyOwnerContact5-007CA00065LOS ANGELESCity <strong>of</strong> <strong>Glendale</strong>Dennis MaxwellCapacityStoragePct FullThomas Guide PageInundation Map Number565-A485 -128Facility NameCHATSWORTHPrimary Contact IDPhilip C. LahrSecondary Contact IDLAWS-DAC Control RoomTypeHYDFCA <strong>State</strong> Dam NumberNational IDCountyOwnerContact6-004CA00067LOS ANGELESCity <strong>of</strong> Los AngelesPhilip C. LahrCapacityStoragePct FullThomas Guide PageInundation Map Number529-G19886Facility NameDRY CANYONPrimary Contact IDPhilip C. LahrSecondary Contact IDLAWS-DAC Control RoomTypeHYDFCA <strong>State</strong> Dam NumberNational IDCountyOwnerContact6-005CA00068LOS ANGELESCity <strong>of</strong> Los AngelesPhilip C. LahrCapacityStoragePct FullThomas Guide PageInundation Map Number4460-J116 -11140Facility NameCA <strong>State</strong> Dam NumberNational IDCountyOwnerContactELYSIAN6-006CA00069LOS ANGELESCity <strong>of</strong> Los AngelesPhilip C. LahrPrimary Contact ID Philip C. LahrSecondary Contact ID LAWS-DAC Control RoomTypeERTHCapacity167StoragePct FullThomas Guide Page594-H7Inundation Map Number19 -12006 PAGE G - 4
Natural <strong>Hazard</strong>s <strong>Mitigation</strong> PlanCity <strong>of</strong> <strong>Glendale</strong>, <strong>California</strong>Appendix G – Los Angeles County DamsFacility NameENCINOPrimary Contact IDPhilip C. LahrSecondary Contact IDLAWS-DAC Control RoomTypeERTHCA <strong>State</strong> Dam NumberNational IDCountyOwnerContact6-007CA00070LOS ANGELESCity <strong>of</strong> Los AngelesPhilip C. LahrCapacityStoragePct FullThomas Guide PageInundation Map Number561-B520 -19789Facility NameFAIRMONTPrimary Contact IDPhilip C. LahrSecondary Contact IDLAWS-DAC Control RoomTypeHYDFCA <strong>State</strong> Dam NumberNational IDCountyOwnerContact6-008CA00071LOS ANGELESCity <strong>of</strong> Los AngelesPhilip C. LahrCapacityStoragePct FullThomas Guide PageInundation Map Number-X21 -37507Facility NameLOWER FRANKLINPrimary Contact IDPhilip C. LahrSecondary Contact IDLAWS-DAC Control RoomTypeHYDFCA <strong>State</strong> Dam NumberNational IDCountyOwnerContact6-014CA00075LOS ANGELESCity <strong>of</strong> Los AngelesPhilip C. LahrCapacityStoragePct FullThomas Guide PageInundation Map Number592-E4920Facility NameCA <strong>State</strong> Dam NumberNational IDCountyOwnerContactLOWER SAN FERNANDO6-015CA00076LOS ANGELESCity <strong>of</strong> Los AngelesPhilip C. LahrPrimary Contact ID Philip C. LahrSecondary Contact ID LAWS-DAC Control RoomTypeHYDFCapacity10000StoragePct FullThomas Guide Page481Inundation Map Number2006 PAGE G - 5
Natural <strong>Hazard</strong>s <strong>Mitigation</strong> PlanCity <strong>of</strong> <strong>Glendale</strong>, <strong>California</strong>Appendix G – Los Angeles County DamsFacility NameDRINKWATERPrimary Contact IDLarry GillisSecondary Contact IDGeorge BrodtTypeERTHCA <strong>State</strong> Dam NumberNational IDCountyOwnerContact6-016CA00077LOS ANGELESCity <strong>of</strong> Los AngelesBill SpringCapacityStoragePct FullThomas Guide PageInundation Map Number-X92Facility NameMULHOLLANDPrimary Contact IDPhilip C. LahrSecondary Contact IDLAWS-DAC Control RoomTypeGRAVCA <strong>State</strong> Dam NumberNational IDCountyOwnerContact6-017CA00078LOS ANGELESCity <strong>of</strong> Los AngelesPhilip C. LahrCapacityStoragePct FullThomas Guide PageInundation Map Number593-E140 -24036Facility NameROWENAPrimary Contact IDPhilip C. LahrSecondary Contact IDLAWS-DAC Control RoomTypeERTHCA <strong>State</strong> Dam NumberNational IDCountyOwnerContact6-018CA00079LOS ANGELESCity <strong>of</strong> Los AngelesPhilip C. LahrCapacityStoragePct FullThomas Guide PageInundation Map Number594-C353 -196Facility NameCA <strong>State</strong> Dam NumberNational IDCountyOwnerContactSILVER LAKE6-051CA00081LOS ANGELESCity <strong>of</strong> Los AngelesPhilip C. LahrPrimary Contact ID Philip C. LahrSecondary Contact ID LAWS-DAC Control RoomTypeERTHCapacity2020StoragePct FullThomas Guide Page594-D4Inundation Map Number61 -22006 PAGE G - 6
Natural <strong>Hazard</strong>s <strong>Mitigation</strong> PlanCity <strong>of</strong> <strong>Glendale</strong>, <strong>California</strong>Appendix G – Los Angeles County DamsFacility NameSTONE CANYONPrimary Contact IDPhilip C. LahrSecondary Contact IDLAWS-DAC Control RoomTypeERTHCA <strong>State</strong> Dam NumberNational IDCountyOwnerContact6-025CA00083LOS ANGELESCity <strong>of</strong> Los AngelesPhilip C. LahrCapacityStoragePct FullThomas Guide PageInundation Map Number59162 -210372Facility NameUPPER FRANKLINPrimary Contact IDPhilip C. LahrSecondary Contact IDLAWS-DAC Control RoomTypeERTHCA <strong>State</strong> Dam NumberNational IDCountyOwnerContact6-027CA00085LOS ANGELESCity <strong>of</strong> Los AngelesPhilip C. LahrCapacityStoragePct FullThomas Guide PageInundation Map Number592-E2118Facility NameUPPER SAN FERNANDOPrimary Contact IDPhilip C. LahrSecondary Contact IDLAWS-DAC Control RoomTypeHYDFCA <strong>State</strong> Dam NumberNational IDCountyOwnerContact6-028CA00086LOS ANGELESCity <strong>of</strong> Los AngelesPhilip C. LahrCapacityStoragePct FullThomas Guide PageInundation Map Number4811848Facility NameCA <strong>State</strong> Dam NumberNational IDCountyOwnerContactUPPER HOLLYWOOD6-029CA00087LOS ANGELESCity <strong>of</strong> Los AngelesPhilip C. LahrPrimary Contact ID Philip C. LahrSecondary Contact ID LAWS-DAC Control RoomTypeERTHCapacity176StoragePct FullThomas Guide Page593-E1Inundation Map Number2006 PAGE G - 7
Natural <strong>Hazard</strong>s <strong>Mitigation</strong> PlanCity <strong>of</strong> <strong>Glendale</strong>, <strong>California</strong>Appendix G – Los Angeles County DamsFacility NameBOUQUET CANYONPrimary Contact IDPhilip C. LahrSecondary Contact IDLAWS-DAC Control RoomTypeERTHCA <strong>State</strong> Dam NumberNational IDCountyOwnerContact6-031CA00088LOS ANGELESCity <strong>of</strong> Los AngelesPhilip C. LahrCapacityStoragePct FullThomas Guide PageInundation Map Number4192-G77 -336505Facility NameCHANNEL DIVERSION DIKEPrimary Contact IDPhilip C. LahrSecondary Contact IDLAWS-DAC Control RoomTypeERTHCA <strong>State</strong> Dam NumberNational IDCountyOwnerContact6-039CA00093LOS ANGELESCity <strong>of</strong> Los AngelesPhilip C. LahrCapacityStoragePct FullThomas Guide PageInundation Map Number481437Facility NameEAGLE ROCKPrimary Contact IDPhilip C. LahrSecondary Contact IDLAWS-DAC Control RoomTypeERTHCA <strong>State</strong> Dam NumberNational IDCountyOwnerContact6-041CA00094LOS ANGELESCity <strong>of</strong> Los AngelesPhilip C. LahrCapacityStoragePct FullThomas Guide PageInundation Map Number565-D517 -1254Facility NameCA <strong>State</strong> Dam NumberNational IDCountyOwnerContactGREEN VERDUGO6-043CA00096LOS ANGELESCity <strong>of</strong> Los AngelesPhilip C. LahrPrimary Contact ID Philip C. LahrSecondary Contact ID LAWS-DAC Control RoomTypeERTHCapacity99StoragePct FullThomas Guide Page503-F6Inundation Map Number25 -12006 PAGE G - 8
Natural <strong>Hazard</strong>s <strong>Mitigation</strong> PlanCity <strong>of</strong> <strong>Glendale</strong>, <strong>California</strong>Appendix G – Los Angeles County DamsFacility NameUPPER STONE CANYONPrimary Contact IDPhilip C. LahrSecondary Contact IDLAWS-DAC Control RoomTypeERTHCA <strong>State</strong> Dam NumberNational IDCountyOwnerContact6-044CA00097LOS ANGELESCity <strong>of</strong> Los AngelesPhilip C. LahrCapacityStoragePct FullThomas Guide PageInundation Map Number561425Facility NameYARNELL DEBRIS BASINPrimary Contact IDPhilip C. LahrSecondary Contact IDLAWS-DAC Control RoomTypeERTHCA <strong>State</strong> Dam NumberNational IDCountyOwnerContact6-046CA00099LOS ANGELESCity <strong>of</strong> Los AngelesPhilip C. LahrCapacityStoragePct FullThomas Guide PageInundation Map Number481-E4105Facility NameSANTA YNEZ CANYONPrimary Contact IDPhilip C. LahrSecondary Contact IDLAWS-DAC Control RoomTypeERTHCA <strong>State</strong> Dam NumberNational IDCountyOwnerContact6-047CA00100LOS ANGELESCity <strong>of</strong> Los AngelesPhilip C. LahrCapacityStoragePct FullThomas Guide PageInundation Map Number630-E156 -1356Facility NameCA <strong>State</strong> Dam NumberNational IDCountyOwnerContactL VAN NORMAN BYPASS6-048CA00101LOS ANGELESCity <strong>of</strong> Los AngelesPhilip C. LahrPrimary Contact ID Philip C. LahrSecondary Contact ID LAWS-DAC Control RoomTypeERTHCapacity240StoragePct FullThomas Guide Page481-E6Inundation Map Number2006 PAGE G - 9
Natural <strong>Hazard</strong>s <strong>Mitigation</strong> PlanCity <strong>of</strong> <strong>Glendale</strong>, <strong>California</strong>Appendix G – Los Angeles County DamsFacility NameL FRANKLIN NO 2Primary Contact IDPhilip C. LahrSecondary Contact IDLAWS-DAC Control RoomTypeERTHCA <strong>State</strong> Dam NumberNational IDCountyOwnerContact6-052CA00118LOS ANGELESCity <strong>of</strong> Los AngelesPhilip C. LahrCapacityStoragePct FullThomas Guide PageInundation Map Number592206Facility NameFAIRMONT NO 2Primary Contact IDPhilip C. LahrSecondary Contact IDLAWS-DAC Control RoomTypeERTHCA <strong>State</strong> Dam NumberNational IDCountyOwnerContact6-053CA00125LOS ANGELESCity <strong>of</strong> Los AngelesPhilip C. LahrCapacityStoragePct FullThomas Guide PageInundation Map Number-X493Facility NameWHITTIER RESERVOIR NO 4Primary Contact IDLeon YahudaSecondary Contact IDDavid SchicklingTypeERTHCA <strong>State</strong> Dam NumberNational IDCountyOwnerContact18-002CA00153LOS ANGELESCity <strong>of</strong> WhittierDan McKennaCapacityStoragePct FullThomas Guide PageInundation Map Number677-C469 -132Facility NameCA <strong>State</strong> Dam NumberNational IDCountyOwnerContactMORRIS S JONES19-003CA00154LOS ANGELESCity <strong>of</strong> PasadenaWater & Power Dispatch CenterPrimary Contact ID Water & Power Dispatch CenterSecondary Contact ID Water & Power Dispatch CenterTypeERTHCapacity154StoragePct FullThomas Guide Page566-H2Inundation Map Number39 -12006 PAGE G - 10
Natural <strong>Hazard</strong>s <strong>Mitigation</strong> PlanCity <strong>of</strong> <strong>Glendale</strong>, <strong>California</strong>Appendix G – Los Angeles County DamsFacility NameBIG DALTON DAMPrimary Contact IDReservoir UnitSecondary Contact IDCA <strong>State</strong> Dam NumberNational IDCountyOwnerContact32-000CA00187LOS ANGELESLos Angeles CountyRichard StrahanTypeCapacityStoragePct FullThomas Guide PageInundation Map NumberMULA540-B72 -1915Facility NameBIG SANTA ANITA DAMPrimary Contact IDReservoir UnitSecondary Contact IDCA <strong>State</strong> Dam NumberNational IDCountyOwnerContact32-002CA00188LOS ANGELESLos Angeles CountyRey ReyesTypeCapacityStoragePct FullThomas Guide PageInundation Map NumberVARA537-E64 -1858Facility NameDEVILS GATE DAMPrimary Contact IDReservoir UnitSecondary Contact IDCA <strong>State</strong> Dam NumberNational IDCountyOwnerContact32-003CA00189LOS ANGELESLos Angeles CountyDam Operator-Devil's GateTypeCapacityStoragePct FullThomas Guide PageInundation Map NumberGRAV535-E614 -12775Facility NameCOGSWELL DAMPrimary Contact IDReservoir UnitSecondary Contact IDCA <strong>State</strong> Dam NumberNational IDCountyOwnerContact32-005CA00190LOS ANGELESLos Angeles CountyKevin SweeneyTypeCapacityStoragePct FullThomas Guide PageInundation Map NumberROCK508-B413 -186962006 PAGE G - 11
Natural <strong>Hazard</strong>s <strong>Mitigation</strong> PlanCity <strong>of</strong> <strong>Glendale</strong>, <strong>California</strong>Appendix G – Los Angeles County DamsFacility NameBIG TUJUNGA DAM NO 1Primary Contact IDReservoir UnitSecondary Contact IDCA <strong>State</strong> Dam NumberNational IDCountyOwnerContact32-006CA00191LOS ANGELESLos Angeles CountyBill GilbertTypeCapacityStoragePct FullThomas Guide PageInundation Map NumberVARA4725-C56 -15750Facility NameLIVE OAK DAMPrimary Contact IDReservoir UnitSecondary Contact IDCA <strong>State</strong> Dam NumberNational IDCountyOwnerContact32-007CA00192LOS ANGELESLos Angeles CountyDam Operator or callPuddingstoneTypeCapacityStoragePct FullThomas Guide PageInundation Map NumberGRAV571-A534 -1239Facility NamePACOIMA DAMPrimary Contact IDReservoir UnitSecondary Contact IDCA <strong>State</strong> Dam NumberNational IDCountyOwnerContact32-008CA00193LOS ANGELESLos Angeles CountyJoe LindsayTypeCapacityStoragePct FullThomas Guide PageInundation Map NumberVARA4642-F741 -23777Facility NameCA <strong>State</strong> Dam NumberNational IDCountyOwnerContactPUDDINGSTONE DAM32-009CA00194LOS ANGELESLos Angeles CountyJim NewtonPrimary Contact ID Reservoir UnitSecondary Contact IDTypeERTHCapacity16342StoragePct FullThomas Guide PageInundation Map Number 600-B446 -22006 PAGE G - 12
Natural <strong>Hazard</strong>s <strong>Mitigation</strong> PlanCity <strong>of</strong> <strong>Glendale</strong>, <strong>California</strong>Appendix G – Los Angeles County DamsFacility NameSAN DIMAS DAMPrimary Contact IDReservoir UnitSecondary Contact IDCA <strong>State</strong> Dam NumberNational IDCountyOwnerContact32-010CA00195LOS ANGELESLos Angeles CountyGary ElrodTypeCapacityStoragePct FullThomas Guide PageInundation Map NumberGRAV570-F254 -11534Facility NameSAWPIT DAMPrimary Contact IDReservoir UnitSecondary Contact IDCA <strong>State</strong> Dam NumberNational IDCountyOwnerContact32-012CA00196LOS ANGELESLos Angeles CountySam VillegasTypeCapacityStoragePct FullThomas Guide PageInundation Map NumberCORA537-J757 -1406Facility NameSIERRA MADRE DAMPrimary Contact IDReservoir UnitSecondary Contact IDCA <strong>State</strong> Dam NumberNational IDCountyOwnerContact32-013CA00197LOS ANGELESLos Angeles CountyReservoir UnitTypeCapacityStoragePct FullThomas Guide PageInundation Map NumberCORA537-B760 -151Facility NameTHOMPSON CREEK DAMPrimary Contact IDReservoir UnitSecondary Contact IDCA <strong>State</strong> Dam NumberNational IDCountyOwnerContact32-015CA00198LOS ANGELESLos Angeles CountyDam Operator or callPuddingstoneTypeCapacityStoragePct FullThomas Guide PageInundation Map NumberERTH571-D464 -15432006 PAGE G - 13
Natural <strong>Hazard</strong>s <strong>Mitigation</strong> PlanCity <strong>of</strong> <strong>Glendale</strong>, <strong>California</strong>Appendix G – Los Angeles County DamsFacility NamePUDDINGSTONE DIVERSIONDAMPrimary Contact IDSecondary Contact IDReservoir UnitCA <strong>State</strong> Dam NumberNational IDCountyOwnerContact32-016CA00199LOS ANGELESLos Angeles CountyGary ElrodTypeCapacityStoragePct FullThomas Guide PageInundation Map NumberERTH570-E647 -1195Facility NameCA <strong>State</strong> Dam NumberNational IDCountyOwnerContactSAN GABRIEL DAM NO 132-019CA00200LOS ANGELESLos Angeles CountyBob KehlerPrimary Contact ID Reservoir UnitSecondary Contact IDTypeERRKCapacityStorage44183Pct FullThomas Guide PageInundation Map Number 539-E255 -1Facility NameEATON WASH DAMPrimary Contact IDReservoir UnitSecondary Contact IDCA <strong>State</strong> Dam NumberNational IDCountyOwnerContact32-020CA00201LOS ANGELESLos Angeles CountyDam Operator-Eaton WashTypeCapacityStoragePct FullThomas Guide PageInundation Map NumberERTH566-F118 -1721Facility NameRUBlO DEBRIS BASINPrimary Contact IDReservoir UnitSecondary Contact IDCA <strong>State</strong> Dam NumberNational IDCountyOwnerContact32-021CA00202LOS ANGELESLos Angeles CountyReservoir UnitTypeCapacityStoragePct FullThomas Guide PageInundation Map NumberERTH536-B4N/A372006 PAGE G - 14
Natural <strong>Hazard</strong>s <strong>Mitigation</strong> PlanCity <strong>of</strong> <strong>Glendale</strong>, <strong>California</strong>Appendix G – Los Angeles County DamsFacility NameLAGUNA REG BASINPrimary Contact IDReservoir UnitSecondary Contact IDCA <strong>State</strong> Dam NumberNational IDCountyOwnerContact32-022CA00203LOS ANGELESLos Angeles CountyReservoir UnitTypeCapacityStoragePct FullThomas Guide PageInundation Map NumberERTH635-F430 -1310Facility NamePALOS VERDES RESERVOIRPrimary Contact IDGeorge BarberSecondary Contact IDChristopher HillTypeERTHCA <strong>State</strong> Dam NumberNational IDCountyOwnerContact35-004CA00215LOS ANGELESMetropolitan Water DistrictEagle Rock Control CtrCapacityStoragePct FullThomas Guide PageInundation Map Number73 -C542 -11100Facility NameMORRIS DAMPrimary Contact IDReservoir UnitSecondary Contact IDCA <strong>State</strong> Dam NumberNational IDCountyOwnerContact32-040CA00216LOS ANGELESLos Angeles CountyArt DiazTypeGRAVCapacityStoragePct FullThomas Guide PageInundation Map Number 86 -F138 -12700Facility NameCA <strong>State</strong> Dam NumberNational IDCountyOwnerContactGARVEY RESERVOIR35-006CA00217LOS ANGELESMetropolitan Water DistrictN NerdmanPrimary Contact ID George BarberSecondary Contact ID Christopher HillTypeERTHCapacity1610StoragePct FullThomas Guide PageInundation Map Number 46 -D322 -12006 PAGE G - 15
Natural <strong>Hazard</strong>s <strong>Mitigation</strong> PlanCity <strong>of</strong> <strong>Glendale</strong>, <strong>California</strong>Appendix G – Los Angeles County DamsFacility NameWEYMOUTH MEM RESERVOIRPrimary Contact IDGeorge BarberSecondary Contact IDChristopher HillTypeRECTCA <strong>State</strong> Dam NumberNational IDCountyOwnerContact35-011CA00222LOS ANGELESMetropolitan Water DistrictL HinesCapacityStoragePct FullThomas Guide PageInundation Map Number90 -C267 -1151Facility NameLITTLEROCKPrimary Contact IDDennis LaMoreauxSecondary Contact IDJon PernulaTypeMULACA <strong>State</strong> Dam NumberNational IDCountyOwnerContact57-000CA00237LOS ANGELESLittle Rock Irrigation DistrictDennis LaMoreauxCapacityStoragePct FullThomas Guide PageInundation Map Number4377-D6350033 -1Facility NameHAROLD RESERVOIRPrimary Contact IDDennis LaMoreauxSecondary Contact IDDavid HassonTypeERTHCA <strong>State</strong> Dam NumberNational IDCountyOwnerContact57-002CA00238LOS ANGELESPalmdale Water DistrictDennis LaMoreauxCapacityStoragePct FullThomas Guide PageInundation Map Number4286-B528 -14250Facility NameWRIGLEY RESERVOIRPrimary Contact IDDean MenroeSecondary Contact IDRudy HaroTypeERTHCA <strong>State</strong> Dam NumberNational IDCountyOwnerContact104-026CA00444LOS ANGELESSouthern <strong>California</strong> EdisonDean MenroeCapacityStoragePct FullThomas Guide Page5923-E2Inundation Map Number85 -1622006 PAGE G - 16
Natural <strong>Hazard</strong>s <strong>Mitigation</strong> PlanCity <strong>of</strong> <strong>Glendale</strong>, <strong>California</strong>Appendix G – Los Angeles County DamsFacility NameTHOMPSONPrimary Contact IDDean MenroeSecondary Contact IDRudy HaroTypeERTHCA <strong>State</strong> Dam NumberNational IDCountyOwnerContact104-027CA00445LOS ANGELESSouthern <strong>California</strong> EdisonDean MenroeCapacityStoragePct FullThomas Guide PageInundation Map Number59231010Facility NameMALIBOU LAKE CLUBPrimary Contact IDSteve SohusSecondary Contact IDChuck KundertTypeCORACA <strong>State</strong> Dam NumberNational IDCountyOwnerContact771-000CA00739LOS ANGELESMalibou Lake Management Assn.Steve SohusCapacityStoragePct FullThomas Guide PageInundation Map Number588-B437 -5500Facility NameCENTURYPrimary Contact IDBelake SteeleSecondary Contact IDMike BoydTypeCORACA <strong>State</strong> Dam NumberNational IDCountyOwnerContact1-071CA00740LOS ANGELES<strong>State</strong> <strong>of</strong> <strong>California</strong>-P&RBelake SteeleCapacityStoragePct FullThomas Guide PageInundation Map Number588-D510 -470Facility NamePORTER ESTATEPrimary Contact IDAnthony BartonSecondary Contact IDDavid HassonTypeERTHCA <strong>State</strong> Dam NumberNational IDCountyOwnerContact775-000CA00741LOS ANGELESPorter Ranch DevelopmentAnthony BartonCapacityStoragePct FullThomas Guide PageInundation Map Number 500-E3N/A1352006 PAGE G - 17
Natural <strong>Hazard</strong>s <strong>Mitigation</strong> PlanCity <strong>of</strong> <strong>Glendale</strong>, <strong>California</strong>Appendix G – Los Angeles County DamsFacility NameLINDEROPrimary Contact IDArnold QuintanillaSecondary Contact IDGreg FeetTypeERTHCA <strong>State</strong> Dam NumberNational IDCountyOwnerContact785-000CA00742LOS ANGELESLake Lindero Homeowners AssociArnold QuintanillaCapacityStoragePct FullThomas Guide PageInundation Map Number587-B1N/A90Facility NamePOTREROPrimary Contact IDLenny TargonSecondary Contact IDWilliam ForemanTypeGRAVCA <strong>State</strong> Dam NumberNational IDCountyOwnerContact786-000CA00743LOS ANGELESWestlake Management DistrictLenny TargonCapacityStoragePct FullThomas Guide PageInundation Map Number587-B145 -4791Facility NameRIVIERA RESERVOIRPrimary Contact IDBob HarveySecondary Contact IDCA <strong>State</strong> Dam NumberNational IDCountyOwnerContact1043-000CA00876LOS ANGELESCity <strong>of</strong> Santa MonicaBob HarveyTypeRECTCapacityStoragePct FullThomas Guide PageInundation Map Number 631-E352 -376Facility NameCA <strong>State</strong> Dam NumberNational IDCountyOwnerContact10 MG WALTERIA1049-000CA00881LOS ANGELESCity <strong>of</strong> TorranceAlan BerndtPrimary Contact ID Alan BerndtSecondary Contact ID Jack Van der LindenTypeRECTCapacity31StoragePct FullThomas Guide Page763-E5Inundation Map NumberN/A2006 PAGE G - 18
Natural <strong>Hazard</strong>s <strong>Mitigation</strong> PlanCity <strong>of</strong> <strong>Glendale</strong>, <strong>California</strong>Appendix G – Los Angeles County DamsFacility NameGREYSTONE RESERVOIRPrimary Contact IDEd OtsukaSecondary Contact IDJin TrulanTypeRECTCA <strong>State</strong> Dam NumberNational IDCountyOwnerContact1061-000CA00893LOS ANGELESCity <strong>of</strong> Beverly HillsMarcel GarubbaCapacityStoragePct FullThomas Guide PageInundation Map Number592-F527 -160Facility NameWESTLAKE RESERVOIRPrimary Contact IDRoger HuffSecondary Contact IDJohn MundyTypeERTHCA <strong>State</strong> Dam NumberNational IDCountyOwnerContact1073-000CA00904LOS ANGELESLas Virgenes MWDRoger HuffCapacityStoragePct FullThomas Guide PageInundation Map Number587-B166 -79800Facility NameCHEVY CHASE 1290Primary Contact IDMartin NixtSecondary Contact IDDonald R. FroelichTypeERTHCA <strong>State</strong> Dam NumberNational IDCountyOwnerContact5-008CA01078LOS ANGELESCity <strong>of</strong> <strong>Glendale</strong>Dennis MaxwellCapacityStoragePct FullThomas Guide PageInundation Map Number56517Facility NameCA <strong>State</strong> Dam NumberNational IDCountyOwnerContactEAST GLORIETTA5-009CA01079LOS ANGELESCity <strong>of</strong> <strong>Glendale</strong>Dennis MaxwellPrimary Contact ID Martin NixtSecondary Contact ID Donald R. FroelichTypeRECTCapacity71StoragePct FullThomas Guide Page534-H6Inundation Map Number24 -12006 PAGE G - 19
Natural <strong>Hazard</strong>s <strong>Mitigation</strong> PlanCity <strong>of</strong> <strong>Glendale</strong>, <strong>California</strong>Appendix G – Los Angeles County DamsFacility NameELDERBERRY FOREBAYPrimary Contact IDLarry GillisSecondary Contact IDGeorge BrodtTypeERTHCA <strong>State</strong> Dam NumberNational IDCountyOwnerContact6-049CA01080LOS ANGELESCity <strong>of</strong> Los AngelesBill SpringCapacityStoragePct FullThomas Guide PageInundation Map Number436-928400Facility NameCA <strong>State</strong> Dam NumberNational IDCountyOwnerContactLOS ANGELES RESERVOIR6-050CA01081LOS ANGELESCity <strong>of</strong> Los AngelesPhilip C. LahrPrimary Contact ID Philip C. LahrSecondary Contact ID LAWS-DAC Control RoomTypeERTHCapacityStorage10000Pct FullThomas Guide PageInundation Map Number481-F580 -1Facility NameCA <strong>State</strong> Dam NumberNational IDCountyOwnerContactLIVE OAK RESERVOIR35-013CA01084LOS ANGELESMetropolitan Water DistrictG Del ToroPrimary Contact ID George BarberSecondary Contact ID Christopher HillTypeERTHCapacity2500StoragePct FullThomas Guide PageInundation Map Number 95A-E584 -1Facility NameBAILEY DEBRIS BASINPrimary Contact IDReservoir UnitSecondary Contact IDCA <strong>State</strong> Dam NumberNational IDCountyOwnerContact32-024CA01150LOS ANGELESLos Angeles CountyReservoir UnitTypeCapacityStoragePct FullThomas Guide PageInundation Map NumberERTH566-J1N/A432006 PAGE G - 20
Natural <strong>Hazard</strong>s <strong>Mitigation</strong> PlanCity <strong>of</strong> <strong>Glendale</strong>, <strong>California</strong>Appendix G – Los Angeles County DamsFacility NameBLANCHARD DEBRIS BASINPrimary Contact IDReservoir UnitSecondary Contact IDCA <strong>State</strong> Dam NumberNational IDCountyOwnerContact32-025CA01151LOS ANGELESLos Angeles CountyReservoir UnitTypeCapacityStoragePct FullThomas Guide PageInundation Map NumberERTH535-C2N/A26Facility NameBRAND DEBRIS BASINPrimary Contact IDReservoir UnitSecondary Contact IDCA <strong>State</strong> Dam NumberNational IDCountyOwnerContact32-026CA01152LOS ANGELESLos Angeles CountyReservoir UnitTypeCapacityStoragePct FullThomas Guide PageInundation Map NumberERTH534-B6N/A42Facility NameLA TUNA DEBRIS BASINPrimary Contact IDReservoir UnitSecondary Contact IDCA <strong>State</strong> Dam NumberNational IDCountyOwnerContact32-027CA01153LOS ANGELESLos Angeles CountyReservoir UnitTypeCapacityStoragePct FullThomas Guide PageInundation Map NumberERTH503-E6N/A207Facility NameLITTLE DALTON DEBRIS BASINPrimary Contact IDReservoir UnitSecondary Contact IDCA <strong>State</strong> Dam NumberNational IDCountyOwnerContact32-028CA01154LOS ANGELESLos Angeles CountyRichard StrahanTypeCapacityStoragePct FullThomas Guide PageInundation Map NumberERTH569-H232 -12342006 PAGE G - 21
Natural <strong>Hazard</strong>s <strong>Mitigation</strong> PlanCity <strong>of</strong> <strong>Glendale</strong>, <strong>California</strong>Appendix G – Los Angeles County DamsFacility NameSANTA ANITA DEBRIS BASINPrimary Contact IDReservoir UnitSecondary Contact IDCA <strong>State</strong> Dam NumberNational IDCountyOwnerContact32-029CA01155LOS ANGELESLos Angeles CountyRey ReyesTypeCapacityStoragePct FullThomas Guide PageInundation Map NumberERTH567-E15 -1116Facility NameBIG DALTON DEBRIS BASINPrimary Contact IDReservoir UnitSecondary Contact IDCA <strong>State</strong> Dam NumberNational IDCountyOwnerContact32-030CA01156LOS ANGELESLos Angeles CountyRichard StrahanTypeCapacityStoragePct FullThomas Guide PageInundation Map NumberERTH569-H23 -1193Facility NameSAWPIT DEBRIS BASINPrimary Contact IDReservoir UnitSecondary Contact IDCA <strong>State</strong> Dam NumberNational IDCountyOwnerContact32-031CA01157LOS ANGELESLos Angeles CountySam VillegasTypeCapacityStoragePct FullThomas Guide PageInundation Map NumberERTH567-H158 -1152Facility NameSIERRA MADRE VILLA DAMPrimary Contact IDReservoir UnitSecondary Contact IDCA <strong>State</strong> Dam NumberNational IDCountyOwnerContact32-032CA01158LOS ANGELESLos Angeles CountyReservoir UnitTypeCapacityStoragePct FullThomas Guide PageInundation Map NumberERTH566-G1N/A1092006 PAGE G - 22
Natural <strong>Hazard</strong>s <strong>Mitigation</strong> PlanCity <strong>of</strong> <strong>Glendale</strong>, <strong>California</strong>Appendix G – Los Angeles County DamsFacility NameSTOUGH DEBRIS BASINPrimary Contact IDReservoir UnitSecondary Contact IDCA <strong>State</strong> Dam NumberNational IDCountyOwnerContact32-033CA01160LOS ANGELESLos Angeles CountyReservoir UnitTypeCapacityStoragePct FullThomas Guide PageInundation Map NumberERTH533-H4N/A67Facility NameLOWER SUNSET DEBRIS BASINPrimary Contact IDReservoir UnitSecondary Contact IDCA <strong>State</strong> Dam NumberNational IDCountyOwnerContact32-034CA01161LOS ANGELESLos Angeles CountyReservoir UnitTypeCapacityStoragePct FullThomas Guide PageInundation Map NumberERTH533-J5N/A37Facility NameWILSON DEBRIS BASINPrimary Contact IDReservoir UnitSecondary Contact IDCA <strong>State</strong> Dam NumberNational IDCountyOwnerContact32-035CA01162LOS ANGELESLos Angeles CountyReservoir UnitTypeCapacityStoragePct FullThomas Guide PageInundation Map NumberERTH482-A1N/A84Facility NameSCHOOLHOUSE DEBRIS BASINPrimary Contact IDReservoir UnitSecondary Contact IDCA <strong>State</strong> Dam NumberNational IDCountyOwnerContact32-036CA01172LOS ANGELESLos Angeles CountyReservoir UnitTypeERTHCapacityStoragePct FullThomas Guide Page481-H1Inundation Map NumberN/A192006 PAGE G - 23
Natural <strong>Hazard</strong>s <strong>Mitigation</strong> PlanCity <strong>of</strong> <strong>Glendale</strong>, <strong>California</strong>Appendix G – Los Angeles County DamsFacility Name18 MG WALTERIAPrimary Contact IDAlan BerndtSecondary Contact IDJack Van der LindenTypeRECTCA <strong>State</strong> Dam NumberNational IDCountyOwnerContact1049-002CA01193LOS ANGELESCity <strong>of</strong> TorranceAlan BerndtCapacityStoragePct FullThomas Guide PageInundation Map Number763-E5N/A58Facility NameMORGAN DEBRIS BASINPrimary Contact IDReservoir UnitSecondary Contact IDCA <strong>State</strong> Dam NumberNational IDCountyOwnerContact32-039CA01385LOS ANGELESLos Angeles CountyReservoir UnitTypeCapacityStoragePct FullThomas Guide PageInundation Map NumberERTH570-A4N/A21Facility NameHAINES CANYON DEBRIS BASINPrimary Contact IDBrian TracySecondary Contact IDGreg PeacockTypeERTHCA <strong>State</strong> Dam NumberNational IDCountyOwnerContact9000-004CA10004LOS ANGELESU.S. Army Corps <strong>of</strong> EngineersTerry WotherspoonCapacityStoragePct FullThomas Guide PageInundation Map Number504-B392Facility NameHANSEN DAMPrimary Contact IDBrian TracySecondary Contact IDGreg PeacockTypeERTHCA <strong>State</strong> Dam NumberNational IDCountyOwnerContact9000-019CA10019LOS ANGELESU.S. Army Corps <strong>of</strong> EngineersGreg PeacockCapacityStoragePct FullThomas Guide Page502-H3Inundation Map Number73 -10266952006 PAGE G - 24
Natural <strong>Hazard</strong>s <strong>Mitigation</strong> PlanCity <strong>of</strong> <strong>Glendale</strong>, <strong>California</strong>Appendix G – Los Angeles County DamsFacility NameLOPEZPrimary Contact IDBrian TracySecondary Contact IDGreg PeacockTypeERTHCA <strong>State</strong> Dam NumberNational IDCountyOwnerContact9000-020CA10020LOS ANGELESU.S. Army Corps <strong>of</strong> EngineersGreg PeacockCapacityStoragePct FullThomas Guide PageInundation Map Number482-E436 -3441Facility NameSANTA FE DAMPrimary Contact IDBrian TracySecondary Contact IDGreg PeacockTypeERTHCA <strong>State</strong> Dam NumberNational IDCountyOwnerContact9000-024CA10024LOS ANGELESU.S. Army Corps <strong>of</strong> EngineersGreg PeacockCapacityStoragePct FullThomas Guide PageInundation Map Number598-B277 -432109Facility NameSEPULVEDA DAMPrimary Contact IDBrian TracySecondary Contact IDGreg PeacockTypeERTHCA <strong>State</strong> Dam NumberNational IDCountyOwnerContact9000-025CA10025LOS ANGELESU.S. Army Corps <strong>of</strong> EngineersGreg PeacockCapacityStoragePct FullThomas Guide PageInundation Map Number561-G278 -817425Facility NameWHITTIER NARROWS DAMPrimary Contact IDBrian TracySecondary Contact IDGreg PeacockTypeERTHCA <strong>State</strong> Dam NumberNational IDCountyOwnerContact9000-027CA10027LOS ANGELESU.S. Army Corps <strong>of</strong> EngineersGreg PeacockCapacityStoragePct FullThomas Guide Page636-H7Inundation Map Number79 -6361602006 PAGE G - 25
Natural <strong>Hazard</strong>s <strong>Mitigation</strong> PlanCity <strong>of</strong> <strong>Glendale</strong>, <strong>California</strong>Appendix G – Los Angeles County DamsFacility NameREC DAM EDWARDS AF BASEPrimary Contact IDDavid BookrumSecondary Contact IDDavid BookrumTypeERTHCA <strong>State</strong> Dam NumberNational IDCountyOwnerContact9000-120CA10120LOS ANGELESU.S. AirforceContact Disaster StandbyPersonnelCapacityStoragePct FullThomas Guide PageInundation Map Number17Facility NameBROWN MOUNTAIN BARRIERPrimary Contact IDGwendolyn Harris NishidaSecondary Contact IDDavid KerrTypeGRAVCA <strong>State</strong> Dam NumberNational IDCountyOwnerContact9000-341CA82421LOS ANGELESU.S. Forest ServiceRichard McCombsCapacityStoragePct FullThomas Guide PageInundation Map Number-M600Facility NamePICKENS M1Primary Contact IDGwendolyn Harris NishidaSecondary Contact IDDavid KerrTypeGRAVCA <strong>State</strong> Dam NumberNational IDCountyOwnerContact9000-340CA82427LOS ANGELESU.S. Forest ServiceRichard McCombsCapacityStoragePct FullThomas Guide PageInundation Map Number-M16Facility NameBLANCHARD M1Primary Contact IDGwendolyn Harris NishidaSecondary Contact IDDavid KerrTypeGRAVCA <strong>State</strong> Dam NumberNational IDCountyOwnerContact9000-342CA82438LOS ANGELESU.S. Forest ServiceRichard McCombsCapacityStoragePct FullThomas Guide PageInundation Map Number-M242006 PAGE G - 26
Natural <strong>Hazard</strong>s <strong>Mitigation</strong> PlanCity <strong>of</strong> <strong>Glendale</strong>, <strong>California</strong>Appendix H – Plan MapsAPPENDIX H:PLAN MAPSPlate H-1: Geomorphic Map <strong>of</strong> <strong>Glendale</strong>Plate H-2: Geologic Map <strong>of</strong> <strong>Glendale</strong>Plate H-2a: Explanation <strong>of</strong> the Geologic Map <strong>of</strong> <strong>Glendale</strong>Plate H-3: Historical Seismicity Map (for the period 1855 to 2002)Plate H-4: Fault Map <strong>of</strong> <strong>Glendale</strong>Plate H-5: Seismic <strong>Hazard</strong>s Map <strong>of</strong> <strong>Glendale</strong> (Liquefaction and Earthquake-InducedSlope Instability Potential)Plate H-6: Historical Wildland Fire Map <strong>of</strong> the <strong>Glendale</strong> AreaPlate H-7: High Fire <strong>Hazard</strong> AreasPlate H-8: Non-Compliant Roads in the City <strong>of</strong> <strong>Glendale</strong>Plate H-9: Damage Caused by the January 1, 1934 FloodPlate H-10: Dam Inundation PathwaysPlate H-11: Slope Instability MapPlate H-12: Critical Facilities Map2006 PAGE H - i
Natural <strong>Hazard</strong>s <strong>Mitigation</strong> PlanCity <strong>of</strong> <strong>Glendale</strong>, <strong>California</strong>APPENDIX I:Appendix I – ReferencesREFERENCESAndrews, P. L., 1986, BEHAVE: Fire behavior prediction and fuel modeling system BURNsubsystem, part 1: US Department <strong>of</strong> Agriculture, Forest Service, General TechnicalReport INT-194, Intermountain Research Station, Ogden, Utah, 130p.Andrews, P.L., and Bevins, C.D., 1999, Update and expansion <strong>of</strong> the BEHAVE Fire ModelingSystem: Fire Management Notes.Andrews, P.L., and Bradshaw, L.S., 1990, RXWINDOW: Defining windows <strong>of</strong> acceptableburning conditions based on desired fire behavior: US Department <strong>of</strong> Agriculture,Forest Service, General Technical Report INT-273, Intermountain Research Station,Ogden, Utah, 54p.Andrews, P.L., and Chase, C.H., 1989, BEHAVE: Fire behavior prediction modeling system-BURN subsystem Part 2: U.S. Department <strong>of</strong> Agriculture, Forest Service, GeneralTechnical Report INT-260, Intermountain Research Station, Ogden, Utah, 93p.Brabb, E.E., and B.L. Harrod (Editors), 1989, Landslides: extent and economic significance;Proceedings <strong>of</strong> the 28 th International Geological Congress Symposium on Landslides,Washington D.C.Burby, R. (Editor), 1998, Cooperating With Nature: Confronting Natural <strong>Hazard</strong>s with LandUse Planning for Sustainable Communities: Joseph Henry Press, Washington D.C.Burgan, R.E. and Rothermel, R.C., 1984, BEHAVE: Fire prediction and fuel modeling system-FUEL subsystem: U.S. Department <strong>of</strong> Agriculture, Forest Service, General TechnicalReport INT-167, Intermountain Forest and Range Experiment Station, Ogden, Utah,126p.Association <strong>of</strong> Engineering Geologists, 1975, Sycamore Canyon Fault, Verdugo Fault, YorkBoulevard Fault, Raymond Fault, and Sierra Madre Fault Zone: Field Trip Guidebook,September 27, 1975.ASTM E-108, “Standard Test Methods for Fire Tests <strong>of</strong> Ro<strong>of</strong> Coverings”: American Societyfor Testing Materials.Barrette, Brian, 1999, System for Rating Structural Vulnerability in SRA: Sacramento,<strong>California</strong>, dated September 1999.Barrows, A.G., Tan, S.S., and Irvine, P.J., 1994, Investigation <strong>of</strong> Surface Geologic Effects andRelated Land Movement in the City <strong>of</strong> Simi Valley Resulting from the NorthridgeEarthquake <strong>of</strong> January 14, 1994: <strong>California</strong> Division <strong>of</strong> Mines and Geology Open FileReport 94-09, 41p., 1 plate.Barrows, A.G., Irvine, P.J., and Tan, S.S, 1995, Geologic surface effects triggered by theNorthridge earthquake; in Woods, M.C., and Seiple, W.R. (editors), The Northridge,<strong>California</strong>, Earthquake <strong>of</strong> 17 January 1994: <strong>California</strong> Division <strong>of</strong> Mines and GeologySpecial Publication 116, pp 65-88.Blake, T.F., Holligsworth, R.A., and Stewart, J.P., (editors), 2002, Recommended Procedures forImplementation <strong>of</strong> DMG Special Publication 117 Guidelines for Analyzing and2006 PAGE I - 1
Natural <strong>Hazard</strong>s <strong>Mitigation</strong> PlanCity <strong>of</strong> <strong>Glendale</strong>, <strong>California</strong>Appendix I – ReferencesMitigating Landslide <strong>Hazard</strong>s in <strong>California</strong>: Southern <strong>California</strong> Earthquake Center,110p. + Appendix A.Blake, T. F., 2000a, EQFAULT, A Computer Program for the Estimation <strong>of</strong> Peak HorizontalGround Acceleration from 3D Fault Sources.Blake, T.F., 2000b FRISKSP, A Computer Program for the Estimation <strong>of</strong> Median PeakHorizontal Ground Acceleration from 3D Fault Sources.Bolt, Bruce A., 1999, Earthquakes: W.H. Freeman and Company, New York, 331p.Boore, D.M, Joyner, W. and Fumal, T. E., 1997, Equations for Estimating Horizontal ResponseSpectra and Peak Acceleration from Western North American Earthquakes: ASummary <strong>of</strong> Recent Work, Seismological Research Letters, Vol. 68, No. 1, pp 128-153.Borchardt, G., and Kennedy, M.P., 1979, Liquefaction Potential in Urban San Diego – A PilotStudy: <strong>California</strong> Geology, Vol. 32, pp. 217-221.Brewer, Lindie, 1992, Preliminary Damage and Intensity Survey: Earthquakes and Volcanoes,Vol. 23, No. 5, pp. 219-226.Brown, G., 1975, Ground Water Geology <strong>of</strong> the San Fernando Valley; in Oakeshott, Gordon B.,(editor), San Fernando, <strong>California</strong>, Earthquake <strong>of</strong> 9 February 1971: <strong>California</strong> Division<strong>of</strong> Mines and Geology, Bulletin 196, pp. 31-52.Brown, R.D., Jr., 1990, Quaternary Deformation; in Wallace, R.E. (editor), The San AndreasFault System, <strong>California</strong>: U.S. Geological Survey Pr<strong>of</strong>essional Paper 1515, pp. 83-114.Building Technology, Inc., 1990a, Financial Incentives for Seismic Rehabilitation <strong>of</strong> <strong>Hazard</strong>ousBuildings – An Agenda for Action. Volume 1: Findings, Conclusions andRecommendations: Federal Emergency Management Agency Publication No. 198,104p.Building Technology, Inc., 1990b, Financial Incentives for Seismic Rehabilitation <strong>of</strong> <strong>Hazard</strong>ousBuildings – An Agenda for Action. Volume 2: <strong>State</strong> and Local Case Studies andRecommendations: Federal Emergency Management Agency Publication No. 199,130p.Building Technology, Inc., 1990c, Financial Incentives for Seismic Rehabilitation <strong>of</strong> <strong>Hazard</strong>ousBuildings – An Agenda for Action. Volume 3: Applications Workshops Report: FederalEmergency Management Agency Publication No. 216, 200p.Burgan, R.E., 1987, Concepts and interpreted examples in advanced modeling: U.S. Department<strong>of</strong> Agriculture, Forest Service, General Technical Report INT-238, IntermountainResearch Station, Ogden, Utah, 40p.Byer, J. W., 1968, Geologic Map <strong>of</strong> the City <strong>of</strong> <strong>Glendale</strong>, unpublished.<strong>California</strong> Board <strong>of</strong> Forestry, 1996, <strong>California</strong> Fire Plan: A Framework for Minimizing Costsand Losses from Wildland Fires: a report dated March 1996.<strong>California</strong> Code <strong>of</strong> Regulations, Title 14, Article 10, Seismic <strong>Hazard</strong>s Mapping Act.<strong>California</strong> Code <strong>of</strong> Regulations, Title 22, <strong>California</strong> Building Standards Code.2006 PAGE I - 2
Natural <strong>Hazard</strong>s <strong>Mitigation</strong> PlanCity <strong>of</strong> <strong>Glendale</strong>, <strong>California</strong>Appendix I – References<strong>California</strong> Department <strong>of</strong> Forestry, 1993, Rater Instruction Guide: Very High Fire <strong>Hazard</strong>Severity Zone.<strong>California</strong> Department <strong>of</strong> Water Resources, 1986, Statutes and Regulations Pertaining toSupervision <strong>of</strong> Dams and Reservoirs: Division <strong>of</strong> Safety <strong>of</strong> Dams, 46p.<strong>California</strong> Department <strong>of</strong> Water Resources, 1984, Dams within the Jurisdiction <strong>of</strong> the <strong>State</strong> <strong>of</strong><strong>California</strong>: Division <strong>of</strong> Safety <strong>of</strong> Dams, Bulletin 17-84, 94p.<strong>California</strong> Division <strong>of</strong> Mines and Geology, 2001, <strong>Hazard</strong>s from ”Mudslides”, Debris Avalanchesand Debris Flows in Hillside and Wildfire Areas: DMG Note 33, available athttp://www.consrv.ca.gov/dmg/pubs/notes/33/index.htm.<strong>California</strong> Division <strong>of</strong> Mines and Geology, 1999, Recommended Criteria for Delineating Seismic<strong>Hazard</strong> Zones in <strong>California</strong>: Special Publication 118, May 1992, Revised July 1999.<strong>California</strong> Division <strong>of</strong> Mines and Geology, 1998a, Seismic <strong>Hazard</strong> Evaluation <strong>of</strong> the Pasadena7.5 Minute Quadrangle, Los Angeles County, <strong>California</strong>, Open-File Report 98-05.<strong>California</strong> Division <strong>of</strong> Mines and Geology (CDMG), 1998b, Maps <strong>of</strong> Known Active Near-SourceZones in <strong>California</strong> and Adjacent Potions <strong>of</strong> Nevada, to be used with the 1997 UniformBuilding Code published by the International Conference <strong>of</strong> Building Officials.<strong>California</strong> Division <strong>of</strong> Mines and Geology, 1997, Guidelines for Evaluating and MitigatingSeismic <strong>Hazard</strong>s in <strong>California</strong>: Special Publication 117, 74p.<strong>California</strong> Division <strong>of</strong> Mines and Geology, 1996, Probabilistic Seismic <strong>Hazard</strong> Assessment forthe <strong>State</strong> <strong>of</strong> <strong>California</strong>, Appendix A – Fault Source Parameters: CDMG Open-FileReport 96-08.<strong>California</strong> Division <strong>of</strong> Mines and Geology, 1979, Earthquake <strong>Hazard</strong>s Associated with Faults inthe Greater Los Angeles Metropolitan Area, Los Angeles County, <strong>California</strong>, IncludingFaults in the Santa Monica-Raymond, Verdugo-Eagle Rock, and Benedict Canyon FaultZones: Open File Report 79-16.<strong>California</strong> Division <strong>of</strong> Mines and Geology, 1979a, Alquist-Priolo Earthquake Fault Zone Mapfor the Sunland, <strong>California</strong> Quadrangle; Scale: 1:24,000.<strong>California</strong> Division <strong>of</strong> Mines and Geology, 1979b, Alquist-Priolo Earthquake Fault Zone Mapfor the Sunland, <strong>California</strong> Quadrangle; Scale: 1:24,000.<strong>California</strong> Geological Survey, 2002, Guidelines for Evaluating the <strong>Hazard</strong> <strong>of</strong> Surface FaultRupture: DMG Note 49, available athttp://www.consrv.ca.gov/cgs/information/publications/cgs_notes/index.htm<strong>California</strong> Governor’s Office <strong>of</strong> Emergency Services, Dam Inundation Maps obtained atwww.oes.ca.gov/Campbell, R.H., 1975, Soil Slips, Debris Flows, and Rainstorms in the Santa Monica Mountainsand Vicinity, Southern <strong>California</strong>: U.S. Geological Survey Pr<strong>of</strong>essional Paper 851, 51p.2006 PAGE I - 3
Natural <strong>Hazard</strong>s <strong>Mitigation</strong> PlanCity <strong>of</strong> <strong>Glendale</strong>, <strong>California</strong>Appendix I – ReferencesCannon, S.H., 2001, Debris-Flow Generation From Recently Burned Watersheds: Bulletin <strong>of</strong>the Association <strong>of</strong> Engineering Geologists, Vol. VII, No. 4., November, 2001, pp. 321-341.Chow, V.T., 1959, Open Channel Hydraulics: McGraw Hill, New York, 680p.Coleman, Ronny J., 1994, Policy Context on Urban-Wildland Fire Problem: <strong>California</strong> <strong>State</strong>and Consumer Services Agency, A Special Report for the Governor Pete Wilson, datedJanuary 19, 1994, 13p.Crook Jr., R., Allen, C.R., Kamb, B., Payne, C.M., and R.J. Proctor, 1987, Quaternary Geologyand Seismic <strong>Hazard</strong> <strong>of</strong> the Sierra Madre and Associated Faults, Western San GabrielMountains; in Recent Reverse Faulting in the Transverse Ranges, <strong>California</strong>: U.S.Geological Survey Pr<strong>of</strong>essional Paper 1339, pp. 27-63, Plates 2.1, 2.2, and 2.3.Davis, T.L., Namson, J., and Yerkes, R.F., 1989, A Cross Section <strong>of</strong> the Los Angeles Area:Seismically Active Fold and Thrust Belt, the 1987 Whittier Narrows Earthquake, andEarthquake <strong>Hazard</strong>: Journal <strong>of</strong> Geophysical Research, Vol. 94, pp. 9644-9664.Davis, D. J., 1980, Rare and Unusual Postfire Flood Events Experienced Flood Events in LosAngeles County During 1978 and 1980; in Storms, Floods and Debris Flows in Southern<strong>California</strong> and Arizona 1978 and 1980: Proceedings <strong>of</strong> a Symposium, September 17-18,1980, published by the National Academy Press.Dibblee, T.W., Jr., 1989a, Geologic Map <strong>of</strong> the Pasadena Quadrangle, Los Angeles County,<strong>California</strong>: Dibblee Foundation Map DF-23, Scale 1:24,000.Dibblee, T.W., Jr., 1989b, Geologic Map <strong>of</strong> the Los Angeles Quadrangle, Los Angeles County,<strong>California</strong>: Dibblee Foundation Map DF-22, scale 1:24,000.Dibblee, T.W., Jr., 1991a, Geologic Map <strong>of</strong> the Sunland and Burbank (North 1/2) Quadrangles,Los Angeles County, <strong>California</strong>: Dibblee Foundation Map DF-32, Scale: 1:24,000.Dibblee, T.W., Jr., 1991b, Geologic Map <strong>of</strong> the Hollywood and Burbank (South 1/2)Quadrangles, Los Angeles County, <strong>California</strong>: Dibblee Foundation Map DF-30, Scale:1:24,000.Dibblee, T.W., Jr., and Carter, B., 2002, Geologic Map <strong>of</strong> the Condor Peak Quadrangle, LosAngeles County, <strong>California</strong>, Dibblee Geological Foundation, Map DF-84, Scale:1:24,000.Dolan, J.F., Gath, E.M., Grant, L.B., Legg, M., Lindvall, S., Mueller, K., Oskin, M., Ponti, D.F.,Rubin C.M., Rockwell, R. K., Shaw, J.H., Trieman, J.A., Walls, C., and Yeats, R.S.(compiler), 2001, Active Faults in the Los Angeles Metropolitan Region: Report by theSouthern <strong>California</strong> Earthquake Center Group C.Dolan, J.F., and Tucker, A.Z., 1999, Paleoseismology, Active Tectonics and Seismic <strong>Hazard</strong>s <strong>of</strong>the Verdugo Fault Zone, Los Angeles County, <strong>California</strong>: Draft Report to the Southern<strong>California</strong> Earthquake Center, Research Conducted under Grant No. 1434-HQ97-03116.Dolan, J. F., Sieh, K., Rockwell, T. K., and others, 1997, Active Tectonics, Paleoseismology andSeismic <strong>Hazard</strong>s <strong>of</strong> the Hollywood Fault, Northern Los Angeles Basin, <strong>California</strong>:Geological Society <strong>of</strong> America Bulletin, Vol. 109, No. 12, pp. 1595-1616.2006 PAGE I - 4
Natural <strong>Hazard</strong>s <strong>Mitigation</strong> PlanCity <strong>of</strong> <strong>Glendale</strong>, <strong>California</strong>Appendix I – ReferencesDolan, J.F., Sieh, K., Rockwell, T.K., Yeats, R.S., Shaw, J., Suppe, G., Huftile, G., and Gath, E.,1995, Prospects for Larger and More Frequent Earthquakes in Greater MetropolitanLos Angeles, <strong>California</strong>: Science, Vol. 267, pp. 199-205.Earthquake Engineering Research Institute (EERI), 1994, Northridge Earthquake, January 17,1994, Preliminary Reconnaissance Report: Oakland, <strong>California</strong>, 96p.Earthquake Engineering Research Institute (EERI), 1986, Reducing Earthquake <strong>Hazard</strong>s:Lessons Learned from Earthquakes: Earthquake Engineering Research Institute,Publication No. 86-02, 208p.Earthquake Project, 1989, Catastrophic Earthquake, The Need to Insure Against EconomicDisaster, Boston, Mass: National Committee on Property Insurance.Ellen, S.D., and Fleming, R.W., 1987, Mobilization <strong>of</strong> Debris Flows from Soil Slips, SanFrancisco Bay region, <strong>California</strong>; in Costa, J.E. and Wieczorek, G.F. (editors), DebrisFlows/Avalanches: Process, Recognition, and <strong>Mitigation</strong>: Geological Society <strong>of</strong>America Reviews in Engineering Geology, Vol. VII, pp. 31-40.Envicom, 1975, Seismic Safety Element, City <strong>of</strong> <strong>Glendale</strong>, <strong>California</strong>: Prepared for the City <strong>of</strong><strong>Glendale</strong> Planning Division.Federal Emergency Management Agency (FEMA), 2001b, Flood Insurance ProgramModificationsFederal Emergency Management Agency, FEMA-232, 1998, Home Builder’s Guide to SeismicResistant Construction: Earthquake <strong>Hazard</strong> Reduction Series, 75p.Federal Emergency Management Agency, FEMA-315, 1998, Seismic Rehabilitation <strong>of</strong>Buildings: Strategic Plan 2005: Earthquake <strong>Hazard</strong> Reduction Series, 40p.Federal Emergency Management Agency (FEMA), 1989, FEMA-173, Establishing Programsand Priorities for the Seismic Rehabilitation <strong>of</strong> Buildings – Supporting Report: BuildingSystems Development, Inc., Integrated Design Services and Rubin, Claire B.;Earthquake <strong>Hazard</strong> Reduction Series No 46, 190p.Federal Emergency Management Agency (FEMA), 1989, FEMA-174, Establishing Programsand Priorities for the Seismic Rehabilitation <strong>of</strong> Buildings – A Handbook BuildingSystems Development, Inc., Integrated Design Services and Rubin, Claire B.;Earthquake <strong>Hazard</strong> Reduction Series No 45, 122p.Federal Emergency Management Agency (FEMA), 1989, FEMA-175, Seismic Evaluation <strong>of</strong>Existing Buildings: Supporting Documentation: Applied Technology Council (ATC-22-1); Earthquake <strong>Hazard</strong> Reduction Series No. 48, 160p.Federal Emergency Management Agency (FEMA), 1989, FEMA-178, A Handbook for SeismicEvaluation <strong>of</strong> Existing Buildings (Preliminary): Applied Technology Council (ATC-22);Earthquake <strong>Hazard</strong> Reduction Series No. 47, 169p.Federal Emergency Management Agency (FEMA), 1988, FEMA-154, Rapid Visual Screening<strong>of</strong> Buildings for Potential Seismic <strong>Hazard</strong>s: A Handbook: Applied Technology Council(ATC-21), Earthquake <strong>Hazard</strong>s Reduction Series No. 41, 185p.2006 PAGE I - 5
Natural <strong>Hazard</strong>s <strong>Mitigation</strong> PlanCity <strong>of</strong> <strong>Glendale</strong>, <strong>California</strong>Appendix I – ReferencesFederal Emergency Management Agency (FEMA), 1988, FEMA-155, Rapid Visual Screening<strong>of</strong> Buildings for Potential Seismic <strong>Hazard</strong>s: Supporting Documentation: AppliedTechnology Council (ATC-21-1), Earthquake <strong>Hazard</strong>s Reduction Series No. 42, 137p.Federal Emergency Management Agency (FEMA), 1988, FEMA-156, Typical Costs forSeismic Rehabilitation <strong>of</strong> Existing Buildings, Volume 1 – Summary: by Englekirk andHart Consulting Engineers, Inc., Los Angeles, <strong>California</strong>; Earthquake <strong>Hazard</strong>Reduction Series No. 39.Federal Emergency Management Agency (FEMA), 1987, FEMA-135, Abatement <strong>of</strong> Seismic<strong>Hazard</strong>s to Lifelines: Water and Sewer Lifelines and Special Workshop Presentations:Earthquake <strong>Hazard</strong> Reduction Series No. 2, 181p.Federal Emergency Management Agency (FEMA), 1987, FEMA-139, Abatement <strong>of</strong> Seismic<strong>Hazard</strong>s to Lifelines: Proceedings <strong>of</strong> a Workshop on Development <strong>of</strong> an Action Plan –Volume 5: Papers on Gas and Liquid Fuel Lifelines: Building Seismic Safety Council;Earthquake <strong>Hazard</strong> Reduction Series No. 30, 134p.Federal Emergency Management Agency, FEMA-73, 1985, Comprehensive EarthquakePreparedness Planning Guidelines: City: Earthquake <strong>Hazard</strong> Reduction Series 2, 80p.Finney, M.A., 1995, FARSITE- A Fire Area Simulator for Managers; in The BiswellSymposium: Fire Issues and Solutions in Urban Interface and Wildland Ecosystems: USDepartment <strong>of</strong> Agriculture, Forest Service, General Technical Report PSW-158,Berkeley, <strong>California</strong>.Finney, M.A. 1998. FARSITE: Fire Area Simulator-model development and evaluation: USDepartment <strong>of</strong> Agriculture, Forest Service, Research Paper RMRS-RP-4, RockyMountain Research Station, Ft. Collins, Colorado, 47 pages.Fisher, Fred L., 1995, Building Fire Safety in the Wildland Urban Intermix: The Role <strong>of</strong>Building Codes and Fire Test Standards: Report prepared for the <strong>California</strong>/ChinaBilateral Conference on Fire Safety Engineering held August 14-15, 1995 inSacramento, <strong>California</strong>, 13p.Fumal, T.E., Davis, A.B., Frost, W.T., O’Donnell, J., Sega, G., and Schwartz, D.P., 1995,Recurrence studies <strong>of</strong> Tujunga Segment <strong>of</strong> the 1971 San Fernando earthquake,<strong>California</strong>: EOS (Supplement), Vol. 76, No. 46, 364p.<strong>Glendale</strong> Fire Department, 1994, Fire <strong>Hazard</strong> <strong>Mitigation</strong> Plan for the City <strong>of</strong> <strong>Glendale</strong> CollegeHills Fire; Disaster Declaration FEMA-872-DR-CA, 26p. plus appendices.<strong>Glendale</strong> (City <strong>of</strong>) Planning Division, 2000, Housing Element Update, January 1, 1998 – June30, 2005.<strong>Glendale</strong> (City <strong>of</strong>) Water and Power, 2000, Consumer Confidence Report for 2000 WaterQuality Data (available at http://www.ci.glendale.ca.us/government/)Gosnold, William D., Jr., LeFever, Julie A., Todhunter, Paul E., and Osborne, Leon F., Jr., 2000,Rethinking Flood Prediction: Why the Traditional Approach Needs to Change:Geotimes, Vol. 45, No. 5, pp. 20-23.Greenlee, J., and Sapsis, D., 1996, Prefire Effectiveness in Fire Management: A Summary <strong>of</strong><strong>State</strong>-<strong>of</strong>-Knowledge, dated August 1996. (available at http://www.ucfpl.ucop.edu/)2006 PAGE I - 6
Natural <strong>Hazard</strong>s <strong>Mitigation</strong> PlanCity <strong>of</strong> <strong>Glendale</strong>, <strong>California</strong>Appendix I – ReferencesHarp, E.L., and Jibson, R.W., 1996, Landslides triggered by the 1994 Northridge, <strong>California</strong>,Earthquake: Bulletin <strong>of</strong> the Seismological Society <strong>of</strong> America, Vol. 86, No. 1B, pp. S319-S332.Hart, E.W., and Bryant, W.A., 1999, Fault-Rupture <strong>Hazard</strong> Zones in <strong>California</strong>, Alquist-PrioloEarthquake Fault Zoning Act with Index to Earthquake Fault Zones Maps: <strong>California</strong>Division <strong>of</strong> Mines and Geology Special Publication 42.Hauksson, Egill, 1994, The 1991 Sierra Madre Earthquake Sequence in Southern <strong>California</strong>:Seismological and Tectonic Analysis: Bulletin <strong>of</strong> the Seismological Society <strong>of</strong> America,Vol. 84, No. 4, pp. 1058-1074.Hauksson, E. and Jones, L., 1991, The 1988 and 1990 Upland Earthquakes: Left-lateral FaultingAdjacent to the Central Transverse Ranges: Journal <strong>of</strong> Geophysical Research, Vol. 96,No. B5, pp. 8143-8165.Hauksson, E., Hutton, K., and Jones, L., 2001, Magnitude 4.2 near West Hollywood, CA,Sunday, September 9, 2001 at 4:59:17 PM (PDT),http://pasadena.wr.usgs.gov/eqinthenews/cl09703872/index.html2001Hayes, E., 1988, A Review <strong>of</strong> Information on Seismic <strong>Hazard</strong>s Needed for theEarthquake-Resistant Design <strong>of</strong> Lifeline Systems in the United <strong>State</strong>s: U.S. GeologicalSurvey Open File Report ICSSCTR-10, 71p.Helm, R., Neal, B., and Taylor, L., 1973, A Fire <strong>Hazard</strong> Severity Classification System for<strong>California</strong>’s Wildlands: A report by the Department <strong>of</strong> Housing and UrbanDevelopment and the <strong>California</strong> Department <strong>of</strong> Conservation, Division <strong>of</strong> Forestry tothe Governor’s Office <strong>of</strong> Planning and Research, dated April 1, 1973.Insurance Services Office, Inc. (ISO), 2001, Guide for Determination <strong>of</strong> Needed Fire Flow:Edition 10-2001, 26p.Insurance Services Office, Inc. (ISO), 1997, The Wildland/Urban Fire <strong>Hazard</strong>: ISO, New York,December 1997.Interagency <strong>Hazard</strong> <strong>Mitigation</strong> Team, 2000, <strong>State</strong> <strong>Hazard</strong> <strong>Mitigation</strong> Plan: Oregon EmergencyManagement.International Conference <strong>of</strong> Building Officials (ICBO), 1997, Uniform Building Code.Jaffe, M., Butler, J., and Thurow, C., 1981, Reducing Earthquake Risks: A Planners Guide:American Planning Association (Planning Advisory Service), Report No. 364, 82p.Jameson, E. W., Jr., and H. J. Peeters, 1988, <strong>California</strong> Mammal: University <strong>of</strong> <strong>California</strong> Press,Berkeley, <strong>California</strong>.Jennings, C. W., Strand, R. G., Rogers, T. H., 1977, Geologic Map <strong>of</strong> <strong>California</strong>: <strong>California</strong>Division <strong>of</strong> Mines and Geology.Jennings, Charles W., 1994, Fault Activity Map <strong>of</strong> <strong>California</strong> and Adjacent Areas with Locationand Ages <strong>of</strong> Recent Volcanic Eruptions: <strong>California</strong> Division <strong>of</strong> Mines and Geology,<strong>California</strong> Geologic Data Map Series, Map No. 6, Map Scale: 1:250,000.2006 PAGE I - 7
Natural <strong>Hazard</strong>s <strong>Mitigation</strong> PlanCity <strong>of</strong> <strong>Glendale</strong>, <strong>California</strong>Appendix I – ReferencesJohnson, I.A., 1998, Land Subsidence Due to Fluid Withdrawal in the United <strong>State</strong>s - AnOverview; in Land Subsidence, Case Studies and Current Research, Proceedings <strong>of</strong> theDr. Joseph F. Poland Symposium on Land Subsidence, Borchers, J.W. (editors), SpecialPublication 8: Association <strong>of</strong> Engineering Geologists, pp. 51-57.Jones, L., Sieh, K., Hauksson, E., and Hutton, L.K., 1990, The 3 December 1988 Pasadena,<strong>California</strong>, Earthquake: Evidence for Strike-slip Motion on the Raymond Fault: Bulletin<strong>of</strong> the Seismological Society <strong>of</strong> America, Vol. 80, No. 2, pp. 474-482.Joyner, W. B., and Fumal, T. E., 1985, Predictive Mapping <strong>of</strong> Earthquake Ground Motion; inZiony, J. I., ed., Evaluating Earthquake <strong>Hazard</strong>s in the Los Angeles Region, AnEarth-Science Perspective: U.S. Geological Survey Pr<strong>of</strong>essional Paper 1360, pp.203-217.Keefer, D.K., Wilson, R.C., Mark, R.K., Brabb, E.E., Brown III, W.M., Ellen, S.D., Harp, E.L.,Wieczorek, G.F., Alger, C.S., and Zatkin, R.S., 1987, Real-Time Landslide WarningDuring Heavy Rainfall: Science, Vol. 238, pp. 921-925.Keefer, D.K., and Johnson, A.M., 1983, Earth Flows: Morphology, Mobilization, and Movement:U.S. Geological Survey Pr<strong>of</strong>essional Paper 1264, 55p.Lagasse, P.F., Schall, J.D., Johnson, F., Richardson, E.V., Richardson, J.R., Chang, F., 1991,Stream stability at highway structures: U.S. Department <strong>of</strong> Transportation No.FHWA-IP-90-014 Hydraulic Engineering Circular 20, 195p.Lamar, D.L., 1970, Geology <strong>of</strong> the Elysian Park-Repetto Hills Area, Los Angeles County,<strong>California</strong>, <strong>California</strong> Division <strong>of</strong> Mines and Geology Special Report 101, 45p., 2 plates.Langenheim, V.E.; Griscom, A., Jachens, R.C., and Hildenbrand, T.G., 2000, PreliminaryPotential-Field Constraints on the Geometry <strong>of</strong> the San Fernando Basin, Southern<strong>California</strong>: U.S. Geological Survey Open-File Report 00-219, 36p.Larsen, E.S. Jr., Gottfried, D., Jaffe, H.W., and Waring, C.L., 1958, Lead-Alpha Ages <strong>of</strong> theMesozoic Batholiths <strong>of</strong> Western North America; U.S. Geological Survey Bulletin 1070-B, pp.35-62.Lazarte, C.A., Bray, J.D., Johnson, A.M., and Lemmer, R.E., 1994, Surface Breakage <strong>of</strong> the 1992Landers Earthquake and its Effects on Structures: Bulletin <strong>of</strong> the Seismological Society<strong>of</strong> America, Vol. 84, No. 3, pp 547-561.Lund, Le Val, 1996, Lifeline Utilities Performance in the 17 January 1994 Northridge,<strong>California</strong> Earthquake: Bulletin <strong>of</strong> the Seismological Society <strong>of</strong> America, Vol. 86, No. 1B,pp. S350-S361.Lund, Le Val, 1994, Lifelines Performance in the Landers and Big Bear (<strong>California</strong>) Earthquakes<strong>of</strong> 28 June 1992: Bulletin <strong>of</strong> the Seismological Society <strong>of</strong> America, Vol. 84, No. 3, pp.562-572.Marin, M., Dolan, F.F., Hartleb, R.D., Christ<strong>of</strong>ferson, S.A., Tucker, A.Z., and Owen, L.A., 2000,A latest Pleistocene-Holocene Slip Rate on the Raymond Fault Based on 3-DTrenching, East Pasadena, <strong>California</strong>: EOS, 81 (48, supplement) F855.Martin, G.R., and Lew, M., 1999, (editors), Recommended procedures for implementation <strong>of</strong>DMG Special Publication 117 Guidelines for Evaluating and Mitigating Seismic2006 PAGE I - 8
Natural <strong>Hazard</strong>s <strong>Mitigation</strong> PlanCity <strong>of</strong> <strong>Glendale</strong>, <strong>California</strong>Appendix I – References<strong>Hazard</strong>s in <strong>California</strong> – Liquefaction <strong>Hazard</strong>s: Southern <strong>California</strong> Earthquake CenterPublication, 63p.Mileti, D., 1999, Disasters by Design: A Reassessment <strong>of</strong> Natural <strong>Hazard</strong>s in the United <strong>State</strong>s:Joseph Henry Press, Washington D.C.Morton, D.M., 1973, Geology <strong>of</strong> Parts <strong>of</strong> the Azusa and Mount Wilson Quadrangles, SanGabriel Mountains, Los Angeles County, <strong>California</strong>, <strong>California</strong> Division <strong>of</strong> Mines andGeology Special Report 105, 21p., 2 plates.Morton, D.M., and Streitz, R., 1969, Preliminary Reconnaissance Map <strong>of</strong> Major Landslides, SanGabriel Mountains, <strong>California</strong>, <strong>California</strong> Division <strong>of</strong> Mines and Geology Map Sheet 15.National Fire Protection Association (NFPA), 2001, Standard for the Organization andDeployment <strong>of</strong> Fire Suppression Operations, Emergency Medical Operations andSpecial Operations to the Public by Career Fire Departments: NFPA Standard 1710,2001 Edition.Oakeshott, Gordon B., editor, 1975, San Fernando, <strong>California</strong>, Earthquake <strong>of</strong> 9 February 1971:<strong>California</strong> Division <strong>of</strong> Mines and Geology, Bulletin 196, 462p.Oregon Department <strong>of</strong> Land Conservation and Development, 2000, Planning for Natural<strong>Hazard</strong>s: The Oregon Technical Resource Guide, Chapter 5.Palm, R., 1981, Real Estate Agents and Special Studies Zone Disclosure: The Response <strong>of</strong><strong>California</strong> Home Buyers to Earthquake <strong>Hazard</strong> Information: University <strong>of</strong> Colorado atBoulder, Natural <strong>Hazard</strong>s Research and Applications Information Center, MonographSeries No. 032.Perry, R.W., and Lindell, M.K., 1999, <strong>Hazard</strong>ous Materials Problems and Solutions inEarthquakes; in Annual Report and 16 th Meeting <strong>of</strong> the Western <strong>State</strong>s Seismic PolicyCouncil, pp. 93-117.Person, Waverly J., 1986, Earthquakes: July - August 1986: Earthquakes and Volcanoes, Vol.19, No. 1, pp. 32-35.Person, Waverly J., 1992, Earthquakes: March - April 1992: Earthquakes and Volcanoes, Vol.23, No. 5, pp. 227-233.Petersen, M. D. and Wesnousky, S.G., 1994, Fault slip rates and earthquake histories for activefaults in southern <strong>California</strong>: Bulletin <strong>of</strong> the Seismological Society <strong>of</strong> America, Vol. 84,No. 5, pp. 1608-1649.Petersen, M. D., Bryant, W.A., Cramer, C. H., Cao, T, Reichle, M.S, Frankel, A.D.,Lienkaemper, J.J., McCrory, P.A, and Schwartz, D. P., 1996, Probabilistic Seismic<strong>Hazard</strong> Assessment for the <strong>State</strong> <strong>of</strong> <strong>California</strong>: <strong>California</strong> Department <strong>of</strong> Conservation,Open File Report 96-08.Phillips, Clinton B., 1983, Instructions for Zoning Fire <strong>Hazard</strong> Severity in <strong>State</strong> ResponsibilityAreas in <strong>California</strong>: <strong>California</strong> Department <strong>of</strong> Forestry, dated December 1983.Pujol, J., Mueller, K., and Shen, P., 2001, Tomographic Imaging <strong>of</strong> Structure and Active Faultsin the San Fernando-Northridge Region, Southern <strong>California</strong>: EOS, Transactions <strong>of</strong> theAGU, Vol. 82.2006 PAGE I - 9
Natural <strong>Hazard</strong>s <strong>Mitigation</strong> PlanCity <strong>of</strong> <strong>Glendale</strong>, <strong>California</strong>Appendix I – ReferencesReneau, S.L., and Dietrich, W.E., 1987, The Importance <strong>of</strong> Hollows in Debris Flow Studies;Examples from Marin County, <strong>California</strong>; in Costa, J.E. and Wieczorek, G.F. (editors),Debris Flows/Avalanches: Process, Recognition, and <strong>Mitigation</strong>: Geological Society <strong>of</strong>America Reviews in Engineering Geology, Vol. VII, pp. 165-179.Richardson, E.V., Harrison, L.J., Richardson, J.R., and Davis, S.R., 1993, Evaluating scour atbridges (2d ed.): U.S. Department <strong>of</strong> Transportation Hydraulic Engineering Circular 18,132p.Richter, Charles. F., 1958, Elementary Seismology, W. H., Freeman, San Francisco.Rockwell, Thomas K., 2002, Personal Communication, on the recency <strong>of</strong> activity and style <strong>of</strong>faulting <strong>of</strong> the Hollywood, Raymond and Verdugo faults.Rodgers, J.D., Herber, L.J., Hibner, T.H., 1992, Paleolandslides in San Antonio Canyon, EasternSan Gabriel Mountains, <strong>California</strong>; in Pipkin, B.W. and Proctor, R.J. (editors),Engineering Geology Practice in Southern <strong>California</strong>: Association <strong>of</strong> EngineeringGeologists Special Publication No. 4, pp. 579-594.Rogers, A. M., Tinsely, J. C., and Borcherdt, R. D., 1985, Predicting Relative Ground Response;in Ziony (editor), Evaluating Earthquake <strong>Hazard</strong>s in the Los Angeles Region, An EarthScience Perspective: U.S. Geological Survey, Pr<strong>of</strong>essional Paper 1360, pp. 221-248.Roth R., Holtom, R., and Sai-on S., 1986, <strong>California</strong> Earthquake Zoning and Probable MaximumLoss Evaluation Program, <strong>California</strong> Administrative Code Title 10, Chapter 5,Subchapter 3, Section 2307: <strong>California</strong> Department <strong>of</strong> Insurance, Los Angeles,<strong>California</strong>, 44p.R.T. Frankian & Associates, 1968, Report <strong>of</strong> Geologic and Soil Investigation, VerdugoMountains Development and Conservation Study, <strong>Glendale</strong>, <strong>California</strong>: UnpublishedConsultant Report to the City <strong>of</strong> <strong>Glendale</strong>, Job No. 6233, dated September 20, 1968.Rubin, C., and Sieh, K., 1992, Active Crustal Shortening Along the Southern Flank <strong>of</strong> theCentral Transverse Ranges, <strong>California</strong>: Southern <strong>California</strong> Earthquake Center 1992Report, Prepared for the SCEC Annual Meeting, October 6-8, 1992, Los Angeles,<strong>California</strong>.Rubin, C.M., Linvall, S., and Rockwell, T., 1998, Paleoseismic Evidence for Large SlipEarthquakes Along the Sierra Madre Fault in the Greater Los Angeles Region: Science,Vol. 281, p. 398-402.Rymer, M.J., Fumal, T.E., Schwartz, D.P., Powers, T.J., and Cinti, F.R., 1995, Distribution andRecurrence <strong>of</strong> Surface Fractures in Potrero Canyon Associated with the 1994Northridge, <strong>California</strong>, Earthquake; in Woods, M.C., and Seiple, W.R., (editors), TheNorthridge, <strong>California</strong>, Earthquake <strong>of</strong> 17 January 1994: <strong>California</strong> Division <strong>of</strong> Minesand Geology Special Publication 116, pp. 133-146.Savage, W.U., 1995, Utility Lifelines Performance in the Northridge Earthquake; in Woods,M.C., and Seiple, W.R., (editors), The Northridge Earthquake <strong>of</strong> 17 January 1994:<strong>California</strong> Division <strong>of</strong> Mines and Geology Special Publication 116, p. 153-162.2006 PAGE I - 10
Natural <strong>Hazard</strong>s <strong>Mitigation</strong> PlanCity <strong>of</strong> <strong>Glendale</strong>, <strong>California</strong>Appendix I – ReferencesScawthorn, C., 1987, Fire Following Earthquake, Estimates <strong>of</strong> the Conflagration Risk toInsured, Property in Greater Los Angeles and San Francisco: All Industry ResearchAdvisory Council, Oak Brook, Illinois, 83p.Schuster, R.L. and Highland, L.M., 2001, Socioeconomic and environmental impacts <strong>of</strong>landslides in the Western Hemisphere: U.S. Geological Survey Open-File Report 2001-276.Sharpe, R., 1982, An Investigation <strong>of</strong> the Correlation between Earthquake Ground Motion andBuilding Performance: Applied Technology Council, U.S. Contract Survey,No. 14-08-0001-19892, 113p.Shaw, J.H., and Suppe, J., 1996, Earthquake <strong>Hazard</strong>s <strong>of</strong> Active Blind-Thrust Faults Under theCentral Los Angeles Basin, <strong>California</strong>: Journal <strong>of</strong> Geophysical Research, Vol. 101, pp.8623-8642Shaw, J.H., and Shearer, P., 1999, An Elusive Blind-Thrust Fault Beneath Metropolitan LosAngeles: Science, Vol. 283, pp. 1516-1518.Sieh, K. and Williams, P., 1990, Behavior <strong>of</strong> the southernmost San Andreas fault during the past300 years: Journal <strong>of</strong> Geophysical Research, Vol. 95, pp. 6629-6645.Sieh, K.L., Jones, L., Hauksson, E., Hudnut, K., Eberhart-Phillips, D., Heaton, T., Hough, S.,Hutton, K., Kanamori, H., Lilje, A., Lindvall, S., McGill, S., Mori, J., Rubin, C., Spotila,J., Stock, J., Thio, H. K., Treiman, J., Wernicke, B., Zachariasen, J., 1993, Near FieldInvestigations <strong>of</strong> the Landers Earthquake Sequence, April to July, 1992: Science, Vol.260, pp. 171-176.Smith, D.P., 1986, Geology <strong>of</strong> the North Half <strong>of</strong> the Pasadena Quadrangle, Los Angeles County,<strong>California</strong>: <strong>California</strong> Division <strong>of</strong> Mines and Geology Open-File Report 86-4 LA, 39p., 4plates.Southern <strong>California</strong> Area Mapping Project (SCAMP), 2001, Debris Flow Occurrence Map forthe East Half <strong>of</strong> the Los Angeles 1:100,000 Quadrangle,(available at http://wrgis.wr.usgs.gov/wgmt/scamp/scamp.html).Southern <strong>California</strong> Earthquake Center (SCEC), 2002, Recommended Procedures forImplementation <strong>of</strong> DMG Special Publication 117 Guidelines for Analyzing andMitigating Landslide <strong>Hazard</strong>s in <strong>California</strong>; by Blake, T.F., Hollingsworth, R.A., andStewart, J.P. (editors), 110p. + Appendix.Southern <strong>California</strong> Earthquake Center (SCEC), 2001, Southern <strong>California</strong> Faults andEarthquakes, World-Wide <strong>Web</strong> Site: www.scecdc.scec.org.Southern <strong>California</strong> Earthquake Center (SCEC), 1999, Recommended Procedures forImplementation <strong>of</strong> DMG Special Publication 117 Guidelines for Analyzing andMitigating Liquefaction <strong>Hazard</strong>s in <strong>California</strong>, 63p.Spangle, W. E., 1988, Putting Seismic Safety Policies to Work: Prepared for the Bay AreaRegional Earthquake Preparedness Project, 39p.Spittler, T.E., Harp, E.L., Keefer, D.K., Wilson, R.C., and Sydnor, R.H., 1990, LandslideFeatures and Other Coseismic Fissures Triggered by the Loma Prieta Earthquake,Santa Cruz Mountains, <strong>California</strong>; in McNutt, S.R., and Sydnor, R.H., (editors), The2006 PAGE I - 11
Natural <strong>Hazard</strong>s <strong>Mitigation</strong> PlanCity <strong>of</strong> <strong>Glendale</strong>, <strong>California</strong>Appendix I – ReferencesLoma Prieta (Santa Cruz Mountains), <strong>California</strong>, Earthquake <strong>of</strong> 17 October 1989:<strong>California</strong> Division <strong>of</strong> Mines and Geology Special Publication 104, pp. 59-66.<strong>State</strong> <strong>of</strong> <strong>California</strong>, Office <strong>of</strong> Planning and Research (OPR), 1987, General Plan Guidelines.<strong>State</strong> <strong>of</strong> <strong>California</strong>, SSC-01, Seismic Safety Commission, 1988, Steps to Earthquake Safety forLocal Governments, Report No. SSC 88-01.<strong>State</strong> <strong>of</strong> <strong>California</strong>, SSC-03, Seismic Safety Commission, 1987-03, Guidebook to Identify andMitigate Seismic <strong>Hazard</strong>s in Buildings, Report No. SSC 87-03.Stewart, J.P., Bray, J.D., McMahon, D.J., and Kropp, A.L., 1995, Seismic Performance <strong>of</strong> HillsideFills: Reprint from Landslides Under Static and Dynamic Conditions-Analysis,Monitoring, and <strong>Mitigation</strong>: Geotechnical Engineering Division/ASCE, held October23-27, 1995, San Diego.Stewart, C.A., Colby, N.D, Kent, R.T., Egan, J.A., and Hall, N.T., 1998, Earth Fissuring,Ground-Water Flow, and Ground-Water Quality in the Chino Basin, <strong>California</strong>; inBorchers, J.W., (editor), Land Subsidence, Case Studies and Current Research:Association <strong>of</strong> Engineering Geologists Special Publication No. 8; Proceedings <strong>of</strong> the Dr.Joseph F. Poland Symposium on Land Subsidence.Sudduth, C., 1985, Evaluating Earthquake Ground Failure Potential for DevelopmentDecisions, Summary <strong>of</strong> Working Group V and Audience Discussion; in FutureDirections in Evaluating Earthquake <strong>Hazard</strong>s in Los Angeles Region, An Earth-SciencePerspective: U.S. Geological Survey, Pr<strong>of</strong>essional Paper 1360, pp. 320.Tan, S. S., 1998, Slope Failure and Erosion Assessment <strong>of</strong> the Fire Areas at Fillmore (April1996) and Piru (August 1997), Ventura County, <strong>California</strong>: <strong>California</strong> Division <strong>of</strong> Minesand Geology Open File Report 98-32.Tinsley, J.C., Youd, T.L., Perkins, D.M., and Chen, A.T.F., 1985, Evaluating LiquefactionPotential in Ziony, J.I., (editor), Evaluating Earthquake <strong>Hazard</strong>s in the Los AngelesRegion – An Earth Science Perspective: U.S. Geological Survey Pr<strong>of</strong>essional Paper1360, pp. 263-316.Tinsley, J.C., and Fumal, T.E., 1985, Mapping Quaternary Sedimentary Deposits for AerialVariations in Shaking Response; in Ziony, J.I., (editor), Evaluating Earthquake <strong>Hazard</strong>sin the Los Angeles Region – An Earth Science Perspective: U.S. Geological SurveyPr<strong>of</strong>essional Paper 1360, pp. 101-125.Townley, Sidney D. (1939). Earthquakes in <strong>California</strong>, 1769 to 1928: Bulletin <strong>of</strong> theSeismological Society <strong>of</strong> America, Vol. 29, No. 1, pp. 21-252.Treiman, J.A., 1995, Surface Faulting Near Santa Clarita; in Woods, M.C., and Seiple, W.R.,(editors), The Northridge, <strong>California</strong>, Earthquake <strong>of</strong> 17 January 1994: <strong>California</strong>Division <strong>of</strong> Mines and Geology Special Publication 116, pp. 103-110.Tucker, A.Z., and Dolan, J.F., 2001, Paleoseismologic Evidence for a >8 ka Age <strong>of</strong> the MostRecent Surface Rupture on the Eastern Sierra Madre Fault, Northern Los AngelesMetropolitan Region, <strong>California</strong>: Seismological Society <strong>of</strong> America Bulletin, Vol. 91, pp.232-249.2006 PAGE I - 12
Natural <strong>Hazard</strong>s <strong>Mitigation</strong> PlanCity <strong>of</strong> <strong>Glendale</strong>, <strong>California</strong>Appendix I – ReferencesTsutsumi, H., Yeats, R.S., and Huftile, G. H., 2001, Late Cenozoic Tectonics <strong>of</strong> the NorthernLos Angeles Fault System, <strong>California</strong>: Geological Society <strong>of</strong> America, Vol. 113, No. 4,pp. 454-468.Tsutsumi, H., and Yeats, R.S., 1999, Tectonic Setting <strong>of</strong> the 1971 Sylmar and 1994 NorthridgeEarthquakes in the San Fernando Valley, <strong>California</strong>: Seismological Society <strong>of</strong> AmericaBulletin, Vol. 89, pp. 1232-1249.U.S. Army Corps <strong>of</strong> Engineers, 2001, Manuals for HEC-RAS, Version 3.0, CPD-86, datedJanuary 2001.U.S. Geological Survey, 1986, Earthquake <strong>Hazard</strong>s in Southern <strong>California</strong>: Proceedings <strong>of</strong>XXXII Conference: U.S. Geological Survey Open File Report 86-401, pp. 158-172.U.S. Geological Survey, 1997, National <strong>Hazard</strong> Maps for <strong>California</strong> / Nevada: U.S. GeologicalSurvey Open-File Report 97-130; (for additional information refer tohttp://geohazards.cr.usgs.gov/eq/html/canvmap.html).U.S. Geological Survey, 2000, Landslide <strong>Hazard</strong>s, USGS Fact Sheet FS-071-00, available athttp://greenwood.cr.usgs.gov/pub/fact-sheets.fs-071-00.U.S. Geological Survey, 2001a, http://landslides.usgs.gov/index.htmlUS. Geological Survey, 2001b, http://pasadena.wr.usgs.gov/shake/ca/Verdugo Fire Communications Center, 2000, Annual Report.Verdugo Fire Communications Center, 2002, Annual Report.Waananen, A.O., 1969, Floods <strong>of</strong> January and February 1969 in Central and Southern<strong>California</strong>: U.S. Geological Survey Open File Report, 233p.Wald, D.J., Quitoriano, V., Heaton, T.H., and Kanamori, H., 1999, Relationships between PeakGround Acceleration, Peak Ground Velocity, and Modified Mercalli Intensity in<strong>California</strong>: Earthquake Spectra, the Pr<strong>of</strong>essional Journal <strong>of</strong> the Earthquake EngineeringResearch Institute (EERI), Vol. 15, No. 3, pp. 557-564.Walls, C., Rockwell, T., Mueller, K., Bock, Y., Williams, S., Pfanner, J., and Fang, P., 1998,Escape Tectonics in the Los Angeles Metropolitan Region and Implications for SeismicRisk: Nature, Vol. 394, pp. 356-360.Weaver, K.D., and Dolan, J.F., 2000, Paleoseismology and Geomorphology <strong>of</strong> the RaymondFault, Los Angeles County, <strong>California</strong>: Bulletin <strong>of</strong> the Seismological Society <strong>of</strong> America,Vol. 90, No. 6, pp. 1409-1429.<strong>Web</strong>er, F.H., Treiman, J.A., Tan, S.S., and Miller, R.V., 1979, Landslides in the Los AngelesRegion, <strong>California</strong>: Effects <strong>of</strong> the February-March 1978 Rains, <strong>California</strong> Division <strong>of</strong>Mines and Geology Open-File Report 79-4, 277p., 1 plate.<strong>Web</strong>er, Jr., F.H., 1980a, Chapter D: Geology and Subsurface Features Related to Character andRecency <strong>of</strong> Movement Along Faults, North-Central Los Angeles Area, Los AngelesCounty, <strong>California</strong> – A Preliminary Report; in Hill, R..L., and others, Earthquake<strong>Hazard</strong>s Associated with Faults in the Greater Los Angeles Area, Los Angeles County,<strong>California</strong>, Including Faults in the Santa Monica-Raymond, Verdugo-Eagle Rock, and2006 PAGE I - 13
Natural <strong>Hazard</strong>s <strong>Mitigation</strong> PlanCity <strong>of</strong> <strong>Glendale</strong>, <strong>California</strong>Appendix I – ReferencesBenedict Canyon Fault Zones: <strong>California</strong> Division <strong>of</strong> Mines and Geology Open FileReport 79-16-LA, pp. D-1-D57.<strong>Web</strong>er, F.H., 1980b, Landsliding and Flooding in Southern <strong>California</strong> During the Winter <strong>of</strong>1979-1980 (Principally February 13-21, 1980), <strong>California</strong> Division <strong>of</strong> Mines andGeology Open-File Report 80-3 LA, 69p.<strong>Web</strong>er, Jr., F.H., Chapman, R., Chase, G., and Saul, R.B., 1980, Earthquake <strong>Hazard</strong>s Associatedwith the Verdugo-Eagle Rock and Benedict Canyon Fault Zone, Los Angeles County,<strong>California</strong>: <strong>California</strong> Division <strong>of</strong> Mines and Geology Open File Report 80-1-LA, 27p.Wells, W.G., 1987, The Effects <strong>of</strong> Fire on the Generation <strong>of</strong> Debris Flows in Southern<strong>California</strong>; in Costa, J.E. and Wieczorek, G.F. (editors), Debris Flows/Avalanches:Process, Recognition, and <strong>Mitigation</strong>: Geological Society <strong>of</strong> America Reviews inEngineering Geology, Vol. VII, pp. 105-114.Wesnousky, S.G., 1986, Earthquakes, Quaternary Faults, and Seismic <strong>Hazard</strong> in <strong>California</strong>:Journal <strong>of</strong> Geophysical Research, Vol. 91, No. B12, pp. 12,587-12,631.Wilson, R.C., 1997, Operation <strong>of</strong> a Landslide Warning System During the <strong>California</strong> StormSequence <strong>of</strong> January and February 1993; in Larson, R.A., and Slosson, J.E. (editors),Storm-Induced Geologic <strong>Hazard</strong>s: Case Histories from the 1992-1993 Winter inSouthern <strong>California</strong> and Arizona: Geological Society <strong>of</strong> America Reviews inEngineering Geology, Vol. XI, pp. 61-70.Wilson, R.C., and Keefer, D.K., 1985, Predicting Areal Limits <strong>of</strong> Earthquake InducedLandsliding: in Ziony, (editor), Evaluating Earthquake <strong>Hazard</strong>s in the Los AngelesRegion, An Earth Science Perspective: U.S. Geological Survey Pr<strong>of</strong>essional Paper 1360,pp. 317-347.Wolfe, M. R., Bolton, P. A., Heikkala, Greene M. M., May, P. J., 1986, Land-Use Planning forEarthquake <strong>Hazard</strong> <strong>Mitigation</strong>: A Handbook for Planners: Natural <strong>Hazard</strong>s Researchand Applications Information Center, Special Publication 14, 122p.Wood, Harry O., 1933, Preliminary Report on the Long Beach Earthquake <strong>of</strong> March 10, 1933:Bulletin <strong>of</strong> the Seismological Society <strong>of</strong> America, Vol. 23, No. 2, pp. 43-56.Working Group on <strong>California</strong> Earthquake Probabilities, 1995, Seismic <strong>Hazard</strong>s in Southern<strong>California</strong>: Probable Earthquakes, 1994 to 2024: Bulletin <strong>of</strong> the Seismological Society <strong>of</strong>America, Vol. 85, No. 2, pp, 379-493.Wright, T.L., 1991, Structural Geology and Tectonic Evolution <strong>of</strong> the Los Angeles Basin,<strong>California</strong>; in Biddle, K. (editor), Active Margin Basins, American Association <strong>of</strong>Petroleum Geologists Memoir 52, pp. 35-134.Wyllie, D.C., and Norrish, N.I., 1996, Stabilization <strong>of</strong> Rock Slopes; in Turner, A.K., andSchuster, R.L. (eds.), Landslides – Investigation and <strong>Mitigation</strong>: TransportationResearch Board Special Publication 247, pp. 474-504.Yeats, R.S., 1982, Low-shake faults <strong>of</strong> the Ventura Basin, <strong>California</strong>; in Cooper, J.D., (compiler),Neotectonics <strong>of</strong> Southern <strong>California</strong>: Fieldtrip Guidebook prepared for the 78 th AnnualMeeting <strong>of</strong> the Geological Society <strong>of</strong> America, Anaheim, <strong>California</strong>, April 19-21, 1982,pp. 3-23.2006 PAGE I - 14
Natural <strong>Hazard</strong>s <strong>Mitigation</strong> PlanCity <strong>of</strong> <strong>Glendale</strong>, <strong>California</strong>Appendix I – ReferencesYerkes, R. F., 1997a, Preliminary Geologic Map <strong>of</strong> Sunland 7.5’ Quadrangle, Southern<strong>California</strong>: U. S. Geological Survey Open File Report 97-270.Yerkes, R. F., 1997b, Preliminary Geologic Map <strong>of</strong> the Burbank 7.5’ Quadrangle, Southern<strong>California</strong>: U. S. Geological Survey Open File Report 97-166.Yerkes, R. F., and Graham, S. E., 1997a, Preliminary Geologic Map <strong>of</strong> the Los Angeles 7.5’Quadrangle, Southern <strong>California</strong>: U. S. Geological Survey Open File Report 97-432.Yerkes, R. F., and Graham, S. E., 1997b, Preliminary Geologic Map <strong>of</strong> the Hollywood 7.5’Quadrangle, Southern <strong>California</strong>: U. S. Geological Survey Open File Report 97-432Youd, T.L., Hansen, C.M., and Bartlett, S.F., 1999, Revised MLR Equations for PredictingLateral Spread Displacement; in O’Rurke, Thomas D., Bardet, J.P., and Hamada, M.,(editors), Proceedings <strong>of</strong> the Seventh U.S. – Japan Workshop on Earthquake ResistantDesign <strong>of</strong> Lifeline Facilities and Countermeasures Against Soil Liquefaction:Multidisciplinary Center for Earthquake Engineering Research, SUNY, Buffalo,MCEER Report 99-0019, pp. 99-114.Youd, L. T., 1986, Geologic effects - liquefaction and associated ground failure: Proceedings <strong>of</strong>the 1986 Annual Conference Western Seismic Policy Council, pp. 8-30.Youd, T. L., 1978, Major Cause <strong>of</strong> Earthquake Damage is Ground Failure: Civil Engineering,Vol. 48, No. 4, pp. 47-51.Youd, T.L., and Perkins, D.M., 1978, Mapping liquefaction-induced ground failure potential:Proceedings <strong>of</strong> the American Society <strong>of</strong> Civil Engineers, Journal <strong>of</strong> the GeotechnicalEngineering Division, Vol. 104, No. GT4, pp. 433-446.Youd, T. L., and Keefer, D. K., 1981, Earthquake-induced ground failures; in Hays, W. W., ed.,Facing Geologic and Hydrologic <strong>Hazard</strong>s: U. S. Geologic Survey Pr<strong>of</strong>essional Paper1240-B, p. 23-31.Youd, T.L., Idriss, I.M. Andrus, R.D. Arango, I., Castro, G., Christian, J.T., Dobry, R., LiamFinn, W.D.L., Harder, L.F., Jr., Hynes, M.E., Ishihara, K., Koester, J.P., Liao, S.S.C.,Marcuson, W.F., III, Martin, G.R., Mitchell, J.K., Moriwaki, Y., Power, M.S.,Robertson, P.K., Seed, R.B., Stokoe, K.H., II, 2001, Liquefaction Resistance <strong>of</strong> Soils:Summary Report from the 1996 NCEER and 1998 NCEER/NSF Workshops onEvaluation <strong>of</strong> Liquefaction Resistance <strong>of</strong> Soils, ASCE, Journal <strong>of</strong> Geotechnical andGeoenvironmental Engineering, Vol. 127, No. 10, pp. 817-833Ziony, J.I., and Yerkes, R.F., 1985, Evaluating earthquake and surface-faulting potential; inZiony, J.I. (editor), Evaluating Earthquake <strong>Hazard</strong>s in the Los Angeles Region – AnEarth-Science Perspective: U.S Geological Survey Pr<strong>of</strong>essional Paper 1360, pp. 33-91.Helpful <strong>Web</strong>sites:http://www.ci.glendale.ca.us/http://fire.ci.glendale.ca.us/http://www.consrv.ca.gov(City <strong>of</strong> <strong>Glendale</strong>)(<strong>Glendale</strong> Fire Department)(<strong>California</strong> Department <strong>of</strong> Conservation)2006 PAGE I - 15
Natural <strong>Hazard</strong>s <strong>Mitigation</strong> PlanCity <strong>of</strong> <strong>Glendale</strong>, <strong>California</strong>Appendix I – Referenceshttp://www.consrv.ca.gov/cgs/http://www.cpuc.ca.govhttp://www.fire.ca.govhttp://www.oes.ca.govhttp://www.fire.ca.govhttp://www.gps.caltech.eduhttp://www.oes.ca.govhttp://www.seismic.ca.govhttp://www.sce.comhttp://www.data.scec.orghttp://www.nifc.govhttp://www.census.govhttp://www.eqe.comhttp://www.fema.govhttp://www.fema.gov/hazushttp://www.usgs.gov(<strong>California</strong> Geological Survey)(<strong>California</strong> Public Utilities Commission)(<strong>California</strong> Department <strong>of</strong> Forestry & Fire Protection)(<strong>California</strong> Office <strong>of</strong> Emergency Services)(<strong>California</strong> Department <strong>of</strong> Forestry & Fire Protection)(<strong>California</strong> Institute <strong>of</strong> Technology, GPS Division)(<strong>California</strong> Office <strong>of</strong> Emergency Services)(<strong>California</strong> Seismic Safety Commission)(Southern <strong>California</strong> Edision)(Southern <strong>California</strong> Earthquake Center)(National Interagency Fire Center)(U.S. Census Bureau)(Risk Management - ABS Consulting)(FEMA)(FEMA’s HAZUS website)(U.S. Geological Survey)2006 PAGE I - 16
Natural <strong>Hazard</strong>s <strong>Mitigation</strong> PlanCity <strong>of</strong> <strong>Glendale</strong>, <strong>California</strong>APPENDIX J: AdoptionAppendix J – AdoptionAdoption By Council2006 PAGE J - 1
Natural <strong>Hazard</strong>s <strong>Mitigation</strong> PlanCity <strong>of</strong> <strong>Glendale</strong>, <strong>California</strong>Appendix J – Adoption2006 PAGE J - 2
Natural <strong>Hazard</strong>s <strong>Mitigation</strong> PlanCity <strong>of</strong> <strong>Glendale</strong>Executive SummaryEXECUTIVE SUMMARYFive -Year Action PlanThe City <strong>of</strong> <strong>Glendale</strong>’s Local Natural <strong>Hazard</strong>s <strong>Mitigation</strong> Plan (the <strong>Mitigation</strong> Plan or “thePlan”) includes resources and information to assist city residents, public and private sectororganizations, and others interested in preparing to deal with natural hazards. The <strong>Mitigation</strong>Plan provides a list <strong>of</strong> action items and programs that may assist <strong>Glendale</strong> in reducing risk andpreventing loss from future natural hazard events. The action items address multi-hazardissues, as well as specific mitigation measures for earthquakes, wildfires, floods, and landslidesor debris flows.How is the Plan Organized?The <strong>Mitigation</strong> Plan contains a five-year action plan, background on the purpose andmethodology used to develop the Plan, a pr<strong>of</strong>ile <strong>of</strong> <strong>Glendale</strong>, sections on four natural hazardsthat occur within the city, and a number <strong>of</strong> appendices. All <strong>of</strong> the sections are described in detailin Section 1, the Plan Introduction.Who Participated in Developing the Plan?The <strong>Glendale</strong> Local Natural <strong>Hazard</strong>s <strong>Mitigation</strong> Plan is the result <strong>of</strong> a collaborative effortbetween various City Departments and their consultant, public agencies and non-pr<strong>of</strong>itorganizations, the private sector and local citizens, and regional and state organizations. Publicparticipation played a key role in the development <strong>of</strong> goals and action items. Informationregarding the various natural hazards that can impact the city <strong>of</strong> <strong>Glendale</strong> was made availableto the public in a variety <strong>of</strong> forums since 2003, when the City’s Safety Element <strong>of</strong> the GeneralPlan was updated. This Plan builds on the work begun in 2003; the chapters on natural hazardsare similar to those in the Technical Background Report to the Safety Element, but additionalinformation on each <strong>of</strong> these hazards, formatted in accordance with the Federal EmergencyManagement Agency’s (FEMA) requirements for these documents, is included herein.Presentations to various stakeholders have been made across the City, both as part <strong>of</strong> theoriginal Safety Element work, and for this project. The Draft version <strong>of</strong> the Plan was posted onthe City’s website to allow for, and provide ongoing citizen/stakeholder information andparticipation. A link to post comments and questions regarding the Draft document wasprovided on the City’s website. This document also benefited from the input and guidanceprovided by the members <strong>of</strong> the <strong>Hazard</strong> <strong>Mitigation</strong> Steering and Advisory Committees, whomguided the process <strong>of</strong> developing the Plan from its inception.The Steering Committee was comprised <strong>of</strong> representatives from: City <strong>of</strong> <strong>Glendale</strong> Fire Department and Emergency Services City <strong>of</strong> <strong>Glendale</strong> Planning Department City <strong>of</strong> <strong>Glendale</strong> Management Services and City <strong>of</strong> <strong>Glendale</strong> Public Works DepartmentThe Advisory Committee included the members listed above, plus representatives from theseother City departments and organizations:2006 PAGE ES - 1
Natural <strong>Hazard</strong>s <strong>Mitigation</strong> PlanCity <strong>of</strong> <strong>Glendale</strong>Executive Summary City <strong>of</strong> <strong>Glendale</strong> Police Department City <strong>of</strong> <strong>Glendale</strong> Water and Power City <strong>of</strong> <strong>Glendale</strong> Parks, Recreation, and Community Services City <strong>of</strong> <strong>Glendale</strong> Information Services City <strong>of</strong> <strong>Glendale</strong> Development Services <strong>Glendale</strong> Unified School District <strong>Glendale</strong> Memorial Hospital, and Verdugo Hills Hospital.The template used for this document was originally prepared by the Office <strong>of</strong> DisasterManagement, Area C. Their permission to use and build upon the original document is hereinkindly acknowledged. The information presented in this Plan is a compilation from manydifferent sources (listed in Appendices A and I); however, the following organizations meritspecial recognition for the wealth <strong>of</strong> information they provide to the general public. These areresources that the Advisory Committee should rely on both during the implementation <strong>of</strong> theaction items contained in this plan, and in the development <strong>of</strong> future Plans. <strong>California</strong> Geological Survey (CGS) U.S. Geological Survey (USGS) Federal Emergency Management Agency (FEMA) Southern <strong>California</strong> Earthquake Center (SCEC) Southern <strong>California</strong> Association <strong>of</strong> Governments (SCAG) Governor’s Office <strong>of</strong> Emergency Services (OES)What is the Plan’s Mission?The mission <strong>of</strong> the <strong>Glendale</strong> Local Natural <strong>Hazard</strong>s <strong>Mitigation</strong> Plan is to promote sound publicpolicy designed to protect citizens, critical facilities, infrastructure, private property, and theenvironment from natural hazards. This can be achieved by increasing public awareness,documenting resources available for risk reduction and loss prevention, and identifyingactivities to guide the City towards building a safer, more sustainable community.What are the Plan’s Goals?The goals <strong>of</strong> the <strong>Mitigation</strong> Plan describe the overall direction that the City <strong>of</strong> <strong>Glendale</strong>,through its departments, agencies, organizations, and citizens, can take toward reducing its riskto natural hazards. The goals <strong>of</strong> the Plan are stepping-stones between the broad direction <strong>of</strong> themission statement and the specific recommendations outlined in the action items. The maingoals <strong>of</strong> <strong>Glendale</strong>’s <strong>Mitigation</strong> Plan are summarized below.Protect Life and Property♦ Implement activities that assist in protecting lives by making homes, businesses,infrastructure, critical facilities, and other property more resistant to losses from naturalhazards.♦ Reduce losses and repetitive damages for chronic hazard events while promotingmitigation measures and insurance coverage for catastrophic hazards.2006 PAGE ES - 2
Natural <strong>Hazard</strong>s <strong>Mitigation</strong> PlanCity <strong>of</strong> <strong>Glendale</strong>Executive Summary♦ Improve the quality and availability <strong>of</strong> hazard assessment information to empower theCity’s residents and property owners in understanding and requiring that newdevelopment in high hazard areas be avoided, and that preventive measures in existingdevelopment in areas vulnerable to natural hazards be implemented.Public Awareness♦♦Develop and implement education and outreach programs to increase public awareness<strong>of</strong> the risks associated with natural hazards in <strong>Glendale</strong>.Provide information on tools, partnership opportunities, and funding resources to assistin implementing mitigation activities.Natural Systems♦♦Balance natural resource management and land use planning with natural hazardmitigation to protect life, property, and the environment.Preserve, rehabilitate, and enhance natural systems to serve natural hazard mitigationfunctions.Partnerships and Implementation♦♦Strengthen communication and coordinate participation among and within publicagencies, citizens, non-pr<strong>of</strong>it organizations, businesses, and industry to gain a vestedinterest in implementation.Encourage leadership within public and private sector organizations to prioritize andimplement local and regional hazard mitigation activities.Emergency Services♦♦♦Establish policy to ensure that mitigation projects for critical facilities, services, andinfrastructure are given priority.Strengthen emergency operations by increasing collaboration and coordination amongpublic agencies, non-pr<strong>of</strong>it organizations, businesses, and industry.Where appropriate, coordinate and integrate natural hazard mitigation activities withemergency operations plans and procedures.How Are the Action Items Organized?The action items are a list <strong>of</strong> activities that <strong>Glendale</strong>’s agencies and citizens can implement toreduce risk in the community. Some action items have community-wide application, whereasothers can be implemented on an individual basis by residents and business owners. Each actionitem includes an estimate <strong>of</strong> the time line for implementation. Short-term action items areactivities that the City’s agencies may implement with existing resources and authorities withinone to two years. Long-term action items may require new or additional resources or2006 PAGE ES - 3
Natural <strong>Hazard</strong>s <strong>Mitigation</strong> PlanCity <strong>of</strong> <strong>Glendale</strong>Executive Summaryauthorities, and may take between one and five years (or more) to implement.Chapter 4 includes all <strong>of</strong> the action items developed for the Plan, including both multi-hazardaction items, and hazard-specific action items. The hazard-specific action items are alsorepeated in the appropriate chapter <strong>of</strong> the Plan dealing with that specific hazard (Chapter 6:Earthquakes; Chapter 7: Wildfires; Chapter 8: Floods; and Chapter 9: Landslides and SlopeInstability). Natural hazard data specific to the <strong>Glendale</strong> area were collected, researched, andanalyzed. These data were then presented to the <strong>Hazard</strong> <strong>Mitigation</strong> Advisory Committee, whodeveloped draft action items. The proposed (draft) action items were presented to and discussedwith City staff and the public (see Appendix B); their feedback was used to finalize the actionitems presented in the Plan. Each action item is followed by the following information:C oordinating OrganizationThecoordinating organization is the public agency with regulatory responsibility toaddress natural hazards, or that is willing and able to organize resources, find appropriatefunding, or oversee activity implementation, monitoring, and evaluation. Coordinatingorganizations may include local, county, or regional agencies that are capable <strong>of</strong> orresponsible for implementing activities and programs.TimelineAction items include both short- and long-term activities. Each action item includes anestimate <strong>of</strong> the time line for implementation. Short-term action items are activities which<strong>Glendale</strong>’s agencies are capable <strong>of</strong> implementing with existing resources and authoritieswithin one to two years. Long-term action items may require new or additional resourcesor authorities, and may take between one and five years (or more) to implement.I deas for ImplementationEach action item includes ideas for implementation and potential resources, which mayinclude grant programs or human resources.P lan Goals AddressedThe<strong>Mitigation</strong> Plan needs to be regularly monitored and evaluated to measure its successin achieving its goals once implementation begins. To that end, the plan goals addressedby each action item are included – they provide the means by which the success <strong>of</strong> eachaction can be measured. The plan goals are organized into the following five areas: Protect Life and Property Public Awareness Natural Systems Partnerships and Implementation Emergency ServicesPartner OrganizationsPartner Organizations are not listed with the individual action items, but they are listed inAppendix A. Partner Organizations are agencies or public/private sector organizationsthat may be able to assist in the implementation <strong>of</strong> action items by providing relevant2006 PAGE ES - 4
Natural <strong>Hazard</strong>s <strong>Mitigation</strong> PlanCity <strong>of</strong> <strong>Glendale</strong>Executive Summaryresources to the coordinating organization. The partner organizations listed in theResource Directory (Appendix A) <strong>of</strong> the City <strong>of</strong> <strong>Glendale</strong>’s Local Natural <strong>Hazard</strong>s<strong>Mitigation</strong> Plan are potential partners recommended by the <strong>Hazard</strong> <strong>Mitigation</strong> AdvisoryBoard. These organizations, however, were not contacted during the development <strong>of</strong> the<strong>Mitigation</strong> Plan, and should therefore be contacted by the coordinating organization toestablish their commitment <strong>of</strong> time and resources to action items.C onstraintsConstraints may apply to some <strong>of</strong> the action items. These constraints may be a lack <strong>of</strong> Citystaff, lack <strong>of</strong> funds, or vested property rights, which might expose the City <strong>of</strong> <strong>Glendale</strong> tolegal action as a result <strong>of</strong> adverse impacts on private property.How Will the Plan be Implemented, Monitored,and Evaluated?The Plan Maintenance Section <strong>of</strong> this document details the formal process that will ensure thatthe <strong>Glendale</strong> Local Natural <strong>Hazard</strong>s <strong>Mitigation</strong> Plan remains an active and relevant document.The plan maintenance process includes a schedule for monitoring and evaluating the Planannually and producing a Plan revision every five years. This section describes how the Citywill integrate public participation throughout the plan maintenance process. Finally, thissection includes an explanation <strong>of</strong> how the City’s government intends to incorporate themitigation strategies outlined in this Plan into existing planning mechanisms such as the City’sGeneral Plan, Building and Safety Codes, and community development plans.Plan AdoptionAdoption <strong>of</strong> the Local <strong>Hazard</strong> <strong>Mitigation</strong> Plan by the local jurisdiction’s governing body is one<strong>of</strong> the prime requirements for approval <strong>of</strong> the Plan. Once the Plan is completed, the CityCouncil will be responsible for adopting the City <strong>of</strong> <strong>Glendale</strong>’s Local <strong>Hazard</strong>s <strong>Mitigation</strong> Plan.The local agency governing body has the responsibility and authority to promote sound publicpolicy regarding natural hazards. The City Council will periodically need to re-adopt the Planas it is revised to meet changes in the natural hazard risks and exposures in the community.The approved Local Natural <strong>Hazard</strong> <strong>Mitigation</strong> Plan will be significant in the future growthand development and redevelopment <strong>of</strong> the community.Coordinating BodyThe City <strong>of</strong> <strong>Glendale</strong> <strong>Hazard</strong> <strong>Mitigation</strong> Strategic Committee will be responsible forcoordinating implementation <strong>of</strong> Plan action items and undertaking the formal review process.The City’s Manager, or his or her designee, can and will assign representatives from Cityagencies and other organizations to serve in this committee, as appropriate, including, but notlimited to, the current <strong>Hazard</strong> <strong>Mitigation</strong> Advisory Committee members.ConvenerTheCity Council will adopt the City <strong>of</strong> <strong>Glendale</strong> Local Natural <strong>Hazard</strong> <strong>Mitigation</strong> Plan, and the2006 PAGE ES - 5
Natural <strong>Hazard</strong>s <strong>Mitigation</strong> PlanCity <strong>of</strong> <strong>Glendale</strong>Executive Summary<strong>Hazard</strong> <strong>Mitigation</strong> Advisory Committee will take responsibility for Plan implementation. TheCity Mayor, or designee, will serve as a convener to facilitate the <strong>Hazard</strong> <strong>Mitigation</strong> AdvisoryCommittee meetings, and will assign tasks such as updating and presenting the Plan to themembers <strong>of</strong> the committee. Plan implementation and evaluation will be a shared responsibilityamong all <strong>of</strong> the <strong>Hazard</strong> <strong>Mitigation</strong> Advisory Committee members.Implementation through Existing ProgramsThe City <strong>of</strong> <strong>Glendale</strong> addresses statewide planning goals and legislative requirements throughits General Plan, Capital Improvement Plans, and City Building and Safety Codes. The LocalNatural <strong>Hazard</strong> <strong>Mitigation</strong> Plan provides a series <strong>of</strong> recommendations that are closely related tothe goals and objectives <strong>of</strong> these existing planning programs. The City <strong>of</strong> <strong>Glendale</strong> will havethe opportunity to implement recommended mitigation action items through existing programsand procedures.Economic Analysis <strong>of</strong> <strong>Mitigation</strong> ProjectsMany studies have shown that one dollar spent on disaster mitigation saves ten dollars in futuredisaster costs. But, where is this pre-disaster mitigation money best spent? To answer thisquestion, the Federal Emergency Management Agency (FEMA) uses two different but validapproaches to identify and measure the costs and benefits associated with natural hazardmitigation strategies or projects: benefit/cost analysis and cost-effectiveness analysis.Conducting benefit/cost analysis for a mitigation activity can assist communities in determiningwhether a project is worth undertaking now, in order to avoid disaster-related damages later.Cost-effectiveness analysis evaluates how best to spend a given amount <strong>of</strong> money to achieve aspecific goal. Determining the economic feasibility <strong>of</strong> mitigating natural hazards can providedecision makers with an understanding <strong>of</strong> the potential benefits and costs <strong>of</strong> an activity, as wellas a basis upon which to compare alternative projects. These exercises can also help prioritizethe implementation <strong>of</strong> action items based on the limited resources available.Formal Review Process<strong>Glendale</strong>’s Local Natural <strong>Hazard</strong>s <strong>Mitigation</strong> Plan will be evaluated on an annual basis todetermine the effectiveness <strong>of</strong> its programs, and to reflect changes in land development orprograms that may affect the mitigation priorities. The evaluation process includes a firmschedule and time line, and identifies the local agencies and organizations participating in theevaluation <strong>of</strong> the Plan. The convener will be responsible for contacting the <strong>Hazard</strong> <strong>Mitigation</strong>Advisory Committee members and organizing the annual meeting. Committee members will beresponsible for monitoring and evaluating the progress <strong>of</strong> the mitigation strategies in the Plan.Continued Public InvolvementThe City <strong>of</strong> <strong>Glendale</strong> is dedicated to involving the public directly in the continual review andupdates <strong>of</strong> its Local Natural <strong>Hazard</strong> <strong>Mitigation</strong> Plan. Copies <strong>of</strong> the Plan will be catalogued andmade available at City Hall and at all City-operated public libraries. The existence and location<strong>of</strong> these copies will be published on the City’s website and in City newsletters. The Plan alsoincludes the address and phone number <strong>of</strong> the City’s Emergency Services Coordinator, whom is2006 PAGE ES - 6
Natural <strong>Hazard</strong>s <strong>Mitigation</strong> PlanCity <strong>of</strong> <strong>Glendale</strong>Executive Summaryresponsible for keeping track <strong>of</strong> public comments on the Plan. In addition, copies <strong>of</strong> the Planand any proposed changes will be posted on the City’s website. This site will also contain anemail address and phone number to which people can direct their comments and concerns.2006 PAGE ES - 7
NOTES:This map is intended for general land use planning only. Information on this map is notsufficient to serve as a substitute for detailed geologic investigations <strong>of</strong> individual sites,nor does it satisfy the evaluation requirements set forth in geologic hazard regulations.Earth Consultants International (ECI) makes no representations or warranties regardingthe accuracy <strong>of</strong> the data from which these maps were derived. ECI shall not be liableunder any circumstances for any direct, indirect, special, incidental, or consequentialdamages with respect to any claim by any user or third party on account <strong>of</strong>, or arisingfrom, the use <strong>of</strong> this map.Cooks Cooks Cooks Cooks Cooks Cooks Cooks Cooks Cooks Canyon Canyon Canyon Canyon Canyon Canyon Canyon Canyon CanyonChannel Channel Channel Channel Channel Channel Channel Channel ChannelCooks Cooks Cooks Cooks Cooks Cooks Cooks Cooks Cooks Canyon Canyon Canyon Canyon Canyon Canyon Canyon Canyon CanyonDunsmore Dunsmore Dunsmore Dunsmore Dunsmore Dunsmore Dunsmore Dunsmore Dunsmore Canyon Canyon Canyon Canyon Canyon Canyon Canyon Canyon CanyonChannel Channel Channel Channel Channel Channel Channel Channel ChannelDunsmore Dunsmore Dunsmore Canyon Canyon CanyonWard Ward Ward Ward Ward Canyon Canyon CanyonShields Shields Shields Shields Shields Shields Shields Shields Shields Canyon Canyon Canyon Canyon Canyon Canyon Canyon Canyon CanyonEagle Eagle Eagle Eagle Eagle Eagle Eagle Eagle Eagle Canyon Canyon Canyon Canyon Canyon Canyon Canyon Canyon CanyonChannel Channel Channel Channel Channel Channel Channel Channel ChannelSan GabrielMountainsLa Tuna CanyonLas Barras CanyonCrescenta ValleySheep Sheep Sheep Sheep Sheep Sheep Sheep Sheep Sheep Corral Corral Corral Corral Corral Corral Corral Corral Corral Canyon Canyon Canyon Canyon Canyon Canyon Canyon Canyon CanyonCunningham Cunningham Cunningham Cunningham Cunningham Cunningham Cunningham Cunningham Cunningham Canyon Canyon Canyon Canyon Canyon Canyon Canyon Canyon CanyonEagle Eagle Eagle Eagle Eagle Eagle Eagle Eagle Eagle Canyon Canyon Canyon Canyon Canyon Canyon Canyon Canyon CanyonChannel Channel Channel Channel Channel Channel Channel Channel ChannelPickens CanyonChannelChannelChannelHall Hall Hall Hall Hall Hall Hall Hall Hall Beckley Beckley Beckley Beckley Beckley Beckley Beckley Beckley Beckley Canyon Canyon Canyon Canyon Canyon Canyon Canyon Canyon CanyonChannel Channel Channel Channel Channel Channel Channel Channel ChannelWinery Winery Winery Winery Winery Winery Winery Winery Winery Canyon Canyon Canyon Canyon Canyon Canyon Canyon Canyon CanyonVerdugo Verdugo Verdugo Verdugo Verdugo Verdugo Verdugo Verdugo Verdugo Wash Wash Wash Wash Wash Wash Wash Wash WashHenderson Henderson Canyon CanyonEngleheard CanyonVerdugo MountainsFlint CanyonBurbank Burbank Burbank Burbank Burbank Burbank Burbank Burbank Burbank Western Western Western Western Western Western Western Western WesternChannel Channel Channel Channel Channel Channel Channel Channel ChannelChilds Childs Childs Childs Childs Childs Childs Childs Childs Canyon Canyon Canyon Canyon Canyon Canyon Canyon Canyon CanyonBrand Brand Brand Brand Brand Brand Brand Brand Brand Canyon Canyon Canyon Canyon Canyon Canyon Canyon Canyon CanyonAlluvial Plain (Piedmont)Idlewood Idlewood Idlewood Idlewood Idlewood Idlewood Idlewood Idlewood Idlewood Canyon Canyon Canyon Canyon Canyon Canyon Canyon Canyon CanyonSherer Sherer Sherer Canyon Canyon CanyonHillcrest CanyonToll Toll Toll Toll Toll Canyon Canyon CanyonDead Dead Dead Dead Dead Dead Dead Dead Dead Horse Horse Horse Horse Horse Horse Horse Horse Horse Canyon Canyon Canyon Canyon Canyon Canyon Canyon Canyon CanyonBrookman Brookman Brookman Canyon Canyon CanyonMand Mand Mand Mand Mand Mand Mand Mand Mand Canyon Canyon Canyon Canyon Canyon Canyon Canyon Canyon CanyonAyers CanyonDeer CreekVerdugo Verdugo Verdugo Verdugo Verdugo Verdugo Verdugo Verdugo Verdugo Canyon Canyon Canyon Canyon Canyon Canyon Canyon Canyon CanyonKirby CanyonSan Rafael HillsLos Angeles RiverVerdugo WashS y y y c c c a a a m o o o r r r r r r r r r e e e C a a a n n n y y y o o o nnnFlint PeakkHollywood HillsS c c h o l l l l l l l l l l l l l l l l l l C a n y y o nNLos Los Los Los Los Los Los Los Los Angeles Angeles Angeles Angeles Angeles Angeles Angeles Angeles Angeles River River River River River River River River RiverWESScale: 1:60,0001000 0 1000 2000 3000200400EXPLANATIONElevation in Feet600800100012001400Meters5000 0 5000 10000 15000<strong>Glendale</strong> City LimitFeetBase Map: USGS 10-m Digital Elevation Model and City <strong>of</strong> <strong>Glendale</strong> DigitalTerrain Model based on 1-foot and 2-foot elevation contour data.Project Number: 2506Date: October 2005Geomorphic Map<strong>Glendale</strong>, <strong>California</strong>PlateH-1
2506October 2005H-10
NOTES:This map is intended for general land use planning only. Information on this map is notsufficient to serve as a substitute for detailed geologic investigations <strong>of</strong> individual sites,nor does it satisfy the evaluation requirements set forth in geologic hazard regulations.Earth Consultants International (ECI) makes no representations or warranties regardingthe accuracy <strong>of</strong> the data from which these maps were derived. ECI shall not be liableunder any circumstances for any direct, indirect, special, incidental, or consequentialdamages with respect to any claim by any user or third party on account <strong>of</strong>, or arisingfrom, the use <strong>of</strong> this map.E x p l a n a t i o nYear <strong>of</strong> Last Burn1990-20041970-19891950-19691900-1949Pre-1900<strong>Glendale</strong> City LimitMountain FireArea Burned inSeptember 11, 2002Rafael FireArea Burned inDecember 1, 1999<strong>Glendale</strong> FireArea Burned inJune 27, 1990NWESScale: 1:60,0001000 0 1000 2000 3000Meters5000 0 5000 10000 15000FeetBase Map: USGS Topographic Map from Sure!MAPS RASTERSource: City <strong>of</strong> <strong>Glendale</strong> Fire and Los Angeles County Fire DepartmentsThis map shows areas in <strong>Glendale</strong> that have burned between 1878 and 2004based on maps prepared by the City <strong>of</strong> <strong>Glendale</strong> Fire and Los Angeles CountyFire Departments, <strong>California</strong> Department <strong>of</strong> Forestry and Fire Protection (2005).Project Number: 2506Date: October 2005Historical Wildland Fire Map<strong>of</strong> the <strong>Glendale</strong> AreaPlateH-6
NOTES:This map is intended for general land use planning only. Information on this map is notsufficient to serve as a substitute for detailed geologic investigations <strong>of</strong> individual sites,nor does it satisfy the evaluation requirements set forth in geologic hazard regulations.Earth Consultants International (ECI) makes no representations or warranties regardingthe accuracy <strong>of</strong> the data from which these maps were derived. ECI shall not be liableunder any circumstances for any direct, indirect, special, incidental, or consequentialdamages with respect to any claim by any useror third party on account <strong>of</strong>, or arisingfrom, the use <strong>of</strong> this map.E x p l a n a t i o nStreets cleaned (minimumdebris 3").Areas with deposited debris.Areas filled by City with siltfrom streets.Eroded sections alongArroyo Verdugo ChannelPortions <strong>of</strong> Arroyo Verdugoimproved with concretechannel.Washed out bridgesLocations where bodieswere found.<strong>Glendale</strong> City LimitNWESScale: 1:60,0001000 0 1000 2000 3000Meters5000 0 5000 10000 15000Base Map: USGS Topographic Map from Sure!MAPS RASTERSource: Flood Map prepared by the City <strong>of</strong> <strong>Glendale</strong> (undated), providedby the <strong>Glendale</strong> Planning DepartmentProject Number: 2506Date: October 2005FeetDamage Caused by theJanuary 1, 1934 Flood<strong>Glendale</strong>, <strong>California</strong>PlateH-9
NOTES:This map is intended for general land use planning only. Information on this map is notsufficient to serve as a substitute for detailed geologic investigations <strong>of</strong> individual sites,nor does it satisfy the evaluation requirements set forth in geologic hazard regulations.Earth Consultants International (ECI) makes no representations or warranties regardingthe accuracy <strong>of</strong> the data from which these maps were derived. ECI shall not be liableunder any circumstances for any direct, indirect, special, incidental, or consequentialdamages with respect to any claim by any user or third party on account <strong>of</strong>, or arisingfrom, the use <strong>of</strong> this map.E x p l a n a t i o nAreas where historic occurrence <strong>of</strong>liquefaction, or local geological,geotechnical and groundwaterconditions indicate a potential forpermanent grounddisplacementssuch that mitigation as defined inPublic Resources Code Section2693c would be required.Areas where previous occurrence <strong>of</strong>landslide movement, or local topographic,geological, geotechnical andgroundwater conditions indicate apotential for permanent grounddisplacements such that mitigation asdefined in Public Resources CodeSection 2693c would be required.<strong>Glendale</strong> City LimitNWEScale: 1:60,0001000 0 1000 2000 3000Meters5000 0 5000 10000 15000Base Map: USGS Topographic Map from Sure!MAPS RASTERSources: <strong>California</strong> , Division <strong>of</strong> Mines and Geology, 1999 (SunlandLos Angeles, Burbank, Hollywood, and Pasadena Quadrangles)Project Number: 2506Date: October 2005FeetSeismic <strong>Hazard</strong>s Map<strong>Glendale</strong>, <strong>California</strong>PlateH-5
AreaSan GabrielMountainsSan RafaelHills (north<strong>of</strong> Highway134)VerdugoMountainsMajorDrainageChannels-VerdugoWashGeneral Slope Instability PotentialGeologic ConditionsSteep to extremely steep rock slopes, most inexcess <strong>of</strong> 40 degrees;Highly fractured, sheared, faulted, and crushedcrystalline bedrock; Soils and loose debris intributary drainages;Stream terrace deposits along major drainagechannels;No known landslides in <strong>Glendale</strong>.Moderate to very steep rock slopes, most inexcess <strong>of</strong> 26 degrees, many in excess <strong>of</strong> 40degrees;Highly fractured and weathered crystallinerock;Soils and loose debris in tributary drainagesand swales;Several small existing landslides.Moderately steep to extremely steep rock slopes,most between 26 and 40 degrees, with someslopes steeper then 40 degrees;Highly fractured, sheared, faulted, and crushedcrystalline bedrock;Soils and loose debris in tributary drainages;A few remnant stream terrace deposits alongmajor drainage channels;Several small existing landslides;Rockfalls common according to R.T.Frankian & Associates (1968).Gentle to moderate sloping channel walls withsteeper channel banks (26-40 degrees) in afew isolated areas;Poorly bedded Holocene alluvium consisting <strong>of</strong>silt, sand and gravel, with coarse sand, graveland boulders near the mountain front;Types <strong>of</strong> PotentialSlope InstabilityMost Probable:Rockfalls, soil slips on steep slopes,soil slumps on the edges <strong>of</strong> activestream channels, small to large debrisflows.Less Probable:Large, deep-seated landslides.Most Probable:Soil slips and slumps on moderateto steep slopes and in drainageswales, small debris flows, smallslides or rockfalls, surficial soilfailures on steep man-made slopes.Less Probable:Large, deep-seated landslides.Most Probable:Soil slips and slumps on moderate tosteep slopes or man-made slopes;transitional landslide failure if northeastdipping weak bedding planes (typicallyshale) are left unsupported by erosion orman-made cuts.Less Probable:Large rotational landslides, smalldebris flows, small rockfalls.Slope instability generally not an issue.Valley PlainVery gentle slopes, typically about 10 degreesor less;Poorly bedded Holocene and Pleistocenealluvium consisting <strong>of</strong> silt, sand and gravel;No mapped landslides.Slope instability generally not an issue.WNSENOTES:This map is intended for general land use planning only. Information on this map is notsufficient to serve as a substitute for detailed geologic investigations <strong>of</strong> individual sites,nor does it satisfy the evaluation requirements set forth in geologic hazard regulations.For additional information, refer to the slope failure and landslide susceptibility ratingcriteria presented in the accompanying text.Earth Consultants International (ECI) makes no representations or warranties regardingthe accuracy <strong>of</strong> the data from which these maps were derived. ECI shall not be liableunder any circumstances for any direct, indirect, special, incidental, or consequentialdamages with respect to any claim by any user or third party on account <strong>of</strong>, or arisingfrom, the use <strong>of</strong> this map.Base Map: USGS Topographic Map from Sure!MAPS RASTERSources: Derived from Dibblee, 1989a, 1989b, 1991a, 1991b,2002; Byer, 1968 and United <strong>State</strong>s Geological Survey 10-meterDigital Elevation Model.Scale: 1:64,0001 0 1 2 30.5 0 0.5 1 1.5MilesKilometersMapped Landslides(small isolated areasin the Verdugo Mountainsand the San Rafael Hills.)<strong>Glendale</strong> CityBoundaryEXPLANATIONSlope Instability RatingVery HighHighModerateLowProject Number: 2506Date: October, 2005Slope Instability Map<strong>Glendale</strong>, <strong>California</strong>PlateH-5
City <strong>of</strong> <strong>Glendale</strong>Update<strong>Hazard</strong> <strong>Mitigation</strong> PlanCity Council MeetingAugust 15, 2005City <strong>of</strong> <strong>Glendale</strong><strong>Hazard</strong> <strong>Mitigation</strong> Plan 1
<strong>Hazard</strong> <strong>Mitigation</strong> PlanStafford Act & Disaster <strong>Mitigation</strong> Act <strong>of</strong> 2000Required to continue to receive FEMA GrantsProcess Started 2004Acceptance by Council, OES, FEMACity <strong>of</strong> <strong>Glendale</strong><strong>Hazard</strong> <strong>Mitigation</strong> Plan 2
Similar to Safety ElementIncludesEarthquakes, Wildfires, Flooding, LandslidesDoes not cover<strong>Hazard</strong>ous Materials or TerrorismCity <strong>of</strong> <strong>Glendale</strong><strong>Hazard</strong> <strong>Mitigation</strong> Plan 3
Public InvolvementPublic MeetingsSafety Element PreparationLong Range Planning ProcessStakeholders MeetingsPublishing the DraftLibrariesCity <strong>Web</strong> SiteCity <strong>of</strong> <strong>Glendale</strong><strong>Hazard</strong> <strong>Mitigation</strong> Plan 4
HospitalsPartnershipsWithin City and near bySchools and Red CrossEvacuationShelteringBusinessesContinuityCERTCity <strong>of</strong> <strong>Glendale</strong><strong>Hazard</strong> <strong>Mitigation</strong> Plan 5
Cost Benefit AnalysisConsiders effectiveness and efficiencyFormalized process dictated by FEMAMandatory part <strong>of</strong> Grant ProposalsCity <strong>of</strong> <strong>Glendale</strong><strong>Hazard</strong> <strong>Mitigation</strong> Plan 6
Impact on CityMost significant areas already addressedFoster partnerships in planningIncrease public awareness, education andtrainingCERT training initiativePursuit <strong>of</strong> Grant fundingNo additional funding identifiedCity <strong>of</strong> <strong>Glendale</strong><strong>Hazard</strong> <strong>Mitigation</strong> Plan 7
Plan MaintenanceAdvisory CommitteeManagement Services, Public Works, Planningand FireQuarterly MeetingsAnnual ReviewIdentify what is working what to improveSubmit Update to FEMA in five yearsRevised and approved by CouncilCity <strong>of</strong> <strong>Glendale</strong><strong>Hazard</strong> <strong>Mitigation</strong> Plan 8