Boston - American Association for Thoracic Surgery
Boston - American Association for Thoracic Surgery
Boston - American Association for Thoracic Surgery
- No tags were found...

You also want an ePaper? Increase the reach of your titles
YUMPU automatically turns print PDFs into web optimized ePapers that Google loves.
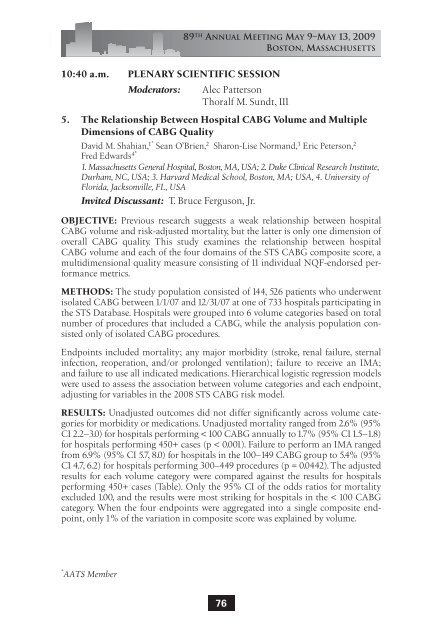
89 TH ANNUAL MEETING MAY 9–MAY 13, 2009BOSTON, MASSACHUSETTS10:40 a.m. PLENARY SCIENTIFIC SESSIONModerators: Alec PattersonThoralf M. Sundt, III5. The Relationship Between Hospital CABG Volume and MultipleDimensions of CABG QualityDavid M. Shahian, 1* Sean O’Brien, 2 Sharon-Lise Normand, 3 Eric Peterson, 2Fred Edwards 4*1. Massachusetts General Hospital, <strong>Boston</strong>, MA, USA; 2. Duke Clinical Research Institute,Durham, NC, USA; 3. Harvard Medical School, <strong>Boston</strong>, MA; USA, 4. University ofFlorida, Jacksonville, FL, USAInvited Discussant: T. Bruce Ferguson, Jr.OBJECTIVE: Previous research suggests a weak relationship between hospitalCABG volume and risk-adjusted mortality, but the latter is only one dimension ofoverall CABG quality. This study examines the relationship between hospitalCABG volume and each of the four domains of the STS CABG composite score, amultidimensional quality measure consisting of 11 individual NQF-endorsed per<strong>for</strong>mancemetrics.METHODS: The study population consisted of 144, 526 patients who underwentisolated CABG between 1/1/07 and 12/31/07 at one of 733 hospitals participating inthe STS Database. Hospitals were grouped into 6 volume categories based on totalnumber of procedures that included a CABG, while the analysis population consistedonly of isolated CABG procedures.Endpoints included mortality; any major morbidity (stroke, renal failure, sternalinfection, reoperation, and/or prolonged ventilation); failure to receive an IMA;and failure to use all indicated medications. Hierarchical logistic regression modelswere used to assess the association between volume categories and each endpoint,adjusting <strong>for</strong> variables in the 2008 STS CABG risk model.RESULTS: Unadjusted outcomes did not differ significantly across volume categories<strong>for</strong> morbidity or medications. Unadjusted mortality ranged from 2.6% (95%CI 2.2–3.0) <strong>for</strong> hospitals per<strong>for</strong>ming < 100 CABG annually to 1.7% (95% CI 1.5–1.8)<strong>for</strong> hospitals per<strong>for</strong>ming 450+ cases (p < 0.001). Failure to per<strong>for</strong>m an IMA rangedfrom 6.9% (95% CI 5.7, 8.0) <strong>for</strong> hospitals in the 100–149 CABG group to 5.4% (95%CI 4.7, 6.2) <strong>for</strong> hospitals per<strong>for</strong>ming 300–449 procedures (p = 0.0442). The adjustedresults <strong>for</strong> each volume category were compared against the results <strong>for</strong> hospitalsper<strong>for</strong>ming 450+ cases (Table). Only the 95% CI of the odds ratios <strong>for</strong> mortalityexcluded 1.00, and the results were most striking <strong>for</strong> hospitals in the < 100 CABGcategory. When the four endpoints were aggregated into a single composite endpoint,only 1% of the variation in composite score was explained by volume.* AATS Member76