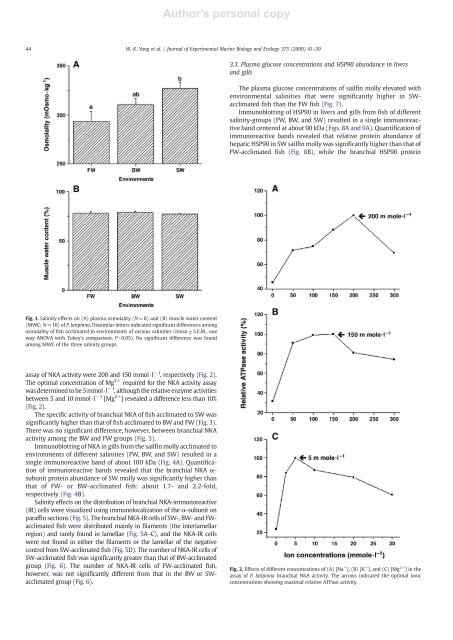
<strong>Author's</strong> <strong>personal</strong> <strong>copy</strong>W.-K. Yang et al. / Journal of Experimental Marine Biology and Ecology 375 (2009) 41–5043used for determination of protein concentrations, enzyme activity, orimmunoblotting. Protein concentrations were identified by reagentsfrom BCA Protein Assay (Pierce, Hercules, CA, USA), using bovineserum albumin (BSA) as a standard (Pierce). The samples werestored at −80 °C before use.2.5. Optimal conditions for determining Na + /K + -ATPase (NKA) activityFor determining the optimal concentrations of Na + ,K + , and Mg 2+in the reaction medium of in vitro assay of molly NKA activity, 0.1 mlfiltered homogenates and 5 ml reaction medium (concentrationsin mmol·l − 1 : imidazole-HCl buffer: 100; pH 7.0; NaCl: 0–300; KCl:0–300; MgCl 2 : 0–30; Na 2 ATP: 5) were mixed. Each reactioncondition was repeated. The reactions with the samples exposed todifferent environments of [Na + ], [K + ], or [Mg 2+ ]wererunat37°Cfor 30 min. The reactions were then stopped by the addition of 2 mlice-cold 30% trichloroacetic acid. The reaction tube was centrifugedand the inorganic phosphate concentration in the supernatant wasdetermined with a spectrophotometer at 700 nm according to themethod proposed by Peterson (1978). TheenzymeactivityofNKAwas defined as the difference between the inorganic phosphateliberated in the presence and absence of 3.75 mmol·l − 1 ouabain inthe reaction mixture. All experiments were repeated 2–4timeswithsimilar results. For comparisons, enzymatic activities were convertedinto relative activities (%) of the highest value obtained ineach experiment. Individual points of concentrations in each panelwere the averages of duplicate samples.2.6. Assay of NKA activityAliquots of the suspension of branchial homogenates, prepared asdescribed above, were used for assaying protein concentrations andenzyme activities. NKA activity was assayed by adding the supernatantto the optimal reaction medium (concentrations in mmol·l − 1 :imidazole-HCl buffer: 100; pH 7.6; NaCl: 200; KCl: 150; MgCl 2 :5;Na 2 ATP: 5). The reaction was run as described above. Each sample wasassayed in triplicate. NKA activity was expressed as μmol inorganicphosphate released per mg of protein per hour.2.7. AntibodiesThe primary antibodies used in this study included (1) NKA: amouse monoclonal antibody (α5; Developmental Studies HybridomaBank, Iowa City, IA, USA) raised against the α-subunit of the avianNKA; (2) heat shock protein 90 (HSP90): a rabbit polyclonal antibody(#4874; Cell Signaling, Beverly, MA, USA) raised against the humanHSP90. The secondary antibodies for immunoblotting were alkalinephosphatase (AP)-conjugated goat anti-mouse IgG or goat anti-rabbitIgG (Chemicon, Temecula, CA, USA).2.8. ImmunoblottingFor immunoblotting of branchial NKA, aliquots containing 25 µg ofbranchial homogenates were added to sample buffer and heated at 60 °Cfor 15 min followed by electrophoresis on 7.5% sodium dodecyl sulfate(SDS)-polyacrylamide gel. The pre-stain protein molecular weightmarker was purchased from Fermentas (SM0671; Hanover, MD, USA).Separated proteins were transferred from unstained gels to PVDFmembranes (Millipore, Bedford, MA, USA) by electroblotting using atank transfer system (Mini Protean 3, Bio-Rad, Hercules, CA, USA). Blotswere preincubated for 2 h in PBST (phosphate buffer saline with Tween20) buffer (concentrations in mmol·l −1 : NaCl:137; KCl: 3; Na 2 HPO 4 :10;KH 2 PO 4 : 2; 0.05% (vol/vol) Tween 20, pH 7.4) containing 5% (wt/vol)nonfat dried milk to minimize non-specific binding, then incubated at4 °C with the primary antibody (α5) diluted in 1% BSA and 0.05% sodiumazide in PBST (1: 2500) overnight. The blot was washed in PBST, followedby a 1-h incubation with AP-conjugated secondary antibody diluted4000x in PBST. Blots were visualized after incubation with an NBT/BCIPkit (Zymed, South San Francisco, CA, USA).For immunoblotting of HSP90, sample buffers were mixed withaliquots containing 20 or 50 µg of hepatic or branchial homogenates. Thehomogenates were then heated at 95 °C for 5 min and fractionated byelectrophoresis on 7.5% SDS-polyacrylamide gels. The following protocolwas identical to that of branchial NKA α-subunit immunoblotting exceptthat the primary antibody to HSP90 was diluted 1000×.Immunoblots were scanned and imported as TIFF files. Immunoreactivebands were analyzed using MCID software version 7.0, rev. 1.0(Imaging Research, Ontario, Canada). The results were converted tonumerical values in order to compare the relative protein abundanceof the immunoreactive bands.2.9. Immunohistochemical detectionGills were dissected and fixed for 24 h in 10% formalin in 0.1 Mphosphate buffer (pH 7.2) at 25 °C. Samples were dehydrated througha graded ethanol series, embedded in paraffin, and serial sections of7 µm were mounted on gelatin-coated glass slides. The sections werestained immunohistochemically with the monoclonal antibody (α5)to NKA α-subunit followed by a commercial kit (PicTure, Zymed).Negative control experiments in which PBS (phosphate bufferedsaline) was used instead of the primary antibody were conducted toconfirm the positive results of NKA immunoreactive (NKA-IR) cells.Immunostained sections were observed using a light microscope(Olympus BX50, Tokyo, Japan) and the micrographs were taken with adigital camera (Nikon COOLPIX 5000, Tokyo, Japan).The method of quantification for NKA-IR cells was modified fromour previous studies (Lin et al., 2003, 2006; Tang et al., 2008). Thenumbers of NKA-IR cells were counted on the sections immunostainedas described in the previous paragraph. Preliminary observationsindicated that most NKA-IR cells in gills of the sailfin molly weredistributed in the interlamellar regions of the filaments. Hence,longisections of the gills including lamellae and the cartilages of thefilaments were chosen, and the numbers of immunoreactive cells inthe interlamellar regions of the filaments and the lamellae werecounted. Cell numbers in the interlamellar regions within the range of5 adjacent lamellae (approximately 40–60 µm) were counted and thelengths of the 4 interlamellar regions were measured to normalize cellcounts to a fixed length (50 µm). Results were expressed as numbers ofNKA-IR cells per 50 µm of filaments (interlamellar regions). For eachsample, 10 areas on the filaments including symmetrical interlamellarregions were randomly selected.2.10. Statistical analysisValues were compared using a one-way analysis of variance (ANOVA)(Tukey's pair-wise method) and Pb0.05 was set as the significant level.Values were expressed as the means±S.E.M. (the standard error of themean) unless stated otherwise.3. Results3.1. Physiological parametersThe plasma osmolality of sailfin molly increased with environmentalsalinities (Fig. 1A). The muscle water content (MWC), however, wasconstant in either FW-, BW-, or SW-acclimated fish (Fig. 1B).3.2. Branchial Na + /K + -ATPase (NKA) expressionWhen the concentration ratio of Na + :K + was 4:3, the highest enzymeactivity was found at 200 and 150 mmol·l −1 of total Na + and K + ,respectively. Thus optimal concentrations of Na + and K + for the in vitro
<strong>Author's</strong> <strong>personal</strong> <strong>copy</strong>44 W.-K. Yang et al. / Journal of Experimental Marine Biology and Ecology 375 (2009) 41–503.3. Plasma glucose concentrations and HSP90 abundance in liversand gillsThe plasma glucose concentrations of sailfin molly elevated withenvironmental salinities that were significantly higher in SWacclimatedfish than the FW fish (Fig. 7).Immunoblotting of HSP90 in livers and gills from fish of differentsalinity-groups (FW, BW, and SW) resulted in a single immunoreactiveband centered at about 90 kDa (Figs. 8A and 9A). Quantification ofimmunoreactive bands revealed that relative protein abundance ofhepatic HSP90 in SW sailfin molly was significantly higher than that ofFW-acclimated fish (Fig. 8B), while the branchial HSP90 proteinFig. 1. Salinity effects on (A) plasma osmolality (N=8) and (B) muscle water content(MWC; N=16) of P. latipinna. Dissimilar letters indicated significant differences amongosmolality of fish acclimated to environments of various salinities (mean±S.E.M., oneway ANOVA with Tukey's comparison, Pb0.05). No significant difference was foundamong MWC of the three salinity groups.assay of NKA activity were 200 and 150 mmol·l −1 , respectively (Fig. 2).The optimal concentration of Mg 2+ required for the NKA activity assaywas determined to be 5 mmol·l −1 , although the relative enzyme activitiesbetween 5 and 10 mmol·l −1 [Mg 2+ ] revealed a difference less than 10%(Fig. 2).The specific activity of branchial NKA of fish acclimated to SW wassignificantly higher than that of fish acclimated to BW and FW (Fig. 3).There was no significant difference, however, between branchial NKAactivity among the BW and FW groups (Fig. 3).Immunoblotting of NKA in gills from the sailfin molly acclimated toenvironments of different salinities (FW, BW, and SW) resulted in asingle immunoreactive band of about 100 kDa (Fig. 4A). Quantificationof immunoreactive bands revealed that the branchial NKA α-subunit protein abundance of SW molly was significantly higher thanthat of FW- or BW-acclimated fish: about 1.7- and 2.2-fold,respectively (Fig. 4B).Salinity effects on the distribution of branchial NKA-immunoreactive(IR) cells were visualized using immunolocalization of the α-subunit onparaffinsections(Fig. 5). The branchial NKA-IR cells of SW-, BW- and FWacclimatedfish were distributed mainly in filaments (the interlamellarregion) and rarely found in lamellae (Fig. 5A–C), and the NKA-IR cellswere not found in either the filaments or the lamellar of the negativecontrol from SW-acclimated fish (Fig. 5D). The number of NKA-IR cells ofSW-acclimated fish was significantly greater than that of BW-acclimatedgroup (Fig. 6). The number of NKA-IR cells of FW-acclimated fish,however, was not significantly different from that in the BW or SWacclimatedgroup (Fig. 6).Fig. 2. Effects of different concentrations of (A) [Na + ], (B) [K + ], and (C) [Mg 2+ ] in theassay of P. latipinna branchial NKA activity. The arrows indicated the optimal ionicconcentrations showing maximal relative ATPase activity.