Digesters - Metropolitan Water Reclamation District of Greater Chicago
Digesters - Metropolitan Water Reclamation District of Greater Chicago
Digesters - Metropolitan Water Reclamation District of Greater Chicago

You also want an ePaper? Increase the reach of your titles
YUMPU automatically turns print PDFs into web optimized ePapers that Google loves.
Digester Gas Utilization at SWRPWhere Should the Biogas Go?Steve McGowan, P.E., BCEEMalcolm Pirnie – The <strong>Water</strong> Division <strong>of</strong> ArcadisMWRD Monthly Seminar SeriesOct 28 th , 2011
Project Contributors• Tom Kunetz, MWRD• Ed Brosius, MWRD• Paul O’Brien, MWRD• Jarek Fink-Finowicki, MWRD• Eric Auerbach, Malcolm Pirnie/Arcadis• Tom Lachcik, Malcolm Pirnie/Arcadis• Eric Wang, Malcolm Pirnie/Arcadis• Krishna Pagilla, MPR• Arun Mande, MPR• Cathy Busking, Busking Engineering
Presentation Outline• Background/Purpose• Digester Gas Production at SWRP• Energy Consumption at SWRP• Selection <strong>of</strong> Gas Utilization Alternatives• Energy Flow Modeling• Evaluation <strong>of</strong> Results and System Selection
Current Digester Gas ProductionFrom 2007 – 2009 Plant Data• Avg Production: 3,400 Mcf/day• Avg VSR: 31% (low, typical = 40-50%)• Avg Gas Yield: 21.5 cf/lb VSR (high, typical = 12-18)Items affecting future SWRP Gas Production• Replacement <strong>of</strong> WS Imh<strong>of</strong>f tanks with Primary Settling Tanks• Upgrades to sludge thickening facilities• Increase in flows and loads projected by Master Plan(SWRP and NSWRP)
Projected Digester PerformanceVSR• VSR assumed to be low due todestruction <strong>of</strong> readily degradable VSin Imh<strong>of</strong>f Tanks• Future VSR with solids handlingimprovements should resembletypical range <strong>of</strong> 40-50%Gas Yield• A standard typical value <strong>of</strong> 16 cf/lb VSR was used
Digester Gas Production ModelingModel Inputs• Influent Flow and Influent TSS to Plant –from Master Plan GPS‐X• 2040 Annual Average: 750 mgd, 480 dtpd TSS• Influent %VS –from Master Plan GPS‐X• Influent %VS = 75% (all conditions)Model Outputs• VS to digesters• Digester Gas Produced
Digester Gas Production – Modeling Results
Selected Future Gas Production ValueSelected Future Evaluation Point• Plant Influent: 2040 Annual Average• Primary Clarifier SS Capture: 50%• VSR: 45% (Middle Efficiency)• Digester Gas Production = 6,722 Mcf/dayDouble current production <strong>of</strong> 3,400 Mcf/day• Energy Production = 168 mmBtu/hr
Energy Consumption at SWRP• Building heating system comprised <strong>of</strong> extensivesteam piping network operated at 90 psig• Steam is used for building cooling in the summervia absorption chillers• For digester heating, steam is converted to hotwater at each individual digester bank• Heating demands have significant seasonalvariation• Plant electrical consumption is ~ 31 MW withoutmuch seasonal variation
Heating Energy ConsumptionCurrent• From 2007 – 2009 plant data• Heating Demand: 40 [mmBtu/hr ] (summer)120 [mmBtu/hr] (winter)87 [mmBtu/hr] (average)Adjustments for 2040 Heating Energy Consumption• Additional flow to digesters• Addition <strong>of</strong> new facilitiesFuture Heating Demand• Summer: 30 (<strong>Digesters</strong>) + 20 (Buildings) = 50 [mmBtu/hr]• Winter: 48 (<strong>Digesters</strong>) + 87 (Buildings) = 135 [mmBtu/hr]• Average: 39 (<strong>Digesters</strong>) + 60 (Buildings) = 99 [mmBtu/hr]
Energy Flow Scenarios:Digester Gas?PlantHeatingBoilersBiosolidsDryingFacilityCogenerationNatural GasPlant HeatDemandPlantElectricDemandPower PlantBuild a Model !24
Energy Flow Model• Outputs = Annualized Cost, GHG Reduction, Unused Energy
Energy Flow Modeling Framework26
Model Components – Gas Production• Turn Northside sludgeON/OFFGas Production168 mmBtu/hr• Account for Imh<strong>of</strong>f Tankreplacement• Adjust to 2011, 2020 or 2040gas productionNorth Side SludgeON
Model Components – Gas Cleanings H2S Cleaning H2S + Siloxane CleaningRaw Gas OFF ON21 mmBtu/hr 0 147.5 mmBtu/hrmmBtu/hr• Turn H 2 S and Siloxane cleaning ON/OFF• Capital and O&M cost for cleaning scaled to amount <strong>of</strong>digester gas received• Cleaning affects downstream maintenance costs• Cleaning affects downstream equipment performance
Model Components – Gas Utilization OptionsGas to Alternative Utilization OK148 mmBtu/hr 148 gas to compressors 83% efficientMBMFacilityON DG to MBM Engines Gas Turbines Steam TurbinesAvg load OFF ON OFF OFF150 dtpd 148 Simple 050 mmBtu/hr total mmBtu/hr 0 mmBtu/hr0 mmBtu/hr DIG Gas mmBtu/hrDIGsmmBtu/hr OFF ElectricityHot <strong>Water</strong> to DIGs 433,681 Electricity Electricity64 mmBtu/hr kW‐hrs/day 0 0kW‐hrs/daykW‐hrs/day• MBM turned ON/OFF at varying solids loads• Cogen systems turned ON/OFF and can receive varying digestergas amounts• Capital and variable O&M cost for cogen are calculated andscaled to amount <strong>of</strong> digester gas received• Cogen performance parameters determine electrical productionand heat recovery• Heat recovered as either steam or hot waterHighPressure
Model Components – Plant Energy Demands• Model requires that plant heatdemands are satisfied• Summer and Winter heatdemand conditions• Accounts for boiler efficiency• Type <strong>of</strong> heating (i.e. steam or hotwater) is considered whensatisfying heat demandsDirect Gas to Plant Heating21 mmBtu/hrg 80% efficient Gas to AlternativeyPlantHeatingBoilers148 mmBHot <strong>Water</strong> to DIGs0 mmBtu/hr OSteam from Plant Boilers16 mmBtu/hrMBMFacilityTotal Plant Heat Demand40 mmBtu/hr
Model Components – Natural Gas Input• Natural gas from utility can beinput as additional energy• Natural gas to either plantheating and/or MBM• Variable amounts <strong>of</strong> natural gascan be provided to balance plantheating demands• Natural gas prices can be varied(as well as electricity prices)Natural Gas to Plant Heating%NG 0%0 mmBtu/hrNatural Gas to MBM Facility50 mmBtu/hrDirect Gas to Plant Heating21 mmBtu/hr80% efficientPlantHeatingBoilers• MBM contract pricing isconsidered
Projecting Future Energy Prices• Utility Prices were estimated for 20 year period beginningin 2016• Electricity: Currently $0.05/kWh• Estimated rise for 2016 +: $0.08/kWh• Natural Gas: Currently Estimated at $6/mmBtu• Estimated rise for same 20 year period: $8/mmBtuNote: Thousand Cubic Foot = Million Btu [mmBtu]
Energy Flow Model - Baseline• 2016 conditions selected as baseline– 2016 plant influent (from master plan)– Half <strong>of</strong> WS Imh<strong>of</strong>f Tanks Replaced with PCs– All Thickening Improvements Complete– Cost <strong>of</strong> Operating MBM Facility included– No Cogeneration Option – Excess Gas Flared– Utility Prices: $0.08/kWh (Electric) and $8/mmBtu (Gas)• 2016 Baseline Values (Annual)– Annualized Cost: -$1,752,000 must spend money for MBM– GHG Reduction: -23,214 MT eCO2 must send natural gas to MBM– Unused Energy: 355,419 mmBtu must flare lots <strong>of</strong> excess gas
Energy Flow Model - ScenariosScenario Group 1 (No Cogen)– DG Priority = 1. 2.Scenario Group 2 (No Cogen)– DG Priority = 1. 2.Scenario Group 3– DG Priority = 1. Heating 2. 3.Scenario Group 4– DG Priority = 1. 2. 3. = NGScenario Group 5– DG Priority = 1. 2. 3.Scenario Group 6PlantHeatingBoilersMBMFacilityPlantBoilersPlantHeatingBoilersMBMFacilityMBMFacilityPlantHeatingBoilersCogenerationCogenerationCogenerationDG Priority = 1. 2. 3. = NGCogenerationMBMFacilityPlantHeatingBoilersMBMFacilityPlantHeatingBoilersMBMFacility
150,000100,000GHG reduction (MT eCO2) / Unused Energy (10 mmBtu)$1,269,807Energy Flow Model - Results$3,000,00050,0000Annualized Cost ($) GHG reduction (MT eCO2) Unused Energy (mmBtu)‐50,000Group 1+2 Group 3 Group 4 Group 5Group 6‐100,000‐150,000$(1,752,000)$(2,253,696)$(2,284,723)$(1,940,343)$(2,022,458)$(491,357)$(443,080)$(776,085)$(453,080)$(790,209)$(342,295)$(722,873)$(114,267)$(1,039,169)$(271,033)$95,142$209,259$697,906$661,099$630,566$374,447$381,606$594,236$1,036,729$1,518,767$1,269,807$826,287$1,518,767$2,000,000$1,000,000$‐Annualized Cost [$]$(1,000,000)$(2,000,000)$(3,000,000)NoCogenDG to1)Plant,2)MBM,3)CogenDG to1)Plant,2)Cogen,3)MBMDG to1)MBM,2)Cogen,3)PlantDG to1)Cogen,2)Plant,3)MBMScenario
Energy Flow Model - Results$2,000,000GHG Reduction Vs. Cost SavingsSteam Turbines$1,500,0006C4F4C6FEnginesAnnualized Cost$1,000,000$500,000$‐$(500,000)$(1,000,000)2A1A2B1B5C3C5F3F4B4E6B5E5B6E4D5D4A5A6A6D$(1,500,000)$(2,000,000)Baseline20163E3D3B3A$(2,500,000)‐40,000 ‐20,000 0 20,000 40,000 60,000 80,000GHG Reduction (MT eCO2)
Selected Scenarios for Further EvaluationScenarioCogenerationSystemDigester Gas1st PriorityDigester Gas 2nd PriorityDigester Gas 3rdPriority4A Engines Plant Heating Cogeneration MBM (Fueled by NG)4C Steam Turbine Cogeneration Plant Heating6A Engines Cogeneration Plant Heating(Plant heated entirely by_recovered cogeneration heat)MBM (Fueled by NG)MBM (Fueled by NG)(Supplemental NG needed)
Engine Operation Alternatives• Balance DGDigester gas first routed to heating boilersthen balance to engines.• Max with NGDigester gas first routed to heating boilersthen balance to engines.Supply engines with natural gas whenengine capacity is available(typically in winter)
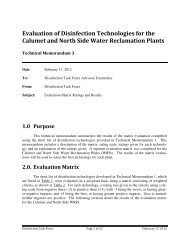
Steam Turbine Operation AlternativesElectric GeneratorMain Steam from Power Boilers(600-750 psia)TurbineExtraction Steam toPlant Heating(90 psig) Exhaust Steam to Condenser(variable, below atmospheric)• ST – A = Use extraction steam for building and digester heat• ST – B = Use extraction steam for building heat, condenser water heatsdigesters via recirculation line• ST – C = Use extraction steam for building heat, condenser water preheatsinfluent sludge to digesters
Updated Model Parameters• New Performance for Steam Turbines• Updated Cost for Heat Recovery Infrastructure• Updated Cost for Electrical Distribution Infrastructure• Addition <strong>of</strong> Digester Gas Storage Costs
Advanced Energy Flow Model Results100000500000‐50000‐100000‐$1,752,000$166,105$538,639$1,093,784$1,408,316$1,130,646GHG Reduction [MT eCO2] / Unused Energy [10 mmBtu]Annualized Scenario Cost [$] GHG Reduction [MT eCO2] Unused Energy [mmBtu]$2,000,000$1,000,000$0‐$1,000,000‐$2,000,000Annualized Scenario Cost [$]
Sensitivity Analysis – Electricity Price$6,000,000Natural Gas Constant at Baseline Price ($8/mmBtu)$5,000,000$4,186,800Annualized Cost$4,000,000$3,000,000$2,000,000$1,000,000$‐$836,134$594,236$1,518,767$630,566$1,747,895$2,201,399$2,408,683$2,901,554$2,884,031$(1,000,000)$(2,000,000)$(3,000,000)$(1,752,000)$(559,423)Electricity Low($0.07/kWh)$(1,147,551)BaselineElectricity($0.08/kWh)Electricity High($0.09/kWh)Electricity High($0.10/kWh)$(4,000,000)Scenario
Year 2016 ‐2035Capital cost and annual O&M costs subtracted44
Triple Bottom Line Analysis• Economics– Cost Savings– Sensitivity to Energy Prices• Environmental– GHG Reduction– Air Pollution• Social– Operability– Maintainability– Implementability
Large WWTP Reference InstallationsOrange County Sanitation <strong>District</strong>Plants 1+2 (220 MGD)Orange County, CA3 engine units rated at 2.5 MWDeer Island WWTP (360 MGD)Boston, MA18 MW capacity Steam Turbine
Other Reference Installations<strong>Metropolitan</strong> WWTP,St. Paul, MN4 MW Steam TurbineSite Visits• South Shore WRP, Milwaukee, WI− 5 engine units <strong>of</strong> 1 to 1.5 MW• Abbott Power Plant, Champaign, IL (U <strong>of</strong> I)− Several 12 MW steam turbines operating <strong>of</strong>f natural gas
Calls and Field Visits - Engines• Operations can be automated but still requiresignificant operator attention• Siloxane cleaning dropped maintenance costs• Preventative maintenance is labor intensiveand could be done in house or contracted out• “Top Ends” and Major Overhauls every 3-5years– Contracted out– Takes ~1 month• Availability can be good but is highly dependenton proper maintenance by owner
Calls and Field Visits – Steam Turbine• Operation is automated and requires lessoperator attention• Responds well to changing loads• Preventative maintenance is done in house andconsists <strong>of</strong> minor procedures and monitoring• Major Rotor Overhauls every 5-7 years– Contracted out– Takes ~1 month• Availability is very high and major O&M issues are rare• SWRP boiler feed water system needs upgrading
Recommended Utilization SystemSteam Turbine Alternate A –Uses extraction steam for buildingand digester heatingSWRP Specific Advantages• Takes advantage <strong>of</strong> required boiler replacement• Utilizes the existing skills <strong>of</strong> plant personnel• Maintains consistency in plant heating scheme andheating infrastructure
Conclusions/Discussion• A Combined Heat and Power option provides the greatesteconomic advantage <strong>of</strong> all options, so long as the CHP is priorityloaded with biogas.• Reciprocating Engines have highest electrical efficiency, andtherefore <strong>of</strong>fer greatest GHG reduction but requires greater gascleaning, capital outlay, and maintenance.• Engines are more sensitive (volatile) to changes in electricalprices than steam turbines.• Therefore, economic returns for Steam Turbines are greater thanEngines for this plant.• Slight changes in electricity rates have a significant affect on theeconomic payback <strong>of</strong> all co-generation alternatives.51
Questions
Sizing <strong>of</strong> Cogeneration SystemsCogeneration Sizing: Requires iterative loop to size capital equipment(maximum capacity)CogenerationbiggerbiggerDigesterGassmallerPlant HeatDemandPlant Heating• Average Gas Production used to determine operating costsand economic performance
Energy Flow Modeling• Different Operational Scenarios PossibleDigester Gas?PlantHeatingBoilersMBMFacilityCogenerationNatural GasPlant HeatDemandPlantElectricDemandPower Plant
Triple Bottom Line ScoringScenario ScoreCategory Weight Sub Category Max Score ENG-NG ST-A ST-B ST-CCost Savings 8 5.8 7.2 8.0 7.3Economic 50Sensitivity 2 0 2 2 2Total Economic 10 5.8 9.2 10.0 9.3Weighted Score 500 290 460 500 465GHG Reduction 4 4.0 1.9 2.1 2.2Environmental 30Air Pollutants 6 2 5 5 5Total Environmental 10 6.0 6.9 7.1 7.2Weighted Score 300 180 207 213 215Operability 4 1 4 2 2Maintainability 5 1 5 4 4Social 20 Implementability 1 0 1 0 0Total Social 10 2.0 10.0 6.0 6.0Weighted Score 200 40 200 120 120TOTALOVERALLSCORE1000 510 867 833 800
Model Components– Capital Cost Annualized over 20 years, 6% interest(estimates annual bond payments for capital)– O&M Cost (both variable and fixed)– Cost <strong>of</strong> purchasing natural gas for supplemental/MBM heating– Cost Savings from electrical production– eduction in emissions due to net electrical production(reduces electricity purchased from coal based power plant)– Emissions from purchased natural gas– Flared digester gas– Recovered waste heat that cannot be utilized