MOL Hungarian Oil and Gas Public Limited Company
MOL Hungarian Oil and Gas Public Limited Company
MOL Hungarian Oil and Gas Public Limited Company

You also want an ePaper? Increase the reach of your titles
YUMPU automatically turns print PDFs into web optimized ePapers that Google loves.
<strong>MOL</strong> <strong>Hungarian</strong> <strong>Oil</strong> <strong>and</strong> <strong>Gas</strong> <strong>Public</strong> <strong>Limited</strong> <strong>Company</strong>Supplementary Notes for the year ending on 31 December 2009TABLE OF CONTENT1. GENERAL INFORMATION...................................................................................................................... 122. OWNERSHIP STRUCTURE .................................................................................................................... 153. IMPORTANT ELEMENTS OF <strong>MOL</strong> PLC’S ACCOUNTING POLICY...................................................... 173.1. Method of bookkeeping, report format ................................................................................... 173.2. Method <strong>and</strong> time schedule for report preparation ................................................................. 173.3. The form of Balance Sheet <strong>and</strong> the Income Statement........................................................... 173.4. Valuation methods <strong>and</strong> procedures used in the preparation of annual report .................... 183.4.1. Changes in the Accounting Policy ............................................................................................ 183.4.2. Valuation methods applied .......................................................................................................193.4.3. Depreciation policy .................................................................................................................... 243.4.4. Rules for provisions ................................................................................................................... 253.4.5. Classification of errors for previous years............................................................................... 273.4.6. Application of paragraph (4) of 4. of the Accounting Law in the <strong>Company</strong> financialstatements for year 2009............................................................................................................ 274. THE TRUE AND FAIR VIEW OF THE COMPANY’S FINANCIAL AND EARNINGS POSITION ........... 284.1. Assets .......................................................................................................................................... 284.1.1. Changes in the <strong>Company</strong>’s assets............................................................................................. 284.1.2. Capital structure........................................................................................................................ 294.1.3. Revenues..................................................................................................................................... 304.1.4. Costs, expenditures compared to revenue ............................................................................... 304.1.5. Financial indicators ................................................................................................................... 314.1.6. Current <strong>and</strong> non-current assets ratio ...................................................................................... 324.2. Financial position....................................................................................................................... 324.3. Profitability indicators .............................................................................................................. 334.4. Return <strong>and</strong> performance indicators......................................................................................... 335. CASH FLOW STATEMENT..................................................................................................................... 356. INTANGIBLE ASSETS ............................................................................................................................ 367. PROPERTY, PLANT AND EQUIPMENT................................................................................................. 388. DEPRECIATION ...................................................................................................................................... 409. REVISION OF ESTIMATED USEFUL LIFE OF INTANGIBLE ASSETS AND PROPERTY, PLANT ANDEQUIPMENT ........................................................................................................................................... 4110. PROPERTY, PLANT AND EQUIPMENT USED FOR ENVIRONMENTAL PROTECTION .................... 4211. RESEARCH AND DEVELOPMENT ........................................................................................................4312. HAZARDOUS WASTE (NOT AUDITED)................................................................................................. 449
<strong>MOL</strong> <strong>Hungarian</strong> <strong>Oil</strong> <strong>and</strong> <strong>Gas</strong> <strong>Public</strong> <strong>Limited</strong> <strong>Company</strong>Supplementary Notes for the year ending on 31 December 200913. INVESTMENTS........................................................................................................................................ 4613.1. <strong>MOL</strong> PLC’S SUBSIDIARIES, CLASSIFIED AS LONG-TERM INVESTMENTS..................................... 4613.2. <strong>MOL</strong> PLC’S JOINT VENTURE, CLASSIFIED AS LONG-TERM INVESTMENT .................................... 5013.3. <strong>MOL</strong> PLC’S ASSOCIATED COMPANIES, CLASSIFIED AS LONG-TERM INVESTMENTS ................ 5113.4. SHAREHOLDERS’ EQUITY OF <strong>MOL</strong> PLC’S SUBSIDIARIES AND CERTAIN KEY INVESTMENTS... 5213.5. <strong>MOL</strong> PLC’S OTHER INVESTMENTS, CLASSIFIED AS LONG-TERM INVESTMENTS ....................... 5413.6. IMPAIRMENT OF LONG-TERM INVESTMENTS AND ITS REVERSAL................................................ 5514. DETAILS OF LONG-TERM LOANS TO RELATED PARTIES AND OTHER INVESTMENTS............... 5615. IMPAIRMENT ON LONG-TERM LOANS ................................................................................................ 5616. INVENTORIES ......................................................................................................................................... 5716.1. Inventories.................................................................................................................................. 5716.2. Emission rights........................................................................................................................... 5717. NON-CURRENT ASSETS DISPOSABLE WITHIN A YEAR, RECLASSIFIED TO INVENTORIES ....... 5818. WRITE-OFF OF INVENTORIES .............................................................................................................. 5819. RECEIVABLES FROM SUPPLY OF GOODS AND SERVICES (TRADE RECEIVABLES)................... 5920. RECEIVABLES FROM RELATED PARTIES.......................................................................................... 5921. OTHER RECEIVABLES .......................................................................................................................... 6022. VALUATION OF RECEIVABLES............................................................................................................ 6023. SHORT-TERM INVESTMENTS............................................................................................................... 6223.1. Investment to be sold, liquidated or wound up, classified as short-term investments......... 6223.2. Impairment <strong>and</strong> reversal of impairment on short-term investments.................................... 6324. CHANGES OF TREASURY SHARES IN THE CURRENT YEAR........................................................... 6325. CASH AND CASH EQUIVALENTS......................................................................................................... 6426. PREPAYMENTS, ACCRUALS................................................................................................................ 6427. CHANGES IN EQUITY ............................................................................................................................ 6628. BREAKDOWN OF THE TIED UP RESERVE.......................................................................................... 6729. PROVISIONS........................................................................................................................................... 6830. LONG-TERM LIABILITIES ...................................................................................................................... 6931. BREAKDOWN OF LONG-TERM LIABILITIES TO RELATED PARTIES............................................... 6932. LIABILITIES, WHERE THE REPAYABLE AMOUNT EXCEEDS THE AMOUNT RECEIVED ............... 7033. SHORT- TERM LOANS........................................................................................................................... 7034. SHORT-TERM CREDITS......................................................................................................................... 7035. BREAKDOWN OF SHORT-TERM LIABILITIES TO RELATED PARTIES............................................. 7036. OTHER SHORT-TERM LIABILITIES ...................................................................................................... 7137. NET SALES REVENUES BY MARKET SEGMENTS ............................................................................. 7238. NET SALES REVENUES BY CORE ACTIVITIES................................................................................... 7239. IMPORT PURCHASE BY MARKET SEGMENT ..................................................................................... 7310
<strong>MOL</strong> <strong>Hungarian</strong> <strong>Oil</strong> <strong>and</strong> <strong>Gas</strong> <strong>Public</strong> <strong>Limited</strong> <strong>Company</strong>Supplementary Notes for the year ending on 31 December 200940. OTHER OPERATING INCOME AND EXPENSES .................................................................................. 7441. OTHER SERVICES.................................................................................................................................. 7542. DIVIDEND RECEIVED (DUE).................................................................................................................. 7643. SOLD AND LIQUIDATED COMPANIES ................................................................................................. 7644. OTHER FINANCIAL INCOME AND EXPENSES .................................................................................... 7745. EXTRAORDINARY REVENUES AND EXPENDITURE .......................................................................... 7846. GRANT RECEIVED FOR DEVELOPMENT PURPOSES........................................................................ 7947. REVENUES FROM RELATED PARTIES................................................................................................ 7948. PERMANENT ESTABLISHMENT IN SLOVAKIA ................................................................................... 8049. RECONCILIATION OF CORPORATE TAX BASE, SOLIDARITY SURPLUS TAX, ENERGYCOMPANIES’ INCOME TAX .................................................................................................................. 8250. MATERIAL ERRORS OF THE PREVIOUS YEARS AND THEIR IMPACT ............................................ 8451. EMPLOYEES........................................................................................................................................... 8552. BOARD OF DIRECTORS, SUPERVISORY BOARD AND TOP MANAGEMENT .................................. 8653. COMMITMENTS AND CONTINGENT LIABILITIES ............................................................................... 8954. EFFECT OF FAIR VALUATION .............................................................................................................. 9255. OFF-BALANCE SHEET JOINT AND SEVERAL LIABILITY .................................................................. 9456. GUARANTEES OF <strong>MOL</strong> PLC, NOT INCLUDED IN THE BALANCE SHEET........................................ 9557. <strong>MOL</strong> PLC'S SECURITIES OFFERED AS SECURITY DEPOSIT ON 31 DECEMBER 2009.................. 9658. EVENS AFTER THE PREPARATION OF BALANCE SHEET................................................................ 9611
<strong>MOL</strong> <strong>Hungarian</strong> <strong>Oil</strong> <strong>and</strong> <strong>Gas</strong> <strong>Public</strong> <strong>Limited</strong> <strong>Company</strong>Supplementary Notes for the year ending on 31 December 20091. General Information<strong>MOL</strong> <strong>Hungarian</strong> <strong>Oil</strong> <strong>and</strong> <strong>Gas</strong> <strong>Public</strong> <strong>Limited</strong> <strong>Company</strong> (hereinafter referred to as <strong>MOL</strong> Plc, <strong>MOL</strong> or the <strong>Company</strong>)was incorporated on 1 October 1991 as a result of the merger of nine oil <strong>and</strong> gas companies of Országos KőolajésGázipari Tröszt (National <strong>Oil</strong> <strong>and</strong> <strong>Gas</strong> Trust, <strong>Hungarian</strong> abbreviation OKGT) owned by the <strong>Hungarian</strong> state.Due to the multi-stage privatisation the state owned part in the <strong>Company</strong> decreased considerably. On 31December 2009 the <strong>Hungarian</strong> State has 1 “B” series share with a preferential vote <strong>and</strong> 33 “A” series shares,from 1 January 2008 through <strong>Hungarian</strong> State Holding <strong>Company</strong> (<strong>Hungarian</strong> abbreviation MNV Zrt.).The registered office address of the <strong>Company</strong> is Budapest (1117 Október huszonharmadika u. 18.), Hungary; itsinternet homepage is www.mol.huThe shares of the <strong>Company</strong> are listed on the Budapest <strong>and</strong> the Warsaw Stock Exchange. Depositary Receipts(DRs) are listed on the Luxembourg Stock Exchange <strong>and</strong> are quoted on the International Order Book in London<strong>and</strong> other over the counter markets in New York, Berlin <strong>and</strong> Munich.The core activities of <strong>MOL</strong> Plc include exploration <strong>and</strong> production of crude oil, natural gas <strong>and</strong> gas products,refining, transportation <strong>and</strong> storage of crude oil, transportation, storage, distribution, retail <strong>and</strong> wholesale of crudeoil products. <strong>MOL</strong> Plc is the market leader in Hungary in all its core activities.In 2009, domestic net crude oil production was 715.4 kilotons, <strong>and</strong> net natural gas production was 2,280 millionm³. The exploration <strong>and</strong> production segment include natural gas <strong>and</strong> crude oil collection pipelines, connecting thecrude oil <strong>and</strong> natural gas fields with delivery points <strong>and</strong> the pipeline transportation systems. The refining activitiesalso include the exclusive title to the approximately 848 km long crude oil <strong>and</strong> 1,356 km long product pipeline.<strong>MOL</strong> Plc operates two refineries in Hungary. Duna Refinery – is processing crude oil <strong>and</strong> its annual nominalcrude oil processing capacity was nearly 8.4 million tons in 2009, the actual distillation raw material refining in2009 was 6.5 million tons. On 1 July 2001 in Tisza Refinery crude oil refining process ceased because of closingdown the distilling plant with capacity of 3 million tons. The core activities of the refinery are diesel oildesulphurisation <strong>and</strong> mixing gasoline. The Duna <strong>and</strong> Tisza Refineries are connected directly to the crude oil <strong>and</strong>product pipelines of the <strong>Company</strong>. <strong>MOL</strong> Plc also operates a bitumen manufacturing plant in Zalaegerszeg.According to the study of Wood Mackenzie, the acclaimed advisor of industry, Duna Refinery is one of the mostefficient European refineries.The retail activities of refined products are based on filling stations operated under <strong>MOL</strong> br<strong>and</strong> name. Apart frommotor fuel retail, the filling stations also sell non-fuel goods (food, car care articles, top-up mobile phone cards,motorway stickers, medicines, etc.) <strong>and</strong> provide other services (automated <strong>and</strong> manual car wash, etc.). On 31December 2009, the <strong>Company</strong> had 365 fuel stations in Hungary, of which 331 were operated by partners (ownedby <strong>MOL</strong> but operated by contractors selected in tenders), <strong>and</strong> 34 were operated in franchise system (operatedwith a <strong>MOL</strong> logo <strong>and</strong> product range, but not owned by <strong>MOL</strong>).<strong>MOL</strong> <strong>and</strong> CEZ signed a strategic alliance agreement in December 2007. The joint venture focus on gas-firedpower generation <strong>and</strong> related gas infrastructure in 4 countries of Central <strong>and</strong> South-eastern Europe. Within theframe of this project <strong>MOL</strong> concluded an agreement with CM European Power Slovakia s.r.o. for engineering <strong>and</strong>construction activities. During the implementation in Bratislava the current thermal plant will be modernized <strong>and</strong>its capacity will be increased. <strong>MOL</strong> activity in Slovakia created permanent establishment from taxation point ofview <strong>and</strong> <strong>MOL</strong> fulfilled all his related authorisation <strong>and</strong> notification liabilities. The permanent establishment as apart of <strong>MOL</strong> Plc is presented within the <strong>Company</strong>’s balance sheet <strong>and</strong> income statement.The name of permanent establishment is <strong>MOL</strong> <strong>Hungarian</strong> <strong>Oil</strong> <strong>and</strong> <strong>Gas</strong> <strong>Public</strong> <strong>Limited</strong> <strong>Company</strong>, <strong>MOL</strong> Plc(Address: Vlčie hrdlo 1, 82107 Bratislava, Slovak Republic).12
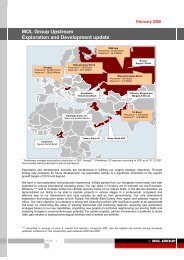
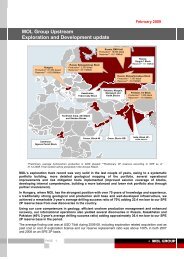
<strong>MOL</strong> <strong>Hungarian</strong> <strong>Oil</strong> <strong>and</strong> <strong>Gas</strong> <strong>Public</strong> <strong>Limited</strong> <strong>Company</strong>Supplementary Notes for the year ending on 31 December 20092009 exploration project• In October <strong>MOL</strong> Plc announced that it hade made a new (fourth) discovery of gas <strong>and</strong> condensate in the TalBlock, located in the Northern Western Frontier Province of Pakistan. Hydrocarbon exploration has beencarried out in this block since 1999 by a consortium of companies including <strong>Oil</strong> <strong>and</strong> <strong>Gas</strong> Development Co.Ltd, Pakistan Petroleum <strong>Limited</strong>, Pakistan <strong>Oil</strong>fields Ltd <strong>and</strong> Government Holdings Ltd with <strong>MOL</strong> as anOperator of this Joint Venture. <strong>MOL</strong> has a 10 % interest in the consortium. The production of the Maramzai-1well is 1.1 million cubic meters/day <strong>and</strong> 228 cubic meters/day condensate.The Manzalai gas processing plant came on stream on 28 October 2009 with 8.5 million cubic metersmaximal capacity. Via the commissioning of the gas processing plant Manzalai, MamiKhel <strong>and</strong> Maramzaifields can start its production.Strategic investments• On 29 January 2009 <strong>MOL</strong> Plc increased its stake to 50 % in the geothermal energy company, CEGE Zrt.<strong>MOL</strong> <strong>and</strong> Green Rock Energy International Pty. Ltd. acquired one half of Enex hf.’s one third interest inCEGE at the nominal book value, resulting in both <strong>MOL</strong> <strong>and</strong> Green Rock having an equal 50 % interest inthe HUF 6 million share equity of the company.• As a result of the successful voluntary public offer for INA shares <strong>MOL</strong> has become the largest shareholderof INA in October, 2008. On 30 January 2009 <strong>MOL</strong> <strong>and</strong> the Republic of Croatia represented by theGovernment of Croatia have agreed to amend the Shareholders’ Agreement. The major changes of theShareholders’ Agreement were as follows:− <strong>MOL</strong> delegates five out of the nine members in the Supervisory Board. After electing the <strong>MOL</strong>’srepresentatives <strong>MOL</strong> takes the responsibility for the operation of INA. After the closing of the−transaction <strong>MOL</strong> has controlling influence over the Management Board.The Government will have veto rights ensuring the national security of energy supply <strong>and</strong> somedecisions with respect to strategic assets of INA.Upon obtaining the European Committee’s unconditioned approval <strong>and</strong> the Croatian competition office’sconditioned approval, the shareholders’ meeting was called on 10 June 2009 to elect the new SupervisoryBoard of INA. The shareholder’s meeting was deemed to be the date when control was passed to <strong>MOL</strong>,therefore the INA has been fully consolidated in the <strong>MOL</strong> Group’s Annual Report as of 30 June 2009.• <strong>MOL</strong> Plc, FGSZ Natural <strong>Gas</strong> Transmission <strong>Company</strong> as the operator of the <strong>Hungarian</strong> high pressure naturalgas pipeline system <strong>and</strong> Plinarco d.o.o. as the operator of the Croatian Transmission System concluded aJoint Development Agreement on 3 March 2009 in Zagreb. The main goal of the agreement is the completionof the interconnection between the two transmission systems, on the Városföld – Slobodnica route. At thebeginning natural gas will be transported from Hungary to Croatia through the pipeline; however at a laterstage the parties may contemplate the creation of the technical conditions of the transportation of natural gasfrom Croatia to Hungary through the pipeline. The annual capacity of the new pipeline is 6.5 billion cubicmeters.• On 10 March 2009 <strong>MOL</strong> Plc <strong>and</strong> Gazprom Export LLC signed an agreement to jointly establish anunderground gas storage facility in Hungary. The parties will address the actual final investment decisionsubject to actual regulatory approvals, financing <strong>and</strong> technical feasibility of the project. The new companyowned 50-50 % by the parties will significantly increase security of supply in the region. The gas storagefacility is expected to have a capacity of 1.3 billion cubic meters, with a daily extraction capacity of 15 millioncubic meters. The facility will be established by the conversion of <strong>MOL</strong>’s Pusztaföldvár-Dús natural gasreservoir. The construction of the facility is expected to commence after 2010 <strong>and</strong> the facility could be onstream around 2012-2013.13
<strong>MOL</strong> <strong>Hungarian</strong> <strong>Oil</strong> <strong>and</strong> <strong>Gas</strong> <strong>Public</strong> <strong>Limited</strong> <strong>Company</strong>Supplementary Notes for the year ending on 31 December 2009• On 15 May 2009 it signed an agreement to acquire 10 % stake in Pearl Petroleum <strong>Company</strong> <strong>Limited</strong> (Pearl)from the Crescent Petroleum <strong>Company</strong> International <strong>and</strong> Dana <strong>Gas</strong> PJSC. Pearl holds all of the companies’legal rights in Khor Mor <strong>and</strong> Chemchemal gas-condensate fields in the Kurdistan Region of Iraq. In exchangefor a 10 % ownership package of Pearl <strong>MOL</strong> paid 6,322,232 “A” series <strong>MOL</strong> shares, representing 6 % of itscurrent registered capital <strong>and</strong> as a result Crescent Petroleum <strong>Company</strong> International <strong>and</strong> Dana <strong>Gas</strong> PJSCeach became 3 % shareholders in <strong>MOL</strong>. Since the agreement between the shareholders grant <strong>MOL</strong> asignificant influence on Pearl’s operations, the company is treated as an associated company <strong>and</strong> isconsolidated accordingly.Signatories of the financial statements of the <strong>Company</strong>:Zsolt Hernádi, CEO, Chairman of the Board of DirectorsAddress: 1026 Budapest, Orló u. 9.József Molnár, Executive Vice President for FinanceAddress: 3700 Kazincbarcika, Akácfa u. 39.(Finance Ministry registration number in the registry of entitled persons for accounting service providers:128042)14
<strong>MOL</strong> <strong>Hungarian</strong> <strong>Oil</strong> <strong>and</strong> <strong>Gas</strong> <strong>Public</strong> <strong>Limited</strong> <strong>Company</strong>Supplementary Notes for the year ending on 31 December 20092. Ownership structureNumber <strong>and</strong> nominal value of shares issued by <strong>MOL</strong> Plc, categorised by share type:OwnerNumber of shares (pieces)Total nominalShare of"B" seriesvalue (HUF"A" series shares"C" series sharesownership (%)sharesmillion)2008 2009 2008 2009 2008 2009 2008 2009 2008 2009MNV Zrt. 33 33 1 1 0 0 * 0 * *Foreigninstitutional<strong>and</strong> privateinvestors76,134,650 81,633,580 0 0 0 0 76,135 81,634 72.84 78.11Of which:SurgutneftegasOJSCBayerischeHypo-undVereinsbankAG.SocieteGenerale* 22,179,488 0 0 0 0 * 22,179 * 21.2217,007,802 * 0 0 0 0 17,008 * 16.27 *4,601,059 * 0 0 0 0 4,601 * 4.40 *CEZ MH B.V. 7,677,285 7,677,285 0 0 0 0 7,677 7,677 7.35 7.35Oman <strong>Oil</strong>Budapest<strong>Limited</strong>BNP ParibasArbitrageS.N.C.MagnoliaFinance LtdING BankN.V.**CrescentPetroleum<strong>Company</strong>International***Dana <strong>Gas</strong>PJSC***Domesticinstitutional<strong>and</strong> privateinvestorsOf which:OTP BankPlc<strong>MOL</strong> Plctreasuryshares7,316,294 7,316,294 0 0 0 0 7,316 7,316 7.00 7.007,600,583 * 0 0 0 0 7,601 * 7.27 *6,007,479 6,007,479 0 0 0 0 6,007 6,007 5.75 5.75* 5,220,000 0 0 0 0 * 5,220 * 4.99* 3,161,116 0 0 0 0 * 3,161 * 3.02* 3,161,116 0 0 0 0 * 3,161 * 3.0219,602,436 15,450,134 0 0 0 0 19,602 15,450 18.76 14.788,857,438 6,707,832 0 0 0 0 8,857 6,708 8.47 6.428,781,365 7,434,737 0 0 578 578 8,782 7,435 8.40 7.11Total 104,518,484 104,518,484 1 1 578 578 104,519 104,519 100.00 100.0015
<strong>MOL</strong> <strong>Hungarian</strong> <strong>Oil</strong> <strong>and</strong> <strong>Gas</strong> <strong>Public</strong> <strong>Limited</strong> <strong>Company</strong>Supplementary Notes for the year ending on 31 December 2009The nominal value of series "A" <strong>and</strong> "B" shares is HUF 1,000, <strong>and</strong> of series "C" shares HUF 1,001. Due to thehigher nominal value, series "C" shares entitle their holders to 1.001 (one point one thous<strong>and</strong>th) of votes, incontrast with the right to have one vote for series "A" shares.MNV Zrt. (<strong>Hungarian</strong> State Holding <strong>Company</strong> beforeh<strong>and</strong> ÁPV Zrt.) has one share for preferential voting (this isone series "B" share), to which certain additional rights are connected. (MNV Zrt.’s registered office: 1133Budapest, Pozsonyi út 56.)* The owners had 0 % or less than 5 % interest in the given period.** According to the announcement of ING Bank N.V. because of his indirect ownership his controlled voting rightsare above 5 percent.*** Crescent Petroleum <strong>Company</strong> International <strong>and</strong> Dana <strong>Gas</strong> PJSC announced that they are parties acting inconcern.Data of accentuated investors with ownership above 5 %Name of the <strong>Company</strong>SeatVoting rights(%)Correctedownership dueto Article ofAssociation(%)Surgutneftegas OJSC628415 Surgut, Tyumenskaya OblastUl. Kukuyevitskogo 1.22.85 10.00Veena 340, 3012NJ Rotterdam, TheCEZ MH B.V.Netherl<strong>and</strong>s7.91 7.91Ugl<strong>and</strong> House, Gr<strong>and</strong> Cayman, KYI-Oman <strong>Oil</strong> Budapest <strong>Limited</strong> 11047.54 7.54OTP Bank Plc 1051 Budapest, Nádor utca 16. 6.91 6.9122 Grenville Street, St Heiler, Jersey,Magnolia Finance LtdChannel Isl<strong>and</strong>s, JE4 8PX6.19 6.19Bijlmerplein 888,AmsterdamING Bank N.V.Zuidoost,1102 MG, The Netherl<strong>and</strong>s5.38 5.38Crescent Petroleum <strong>Company</strong> Crescent Tower, Buhaira, 20 th . Sharjah,International*United Arab Emirates3.26 3.26Crescent Tower, Buhaira, 20 th . Sharjah,Dana <strong>Gas</strong> PJSC*United Arab Emirates3.26 3.26* Crescent Petroleum <strong>Company</strong> International <strong>and</strong> Dana <strong>Gas</strong> PJSC announced that they are parties acting inconcern.The statement above has been prepared on the basis of registration notifications <strong>and</strong> shareholder’sannouncements <strong>and</strong> does not reflect the ownership structure registered in the record of shareholders.Registration in the record of shareholders is not obligatory. Shareholder may exercise his voting right only if he isregistered in the record of shareholders. Based on <strong>MOL</strong>’s Article of Association neither individual shareholder nora group of shareholders may exercise voting rights above 10 percent.16
<strong>MOL</strong> <strong>Hungarian</strong> <strong>Oil</strong> <strong>and</strong> <strong>Gas</strong> <strong>Public</strong> <strong>Limited</strong> <strong>Company</strong>Supplementary Notes for the year ending on 31 December 20093.4. Valuation methods <strong>and</strong> procedures used in the preparation of annual report3.4.1. Changes in the Accounting PolicyBuilt in law amendments:Changes in the Accounting Policy were arisen from the several amendments of Accounting Act made in 2008 <strong>and</strong>also from the changes in regulation published in 2009 in case the legislator made available implementationalready during the preparation of the annual report for the business year 2009.• Accounting Policy has been amended with description of advance payment given for intangible assets,assets under construction <strong>and</strong> stocks in line with the more precise related definitions of the Accounting Act.• The historical value of tied-up reserve - created obligatory, as required by law - has been changed inconnection with treasury shares, repurchased business shares <strong>and</strong> convertible business shares. Thepreceding regulation determined creation of tied-up reserve against the retained earnings with the value atthe time of redemption. Following the amendment the book value of investments shall be recognised in thevalue of the tied-up reserve.• Reclassification rules used for financial assets available for trade, which are valued at fair value, has beenchanged in accordance with the modifications in the European Union’s regulation. If due to extraordinaryevents company alter his intention to keep financial assets, these assets can be reclassified into othercategory. Reclassified assets shall not be valued at fair value (market value) accordingly, but will be valuedat carrying value. If decrease of market value is not found on permanent trend, financial assets shall not beimpaired.• <strong>Company</strong> amended rules for release of deferred revenue arisen from subsidy received for developmentpurposes. Deferred revenue shall be released at the time of reimbursement of subsidy.• Accounting Act regulates the repurchasing value <strong>and</strong> method of assets which were sold but laterrepurchased because of non-performance of contracting terms. If contracting obligations are not fulfilled,seller redeems the asset.Beyond above amendments, further refinement changes of Accounting Act were put through the AccountingPolicy.Supplements <strong>and</strong> other changes in Accounting Policy arisen from experience during daily practice:• <strong>Company</strong> amended regulations on the subject how to ensure accuracy (accuracy ensured by signature) incase of invoices issued for retail sales with cards. Format <strong>and</strong> content accuracy of accounting document isdeemed to be guaranteed when data required for invoicing, are controlled before the input into the invoicingsystem or data are measured otherwise counted by the system.• In case of an investment which incorporates ownership rights, regulation was supplemented with definition ofthe time when asset shall be registered.• Valuation rules were specified in respect of intangible <strong>and</strong> tangible assets, which are permanently out of use<strong>and</strong> available for sale.• <strong>Company</strong> has replenished criteria of impairment for purchased <strong>and</strong> own produced inventories.• Accounting Policy was amended in respect to valuation of emission rights (CO 2 allowances). New rule wasinserted for recording of emission rights purchased by forward transaction.• <strong>MOL</strong> Plc stated accounting rules for cost <strong>and</strong> revenues arisen from joint operations <strong>and</strong> impairment rules forrelated receivables <strong>and</strong> payables.• Accounting Policy specified regulations for revision of created provisions, <strong>and</strong> also rules of the release.In addition to amendments listed above, <strong>Company</strong> made further small changes in Accounting Policy. <strong>MOL</strong> Plcmade also supplements due to questions arisen during the practice.18
<strong>MOL</strong> <strong>Hungarian</strong> <strong>Oil</strong> <strong>and</strong> <strong>Gas</strong> <strong>Public</strong> <strong>Limited</strong> <strong>Company</strong>Supplementary Notes for the year ending on 31 December 2009In case of inventories purchased as raw materials <strong>and</strong> semi-finished products or hydrocarbon production inprogress to be used further on, it is investigated whether their value is recovered in the sale price of thefinished products produced in the course of using such items in production. The recoverable amountdetermined this way is reduced by the costs expected to be incurred in order for sale. If there is no full return,impairment – if significant – is accounted for up to the level of return. It is deemed to be significant if theamount to be accounted for as impairment reaches HUF 100 million.Furthermore, in case of the aggregated difference between the carrying amount <strong>and</strong> the value determined asrecoverable value reaches HUF 300 million for individual inventories’ (pieces), value of them do not reachHUF 100 million, then the individually (by pieces) accounted impairment has to be recorded in descendingorder until the aggregated value of the relevant individual items calculated together with impairment willdecrease below HUF 300 million.<strong>Company</strong> does not apply reversal of impairment of inventories as a rule, but impairment may be reversed if theamount of reversal by individual inventories reaches HUF 100 million or the value of accounted impairment based onindividual assessment, in order to give a true <strong>and</strong> fair view.The <strong>Company</strong> does not recognize impairment <strong>and</strong> reversal for industrial, construction industrial <strong>and</strong> other work inprogress on products <strong>and</strong> services, mediated services <strong>and</strong> packaging materials, considering their amount is notsignificant.The <strong>Company</strong> records emission rights (CO 2 allowances) as commodities.Purchase price of emission rights are as follows:• Rights received from the <strong>Hungarian</strong> State free of charge recorded on market price valid on day of crediting in theTrade register.• Emission rights purchased from other parties are recorded at cost including the broker fee.Valuation of emission rights is made individually. Emission quotes are booked by groups using FIFO method.Impairment shall be recorded when carrying value of emission rights is permanently <strong>and</strong> considerably higher thanthe value calculated based on market price at the balance sheet preparation date (at the MNB’s official exchangerate at the end of the year). Accounted impairment is deemed significant if reaches HUF 100 million. Reversal ofimpairment shall be recorded - if the reason of its accounting does not exist – until the market price but not more thanthe booked value of impairment.If emission rights are purchased within the frame of forward transaction, the forward part of the deal is recorded as outof balance sheet item with the payable amount defined by the contract, using the contracted (forward) price rate.Purchased emission rights are accounted based on rules for buying <strong>and</strong> selling at the time of closing the deal until theclosing of the transaction.Foreign currency put into the foreign currency petty cash, foreign exchange transferred to the foreign exchangeaccount, receivables, non-current financial instruments, securities <strong>and</strong> liabilities denominated in foreign currency areconverted to HUF at the official FX exchange rate published by the National Bank of Hungary (MNB) for the date ofreceipt or for the date of settlement.The <strong>Company</strong> converts foreign currency purchased against HUF, received to the FX account, to the selected MNBexchange rate on settlement date, pursuant to the fair valuation of financial instruments.In the confines of year-end foreign exchange revaluation, that is set out in Article 60 section (2) of the Accounting Actthe <strong>Company</strong> revaluates its assets <strong>and</strong> liabilities, linked directly to investments <strong>and</strong> property rights <strong>and</strong> denominatedin foreign currency <strong>and</strong> foreign exchange – irrespective of their amount – except for FX liabilities, not covered by FXassets <strong>and</strong> the assets included in fair valuation, so determines the significance limit at HUF 0.The <strong>Company</strong> recognises exchange rate differences realised during the year <strong>and</strong> not realised at the end of the yearon FX loans <strong>and</strong> FX liabilities, not covered by FX assets that relates to investments as part of the value of theinvestment.20
<strong>MOL</strong> <strong>Hungarian</strong> <strong>Oil</strong> <strong>and</strong> <strong>Gas</strong> <strong>Public</strong> <strong>Limited</strong> <strong>Company</strong>Supplementary Notes for the year ending on 31 December 2009Impairment will be recognized if:• the realizable value is lower than the book value of investment corrected with goodwill <strong>and</strong>increased by the loan given to the related party, <strong>and</strong>• if future business expectations or strategic factors concerning the investment do not support thereturn of investment.If impairment is accounted, the order is as follows:• first the positive goodwill, after that the• the investment , <strong>and</strong> if the impairment is above these aggregate amounts,• the amount of the given loan will be impairedIn case the <strong>Company</strong> is liquidated or wound up the difference between the book value <strong>and</strong> the amount expectedto be recovered is accounted for as impairment.If the stock exchange price or proportionate equity of the <strong>Company</strong> does not reflect the fair market price of thegiven company, <strong>MOL</strong> Plc determines the market value that serves as the basis of the comparison in individualvaluation, based on the information available (analytical studies, plans for the future).For unquoted investments, if the price paid on acquisition is higher than the equity share in the investment, <strong>MOL</strong>Plc analysis the <strong>Company</strong>’s operating efficiency, the trend of its profitability <strong>and</strong> the durability of this trend todetermine the amount of impairment loss to be accounted for.The <strong>Company</strong> values long-term credit securities based on weighted average price.It accounts for impairment on the balance sheet cut-off date for stock exchange securities if the stock exchangeprice less interest decreases significantly below the average book price in the long-term. The reduction is deemedto be a reduction in the long-term if it exists for a period exceeding one year <strong>and</strong> is not expected to recover withinone year. The <strong>Company</strong> performs the impairment to the average stock exchange price valid at the balance sheetpreparation date, less interest, irrespective of the amount.The <strong>Company</strong> accounts for impairment on over-the-counter securities if the issuer’s (debtor’s) evaluationdeteriorates in the long-term, i.e. for over one year. In connection with that the <strong>Company</strong> investigates the overthe-counterprice less interest, the market value, the long-term trend of the market value as well as the issuer’s(debtor’s) market position, i.e. whether the issuer is expected to pay the nominal value plus accumulated intereston maturity, at redemption, or what proportion of this amount the issuer will pay. In that case, the amount ofimpairment to be accounted for is the difference between the book value <strong>and</strong> the market price determined asabove, if the difference is significant.For securities with maturity within or in one year, the over the counter price is used for evaluation at the balancesheet date. <strong>MOL</strong> Plc performs evaluation based on the expected recovery of the nominal value plus accumulatedinterest. If recovery of the nominal value plus interest becomes uncertain, it accounts for the difference betweenthe book value <strong>and</strong> the amount expected to be recovered as impairment.In respect of investments <strong>and</strong> securities, the amount of impairment to be accounted for is deemed to besignificant if it reaches HUF 50 million. If the impairment to be accounted for reaches 50 % of the book value, itmust be accounted for regardless of the amount.If the circumstances that give raise to impairment cease to exist in whole or in part – if this trend is not expectedto reverse within one year – the impairment accounted for will be reversed in the framework of qualification on thebalance sheet date if the change is significant. Reversal may take place up to the original purchase price but maynot be more than the nominal value. The changes deemed to be significant if it reaches HUF 50 million or theaccounted value of impairment.It is also possible to reverse the market-based impairment of investments accounted for before 1 January 2001.22
<strong>MOL</strong> <strong>Hungarian</strong> <strong>Oil</strong> <strong>and</strong> <strong>Gas</strong> <strong>Public</strong> <strong>Limited</strong> <strong>Company</strong>Supplementary Notes for the year ending on 31 December 2009Treasury shares are valued at the weighted average price determined by groups. The group includes similar type oftreasury shares by depositories. Within that separate group is composed of lent treasury shares by transactions at thetime of registration, when the lending term expires.The <strong>Company</strong> will account for impairment at the time of valuing treasury shares at the end of the year if theweighted average stock exchange share price during 90 stock exchange days prior to the balance sheetpreparation date is lower than the book value.During the year-end valuation the difference between the book value <strong>and</strong> the value of borrowing agreementrecognised as deferred expenditure at the time of the lend have to be taken into account in the book value oftreasury shares received back from lend <strong>and</strong> registered in separate group.The amount of impairment shall be determined according to the difference between the average book value oftreasury shares <strong>and</strong> the weighted average stock exchange price during 90 days prior to the balance sheetpreparation date, if it reaches HUF 50 million.The <strong>Company</strong> does not recognize impairment for treasury shares if the stock exchange price is higher than theaverage book value at the time of balance sheet preparation.Reversal for treasury shares shall be recorded if the weighted average stock exchange share price during 90stock exchange days prior to the balance sheet preparation date is higher than the book value. Reversal maytake place up to the amount of recorded impairment.The <strong>Company</strong> does not account reversal if the stock exchange share price known at the balance sheetpreparation date is lower than the average book value.The <strong>Company</strong> nets the interest liability calculated for repurchased convertible bonds against the interestreceivable on convertible bonds included among securities.Based on the individual rating of customers <strong>and</strong> debtors, <strong>MOL</strong> Plc accounts for impairment on receivablesoutst<strong>and</strong>ing on the balance sheet date that are not settled by the date of preparing the balance sheet, if the bookvalue of the receivable is significantly exceeds the amount expected to be recovered from the receivable. Ratingis made based on the information available at the time of preparing the balance sheet in the course of which the<strong>Company</strong> estimates expected percentage of collection of receivables. The rating shall set out in the criteria thatserve as the basis for determining the percentage of expected collection. The difference shall be significant if itreaches 20 % of the value of the receivable for a customer or a debtor. If the amount of the difference exceedsHUF 1 million, impairment is always accounted for.Major criteria for debtor rating:• bankruptcy or liquidation proceedings have been launched against the debtor,• foreclosure proceedings have been launched against the debtor,• the due date of the receivable from the debtor has been passed,• written statement or information issued by a bankruptcy commissioner or liquidator,• collection of the receivable is not likely due to the debtor’s financial position (e.g. indebtedness, badsolvency, etc.).If the amount expected to be recovered out of the receivable based on the rating of the customer or debtor on thebalance sheet date considerably exceeds the book value of the receivable (criteria for write-off are not in place orare in place only in part) the <strong>Company</strong> will reverse all or a part of the impairment accounted for earlier. The bookvalue of the receivables following the reversal may not exceed the book value of the original receivable that is notyet settled. The amount will be deemed to be significant if it exceeds HUF 100,000 or the accounted value ofimpairment.During valuation of inter-company loans - financing operation of related party - the <strong>Company</strong> proceeds accordingto the rules applied for investment assessment.Receivables due to lent treasury shares are valued individually having respect for related accruals or deferrals.The <strong>Company</strong> will account for impairment at the time of valuing receivables due to lent treasury shares at the endof the year if the calculated value of treasury shares - based on weighted average stock exchange share price23
<strong>MOL</strong> <strong>Hungarian</strong> <strong>Oil</strong> <strong>and</strong> <strong>Gas</strong> <strong>Public</strong> <strong>Limited</strong> <strong>Company</strong>Supplementary Notes for the year ending on 31 December 2009during 90 stock exchange days prior to the balance sheet preparation date - is lower than the aggregate amountof receivables <strong>and</strong> related accruals or deferrals.The amount of impairment shall be determined according to the difference between the aggregate value ofreceivables <strong>and</strong> related accruals or deferrals <strong>and</strong> the lent treasury share’s weighted average stock exchangeprice during 90 days prior to the balance sheet preparation date, if it reaches HUF 50 million.The <strong>Company</strong> does not recognize impairment for receivables due to lent treasury shares if the lent treasuryshare‘s stock exchange price is higher than the aggregate value of receivables <strong>and</strong> related accruals or deferralsat the time of balance sheet preparation.Reversal for receivables due to treasury shares shall be recorded if the lent treasury share’s weighted averagestock exchange price during 90 stock exchange days prior to the balance sheet preparation date is higher thanthe aggregate book value of receivables <strong>and</strong> related accruals or deferrals. The <strong>Company</strong> does not accountreversal if the lent treasury share’s stock exchange share price known at the balance sheet preparation date islower than the aggregate value of receivables <strong>and</strong> related accruals or deferrals.Reversal may take place up to the amount of recorded impairment.MNB official rate is used for the HUF translation of new foreign exchange following the exchange of foreignexchanges on account. The difference between the book value of old <strong>and</strong> the initial book vale of new foreignexchange is recognised as other financial expense or income. The <strong>Company</strong> applies the above mentionedprocedure in case of transfers between foreign exchange <strong>and</strong> foreign currency accounts <strong>and</strong> between accountswith same foreign exchange.In case of exchange of liabilities denominated in foreign exchange, the new liability is converted into HUF byusing MNB official FX rate applicable on the settlement date of the agreement of the new liability. In case of loanexchange transactions, when only the foreign exchange in which the loan is denominated is modified, the new FXloan is converted into HUF by using MNB official FX rate applicable on the date of agreement.For assets denominated in foreign currency or foreign exchange, both impairment <strong>and</strong> its reversal shall bedetermined in foreign exchange. The amount of impairment determined is converted to HUF at the bookexchange rate of the given asset. The amount determined as reversal is converted to HUF at the weightedaverage exchange rate of the impairments reduced by any reversal. Impairment <strong>and</strong> reversal are accounted forbefore the year-end total foreign exchange revaluation.3.4.3. Depreciation policy<strong>MOL</strong> Plc interprets depreciation in accordance with the regulations of the Accounting Act, with the following additions:In respect of property, plant <strong>and</strong> equipment, <strong>MOL</strong> Plc usually applies a linear depreciation based on the grossvalue; with the exception of assets that may be allocated only to one mine (excluding the rights of property valuelinked to these assets) catalyst <strong>and</strong> provision for estimated future cost of field ab<strong>and</strong>onment of oil <strong>and</strong> gasproduction facilities following the termination of production booked as tangible asset, for which a depreciationmethod of unit of production is used, that is based on the carrying value.PB gas containers <strong>and</strong> the reinforced concrete big modular road surface plates – with value less than HUF100,000 – are booked in group, <strong>and</strong> depreciated by linear depreciation in case of PB gas containers during 5years <strong>and</strong> in case of reinforced concrete elements during 10 years.Selection criteria for technical-economic useful life <strong>and</strong> for depreciation rates are defined in the regulation issuedon the Group level, which includes the technical-economic useful life with adequate depreciation rate by thegroup of assets. Deviation form the depreciation rates defined in the regulation is allowed based on individualvaluation, in case of different usage characteristics, based on written technical qualification.24
<strong>MOL</strong> <strong>Hungarian</strong> <strong>Oil</strong> <strong>and</strong> <strong>Gas</strong> <strong>Public</strong> <strong>Limited</strong> <strong>Company</strong>Supplementary Notes for the year ending on 31 December 2009The economic useful life of assets are as follows: 10-50 years for buildings, 4-12.5 years for refinery equipments,7-25 years for gas <strong>and</strong> oil transporting <strong>and</strong> storing equipments, 5-25 years for filling stations <strong>and</strong> their equipments<strong>and</strong> 3-10 years for other equipments.Depreciation is accounted for in the SAP R/3 system on daily basis at the end of each month.No further depreciation may be recognised if the carrying value of the asset has already reached its residual value.The residual value is not nil if it is clearly decided at the time of acquiring the asset that the asset’s useful life for the<strong>Company</strong> will not reach 75 % of the asset’s technical-economic useful life <strong>and</strong> the residual value expected to besignificant at the end of its useful life. The residual value may be determined in respect of individual asset or assetgroups required to undertake the core activities, representing a significant value at company level. The residual valueis subject to yearly revision, modification should be made if the expectations significantly differ from previousexpectations.The <strong>Company</strong> will change the depreciation for assets if there was a substantial change (if the individual asset’suseful life changes by at least +/- 2 years but the amount of annual depreciation for an individual asset changesminimum HUF 1 million) in the circumstances taken into account in determining the depreciation to be accountedfor every year (gross value, useful life, proper use). The annual review of economic useful life is made by the<strong>Company</strong> for intangible assets with carrying value reach HUF 10 million net, <strong>and</strong> for tangible assets with grossvalue reach HUF 50 million <strong>and</strong> carrying value reach HUF 10 million.The effect of the revision on the balance sheet <strong>and</strong> income statement for the financial year 2009 is disclosed inNote 9.The <strong>Company</strong> does not recognise planned depreciation for those assets, which value does not decrease allthrough their use.The assets should be divided into main parts in the accounting records, if the technical useful life of the mainparts differs from the useful life of the assets determined by the <strong>Company</strong>, <strong>and</strong> the depreciation should be appliedfor each main part. The definition of main part (component) is the smallest identifiable unit, that has a differentuseful life compared to that of other components <strong>and</strong> it has a significant value compared to the whole value of theasset.<strong>MOL</strong> Plc accounts for impairment if intellectual rights <strong>and</strong> titles can be enforced only in a limited manner or not atall within the expected depreciation period, if the intellectual product <strong>and</strong> the Property, Plant <strong>and</strong> Equipment aremissing, damaged or destroyed, or if the market value of intangible goods <strong>and</strong> Property, Plant <strong>and</strong> Equipment issignificantly lower than their carrying value for the long term. If the market value of an individual asset cannot bedetermined, the <strong>Company</strong> will create the smallest asset group for which market evaluation is applicable.For an individual asset or asset groups where individual market evaluation is not possible or does not reflects thereal value in use of the asset or asset group, the comparative basis for impairment <strong>and</strong> reversal purposes will bedetermined by cash flow calculation based on profit-generating ability. The <strong>Company</strong> has created the assetgroups in its Accounting policy for determining the profit generating ability.Impairment based on market valuation will be reversed if the reasons for impairment do not exist any more or existonly in part. The <strong>Company</strong> will account for reversals only in connection with the end-of-year valuation of assets.In the Accounting policy, the significant amounts of impairment <strong>and</strong> reversal purposes were separatelydetermined for each asset group.3.4.4. Rules for provisions<strong>MOL</strong> Plc recognises provisions for contingent liabilities against profit before taxation.25
<strong>MOL</strong> <strong>Hungarian</strong> <strong>Oil</strong> <strong>and</strong> <strong>Gas</strong> <strong>Public</strong> <strong>Limited</strong> <strong>Company</strong>Supplementary Notes for the year ending on 31 December 2009Provisions for contingent liabilitiesThe <strong>Company</strong> makes provisions for liabilities that may be expected due to severance payment <strong>and</strong> earlyretirement in case that it has an accepted plan for redundancies applicable to the coming years, which iselaborated in detail <strong>and</strong> has a significant financial impact furthermore if decisions related to redundancy aredocumented in details.<strong>MOL</strong> Plc makes provisions for retirement bonuses granted to employees. The amount of provision is determinedconsidering actuarial calculation <strong>and</strong> specific financial assumptions.<strong>MOL</strong> Plc recognises provision to cover liabilities from loyalty bonus of employees who work for the <strong>Company</strong> for along time.Provision is recognised for guarantees <strong>and</strong> securities granted by the <strong>Company</strong> if there is a probability of morethan 50 % that a part or all of the guarantee or security amounts will be drawn. When determining this probability,it takes into account the financial <strong>and</strong> liquidity position of the company benefiting from the guarantee or surety, itswillingness to pay in the normal course of business with <strong>MOL</strong> Plc as well as any information obtained about itsoperation. The amount of provision is determined based on the possible draw downs weighted by probabilities.The <strong>Company</strong> makes provisions to cover liabilities arisen from wholesale customer complaints if the amount issignificant <strong>and</strong> if it is probable at the time of the balance sheet preparation that the quantity <strong>and</strong> quality ofcustomer’s complaint will be accepted, recognised by the <strong>Company</strong>.The <strong>Company</strong> recognises provisions against profit before tax or tangible assets for future liabilities related toenvironmental protection <strong>and</strong> future liabilities on ab<strong>and</strong>oning production on hydrocarbon production fields(provisions for field ab<strong>and</strong>onment). The amount of the provision is the discounted present value of the futureliabilities expected to be incurred.If the environmental damages relate to the production process the provision is recognised against profit beforetaxation. If the liability relates directly to the future removal of the assets, restoration of the original conditions, theprovision is capitalised in the value of related oil <strong>and</strong> gas producing assets taking into consideration the expectedreturn on future production process pursuant to the accounting principle of comparability.<strong>Company</strong> capitalises in the value of Property, Plant <strong>and</strong> Equipment (according to the regulations stipulated insections 3.4.6) that amount of provision which is expected to incur in relation with the damage caused by theconstruction <strong>and</strong> removal of oil <strong>and</strong> gas producing assets as the mining activity is ceased according to the MiningAct.Provision is recognized when actual emission rights received free of charge, owned by the <strong>Company</strong> exceed theemission of the <strong>Company</strong>. The amount of provision is assessed based on not covered emission <strong>and</strong> market priceat balance sheet date.Provision is recognised for liabilities expected to arise in connection with ongoing litigations, for the expectedamount (based on a proportion determined subject to the litigation value <strong>and</strong> the expected outcome of thelitigation) if at the time of preparing the balance sheet, it is probable that the <strong>Company</strong> will incur a financial liabilityon closing the legal dispute.The <strong>Company</strong> recognises provisions for the value of unused points in the point-collection schemes operated withother companies (Regular Customer <strong>and</strong> Multipoint).The <strong>Company</strong> review provisions, recognised based on all above title during the balance sheet preparationprocess <strong>and</strong> update values, based on this revision, which is made irrespectively of the amount <strong>and</strong> uses allavailable information.26
<strong>MOL</strong> <strong>Hungarian</strong> <strong>Oil</strong> <strong>and</strong> <strong>Gas</strong> <strong>Public</strong> <strong>Limited</strong> <strong>Company</strong>Supplementary Notes for the year ending on 31 December 20093.4.5. Classification of errors for previous years<strong>MOL</strong> Plc determines the limits of significant errors at HUF 0. This means that it accounts for the effect of all errorsconcerning previous years regardless of its limit <strong>and</strong> positive or negative sign as adjustments of previous years,so they do not affect the profit or loss of current period. The errors identified concerning profit <strong>and</strong> shareholder’sequity of previous years are shown in the middle column of the balance sheet <strong>and</strong> income statement, asadjustment to previous years.The combined extent of an error concerning profit <strong>and</strong> shareholder’s equity substantially influencing the true <strong>and</strong>fair view of the <strong>Company</strong> is the lower of at least 20 % of the shareholders’ equity of the year preceding the currentreporting year or change with correct sign exceeding 2 % of total balance sheet amount of the same year.3.4.6. Application of paragraph (4) of 4. of the Accounting Law in the <strong>Company</strong> financial statements foryear 2009In the course of the preparation of the 2005 annual financial statements, the <strong>Company</strong> departed from § 41. (1) ofthe accounting law based on its allowance described in § 4.(4) to give a true <strong>and</strong> fair view of the equity <strong>and</strong>financial position of <strong>MOL</strong> Plc as at 31 December 2005 <strong>and</strong> of the results of its operations for the year then ended.Consequently, in order to appropriately match the expenditure with the related revenue, provision for fieldab<strong>and</strong>onment in the amount of HUF 50,076 million had been recognised as an increase of property plant <strong>and</strong>equipment, instead of charging the amount directly to income before taxation. This treatment is consistent withthat adopted in the financial statements of the <strong>Company</strong> prepared in accordance with International FinancialReporting St<strong>and</strong>ards.As a result of the departure from the accounting law regarding the field ab<strong>and</strong>onment as at 31 December 2009the property plant <strong>and</strong> equipment is presented with a higher value of HUF 14,339 million. The <strong>Company</strong> made acapital reserve (in the amount of HUF 14,339 million) corresponding to the capitalised field ab<strong>and</strong>onmentprovision included in the net balance of property, plant <strong>and</strong> equipment as of 31 December 2009 in order to coverfuture liabilities from the <strong>Company</strong>’s equity.27
<strong>MOL</strong> <strong>Hungarian</strong> <strong>Oil</strong> <strong>and</strong> <strong>Gas</strong> <strong>Public</strong> <strong>Limited</strong> <strong>Company</strong>Supplementary Notes for the year ending on 31 December 20094. The true <strong>and</strong> fair view of the <strong>Company</strong>’s financial <strong>and</strong> earnings position(The values in the formulas of calculated indicators are shown in HUF million)This chapter presents the <strong>Company</strong>’s asset, financial <strong>and</strong> income position, as well as return <strong>and</strong> performanceindicators, the sales revenue.4.1. Assets4.1.1. Changes in the <strong>Company</strong>’s assetsDescriptionBreakdown (%)2008 2009 2008 2009 Change (%)Non-current assets 1,766,645 1,972,693 68.07 72.04 11.66Current assets 793,591 739,363 30.58 27.00 (6.83)Accruals <strong>and</strong> prepayments 35,079 26,185 1.35 0.96 (25.35)Total 2,595,315 2,738,241 100.00 100.00 5.51The <strong>Company</strong>’s assets increased to a small extent essentially due to the growth in non-current assets.Within the non-current assets the main increase occurred in financial investment (HUF + 230.4 billion) driven bythe change in long-term participation in related parties (HUF + 29.5 billion) <strong>and</strong> in other long-term participation(Pearl acquisition of HUF 54.3 billion, OTP share purchase value of HUF 55.5 billion related to share-exchange).Further growth of HUF 78.4 billion occurred in case of long-term loans given to subsidiaries compared to 2008, ofwhich increase by HUF 34.1 billion in the balance of loans given to subsidiaries of international exploration <strong>and</strong>the given loans to INA of HUF 39.9 billion in 2009 were decisive.The decrease in the current assets moderated the asset increasing effect of long-term investments.The drop in current assets was basically influenced by the fall in cash <strong>and</strong> cash equivalents (HUF (72.3) billion),which was moderated by the impact of receivable rise (HUF + 10.1 billion) compared to the previous year. In thereceivable rise, the excess of option re-evaluation (HUF + 25.9 billion), trade receivables (HUF + 5.7 billion), <strong>and</strong>receivables from related parties (HUF + 38.7 billion, of which the increase of trade receivables from subsidiarieswas HUF 29.7 billion) were the determinants. The increase was considerably moderated by the lower balance ofother receivables generated by the decrease of HUF 68.3 billion in book value of lent treasury shares. Level ofinventory was lower by HUF 11.0 billion compared to the basic year which was essentially driven by the lowerinventory volume.The fall in cash <strong>and</strong> cash equivalents mainly reflects the lower bank deposit in foreign currencies.The change in the accruals <strong>and</strong> prepayments basically reflects the difference in deferred income related to thesubsequent settlement in connection with gas business sale between 2008 <strong>and</strong> 2009. (2008: HUF + 6.4 billion,2009: there wasn’t any deferred income)28
<strong>MOL</strong> <strong>Hungarian</strong> <strong>Oil</strong> <strong>and</strong> <strong>Gas</strong> <strong>Public</strong> <strong>Limited</strong> <strong>Company</strong>Supplementary Notes for the year ending on 31 December 20094.1.2. Capital structureCapital structure of the <strong>Company</strong>Breakdown (%)Description 2008 2009 2008 2009 Change (%)Shareholders’ equity 1,376,897 1,628,365 53.05 59.47 18.26Provisions 123,576 131,802 4.76 4.81 6.66Liabilities 1,052,439 962,191 40.55 35.14 (8.58)Accruals 42,403 15,883 1.64 0.58 (62.54)Total 2,595,315 2,738,241 100.00 100.00 5.51Re-arrangement occurred in the equity <strong>and</strong> liabilities in 2009 besides the increase of 5.51 % on the whole. Theshareholders’ equity went up basically as a result of the net income change from 2008 to 2009. (In 2008 the netincome amounted to HUF (223.0) billion, while in 2009 it was HUF + 253.0 billion) The improvement in netincome was fuelled by the more favourable operating profit compared to the basic year besides the financial profit(against the financial loss realised in the previous year) reflecting the advantageous impact of FX rates.Extraordinary loss in connection with capital decrease (share withdrawal) also contributed to the negative netincome in 2008. The drop in liabilities moderated the effect of shareholders’ equity increase. Within the liabilitiesthe long-term debts decreased to HUF 378.6 billion in 2009 from the value of HUF 512.5 billion in 2008 reflectingthe impact of repayments. At the same time the short-term liabilities went up compared to 2008 as aconsequence of the higher short-term debts (HUF + 18.7 billion), short-term loan from subsidiaries (HUF 16.1billion), VAT (HUF+ 9.6 billion) <strong>and</strong> excise duty (HUF + 4.3 billion). The provision increase basically reflects therise of HUF 4.1 billion in provision for field ab<strong>and</strong>onment <strong>and</strong> field suspended (beyond a year) besides theprovision for green house gas emission (HUF + 4.7 billion).Internal structure of shareholders’ equityBreakdown (%)Description 2008 2009 2008 2009 Change (%)Share capital 104,519 104,519 7.59 6.42 0Share premium 223,866 223,866 16.26 13.75 0Retained earnings 1,140,817 908,910 82.86 55.81 (20.33)Tied-up reserve 130,702 138,054 9.49 8.48 5.63Fair valuation reserve 0 0 0.00 0.00 n.a.Net income (223,007) 253,016 (16.20) 15.54 213.46Total 1,376,897 1,628,365 100.00 100.00 18.26The increase within shareholders’ equity reflects the impact of 2009 net income (see the explanations above forthe details).29
<strong>MOL</strong> <strong>Hungarian</strong> <strong>Oil</strong> <strong>and</strong> <strong>Gas</strong> <strong>Public</strong> <strong>Limited</strong> <strong>Company</strong>Supplementary Notes for the year ending on 31 December 20094.1.3. RevenuesDescription 2008 2009Breakdown (%)2008 2009 Change (%)Net domestic salesrevenuesExport net salesrevenuesTotal net salesrevenues1,750,497 1,501,656 78.74 80.90 (14.22)472,674 354,645 21.26 19.10 (24.97)2,223,171 1,856,301 100.00 100.00 (16.50)The net sales revenue lagged behind the basic year by 16.5 %. The retail <strong>and</strong> wholesale revenue from crude oilproducts <strong>and</strong> related services - which amounted to 87.4 % from the total net sales revenue of <strong>MOL</strong> Plc -decreased by 17.7 % compared to 2008. Domestic net sales revenue of crude oil products (includinghydrocarbon products, LPG <strong>and</strong> purchased hydrocarbon product sales) decreased by 14.1 % compared to thebasic year, mainly driven by the drop in crude oil products’ quoted prices.The fall of 29.0 % in the export net sales revenue of crude oil products was essentially caused by the volumedecrease of 18.8 %, but the lower crude oil products’ quoted prices took also a part in the decrease.The natural gas sales revenue went down by 9.7 %, which was caused by the decrease of sales prices by 8.6 %<strong>and</strong> by the lower level of sales volume by 1.1 % (based on data calculated in GJ).4.1.4. Costs, expenditures compared to revenueDescriptionBreakdown (%)2008 2009 2008 2009Change(%)Net sales revenues total 2,223,171 1,856,301 100.00 100.00 (16.50)Raw material costs 1,044,399 737,351 46.98 39.72 (29.40)Value of services used 97,831 88,151 4.40 4.75 (9.89)Other services 224,168 192,687 10.08 10.38 (14.04)Cost of goods sold 218,229 243,961 9.82 13.14 11.79Value of services sold(intermediated)48,818 36,526 2.20 1.97 (25.18)MATERIAL TYPE EXPENSES 1,633,445 1,298,676 73.47 69.96 (20.49)Payroll expenses 35,089 35,959 1.58 1.94 2.48Other personnel-type expenses 7,474 6,550 0.34 0.35 (12.36)Tax <strong>and</strong> contributions 12,383 12,263 0.56 0.66 (0.97)PERSONNEL TYPE EXPENSES 54,946 54,772 2.47 2.95 (0.32)DEPRECIATION 57,311 57,055 2.58 3.07 (0.45)OTHER OPERATING EXPENSES 445,471 384,263 20.04 20.70 (13.74)TOTAL COSTS AND EXPENSES 2,191,173 1,794,766 98.56 96.69 (18.09)The costs <strong>and</strong> expenditures in proportion to the net sales revenues showed slight decrease of 1.87 %-pointcompared to 2008, although net sales revenue decreased by 16.5 %.30
<strong>MOL</strong> <strong>Hungarian</strong> <strong>Oil</strong> <strong>and</strong> <strong>Gas</strong> <strong>Public</strong> <strong>Limited</strong> <strong>Company</strong>Supplementary Notes for the year ending on 31 December 2009Decrease of material type expenditures (HUF (334.8) billion) was primarily caused by the change of material cost(HUF (307.0) billion) mainly as a result of the lower costs of purchased production materials (basically due to thelower crude oil purchase prices <strong>and</strong> lower other production material cost related to crude prices). The cost ofgoods sold slightly went up by HUF 25.7 billion, mainly as a result of the higher purchase value of crude oil (HUF+ 32.9 billion) <strong>and</strong> green house gas emission rights (HUF + 19.9 billion). The increase was significantlymoderated by the lower purchase value of naphtha (HUF (8.7) billion) <strong>and</strong> gas products (HUF (7.5) billion)compared to the basic period. Further decreasing effect was the drop in value of services used – mainly due tolower cost of railway transport (due to lower transportation volumes), maintenance <strong>and</strong> management cost. Thecost of other services also decreased as a consequence of lower level of mining royalty by HUF 39.1 billioncaused by lower natural gas prices.Personnel type expenditures lagged behind the previous year level to a small extent (by 0.3 %) despite the salaryincrease of 3.7 %. Cost increasing effect of salary rise was significantly moderated by the cost decreasing impactof lower average headcount as a result of cost efficiency measures <strong>and</strong> the cost saving on other personnel- typeexpenses.Changes in amortisation <strong>and</strong> depreciation basically reflected the lower amortisation of the producing wells <strong>and</strong>pipelines related to the economically recoverable hydrocarbon reserves. This drop was moderated by theamortisation increasing effect of the revision on the field ab<strong>and</strong>onment provision capitalisation (HUF 1.8 billion) in2009.Other expenditures were lower by HUF 61.2 billion compared to 2008. The main reason for the decrease was therecorded impairment recorded on the lent treasury shares in 2008 (HUF (84.3) billion). The latter positive effectwas moderated by HUF 10.5 billion higher taxes <strong>and</strong> duties (of which: excise duty liability HUF + 12.5 billion) <strong>and</strong>the change in provision for the future liabilities (HUF + 18.7 billion).4.1.5. Financial indicatorsEquity ratioShareholders’ equityTotal shareholders’ equity <strong>and</strong> liabilities* 1002008 20091,376,897 1,628,365=53.05 %2,595,3152,738,241= 59.47 %The Shareholders’ equity increased to a larger extent than the total shareholders’ equity <strong>and</strong> liability causinggrowth in the indicator value. The shareholders’ equity rise was mainly driven by the net income of 2009. Theimprovement in net income was influenced by the favourable operating <strong>and</strong> financial profit change, besides theextraordinary loss in 2008 due to the extraordinary expenditure in connection with share withdrawal.31
<strong>MOL</strong> <strong>Hungarian</strong> <strong>Oil</strong> <strong>and</strong> <strong>Gas</strong> <strong>Public</strong> <strong>Limited</strong> <strong>Company</strong>Supplementary Notes for the year ending on 31 December 20094.1.6. Current <strong>and</strong> non-current assets ratioCurrent assets + Accruals <strong>and</strong> prepaymentsNon-current assets* 1002008 2009828,670 765,548= 46.91 %1,766,6451,972,693= 38.81 %The change in the indicator value is affected by the fall in current assets <strong>and</strong> the growth in non-current assets.4.2. Financial positionAcid liquidity ratioCash <strong>and</strong> cash equivalents + Receivables + SecuritiesShort-term liabilities + Accrued cost <strong>and</strong> expenses2008 2009668,582 625,338376,165= 1.78388,539= 1.61The liquidity ratio of the <strong>Company</strong> decreased slightly compared to the previous year, but still exceeds the minimallevel (1.0) significantly. The total amount of the cash <strong>and</strong> cash equivalents, receivables <strong>and</strong> securities decreasedby 6.5 % year-on-year as the significant decrease in cash <strong>and</strong> cash equivalents was mostly compensated by theincrease in receivables <strong>and</strong> securities. At the same time the short-term liabilities <strong>and</strong> deferred cost <strong>and</strong> expensesincreased to a smaller extent, by 3.3 %, basically due to higher short-term debt (HUF + 18.7 billion), short-termloan taken from subsidiaries (HUF 16.1 billion) VAT (HUF + 9.6 billion) <strong>and</strong> excise duty (HUF+ 4.3 billion), whilethe other liabilities dropped moderating the rises due to the above mentioned reasons. The increase was slightlydiminished by the decrease of deferred expenses compared to the basic period. (Deferred expenses - accountedin 2008 - related to subsequent settlement in connection with gas business sale was released in 2009.)Debtor’s daysAdjusted average receivable from customers1 day sales revenue2008 2009156,565 141,9066,074= 25.785,086= 27.90Debtor’s days increased slightly over the period, because the decrease of the 1 day sales revenue exceeded thedecrease of the average value of the receivables. Change of sales revenue/day was basically determined by thedecrease of crude oil products’ sales prices, sales volumes <strong>and</strong> natural gas sales prices. The decrease indebtors’ chronological average was influenced by the lower sales prices <strong>and</strong> volumes of crude oil products.32
<strong>MOL</strong> <strong>Hungarian</strong> <strong>Oil</strong> <strong>and</strong> <strong>Gas</strong> <strong>Public</strong> <strong>Limited</strong> <strong>Company</strong>Supplementary Notes for the year ending on 31 December 20094.3. Profitability indicatorsAsset efficiencyProfit before tax + interests <strong>and</strong> interests-type expensesChronological Average of Asset* 1002008 2009(186,315) 292,8342,952,050= (6.31)%2,834,937= 10.33 %The positive value of the indicator was the consequence of the favourable profit before tax of HUF 272.8 billion,while the chronologic average of assets decreased by 4.0 % despite the considerable acquisitions realised in2009 (Pearl acquisition, international exploration projects). The significant result was driven by the morefavourable operating profit compared to the previous year <strong>and</strong> the HUF 84.6 billion financial profit. The latter wasfuelled by the positive foreign exchange impact on profit (option re-evaluation, FX gain on receivables <strong>and</strong>liabilities in foreign currencies), just as the received dividend <strong>and</strong> FX gain on non-current assets <strong>and</strong> shares.4.4. Return <strong>and</strong> performance indicatorsReturn on AssetsProfit after taxTotal assets* 1002008 2009(223,007) 253,0162,595,315= (8.59)%2,738,241= 9.24 %The positive value of the indicator was driven by the higher operating profit <strong>and</strong> more favourable financial resultdue to the above mentioned impacts.ROACE (Return on Average Capital Employed)Operating profit after taxAverage capital employed* 1002008 200981,832 134,105903,526=9.06 %618,976= 21.67 %The considerable improvement of 12.61 % point in the indicator value was basically driven by the 63.9 % growthin operating profit after tax. The main reason for the operating profit rise was the lower cost spending besides thepositive change in own produced inventory. The more favourable change in profit after tax improved the indicatorby 5.8 % point in itself.Further improvement was fuelled by the drop of 31.5 % in average capital employed. The lower average capitalemployed was mainly caused by the decrease in receivables of 2008 year, which was not reflected fully in 2008yearly average capital employed due to the high closing value of 2007. The closing capital employed in 2009 wasstable compared to 2008 (in 2008: HUF 633.2 billion, in 2009: HUF 604.7 billion)33
<strong>MOL</strong> <strong>Hungarian</strong> <strong>Oil</strong> <strong>and</strong> <strong>Gas</strong> <strong>Public</strong> <strong>Limited</strong> <strong>Company</strong>Supplementary Notes for the year ending on 31 December 2009EBITDA (Earnings Before Interest, Taxes, Depreciation <strong>and</strong> Amortization) ratioEBITDANet sales revenue* 1002008 2009159,601 243,3122,223,171=7.18 %1,856,301= 13.11 %EBITDA ratio increased in 2009 as a result of the HUF 83.7 billion (+ 52.5 %) growth in EBITDA, while the netsales revenue was lower by HUF 366.9 billion (16.5 %). The income statement’s figures show that theexpenditure in the ratio of net revenue decreased. Further improving effect was the positive change in ownproduced inventory (HUF + 20.0 billion).IndebtednessLong-term credits <strong>and</strong> loans, liabilities from the issue of bonds + Short-term credits <strong>and</strong> loans -Securities – Cash <strong>and</strong> cash equivalentsLong-term credits <strong>and</strong> loans, liabilities from the issue of bonds + Short-term credits <strong>and</strong> loans -Securities – Cash <strong>and</strong> cash equivalents + Shareholders’ equity* 1002008 2009553,683 512,5221,930,580= 28.68 %2,140,887= 23.94 %Data of the indicator include loans received from related parties.Gearing ratio showed an improvement compared to the last year, in which both the decrease in liabilities <strong>and</strong> theShareholders’ equity increase took a part. The net debts declined by HUF 41.2 billion as a joint effect of the lowerlevel of the long-term credits <strong>and</strong> loans (by HUF 129.3 billion) <strong>and</strong> cash <strong>and</strong> cash equivalents, while theShareholders’ equity was higher by HUF 251.5 billion than in 2008 due to the change in net income.34
<strong>MOL</strong> <strong>Hungarian</strong> <strong>Oil</strong> <strong>and</strong> <strong>Gas</strong> <strong>Public</strong> <strong>Limited</strong> <strong>Company</strong>Supplementary Notes for the year ending on 31 December 20095. Cash Flow StatementHUF millionDescription 2008 2009Profit before taxation (223,007) 272,779Dividend received (65,701) (51,237)Research expenses 8,889 11,494Exchange rate difference (780) 204Fair valuation difference 199,472 (33,351)Profit without cash flow 0 51,846Final (not revocable) asset transfer (236) (195)Treasury share withdrawal 117,243 0Adjusted profit before taxation 35,880 251,540Depreciation <strong>and</strong> impairment 57,923 65,638Write off <strong>and</strong> reversal 238,796 (37,768)Provision recognition <strong>and</strong> release, net 3,597 11,050Gain or loss, realised on sale of non-current assets 42,267 (141)Change of liabilities to suppliers (20,764) (7,164)Change of other short-term liabilities (12,893) (21,025)Change of accruals (1,766) (1,099)Change of trade receivables 31,506 (33,020)Change of current assets (excluding trade receivables <strong>and</strong> cash) 162,566 (92,744)Change of prepayments 51,243 (7,202)Change of reserves 0 (3,097)Corporate tax paid, payable (22,870) (11,451)Dividend paid, payable (84,706) (224)Operating cash flow 480,779 113,293Purchase of non-current assets (64,775) (33,052)Purchase of non-current financial investments (514,393) (94,966)Sale of non-current assets 2,625 455Sale of non-current financial investments, capital withdrawal (27,215) 0Final (not repayable) Cash <strong>and</strong> cash equivalent given (105) (141)Research expenses (8,889) (11,494)Dividend received 65,701 51,237Investment cash flow (547,051) (87,961)Withdrawal of bonds <strong>and</strong> debt securities (2,020) 0Long-term loans received 1,100,176 499,016Non repayable cash received 16 18Repayment of long-term credits <strong>and</strong> loans (900,908) (613,101)Change of short-term credits <strong>and</strong> loans (2,144) 16,473Financing cash flow 195,120 (97,594)Change of cash 128,848 (72,262)35
<strong>MOL</strong> <strong>Hungarian</strong> <strong>Oil</strong> <strong>and</strong> <strong>Gas</strong> <strong>Public</strong> <strong>Limited</strong> <strong>Company</strong>Supplementary Notes for the year ending on 31 December 20096. Intangible assetsGross book valueMovementsCapitalisedresearch <strong>and</strong>developmentcostPropertyrightsIntellectualpropertyGoodwillHUF millionTotal intangibleassetsOpening balance 01.01.2008 744 3,075 39,716 47,466 91,001Increase due to purchases 851 585 3,290 0 4,726Increase due to reclassification 0 338 603 0 941Other increase* 0 0 0 10,454 10,454Decrease due to sales 0 0 (2) 0 (2)Decrease due to scrapping,damages or shortages(5) (26) (1,155) 0 (1,186)Decrease due toreclassification(476) 0 (337) 0 (813)Closing balance 31.12.2008 1,114 3,972 42,115 57,920 105,121Increase due to purchases 852 1,503 1,599 0 3,954Increase due to reclassification 0 74 2,320 0 2,394Other increase 0 4 31 2,759** 2,794Decrease due to sales 0 0 0 0 0Decrease due to scrapping,damages or shortages(13) (17) (1,530) 0 (1,560)Decrease due toreclassification(516) (1,014) (53) 0 (1,583)Other decrease 0 (4) (14) 0 (18)Closing balance 31.12.2009 1,437 4,518 44,468 60,679 111,102* Goodwill recognized due to I&C Energo a.s acquisition <strong>and</strong> goodwill adjustment in connection with the purchaseof Italiana Energia e Servizi S.p.A. (HUF 9,215 million) <strong>and</strong> TIFON d.o.o. (HUF 206 million).** Goodwill recognized at the time when <strong>Company</strong> acquired qualified majority of Roth Heizöle GmbH.36
<strong>MOL</strong> <strong>Hungarian</strong> <strong>Oil</strong> <strong>and</strong> <strong>Gas</strong> <strong>Public</strong> <strong>Limited</strong> <strong>Company</strong>Supplementary Notes for the year ending on 31 December 2009DepreciationMovementsCapitalisedresearch <strong>and</strong>developmentcostPropertyrightsIntellectualpropertyGoodwillHUF millionTotal intangibleassetsOpening balance 01.01.2008 0 1,113 28,050 0 29,163Of which: depreciation 0 1,058 27,728 0 28,786impairment 0 55 322 0 377Increase of depreciation 0 639 3,094 0 3,733Increase of impairment 5 0 35 0 40Other increase 0 0 10 0 10Decrease due to sale 0 0 (2) 0 (2)Decrease due to scrapping,damages or shortages(5) (26) (1,155) 0 (1,186)Closing balance 31.12.2008 0 1,726 30,032 0 31,758Of which: depreciation 0 1,671 29,723 0 31,394impairment 0 55 309 0 364Increase of depreciation 0 722 3,458 0 4,180Increase of impairment basedon market valuation0 0 10 3,612 3,622Increase of impairment 13 1 617 0 631Increase due toreclassification0 34 11 0 45Other increase 0 0 42 0 42Decrease due to scrapping,damages or shortages(13) (17) (1,530) 0 (1,560)Decrease due toreclassification0 (6) (40) 0 (46)Other decrease 0 (1) 0 0 (1)Closing balance 31.12.2009 0 2,459 32,600 3,612 38,671Of which: depreciation 0 2,404 32,281 0 34,685impairment 0 55 319 3,612 3,986Net book value as of 31December 2008Net book value as of 31December 20091,114 2,246 12,083 57,920 73,3631,437 2,059 11,868 57,067 72,43137
<strong>MOL</strong> <strong>Hungarian</strong> <strong>Oil</strong> <strong>and</strong> <strong>Gas</strong> <strong>Public</strong> <strong>Limited</strong> <strong>Company</strong>Supplementary Notes for the year ending on 31 December 20097. Property, plant <strong>and</strong> equipmentGross book valueMovementsL<strong>and</strong> <strong>and</strong>building <strong>and</strong>relatedpropertyrightsPlant,machinery <strong>and</strong>vehiclesOtherequipment,fixtures <strong>and</strong>vehiclesAssets underconstruction<strong>and</strong> relatedadvancesHUF millionTotalproperty,plant <strong>and</strong>equipmentOpening balance 01.01.2008 433,052 339,411 41,235 33,190 846,888Increase due to capitalexpenditure0 0 0 55,521 55,521Capitalisation 17,538 26,675 3,404 (47,617) 0Increase due to reclassification 12,425 1,899 428 0 14,752Other increase 9,571* 12 19 98 9,700Decrease due to sales** (7,055) (310) (105) 0 (7,470)Decrease due to scrapping,damages <strong>and</strong> shortages(506) (5,115) (970) (502) (7,093)Decrease due to contribution inkind or transfers free of charge***(5,689) (1,734) (48) (2,709) (10,180)Decrease due to reclassification (276) (278) (2) (128) (684)Other decrease (62) (12) 0 (209) (283)Closing balance 31.12.2008 458,998 360,548 43,961 37,644 901,151Increase due to capitalexpenditure0 0 0 43,256 43,256Capitalisation 16,409 20,289 1,063 (37,761) 0Increase due to reclassification 20 470 25 0 515Other increase 52 2 8 53 115Decrease due to sales (280) (157) (222) (4) (663)Decrease due to scrapping,damages <strong>and</strong> shortages(659) (5,490) (927) (348) (7,424)Decrease due to contribution inkind or transfers free of charge0 (1) (41) 0 (42)Decrease due to reclassification (564) (35) (17) (1,165) (1,781)Other decrease (3,041)* (1,060) (286) (3,908) (8,295)Closing balance 31.12.2009 470,935 374,566 43,564 37,767 926,832Items marked with * contains field ab<strong>and</strong>onment provision capitalised in the value of mining properties. Pleasesee section 3.4.6. for further details.** The gross book value of l<strong>and</strong>, building <strong>and</strong> machineries sold to MMBF Zrt. was HUF 6,524 million.*** In kind contribution given to FGSZ Földgázszállító Zrt. <strong>and</strong> Dunai Gőzfejlesztő Kft. with the amount of HUF10,135 million.38
<strong>MOL</strong> <strong>Hungarian</strong> <strong>Oil</strong> <strong>and</strong> <strong>Gas</strong> <strong>Public</strong> <strong>Limited</strong> <strong>Company</strong>Supplementary Notes for the year ending on 31 December 2009DepreciationHUF millionMovementsL<strong>and</strong> <strong>and</strong>Other Assets under TotalPlant,building <strong>and</strong>equipment, construction property,machineryrelated propertyfixtures <strong>and</strong> <strong>and</strong> related plant <strong>and</strong><strong>and</strong> vehiclesrightsvehicles advances equipmentOpening balance 01.01.2008 234,603 243,715 32,364 10 510,692Of which: depreciation 219,292 242,507 32,296 0 494,095impairment 15,311 1,208 68 10 16,597Increase of depreciation 24,324 25,660 3,594 0 53,578Increase of impairment based onmarket valuation1,410* 139 3 294 1,846Increase of impairment due toscrapping, damages <strong>and</strong> shortages86 205 16 502 809Increase due to reclassification 8,207 1,874 276 0 10,357Other increase 52 47 15 0 114Reversal of impairment (2,082) 0 0 0 (2,082)Decrease due to sales (5,015) (231) (98) 0 (5,344)Decrease due to scrapping,damages <strong>and</strong> shortages(506) (5,115) (970) (502) (7,093)Decrease due to contributions inkind <strong>and</strong> transfers free of charge**(3,337) (1,694) (48) 0 (5,079)Decrease due to reclassification (132) (267) (1) 0 (400)Other decrease (193) (314) (7) (514)Closing balance 31.12.2008 257,417 264,019 35,144 304 556,884Of which: depreciation 239,369 262,690 35,074 0 537,133impairment 18,048 1,329 70 304 19,751Increase of depreciation 25,785 24,158 2,932 0 52,875Increase of impairment based onmarket valuation4,254* 38 9 0 4,301Reversal of impairment of advancepayment given for assets under0 0 0 (10) (10)constructionIncrease of impairment due toscrapping, damages <strong>and</strong> shortages54 1,174 16 54 1,298Increase due to reclassification 6 85 12 0 103Other increase 519 313 26 0 858Reversal of impairment (1,227)* (41) (1) 0 (1,269)Decrease due to sales (57) (133) (159) 0 (349)Decrease due to scrapping,damages <strong>and</strong> shortages(659) (5,490) (927) (348) (7,424)Decrease due to contributions inkind <strong>and</strong> transfers free of charge0 (1) (41) 0 (42)Decrease due to reclassification (153) (63) (8) 0 (224)Other decrease (38) (726) (239) 0 (1,003)Closing balance 31.12.2009 285,901 283,333 36,764 0 605,998Of which: depreciation 264,847 282,015 36,686 0 583,548impairment 21,054 1,318 78 0 22,45039
<strong>MOL</strong> <strong>Hungarian</strong> <strong>Oil</strong> <strong>and</strong> <strong>Gas</strong> <strong>Public</strong> <strong>Limited</strong> <strong>Company</strong>Supplementary Notes for the year ending on 31 December 2009MovementsNet book value as of 31December 2008Net book value as of 31December 2009L<strong>and</strong> <strong>and</strong>building <strong>and</strong>related propertyrightsPlant,machinery<strong>and</strong> vehiclesOtherequipment,fixtures <strong>and</strong>vehiclesAssets underconstruction<strong>and</strong> relatedadvancesTotalproperty,plant <strong>and</strong>equipment201,581 96,529 8,817 37,340 344,267185,034 91,233 6,800 37,767 320,834Items marked with * contains impairment of field ab<strong>and</strong>onment provision capitalised in the value of miningproperties, or rather the reverse of previous years’ impairment. Please see section 3.4.6 for further details.** Derecognized depreciation of assets given as in kind contribution to FGSZ Földgázszállító Zrt. <strong>and</strong> DunaiGőzfejlesztő Kft. was HUF 5,040 million.8. DepreciationDepreciationHUF millionDescriptionStraight-line Unit of production Lump sum Total amount2008 2009 2008 2009 2008 2009 2008 2009Capitalised research <strong>and</strong>development costs0 0 0 0 0 0 0 0Property rights 631 703 0 0 8 19 639 722Intellectual property 3,093 3,457 0 0 1 1 3,094 3,458Intangible assets 3,724 4,160 0 0 9 20 3,733 4,180L<strong>and</strong> <strong>and</strong> building <strong>and</strong>related property rights10,818 11,448 13,506 14,337 0 0 24,324 25,785Plant, machinery <strong>and</strong>vehicles23,441 21,850 2,212 2,299 7 9 25,660 24,158Other equipment, fixtures<strong>and</strong> vehicles3,273 2,798 0 0 321 134 3,594 2,932Property, plant <strong>and</strong>equipment37,532 36,096 15,718 16,636 328 143 53,578 52,875Total 41,256 40,256 15,718 16,636 337 163 57,311 57,05540
<strong>MOL</strong> <strong>Hungarian</strong> <strong>Oil</strong> <strong>and</strong> <strong>Gas</strong> <strong>Public</strong> <strong>Limited</strong> <strong>Company</strong>Supplementary Notes for the year ending on 31 December 2009Extraordinary depreciation, impairment <strong>and</strong> reversalDescriptionCapitalised research <strong>and</strong>development costsImpairment basedon market valuationImpairment due toscrapping,damages <strong>and</strong>shortagesReversal ofimpairmentHUF millionTotal2008 2009 2008 2009 2008 2009 2008 20090 0 5 13 0 0 5 13Property rights 0 0 0 1 0 0 0 1Intellectual property 0 10 35 617 0 0 35 627Goodwill 0 3,612 0 0 0 0 0 3,612Intangible assets 0 3,622 40 631 0 0 40 4,253L<strong>and</strong> <strong>and</strong> building <strong>and</strong>related property rightsPlant, machinery <strong>and</strong>vehiclesOther equipment, fixtures<strong>and</strong> vehicles1,410 4,254 86 54 2,082 1,227 (586) 3,081139 38 205 1,174 0 41 344 1,1713 9 16 16 0 1 19 24Assets under construction 294 0 502 54 0 0 796 54Property, plant <strong>and</strong>equipment1,846 4,301 809 1,298 2,082 1,269 573 4,330Total 1,846 7,923 849 1,929 2,082 1,269 613 8,5839. Revision of estimated useful life of intangible assets <strong>and</strong> property, plant <strong>and</strong> equipmentDescriptionGross bookvalueDepreciation of 2009WithoutrevisionAs a result of therevisionProfit <strong>and</strong> losseffectHUF millionEffect on noncurrentassets’valueIntellectual property 16,150 1,046 772 274 274Intangible assets 16,150 1,046 772 274 274L<strong>and</strong> <strong>and</strong> building <strong>and</strong>related property rights4,122 225 178 47 47Plant, machinery <strong>and</strong>vehicles10,808 806 712 94 94Other equipment, fixtures<strong>and</strong> vehicles511 43 27 16 16Property, plant <strong>and</strong>equipment15,441 1,074 917 157 157Total 31,591 2,120 1,689 431 431(Please see: Depreciation policy, Section 3.4.3., remarks about the annual review of economic useful life.)41
<strong>MOL</strong> <strong>Hungarian</strong> <strong>Oil</strong> <strong>and</strong> <strong>Gas</strong> <strong>Public</strong> <strong>Limited</strong> <strong>Company</strong>Supplementary Notes for the year ending on 31 December 200910. Property, plant <strong>and</strong> equipment used for environmental protectionGross book valueMovementsL<strong>and</strong> <strong>and</strong>building <strong>and</strong>relatedpropertyrightsPlant,machinery<strong>and</strong> vehiclesOtherequipment,fixtures <strong>and</strong>vehiclesAssetsunderconstruction<strong>and</strong> relatedadvancesHUF millionTotalproperty,plant <strong>and</strong>equipmentOpening balance 01.01.2008 16,563 4,013 985 1,460 23,021Increase due to capital expenditure 0 0 0 760 760Capitalisation 488 728 0 (1,216) 0Increase due to reclassification 6 17 0 282 305Decrease due to scrapping, damages<strong>and</strong> shortages(28) (17) 0 0 (45)Decrease due to reclassification 0 0 0 (713) (713)Closing balance 31.12.2008 17,029 4,741 985 573 23,328Increase due to capital expenditure 0 0 0 448 448Capitalisation 346 49 9 (404) 0Increase due to reclassification 206 50 26 166 448Decrease due to scrapping, damages<strong>and</strong> shortages0 (55) 0 (298) (353)Decrease due to reclassification 0 0 0 (302) (302)Other decrease 0 0 0 (1) (1)Closing balance 31.12.2009 17,581 4,785 1,020 182 23,568DepreciationMovementsL<strong>and</strong> <strong>and</strong>building <strong>and</strong>relatedpropertyrightsPlant,machinery <strong>and</strong>vehiclesOtherequipment,fixtures <strong>and</strong>vehiclesAssets underconstruction<strong>and</strong> relatedadvancesHUF millionTotalproperty,plant <strong>and</strong>equipmentOpening balance 01.01.2008 5,612 2,458 763 0 8,833Increase of depreciation 851 445 55 0 1,351Increase of impairment based onmarket valuationIncrease of impairment due toscrapping, damages <strong>and</strong>shortages0 0 0 294 29411 0 0 0 11Increase due to reclassification 0 3 0 0 3Decrease due to scrapping,damages <strong>and</strong> shortages(28) (17) 0 0 (45)Decrease due to reclassification (10) (4) 0 0 (14)Closing balance 31.12.2008 6,436 2,885 818 294 10,433Increase of depreciation 888 479 48 0 1,415Increase of impairment due toscrapping, damages <strong>and</strong>shortages0 1 0 4 542
<strong>MOL</strong> <strong>Hungarian</strong> <strong>Oil</strong> <strong>and</strong> <strong>Gas</strong> <strong>Public</strong> <strong>Limited</strong> <strong>Company</strong>Supplementary Notes for the year ending on 31 December 2009Increase due to reclassification 72 4 26 0 102Decrease due to scrapping,damages <strong>and</strong> shortages0 (55) 0 (298) (353)Closing balance 31.12.2009 7,396 3,314 892 0 11,602Net book value as of 31December 2008Net book value as of 31December 200910,593 1,856 167 279 12,89510,185 1,471 128 182 11,96611. Research <strong>and</strong> developmentResearch <strong>and</strong>development areasExpenditurein currentyear2008 2009Of the expenditurecapitalisedaccountedas costExpenditurein currentyearHUF millionOf the expenditurecapitalisedaccountedas costDomestic HC exploration 7,259 0 7,259 10,347 0 10,347Foreign HC exploration 1,123 0 1,123 465 0 465Technology <strong>and</strong> assetdevelopment1,017 797 220 1,150 750 400Product development 270 10 260 218 17 201Environmental protection 27 6 21 77 32 45Other (studies) 44 38 6 89 53 36Total 9,740 851 8,889 12,346 852 11,49443
<strong>MOL</strong> <strong>Hungarian</strong> <strong>Oil</strong> <strong>and</strong> <strong>Gas</strong> <strong>Public</strong> <strong>Limited</strong> <strong>Company</strong>Supplementary Notes for the year ending on 31 December 200912. Hazardous waste (not audited)EWCcategoryTitle of hazardous waste groupAdjustedopeningquantity*Increasein currentyearDecreasein currentyearRounded to tonsClosingquantity01 05 Drilling muds <strong>and</strong> other drilling wastes 0 108 108 005 01Wastes from petroleum refining (sludge, acidtars, bitumen, coke, sulphur containing wastes854 1,333 2,187 0from petroleum desulphurisation)06 04 Metal-containing wastes 0 220 0 22006 05 Sludge from on-site effluent treatment 0 219 219 006 06Wastes from the MFSU of sulphur chemicals,sulphur chemical processes <strong>and</strong> desulphurisation0 3 3 0processes06 13Wastes from inorganic chemical processes nototherwise specified0 11 11 007 01Wastes from the manufacture, formulation,supply <strong>and</strong> use (MFSU) of basic organic0 75 75 0chemicals07 02Wastes from the MFSU of plastics, syntheticrubber <strong>and</strong> man-made fibres0 2 2 007 06Wastes from the MFSU of fats, grease, soaps,detergents, disinfectants <strong>and</strong> cosmetics0 1 1 007 07Wastes from the MFSU of fine chemicals <strong>and</strong>chemical products not otherwise specified0 191 191 008 01Wastes from MFSU <strong>and</strong> removal of paint <strong>and</strong>varnish0 1 1 008 03 Wastes from MFSU of printing inks 0 4 4 010 01Wastes from power stations <strong>and</strong> othercombustion plants (except 19)0 4 4 010 10 Wastes from casting of non-ferrous pieces 0 5 5 013 02 Waste engine, gear <strong>and</strong> lubricating oils 2,738 7,638 6,701 3,67513 03 Waste insulating <strong>and</strong> heat transmission oils 3,614 417 326 3,70513 05 <strong>Oil</strong>/water separator contents 598 10,769 8,290 3,07713 07 Wastes of liquid fuels 9 107 109 713 08 <strong>Oil</strong> wastes not otherwise specified 0 493 493 015 01 Packaging waste 10 92 90 1215 02Absorbents, filter materials, wiping cloths <strong>and</strong>protective clothing54 131 130 5516 01End-of-life vehicles from different means oftransport wastes from dismantling of end-of-life0 5 5 0vehicles <strong>and</strong> vehicle maintenance16 02 Wastes from electrical <strong>and</strong> electronic equipment 0 5 4 116 03 Off-specification batches <strong>and</strong> unused products 0 15 15 016 05<strong>Gas</strong>es in pressure containers <strong>and</strong> discardedchemicals0 84 84 016 06 Batteries <strong>and</strong> accumulators 0 2 2 016 07Wastes from transport tank, storage tank <strong>and</strong>barrel cleaning4 4,627 4,627 416 08 Spent catalysts 54 1,028 1,028 5444
EWCcategory<strong>MOL</strong> <strong>Hungarian</strong> <strong>Oil</strong> <strong>and</strong> <strong>Gas</strong> <strong>Public</strong> <strong>Limited</strong> <strong>Company</strong>Supplementary Notes for the year ending on 31 December 2009Title of hazardous waste groupAdjustedopeningquantity*Increasein currentyearDecreasein currentyearClosingquantity16 10Aqueous liquid wastes destined for off-sitetreatment0 4,293 4,293 016 11 Waste linings <strong>and</strong> refractories 28 0 0 2817 01 Concrete, bricks, tiles <strong>and</strong> ceramics 700 1,611 2,081 23017 02 Wood, glass <strong>and</strong> plastic 0 3 3 017 04 Metals (including their alloys) 0 157 153 417 05Soil (including excavated soil from contaminatedsites), stones <strong>and</strong> dredging spoil0 23,582 23,582 017 06Insulation materials <strong>and</strong> asbestos-containingconstruction materials3 247 246 417 09 Other construction <strong>and</strong> demolition waste 0 18 14 418 01Wastes from natal care, diagnosis, treatment orprevention of disease in humans0 1 1 019 01 Wastes from incineration or pyrolysis of waste 288 1,808 1,419 67719 08 Wastes from waste water treatment plants 0 1,924 1,921 319 13 Wastes from soil <strong>and</strong> groundwater remediation 0 12 12 020 01Separately collected fractions (batteries,accumulators, discarded electronic <strong>and</strong> electricalequipment)0 33 33 0* Adjusted opening quantities are corresponding with the quantities presented to the environment protectionauthority as opening amount.The classification of hazardous waste <strong>and</strong> assignment of individual waste types <strong>and</strong> categories to codes areregulated in compliance with EU norms. There is no record keeping in amount in connection with the quantity ofhazardous waste materials.45
<strong>MOL</strong> <strong>Hungarian</strong> <strong>Oil</strong> <strong>and</strong> <strong>Gas</strong> <strong>Public</strong> <strong>Limited</strong> <strong>Company</strong>Supplementary Notes for the year ending on 31 December 200913. Investments13.1. <strong>MOL</strong> Plc’s subsidiaries, classified as long-term investments2008 2009HUF millionID Name of the <strong>Company</strong> Share%GrossbookvalueAccumulatedimpairment<strong>and</strong> reversalNet bookvalueShare%AccumulatedGrossimpairmentbook value<strong>and</strong> reversalNet bookvalue1.INA d.d.*Zagreb, Avenija Veceslava - - - - 47.16 356,390 0 356,390Holjevca 10.2.Slovnaft a.s.Bratislava, Vlčie hrdlo 1.98.41 321,312 0 321,312 98.41 328,632 0 328,6323.TVK Nyrt.Tiszaújváros, Gyári út 86.79 120,263 0 120,263 86.79 120,263 0 120,263Ipartelep4.Italiana Energia e ServiziS.p.A.100.00 84,116 0 84,116 100.00 86,060 0 86,060Genova, Via di Sottoripa 1/A5.FGSZ Földgázszállító Zrt.Siófok, Tanácsház u. 5.100.00 83,589 0 83,589 100.00 83,589 0 83,5896.<strong>MOL</strong> Romania PP Srl.100.00Bucuresti, I.4.th Champineu s.25,422 0 25,422 100.00 24,587 0 24,5877.MMBF Zrt.Budapest, Budafoki út 79.72.46 18,608 0 18,608 72.46 18,608 0 18,6088.TIFON d.o.o.Zagreb, Marticeva 75.100.00 3,718 0 3,718 100.00 11,086 0 11,0869.I&C Energo a.s.Trebic, Prazská 684/4999.00 6,592 0 6,592 99.00 6,791 0 6,79110.Roth Heizöle GmbH.**Graz, Hötzendorf str.160.74.99 5,958 0 5,958 99.80 6,310 0 6,31011.USI Ltd.Nicosia, Florinis st. 11.100.00 3,530 0 3,530 100.00 5,491 0 5,49112.Kalegran Ltd.Nicosia, Florinis st. 11.99.99 6,429 2,794 3,635 99.99 9,215 3,937 5,27813.ENERGOPETROL d.d. ***Sarajevo, Marsala Tita Street - - - - 33.50 4,928 0 4,9283614.<strong>MOL</strong> Slovenija d.o.o.100.00Murska Sobota, Lendavska 5.4,362 5 4,357 100.00 4,461 5 4,456Petrolszolg Kft.15. Százhalombatta, Olajmunkás 100.00 5,126 1,646 3,480 100.00 5,126 1,997 3,129út 2.16.<strong>MOL</strong>-LUB Kft.Almásfűzítő, Fő út 21.100.00 2,603 0 2,603 100.00 2,603 0 2,60317.<strong>MOL</strong> CIS Ltd.Nicosia, Florinis st. 11.99.99 1,702 0 1,702 99.99 1,925 0 1,92518.Geofizikai Szolgáltató Kft.Budapest, Szántóföld u. 7-9.100.00 1,890 0 1,890 100.00 1,890 0 1,89019.<strong>MOL</strong>TRADE-MineralimpexZrt.100.00 840 0 840 100.00 1,340 0 1,340Budapest, Benczúr u. 13.20.Terméktároló Zrt.Budapest, Andor u. 47-49.74.07 1,200 0 1,200 74.07 1,200 0 1,20021. Geoinform Kft. 100.00 1,125 0 1,125 100.00 1,125 0 1,12546
<strong>MOL</strong> <strong>Hungarian</strong> <strong>Oil</strong> <strong>and</strong> <strong>Gas</strong> <strong>Public</strong> <strong>Limited</strong> <strong>Company</strong>Supplementary Notes for the year ending on 31 December 20092008 2009ID Name of the <strong>Company</strong> Share%GrossbookvalueAccumulatedimpairment<strong>and</strong> reversalNet bookvalueShare%AccumulatedGrossimpairmentbook value<strong>and</strong> reversalNet bookvalue22.23.24.25.26.27.28.29.30.31.32.33.34.35.36.37.38.39.40.Szolnok, Kőrösi út 43.Intermol d.o.o.Beograd, Hadzi Milentijeva33.<strong>MOL</strong> Trans Kft.Budapest, Petróleumkikötő u.5-7.<strong>MOL</strong> Pakistan Ltd.Amsterdam, Herengracht.548.FER Tűzoltóság ésSzolgáltató Kft.Százhalombatta, Olajmunkásu. 2.<strong>MOL</strong> Austria GmbH.Vienna, Gartenbaupromenad.2.<strong>MOL</strong>-RUSS OOO115054 Moscow,Kosmodamianskaya nab., d.52. str. 3.MK Mineralkontor GmbH.München, Otto Strasse 5.<strong>MOL</strong> Reinsurance Ltd.Nicosia, A. Makarias III.Avenue<strong>MOL</strong> Commodity TradingKft.****Budapest, Októberhuszonharmadika u. 18.BHM <strong>Oil</strong> Invest Ltd. (Qatar)Nicosia, Florinis st. 11.HEXAN KFTSzázhalombatta, Ipartelephrsz: 2704/1Tadmor Ltd. (<strong>MOL</strong> North-Africa Ltd.)Sliema, Bisazza Street,Regent House 52.100.00 14,898 3,712 11,186 100.00 15,921 15,251 670100.00 619 0 619 100.00 619 0 619100.00 487 0 487 100.00 487 0 48782.00 343 0 343 82.00 343 0 343100.00 149 0 149 100.00 152 0 152100.00 125 0 125 100.00 121 0 121100.00 226 112 114 100.00 230 113 11799.00 84 0 84 99.00 84 0 84- - - - 100.00 50 0 5099.99 83 11 72 99.99 42 11 31100.00 25 0 25 100.00 25 0 25100.00 24 0 24 100.00 24 0 24Alfagas Kft.Záhony, Vasút u. 2.60.00 186 163 23 60.00 186 163 23Bravoum Investments Ltd.Nicosia, Florinis st. 11.99.99 5 0 5 99.99 9 0 9Hermész Mérnöki Kft.Szolnok, Ady Endre út 26.98.18 5 0 5 98.18 5 0 5Ménrót Kft.Szolnok, Ady Endre út 26.98.18 5 0 5 98.18 5 0 5MH <strong>Oil</strong> <strong>and</strong> <strong>Gas</strong> B.V.100.00Amsterdam, Herengracht 548.5 0 5 100.00 5 0 5MK <strong>Oil</strong> <strong>and</strong> <strong>Gas</strong> B.V.100.00Amsterdam, Herengracht 548.5 0 5 100.00 5 0 5<strong>MOL</strong> Yemen Ltd.Nicosia, Florinis st. 11.99.99 20,685 20,685 0 99.99 20,860 20,860 047
<strong>MOL</strong> <strong>Hungarian</strong> <strong>Oil</strong> <strong>and</strong> <strong>Gas</strong> <strong>Public</strong> <strong>Limited</strong> <strong>Company</strong>Supplementary Notes for the year ending on 31 December 20092008 2009ID Name of the <strong>Company</strong> Share%GrossbookvalueAccumulatedimpairment<strong>and</strong> reversalNet bookvalueShare%AccumulatedGrossimpairmentbook value<strong>and</strong> reversalNet bookvalue41.42.43.44.45.46.47.48.49.50.51.52.53.54.55.56.57.<strong>MOL</strong> Central Asia B.V. (<strong>MOL</strong>Syria Ltd.)Amsterdam, P.O. box 990.SHM Seven Investments Ltd.Nicosia, Florinis st. 11.Lamorak Enterprises Ltd.Nicosia, Florinis st. 11.Greentrade Ltd.Nicosia, Florinis st. 11.Hawasina GmbH.Zug, Bahnhofstr. 21.<strong>MOL</strong> Agram d.o.o.*****Zagreb, Boskovicava 23/a. II.UBA Services Ltd.Nicosia, Florinis st. 11.<strong>MOL</strong> Caspian Ltd.Nicosia, Florinis st. 11.Platounko Investments Ltd.Nicosia, Florinis st. 11.E.M.S. Management ServicesLtd.Nicosia, Dervis-Flo.st.C.Th.6.Pyrogol Ltd.Nicosia, Florinis st. 11.Pronodar Ltd.Nicosia, Florinis st. 11.BMN Investment Ltd.Nicosia, Florinis st. 11.RUSI Services Ltd.Nicosia, Florinis st. 11.<strong>MOL</strong> Libya Ltd. *****Sliema, Bisazza Street,Regent House 52.Dunai Gőzfejlesztő Kft.*******Százhalombatta, Olajmunkásút 2.<strong>MOL</strong> EnergiakereskedőKft.********Budapest, Októberhuszonharmadika u. 18.100.00 5,084 5,084 0 100.00 5,084 5,084 099.99 3,157 3,157 0 99.99 3,611 3,611 099.99 2,549 2,549 0 99.99 2,549 2,549 0100.00 1 0 1 100.00 1,874 1,874 0100.00 1,483 1,483 0 100.00 1,482 1,482 0100.00 1,141 1,141 0 100.00 1,141 1,141 099.99 383 383 0 99.99 390 390 099.99 12 12 0 99.99 24 24 099.99 9 0 9 99.99 24 24 099.99 15 0 15 99.99 15 15 099.99 8 8 0 99.99 8 8 099.99 8 8 0 99.99 8 8 0100.00 7 7 0 100.00 7 7 099.99 0 0 0 99.99 0 0 0- - - - 99.99 0 0 0100.00 2,604 0 2,604 - - - -100.00 50 0 50 - - - -Total 752,855 42,960 709,895 1,137,010 58,554 1,078,456The equity participation <strong>and</strong> voting rights are the same in all companies contained in the table except Alfagas Zrt.,where the 60 % equity participation provides 50 % voting rights to <strong>MOL</strong> Plc, TVK Plc, where 86.79 % directparticipation in the <strong>Company</strong> provides 94.85 % votes due to 8.02 % equity participation of Slovnaft a.s., as well as<strong>MOL</strong> Reinsurance Ltd, where the 99 % direct equity participation of the <strong>Company</strong> provides 100 % votes based onthe 1 % participation of SHM Seven Ltd.* In line with the Amendment to the Shareholders’ Agreement signed on 30 January 2009 <strong>MOL</strong> took the controlover the operation of INA as a result of the changes in the corporate governance of the company. As aconsequence, the full consolidation of INA into <strong>MOL</strong>’s financial statements commences as of 30 June 2009. INAwas presented within associated companies in 2008.48
<strong>MOL</strong> <strong>Hungarian</strong> <strong>Oil</strong> <strong>and</strong> <strong>Gas</strong> <strong>Public</strong> <strong>Limited</strong> <strong>Company</strong>Supplementary Notes for the year ending on 31 December 2009** On 20 July 2009 <strong>MOL</strong> Plc <strong>and</strong> Slovnaft a.s. bought 24.81 % <strong>and</strong> 0.2 % participation in Roth Heizöle GmbH,exercising the call option stipulated in the agreement concluded in 2004. As a result of the deal equityparticipation of <strong>MOL</strong> increased to 99.8 % <strong>and</strong> Slovnaft has 0.2 % participation.*** ENERGOPETROL d.d. was presented within the associated companies in 2008. The indirect ownership of<strong>MOL</strong> is 67 % passing through his subsidiary INA d.d.**** <strong>MOL</strong> Plc established a new company with core activity as non-classified other financial intermediation,electricity trade, wholesale trade of fuel <strong>and</strong> gas trade. The company was registered on 11 May 2009.***** <strong>MOL</strong> Agram d.o.o. is under liquidation.****** <strong>MOL</strong> Libya Ltd has been taken over free of charge from Tadmor Ltd; the 100 % owned subsidiary of <strong>MOL</strong>.Core activity of <strong>MOL</strong> Libya is production <strong>and</strong> trade of gaseous <strong>and</strong> liquid hydrocarbon <strong>and</strong> other minerals.******* On 31 March 2009 <strong>MOL</strong> Plc transferred his 100 % participation in Dunai Gőzfejlesztő Kft. to CM EuropeanPower International BV, as in kind contribution.******** On 31 October 2009 <strong>MOL</strong> Energiakereskedő Kft. was closed with transformation. The successorcompany, <strong>MOL</strong> Energiakereskedő Zrt. is disclosed within associated companies (in section 13.3.) concerning 31December 2009.Long-term investments not fully consolidated: <strong>MOL</strong> Agram d.o.o., Alfagas Kft., Ménrót Kft., Hexán Kft., MH <strong>Oil</strong><strong>and</strong> <strong>Gas</strong> BV., MK <strong>Oil</strong> <strong>and</strong> <strong>Gas</strong> BV., Bravoum Investments Ltd, <strong>MOL</strong> Libya Ltd, Tadmor Ltd, <strong>MOL</strong> CommodityTrading Kft.Core activities of subsidiaries: 1. INA d.d.: oil <strong>and</strong> gas production, exploration, import <strong>and</strong> sale of natural gas,retail trade of petroleum fractions <strong>and</strong> other product, crude oil <strong>and</strong> crude oil product trade, 2. Slovnaft a.s.: crudeoil refining, crude oil <strong>and</strong> natural gas transportation, storage, retail <strong>and</strong> wholesale, 3. TVK Plc: petrochemical, 4.Italiana Energia e Servizi S.p.A.: crude oil refining, wholesale <strong>and</strong> retail trade, 5. FGSZ Földgázszállító Zrt.:natural gas transmission, 6. <strong>MOL</strong> Romania PP Srl.: fuel <strong>and</strong> lubricant retail, 7. MMBF Zrt.: natural gas storage,transportation, crude oil <strong>and</strong> natural gas production, 8. TIFON d.o.o.: retail <strong>and</strong> wholesale on retail stations, 9 I&CEnergo a.s.: control system <strong>and</strong> industrial management design, implementation <strong>and</strong> maintenance, systemintegration <strong>and</strong> engineering consultancy, 10. Roth Heizöle GmbH.: trading of oil products, 11. USI Ltd: exploration<strong>and</strong> production of oil <strong>and</strong> natural gas, 12. Kalegran Ltd: crude oil <strong>and</strong> natural gas production <strong>and</strong> exploration, 13.ENERGOPETROL d.d.: retail, 14. <strong>MOL</strong> Slovenija d.o.o.: trade of crude oil products, 15. Petrolszolg Kft.:maintenance services, 16. <strong>MOL</strong>-LUB Kft.: production <strong>and</strong> trade of lubricants, 17. <strong>MOL</strong> CIS Ltd: exploration <strong>and</strong>production of oil <strong>and</strong> natural gas reserves abroad, 18. Geofizikai Szolgáltató Kft.: geophysical surveying <strong>and</strong> dataprocessing, 19. <strong>MOL</strong>TRADE Mineralimpex Zrt.: trade of energy products, 20. Terméktároló Zrt.: storage ofstrategic inventories, 21. Geoinform Kft.: hydrocarbon drilling exploration, geophysical services, 22. Intermold.o.o.: fuel retail, 23. <strong>MOL</strong> Trans Kft.: transportation of crude oil product, 24. <strong>MOL</strong> Pakistan Ltd: exploration <strong>and</strong>production of oil <strong>and</strong> natural gas reserves abroad, 25. FER Tűzoltóság és Szolgáltató Kft.: not categorised otherprofessional, scientific <strong>and</strong> technical activities, 26. <strong>MOL</strong> Austria GmbH.: wholesale of lubricants <strong>and</strong> crude oilfractions, 27. <strong>MOL</strong> RUSS OOO: management services, 28. MK Mineralkontor GmbH.: trade of raw materials <strong>and</strong>crude oil products, 29. <strong>MOL</strong> Reinsurance Ltd: reinsurance, 30. <strong>MOL</strong> Commodity Trading Kft.: non-classified otherfinancial intermediation, electricity trade, wholesale trade of fuel <strong>and</strong> gas trade, 31. BHM <strong>Oil</strong> Invest Ltd: trading ofoil products, 32. HEXAN Kft.: refinery, fabrication of other organic chemical feedstock <strong>and</strong> wrapping, 33. TadmorLtd: exploration of oil <strong>and</strong> natural gas abroad (sleeping company), 34. Alfagas Kft.: export <strong>and</strong> import of crude oil,natural gas <strong>and</strong> chemicals, 35 Bravoum Investment Ltd: crude oil <strong>and</strong> natural gas production <strong>and</strong> exploration, 36.Hermész Mérnöki Kft.: business <strong>and</strong> other management consultation, 37. Ménrót Kft.: natural gas production, 38.MH <strong>Oil</strong> <strong>and</strong> <strong>Gas</strong> BV: exploration, operation is temporarily ab<strong>and</strong>oned, 39. MK <strong>Oil</strong> <strong>and</strong> <strong>Gas</strong> BV.: exploration,operation is temporarily ab<strong>and</strong>oned, 40. <strong>MOL</strong> Yemen Ltd: exploration of oil <strong>and</strong> natural gas reserves abroad, 41.<strong>MOL</strong> Central Asia B.V.: exploration <strong>and</strong> production of oil <strong>and</strong> natural gas reserves abroad, 42. SHM SevenInvestments Ltd: exploration <strong>and</strong> production of oil <strong>and</strong> natural gas reserves abroad, 43. Lamorak Enterprises Ltd:exploration <strong>and</strong> production of oil <strong>and</strong> natural gas reserves abroad, 44. Greentrade Ltd: crude oil <strong>and</strong> naturalproduction <strong>and</strong> exploration, 45. Hawasina GmbH.: exploration <strong>and</strong> production of oil <strong>and</strong> natural gas reservesabroad, 46. <strong>MOL</strong> Agram d.o.o.: trade of crude oil products, 47. UBA Services Ltd: management services, 48.<strong>MOL</strong> Caspian Ltd: crude oil <strong>and</strong> gas exploration <strong>and</strong> production, 49. Platounko Investments Ltd: crude oil <strong>and</strong>49
<strong>MOL</strong> <strong>Hungarian</strong> <strong>Oil</strong> <strong>and</strong> <strong>Gas</strong> <strong>Public</strong> <strong>Limited</strong> <strong>Company</strong>Supplementary Notes for the year ending on 31 December 2009natural gas production <strong>and</strong> exploration, 50. E.M.S Management Services Ltd: management services, 51. PyrogolLtd: crude oil <strong>and</strong> natural gas production <strong>and</strong> exploration, 52. Pronodar Ltd: crude oil <strong>and</strong> natural gas production<strong>and</strong> exploration, 53. BMN Investment Ltd: crude oil <strong>and</strong> natural gas production <strong>and</strong> exploration, 54. RUSIServices Ltd: exploration <strong>and</strong> production of oil <strong>and</strong> natural gas reserves, 55. <strong>MOL</strong> Libya Ltd: production <strong>and</strong> tradeof gaseous <strong>and</strong> liquid hydrocarbon <strong>and</strong> other minerals, 56. Dunai Gőzfejlesztő Kft.: steam <strong>and</strong> hot water supply,electricity production, 57. <strong>MOL</strong> Energiakereskedő Kft.: natural gas wholesale13.2. <strong>MOL</strong> Plc’s joint venture, classified as long-term investmentID Name of company Share%1 CM European PowerInternational B.V.Weena 340,Rotterdam2. CEGE Közép-európaiGeotermikus EnergiaTermelő Zrt.*Budapest, Októberhuszonharmadika u.18.3. SEP <strong>Company</strong> Kft.Budapest, Októberhuszonharmadikau.18.Grossbookvalue2008 2009Accumulatedimpairment<strong>and</strong> reversalHUF million* On 29 January 2009 <strong>MOL</strong> Plc. had increased its stake to 50 % in the geothermal energy company, CEGE Zrt.<strong>MOL</strong> <strong>and</strong> Green Rock Energy International Pty. Ltd. have each acquired one half of Enex hf’s one third interest inCEGE Zrt at the nominal book value, resulting in both <strong>MOL</strong> <strong>and</strong> Green Rock having an equal 50 % interest.NetbookvalueShare%GrossbookvalueAccumulatedimpairment<strong>and</strong> reversalNetbookvalue50.00 1,099 0 1,099 50.00 9,834 0 9,83433.33 2 0 2 50.00 93 0 9350.00 140 87 53 50.00 150 87 63Total 1,241 87 1,154 10,077 87 9,99050
<strong>MOL</strong> <strong>Hungarian</strong> <strong>Oil</strong> <strong>and</strong> <strong>Gas</strong> <strong>Public</strong> <strong>Limited</strong> <strong>Company</strong>Supplementary Notes for the year ending on 31 December 200913.3. <strong>MOL</strong> Plc’s associated companies, classified as long-term investments2008 2009HUF millionID Name of the <strong>Company</strong> Share%GrossbookvalueAccumulatedimpairment<strong>and</strong> reversalNet bookvalueShare%GrossbookvalueAccumulatedimpairment<strong>and</strong> reversalNet bookvalue1.<strong>MOL</strong> Energiakereskedő Zrt. *Budapest, Október- - - - 50.00 866 0 866huszonharmadika u.18.2.NABUCCO <strong>Gas</strong> PipelineInternational GmbH.**Vienna, Floridsdorfer20.00 2 0 2 16.67 536 0 536Hauptstraße 1.3.Rossi Biofuel Zrt.Komárom, Kőolaj u. 2.25.00 350 0 350 25.00 350 0 3504.MESSER-<strong>MOL</strong> GAZ Kft.Budapest, Váci u. 17.25.00 87 1 86 25.00 87 1 865. TOP Finance Kft.Budapest, Batthyány u. 45.26.00 1 0 1 26.00 1 0 16. Tűzoltó Műszaki és Mentő Kft.30.00Tiszaújváros, Tűzoltó u. 1.1 0 1 30.00 1 0 17. INA d.d.***Zagreb, Avenija Veceslava 47.16 344,444 0 344,444 - - - -Holjevca 10.8. ENERGOPETROL d.d. ****Sarajevo, Marsala Tita Street 33.50 4,823 0 4,823 - - - -369. TURBO Team Kft.*****Beregdaróc, 4934.25.00 37 0 37 - - - -Pf.6.Hrsz.0128/2Total 349,745 1 349,744 1,841 1 1,840<strong>MOL</strong> has 25 % plus one voting rights in Rossi Biofuel Zrt. in accordance with the approved co-operationagreement concluded with Rossi Beteiligungs Ltd in 2007. In addition <strong>MOL</strong> has a call option to acquire a further24 % stake. In case of other associated companies voting rights are equal with the ownership participation.* Please see section 13.1. for further details.<strong>MOL</strong> Energiakereskedő Zrt. was transformed from <strong>MOL</strong> Energiakereskedő Kft. on 31 October 2009 <strong>and</strong> 50 % ofwhich was sold by <strong>MOL</strong> on 18 December 2009.** <strong>MOL</strong> share has been increased to 16.67 percent due to involvement of a new partner (RWE Supply & TradingGmbH).*** Please see section 13.1. for further details.**** ENERGOPETROL d.d. was reclassified into the subsidiaries.***** <strong>MOL</strong> concluded a contract for the sale of TURBO Team Kft.; therefore the participation was reclassified intoinvestment for sale.51
<strong>MOL</strong> <strong>Hungarian</strong> <strong>Oil</strong> <strong>and</strong> <strong>Gas</strong> <strong>Public</strong> <strong>Limited</strong> <strong>Company</strong>Supplementary Notes for the year ending on 31 December 200913.4. Shareholders’ equity of <strong>MOL</strong> Plc’s subsidiaries <strong>and</strong> certain key investmentsUnaudited data for informational purposesHUF millionIDName of the <strong>Company</strong>Shareholders’equityShare capitalReservesNet income for2009Subsidiaries1. INA d.d.* 437,848 334,170 116,357 (12,679)2. Slovnaft a.s.* 388,282 185,460 218,117 (15,295)3. TVK Nyrt. 137,387 24,534 122,045 (9,192)4. FGSZ Földgázszállító Zrt. 133,937 18,823 95,744 19,3705. <strong>MOL</strong> Romania PP Srl. 38,267 15,483 18,070 4,7146. Italiana Energia e Servizi S.p.A.* 33,734 6,771 32,157 (5,194)7. MMBF Zrt. 20,090 22,395 (6,938) 4,6338. <strong>MOL</strong> CIS Ltd 19,008 22 9,659 9,3279. <strong>MOL</strong> Yemen Ltd 18,987 555 18,355 7710. Intermol d.o.o. 10,742 15,093 (3,134) (1,217)11. Kalegran Ltd 10,001 11 10,001 (11)12. <strong>MOL</strong> Central Asia B.V. 6,032 1,847 4,192 (7)13. TIFON d.o.o. 5,579 7,528 (1,497) (452)14. <strong>MOL</strong> Reinsurance Ltd 4,889 432 4,050 40715. <strong>MOL</strong> Slovenija d.o.o. 4,740 4,457 7 27616. Petrolszolg Kft. 4,231 989 2,586 65617. I&C Energo a.s. 4,107 1,536 1,529 1,04218. Terméktároló Zrt. 3,180 1,620 23 1,53719. <strong>MOL</strong>TRADE-Mineralimpex Zrt. 3,161 1,627 1,484 5020. <strong>MOL</strong> Agram d.o.o.** 2,492 8,662 (7,376) 1,20621. Geoinform Kft. 2,370 1,125 892 35322. Hawasina GmbH. 2,037 247 1,922 (132)23. Geofizikai Szolgáltató Kft. 1,848 1,890 1,182 (1,224)24. <strong>MOL</strong>-LUB Kft. 1,604 2,603 (770) (229)25. Roth Heizöle GmbH. 917 9 233 67526. Lamorak Enterprises Ltd 846 874 981 (1,009)27. <strong>MOL</strong> Trans Kft. 690 619 (33) 10428.FER Tűzoltóság és SzolgáltatóKft.508 290 170 4829. <strong>MOL</strong> Pakistan Ltd 268 112 968 (812)30. <strong>MOL</strong> Austria GmbH. 226 98 392 (264)31. MK Mineralkontor GmbH. 223 14 81 12832. <strong>MOL</strong>-RUSS OOO 168 121 29 1833. Alfagas Kft.*** 80 10 32 3834. ENERGOPETROL d.d. 79 9,508 (8,427) (1,002)35. <strong>MOL</strong> Commodity Tading Kft. 51 50 0 136. Hermész Mérnöki Kft. 49 5 40 452
<strong>MOL</strong> <strong>Hungarian</strong> <strong>Oil</strong> <strong>and</strong> <strong>Gas</strong> <strong>Public</strong> <strong>Limited</strong> <strong>Company</strong>Supplementary Notes for the year ending on 31 December 2009IDName of the <strong>Company</strong>Shareholders’equityShare capitalReservesNet income for200937. HEXÁN Kft. 34 7 23 438. BHM <strong>Oil</strong> Invest Ltd 29 31 (87) 8539. Platounko Investments Ltd 16 2 18 (4)40. Ménrót Kft. 6 6 0 041. Bravoum Investments Ltd 2 2 3 (3)42. Tadmor Ltd 2 3 20 (21)43. MH <strong>Oil</strong> <strong>and</strong> <strong>Gas</strong> B.V. 0 5 1 (6)44. <strong>MOL</strong> Libya Ltd 0 5 6 (11)45. MK <strong>Oil</strong> <strong>and</strong> <strong>Gas</strong> B.V. (10) 5 (13) (2)46. BMN Investment Ltd (12) 5 (2) (15)47. UBA Services Ltd (210) 249 (455) (4)48. E.M.S Management Services Ltd (259) 5 775 (1,039)49. Balatongáz Kft. (361) 50 (411) 050. SHM Seven Investments Ltd (579) 478 (501) (556)51. RUSI Services Ltd (1,904) 45 (767) (1,182)52. Pyrogol Ltd (2,072) 2 (727) (1,347)53. Greentrade Ltd (2,914) 2 (97) (2,819)54. Pronodar Ltd (3,074) 2 (987) (2,089)55. USI Ltd (4,145) 6 62 (4,213)56. <strong>MOL</strong> Caspian Ltd (4,474) 2 (2,897) (1,579)Joint ventures57.CM European Power InternationalB.V.9,920 7,656 2,287 (23)Associated companies58. ROSSI Biofuel Zrt. 627 350 (10) 28759. <strong>MOL</strong> Energiakereskedő Zrt. 0 50 (5,600) 5,550* Minority interest is presented under reserves.** Data presented in the annual report concerning 31 December 2006.*** Data presented in the annual report concerning 31 December 2008.Companies having registered office in Hungary are presented according to <strong>Hungarian</strong> Accounting Act <strong>and</strong>companies with registered office in abroad are presented according to IFRS.53
<strong>MOL</strong> <strong>Hungarian</strong> <strong>Oil</strong> <strong>and</strong> <strong>Gas</strong> <strong>Public</strong> <strong>Limited</strong> <strong>Company</strong>Supplementary Notes for the year ending on 31 December 200913.5. <strong>MOL</strong> Plc’s other investments, classified as long-term investmentsID Name of the <strong>Company</strong> Share%1.2.3.4.Grossbookvalue2008 2009Accumulatedimpairment<strong>and</strong> reversalNet bookvalueShare%GrossbookvalueAccumulatedimpairment<strong>and</strong> reversalHUF millionNet bookvalueOTP Bank Plc. *- - - -Budapest, Nádor u.61.8.57 55,468 0 55,468Pearl Petroleum <strong>Company</strong>Ltd**- - - -Flemming House, WichamsCay, Road Town, Tortola10.00 54,315 0 54,315Budapesti Értéktőzsde Zrt.2.18 431 0 431Budapest Andrássy út 93.2.18 431 0 431II, Nemzetközi GazdaságFejlesztő Közhasznú11.49 1 0 1TársaságBudapest, Lajos u. 160-16211.49 1 0 1Total 432 0 432 110,215 0 110,215The equity share <strong>and</strong> voting rights are identical in the case of the given companies.* <strong>MOL</strong> <strong>and</strong> OTP entered into a share-exchange <strong>and</strong> share swap agreements. Under the agreements <strong>MOL</strong>transferred 5,010,501 “A” series <strong>MOL</strong> ordinary shares to OTP on return for 24,000,000 OTP ordinary shares.** On 15 May 2009 <strong>MOL</strong> signed an agreement to acquire 10 % stake in Pearl Petroleum <strong>Company</strong> <strong>Limited</strong>(Pearl) from Crescent Petroleum <strong>Company</strong> International <strong>and</strong> Dana <strong>Gas</strong> PJSC. In exchange for a 10 % ownershippackage of Pearl <strong>MOL</strong> transferred 6,322,232 “A” series <strong>MOL</strong> ordinary shares.54
<strong>MOL</strong> <strong>Hungarian</strong> <strong>Oil</strong> <strong>and</strong> <strong>Gas</strong> <strong>Public</strong> <strong>Limited</strong> <strong>Company</strong>Supplementary Notes for the year ending on 31 December 200913.6. Impairment of long-term investments <strong>and</strong> its reversalHUF millionDescriptionSubsidiariesJoint venturecompaniesAssociatedcompaniesOtherinvestmentsTotalClosing gross balance of2008Closing gross balance of2009Opening impairmentbalance of 2008752,855 1,239 349,747 432 1,104,2731,132,082 9,984 6,862 110,215 1,259,14335,699 15 1 0 35,715Increase of impairment* 6,813 0 0 0 6,813Increase of impairment due toreclassificationClosing impairment balanceof 2008448 72 0 0 52042,960 87 1 0 43,048Increase of impairment** 15,594 0 0 0 15,594Closing impairment balanceof 200958,554 87 1 0 58,642Closing net balance of 2008 709,895 1,152 349,746 432 1,061,225Closing net balance of 2009 1,073,528 9,897 6,861 110,215 1,200,501* Concerning 31 December 2008 impairment was recognised for the following investments in subsidiaries:Intermol d.o.o. HUF 2,280 million, <strong>MOL</strong> Yemen Ltd HUF 392 million, Hawasina GmbH HUF 822 million, KalegranLtd HUF 2,794 million, Petrolszolg Kft. HUF 220 million, BMN Investment Ltd HUF 7 million, Pronodar Ltd HUF 8million, Lamorak Enterprises Ltd HUF 104 million, Pyrogol Ltd HUF 8 million, <strong>MOL</strong> Agram d.o.o. HUF 178 million.** Concerning 31 December 2009 <strong>MOL</strong> recognised impairment for investments as follows: Intermol d.o.o. HUF11,539 million, Greentrade Ltd HUF 1,874 million, Kalegran Ltd HUF 1,143 million, SHM Seven Investment LtdHUF 454 million, Petrolszolg Kft. HUF 351 million, <strong>MOL</strong> Yemen HUF 175 million, Platounko Investment Ltd HUF24 million, E.M.S. Management Services Ltd HUF 15 million, <strong>MOL</strong> Caspian HUF 12 million, UBA Services LtdHUF 7 million.55
<strong>MOL</strong> <strong>Hungarian</strong> <strong>Oil</strong> <strong>and</strong> <strong>Gas</strong> <strong>Public</strong> <strong>Limited</strong> <strong>Company</strong>Supplementary Notes for the year ending on 31 December 200914. Details of long-term loans to related parties <strong>and</strong> other investmentsHUF millionDesription 2008 2009HUF loans to related parties 141,652 129,235Loans disbursed in EUR 50,788 98,008Loans disbursed in USD 16,260 77,347Loans disbursed in RUB 73,495 54,829Loans disbursed in NOK 5,523 6,731FX loans to related parties 146,066 236,915Total long-term loans to related parties 287,718 366,150Loans disbursed in USD 0 12,705Total long-term loans to other investments 0 12,70515. Impairment on long-term loansHUF millionDescriptionLong-termloans torelated partiesLong-term loansto otherinvestmentsOther longtermloansTotalGross book value as of 31December 2008Gross book value as of 31December 2009311,047 0 72 311,119400,028 12,705 72 412,805Opening balance of impairment 2008 793 0 501 1,294Increase of impairment* 22,536 0 0 22,536Decrease of impairment 0 0 (501) (501)Closing balance of impairment 2009 23,329 0 0 23,329Increase of impairment** 20,805 0 0 20,805Decrease of impairment** (10,256) 0 0 (10,256)Reversal of impairment 0 0 0 0Closing balance of impairment 2009 33,878 0 0 33,878Net book value as of 31 December2008Net book value as of 31 December2009287,718 0 72 287,790366,150 12,705 72 378,927* In 2008 impairment increase was recognized for loans given to Intermol d.o.o., Havasina GmbH., LamorakEnterprises Ltd, SHM Seven Ltd, <strong>MOL</strong> Caspian Ltd, RUSI Services Ltd, Pronodar Ltd <strong>and</strong> Pyrogol Ltd.56
<strong>MOL</strong> <strong>Hungarian</strong> <strong>Oil</strong> <strong>and</strong> <strong>Gas</strong> <strong>Public</strong> <strong>Limited</strong> <strong>Company</strong>Supplementary Notes for the year ending on 31 December 2009Furthermore impairment recognised in previous years belonging to loans given to <strong>MOL</strong> Caspian Ltd <strong>and</strong> SHMSeven Ltd was reclassified as a result of amendment of loan agreements.** In 2009 impairment increase was recognized for loans given to Havasina GmbH., SHM Seven ltd, <strong>MOL</strong>Caspian Ltd, Pronodar Ltd, Greentrade Ltd, BMN Investment Ltd, E.M.S. Management Ltd, Lamorak EnterprisesLtd, RUSI Services Ltd <strong>and</strong> Pyrogol Ltd. Furthermore impairment recognised in previous years belonging to loansgiven to Intermol d.o.o. was reclassified from the short-term into the long-term loans. The decrease in impairmentwas attributable to cash settlement.16. Inventories16.1. InventoriesHUF millionDescription 2008 2009Materials 42,326 39,878Of which: purchased crude oil 18,190 17,906Unfinished production <strong>and</strong> semi-finished products 39,096 31,887Finished products 30,046 33,504Commodities 13,541 8,752Advances on stocks 0 4Total 125,009 114,02516.2. Emission rightsHUF millionDescription Quantity (unit) Value in HUF millionClosing balance of emission rights31.12.20080 0Emission rights received for 2008 1,555,002 6,014Emission rights received for 2009 1,546,389 5,980Return in 2008 (received free of charge) (1,526,936) (5,905)Return in 2008 (bought) (155,321) (536)Emission rights bought 3,761,700 14,364Emission rights sold (received free of charge) (1,566,013) (6,056)Emission rights sold (bought) (3,605,987) (13,827)Closing balance of emission rights31.12.20098,834 3457
<strong>MOL</strong> <strong>Hungarian</strong> <strong>Oil</strong> <strong>and</strong> <strong>Gas</strong> <strong>Public</strong> <strong>Limited</strong> <strong>Company</strong>Supplementary Notes for the year ending on 31 December 200917. Non-current assets disposable within a year, reclassified to inventoriesNon-current assets in 2008L<strong>and</strong> <strong>and</strong> building <strong>and</strong> relatedproperty rightsGrossbookvalueAccumulateddepreciationAccumulatedimpairmentReversal ofimpairmentHUF millionNet bookvalue436 106 160 0 170Plant, machinery <strong>and</strong> vehicles 33 8 6 0 19Total reclassification in 2008 469 114 166 0 189HUF millionNon-current assets in 2009Grossbook valueAccumulateddepreciationAccumulatedimpairmentReversal ofimpairmentNet bookvalueL<strong>and</strong> <strong>and</strong> building <strong>and</strong> relatedproperty rights570 179 221 0 170Plant, machinery <strong>and</strong> vehicles 1 0 0 0 1Other equipment, fixtures <strong>and</strong>vehicles6 1 0 0 5Assets under construction 339 0 0 0 339Total reclassification in 2009 916 180 221 0 515The <strong>Company</strong> reclassifies those property, plant <strong>and</strong> equipment to inventories, of which the original intention ofuse has been changed (disposable within a year, available for in kind contribution).18. Write-off of inventoriesDescriptionMaterialsUnfinishedproduction<strong>and</strong> semifinishedproductsFinishedproductsCommoditiesAdvanceson stocksHUF millionTotalinventoriesOpening balance of 2008 5 0 0 995 0 1,000Increase of write-off* 0 0 1,380 0 0 1,380Decrease of write-off (1) 0 0 (995) 0 (996)Closing balance of 2008 4 0 1,380 0 0 1,384Decrease of write-off 0 0 (1,380) 0 0 (1,380)Closing balance of 2009 4 0 0 0 0 4* Increase of write-off in 2008 was caused by decrease of market prices.58
<strong>MOL</strong> <strong>Hungarian</strong> <strong>Oil</strong> <strong>and</strong> <strong>Gas</strong> <strong>Public</strong> <strong>Limited</strong> <strong>Company</strong>Supplementary Notes for the year ending on 31 December 200919. Receivables from supply of goods <strong>and</strong> services (trade receivables)HUF millionDescription 2008 2009Domestic receivables 72,553 72,540Of which: write off <strong>and</strong> reversal (1,126) (1,110)Foreign receivables 4,030 9,767Of which: write off <strong>and</strong> reversal (7) (7)Total receivables from the supply of goods <strong>and</strong> services 76,583 82,30720. Receivables from related partiesHUF millionDescription 2008 2009Receivables from subsidiaries 174,093 215,629Receivables from short-term loans 119,599 125,300Receivables from the supply of goods <strong>and</strong> services 47,851 77,537Purchased receivables 6,643 12,792Receivables from joint ventures 3,009 250Receivables from the supply of goods <strong>and</strong> services 2,994 250Receivables from short-term loans 15 0Receivables from associated companies 327 280Receivables from the supply of goods <strong>and</strong> services 327 280Total 177,429 216,15959
<strong>MOL</strong> <strong>Hungarian</strong> <strong>Oil</strong> <strong>and</strong> <strong>Gas</strong> <strong>Public</strong> <strong>Limited</strong> <strong>Company</strong>Supplementary Notes for the year ending on 31 December 200921. Other receivablesHUF millionDescription 2008. 2009.Book value of lent <strong>MOL</strong> shares 88,874 20,564Of which: recognised impairment 84,306 12,769Tax to be refunded 21,502 18,101Deposit 22 9,786Receivables purchased <strong>and</strong> received 856 1,513Advance payment for services 325 1,496Receivables related to financial investments 1,236 1,044Receivables from joint operation 1,309 989Of which: recognised impairment 1,081 1,075VAT charged by foreign supplier 667 625Receivables from employees 122 118Other other receivables 368 715Total: 115,281 54,95122. Valuation of receivablesHistorical costHUF millionDescriptionTradereceivablesReceivablesfrom relatedpartiesReceivablesfrom otherinvestmentsReceivablesfrom bills ofexchangeOtherreceivablesDerivativetransactionsTotalreceivablesClosing balanceas of 31.12.2008Of which:receivablesimpairedClosing balanceas of 31.12.2009Of which:receivablesimpaired77,706 187,158 46 0 200,772 27,486 493,1681,552 10,182 0 0 175,181 0 186,91583,424 217,658 0 0 68,933 53,518 423,5331,558 1,498 0 0 31,564 0 34,62060
<strong>MOL</strong> <strong>Hungarian</strong> <strong>Oil</strong> <strong>and</strong> <strong>Gas</strong> <strong>Public</strong> <strong>Limited</strong> <strong>Company</strong>Supplementary Notes for the year ending on 31 December 2009ImpairmentHUF millionDescriptionTradereceivablesReceivablesfrom relatedpartiesReceivablesfrom otherinvestmentsReceivablesfrom bills ofexchangeOtherreceivablesDerivativetransactionsTotalreceivablesOpeningbalance as of01.01.2008Impairmentrecognised in thecurrent periodDecrease due tofinancialsettlementDecrease due towritten-offreceivablesDecrease due tosale ofreceivablesDecrease due toother decrease ofreceivablesClosing balanceas of 31.12.2008Impairmentrecognised in thecurrent periodOther increase ofimpairmentDecrease due tofinancialsettlementDecrease due towritten-offreceivablesDecrease due toother decrease ofreceivablesClosing balanceas of 31.12.20092,091 13,118 0 0 13,369 0 28,578363 4,221 0 0 85,409* 0 89,993(89) (14) 0 0 (7) 0 (110)(308) 0 0 0 (4) 0 (312)(224) 0 0 0 (256) 0 (480)0 (7,339) 0 0 (13,017) 0 (20,356)1,833 9,986 0 0 85,494 0 97,313289 15 0 0 82 0 3860 0 0 0 1,116 0 1,116(73) (3) 0 0 (30) 0 (106)(222) 0 0 0 (3) 0 (225)0 (8,242) 0 0 (66,366)** 0 (74,608)1,827 1,756 0 0 20,293 0 23,876* In connection with share lending transactions HUF 84,306 million was recorded as impairment in 2008.** Reversal of impairment recorded as other income attributable to the closing of share lending transaction.61
<strong>MOL</strong> <strong>Hungarian</strong> <strong>Oil</strong> <strong>and</strong> <strong>Gas</strong> <strong>Public</strong> <strong>Limited</strong> <strong>Company</strong>Supplementary Notes for the year ending on 31 December 2009Reversal of impairmentHUF millionDescriptionTradereceivablesReceivablesfrom relatedpartiesReceivablesfrom otherinvestmentsReceivablesfrom bills ofexchangeOtherreceivablesDerivativetransactionsTotalreceivablesClosing balanceas of 31.12.2008Reversal ofimpairment in theperiodOther increase inreversal ofimpairmentClosing balanceas of 31.12.2009Net income forthe period ended31.12.2008Net income forthe period ended31.12.2009710 257 0 0 3 0 9700 0 0 0 6,283 0 6,2830 0 0 0 25 0 25710 257 0 0 6,311 0 7,27876,583 177,429 46 0 115,281 27,486 396,82582,307 216,159 0 0 54,951 53,518 406,93523. Short-term investments23.1. Investment to be sold, liquidated or wound up, classified as short-term investments2008 2009HUF millionIDName of the <strong>Company</strong>Share%GrossbookvalueAccumulatedimpairment<strong>and</strong> reversalNet bookvalueShare%GrossbookvalueAccumulatedimpairment<strong>and</strong> reversalNet bookvalue1.Balatongáz Kft.Balatonakali, Kossuth L u.17.77.22 505 505 0 77.22 505 505 0Total divested subsidiaries 505 505 0 505 505 01.Villas Hungária Kft.Zalaegerszeg, Zrínyi u. 6.38.00 183 6 177 38.00 183 6 177TURBO Team Kft.*Beregdaróc, 4934- - - - 25.00 37 0 37Pf.6.Hrsz.0128/2IN-ER Erőmű Kft.Nagykanizsa, Erzsébet tér 22.30.00 6 0 6 30.00 6 0 6MAG Kft.Szolnok, Ady u. 26.25.00 1 1 0 25.00 1 1 02.Algynvest Kft.**Algyő, Szeged-Algyő Ipartelep35.00 83 83 0 - - - -Total divested associates 273 90 183 227 7 2201.OMV AGVienna, Otto-Wagner Platz 5.- 0 0 0 - 0 0 0Total divested other investments 0 0 0 0 0 0Total divested investments 778 595 183 732 512 220The equity share <strong>and</strong> voting rights are identical in case of all companies included in the table, except for TurboTeam Kft., when <strong>MOL</strong> 25 % participation ensures 25 %+1 voting right.* Please see section 13.3. for further details.** Algynvest Kft. was liquidated.62
<strong>MOL</strong> <strong>Hungarian</strong> <strong>Oil</strong> <strong>and</strong> <strong>Gas</strong> <strong>Public</strong> <strong>Limited</strong> <strong>Company</strong>Supplementary Notes for the year ending on 31 December 200923.2. Impairment <strong>and</strong> reversal of impairment on short-term investmentsHUF millionDescriptionSubsidiariesJointventuresAssociatecompaniesOtherinvestmentsTotalGross closing balance of 2008 505 0 273 0 778Gross closing balance of 2009 505 0 227 0 732Opening impairment balance of 2008 505 0 89 0 594Increase of impairment 0 0 1 0 1Closing impairment balance of 2008 505 0 90 0 595Decrease of impairment* 0 0 (83) 0 (83)Closing impairment balance of 2009 505 0 7 0 512Closing net balance of 2008 0 0 183 0 183Closing net balance of 2009 0 0 220 0 220*Decrease of impairment attributable to liquidation of Algynvest Kft.24. Changes of treasury shares in the current yearDescriptionNumber of shares(pieces)Book value of shares(HUF million)Opening balance of treasury shares 8,781,943 103,407Sale of treasury shares (10,205,062) (184,099)Lend of treasury shares (4,965,582) (129,518)Share-exchange, Share swap* (5,010,501) (108,232)Impairment of treasury shares** 0 (17,779)Decreases (20,181,145) (439,628)Get back of lent treasury shares 11,281,643 190,577Exercise option*** 7,552,874 142,276Reversal of impairment 0 125,646Increases 18,834,517 458,499Closing total of treasury shares 7,435,315 122,278* <strong>MOL</strong> Plc. <strong>and</strong> OTP Bank Plc. entered into share-exchange <strong>and</strong> share swap agreements. Under the agreements<strong>MOL</strong> Plc. transferred 5,010,501 “A” series <strong>MOL</strong> ordinary shares to OTP on return for 24,000,000 OTP ordinaryshares.** <strong>MOL</strong> Plc recognized impairment for “A” treasury shares as of 31 December 2009 based on the differencebetween book value (HUF 18,837 per piece) <strong>and</strong> weighted average stock exchange share price during 90 stockexchange days prior to the balance sheet preparation date (HUF 16,446 per piece).63
<strong>MOL</strong> <strong>Hungarian</strong> <strong>Oil</strong> <strong>and</strong> <strong>Gas</strong> <strong>Public</strong> <strong>Limited</strong> <strong>Company</strong>Supplementary Notes for the year ending on 31 December 2009*** The call options of <strong>MOL</strong> Plc. concluded with BNP Paribas S.A. (“BNP”) on 7,552,874 Series “A” OrdinaryShares issued by <strong>MOL</strong> have been exercised with the settlement date of 17 July 2009.25. Cash <strong>and</strong> cash equivalentsHUF millionDescription 2008 2009Cash at filling stations 929 915Other cash in h<strong>and</strong>, cheques 134 235Cash in h<strong>and</strong>, cheques 1,063 1,150Short-term deposits denominated in HUF <strong>and</strong> FX* 143,615 66,791Settlement bank accounts, deposit accounts of sites 18,719 25,361Bank accounts denominated in FX 4,335 1,365Other bank accounts 435 1,238Bank accounts 167,104 94,755CASH AND CASH EQUIVALENTS 168,167 95,905* Because of the financial crisis in 2008 position of several global banks have been weaken or become uncertain.<strong>MOL</strong> withdrew from syndicated loan accounts in order to ensure his financial stability. These withdrawn amountstook a major part of short term deposits in 2008 nevertheless in 2009 there were no such event acting role in thetrend of cash <strong>and</strong> cash equivalents.26. Prepayments, accrualsDetails of prepaymentsHUF millionDescription 2008 2009Interest receivable 5,087 4,805Accrued follow up price adjustment related to the sale of <strong>MOL</strong>Földgázellátó Zrt.*6,400 0Other deferred income 596 191Accrued income 12,083 4,996Mining royalty** 13,247 10,707Deferred loss on <strong>MOL</strong> shares lent *** 4,862 5,081Prepaid rent <strong>and</strong> lease fee 2,640 2,644Transaction cost due to sale of <strong>MOL</strong> shares**** 1,338 1,179MSZKSZ fee reclamation 0 567Issue of long-term zero coupon bonds 589 513Other prepayments 320 498Prepaid costs <strong>and</strong> expenses 22,996 21,189Total 35,079 26,18564
<strong>MOL</strong> <strong>Hungarian</strong> <strong>Oil</strong> <strong>and</strong> <strong>Gas</strong> <strong>Public</strong> <strong>Limited</strong> <strong>Company</strong>Supplementary Notes for the year ending on 31 December 2009* The deal concluded between <strong>MOL</strong> Plc <strong>and</strong> E.ON Ruhrgas International concerning the sale of <strong>MOL</strong>Földgázellátó Zrt. was closed finally in June 2009, corresponding accruals were eliminated.** On 22 December 2005 the <strong>Company</strong> signed an agreement with the Ministry of Economy <strong>and</strong> Transport on theextension of production licences for 12 mining sites until 2010 <strong>and</strong> set of fix <strong>and</strong> declining mining royalty rate forthe period of the extension <strong>and</strong> following 10 years, in exchange <strong>MOL</strong> made a one-off payment of HUF 20 billion.The one-off payment is recorded as proportional cost to oil <strong>and</strong> gas production subject to mining royalty duringthe 15-years period defined by the contract.*** <strong>MOL</strong> Plc signed an agreement to lend “A” series <strong>MOL</strong> shares to OTP Bank Plc <strong>and</strong> MFB Invest Zrt. in 2007<strong>and</strong> 2008. The difference between the book value <strong>and</strong> the contract value was deferred.**** On 13 March 2006 <strong>MOL</strong> Plc signed a share purchase agreement to sell 6,007,479 Series “A” OrdinaryShares of <strong>MOL</strong> held in treasury to Magnolia Finance <strong>Limited</strong> (“Magnolia”). Magnolia announced the sale of up toEUR 610 million of perpetual exchangeable capital securities (the “Capital Securities”), exchangeable into theSeries “A” Ordinary Shares of <strong>MOL</strong> in the predetermined exchange period, to international financial investors.<strong>MOL</strong> has also, concurrently with the sale, entered into a swap agreement in principle with Magnolia that gives<strong>MOL</strong> a call option to buy back all or some of the Series “A” Ordinary Shares of <strong>MOL</strong>, in certain limitedcircumstances. Transaction cost related to dealings is recorded proportionally until the closing date (2016).Details of accrualsHUF millionDescription 2008 2009Deferred revenuesDeferred revenuesInterest payable to non-financial institutionsAccrued personnel expensesAccrues cost of joint operationAccrued expenses of long-term incentive programmes*Interest payable to financial institutionsAccrual due to conditional sale price of <strong>MOL</strong> Földgázellátó Zrt.**Other accrued costs <strong>and</strong> expensesAccrued costs <strong>and</strong> expenses1101101,9673,942303,41125,00084535,168Negative goodwill related to acquisition***6,367Received compensation for cost of redeemed production well,caused by motorway constructions 0Book value of assets received free of charge, found as a surplus,or received as a gift or legacy 585OtherDeferred incomeTotal1737,12542,40393932,0461,7861,6271,62351607468,3444,3502,4284572117,44615,883* There was no accrued cost because of share price conditions in 2008. Please see section 52. for further details.65
<strong>MOL</strong> <strong>Hungarian</strong> <strong>Oil</strong> <strong>and</strong> <strong>Gas</strong> <strong>Public</strong> <strong>Limited</strong> <strong>Company</strong>Supplementary Notes for the year ending on 31 December 2009** The deal concluded between <strong>MOL</strong> Plc <strong>and</strong> E.ON Ruhrgas International concerning the sale of <strong>MOL</strong>Földgázellátó Zrt. was closed finally in June 2009, corresponding accruals were eliminated.*** On 27-28 February 2007 the <strong>Company</strong> purchased TVK shares representing 42.25 % of TVK’s share capital.Following the transaction <strong>MOL</strong> achieved qualified majority in TVK. Negative goodwill related to the transactionwas accounted with the amount of HUF 10,086 million, which will be released during the next 5 years.27. Changes in equityDescriptionBalance as of01.01.2008Increase due toconvertible bonds*SharecapitalSharepremiumRetainedearningsTied-upreserveFairvaluationreserveNetincomeHUF millionShareholders’equity109,675 222,354 878,448 260,396 0 131,671 1,602,544327 1,512 0 0 0 0 1,839Share capital reduction** (5,483) 0 0 0 0 0 (5,483)Transfer of net incomefor previous yearProfit adjustments toprevious years0 0 131,671 0 0 (131,671) 00 0 1,004 0 0 0 1,0042008 profit after tax 0 0 0 0 0 (223,007) (223,007)Dividend payable 0 0 0 0 0 0 0Change of tied-upreserve0 0 129,694 (129,694) 0 0 0Balance as of31.12.2008104,519 223,866 1,140,817 130,702 0 (223,007) 1,376,897Transfer of net income ofprevious year0 0 (223,007) 0 0 223,007 0Profit adjustments toprevious years0 0 (1,548) 0 0 0 (1,548)2009 profit after tax 0 0 0 0 0 253,016 253,016Dividend payable 0 0 0 0 0 0 0Change of tied-upreserveBalance as of31.12.20090 0 (7,352) 7,352 0 0 0104,519 223,866 908,910 138,054 0 253,016 1,628,365*<strong>MOL</strong> Plc issued 327,336 “A” Series ordinary shares to participants of the convertible bond programme (sharebased incentive scheme for members of the Board of Directors <strong>and</strong> top managers) in exchange for the 184bonds, presented by them, at an issue price of HUF 5,621 per share.** On 23 April 2008 the AGM approved the decrease of the share capital by withdrawal of 5,483,775 piecesregistered ordinary treasury shares of the series "A", with par value of HUF 1,000.66
<strong>MOL</strong> <strong>Hungarian</strong> <strong>Oil</strong> <strong>and</strong> <strong>Gas</strong> <strong>Public</strong> <strong>Limited</strong> <strong>Company</strong>Supplementary Notes for the year ending on 31 December 200928. Breakdown of the tied up reserveHUF millionDescription 2008 2009 ChangeBook value of treasury shares 103,407 122,278 18,871Research <strong>and</strong> development, not yet written off 1,114 1,437 323Other tied-up reserves* 26,181 14,339 (11,842)Total tied-up items 130,702 138,054 7,352* <strong>Company</strong> recognised tied up reserve in an amount corresponding to the capitalised field ab<strong>and</strong>onment provisionincluded in the closing balance of property, plant <strong>and</strong> equipment. (Please see section 3.4.6. for further details.)67
<strong>MOL</strong> <strong>Hungarian</strong> <strong>Oil</strong> <strong>and</strong> <strong>Gas</strong> <strong>Public</strong> <strong>Limited</strong> <strong>Company</strong>Supplementary Notes for the year ending on 31 December 200929. ProvisionsProvisions for contingent liabilitiesDescriptionOpeningbalanceUse ofprovisions2008 2009ProvisionrecognisedagainstprofitProvisioncapitalisedagainst fixedassets*ClosingbalanceUse ofprovisionsProvisionrecognisedagainstprofitProvisioncapitalisedagainst fixedassets*HUF millionClosingbalanceProvisions for fieldab<strong>and</strong>onment81,807 1,845 5,031 9,377 94,370 594 7,423 (2,845) 98,354Provisions forenvironmental 15,368 2,799 1,053 - 13,622 4,295 2,637 - 11,964liabilities**Provision forEmission rights***0 0 514 - 514 514 5,243 - 5,243Provision forprobable liabilitiesdue to natural gas0 0 0 - 0 0 4,309 - 4,309price revisionProvision forperformed but notcharged8,997 568 397 - 8,826 8,676 3,794 - 3,944subcontractor’sservices****Provisions forretirement2,513 157 518 - 2,874 520 273 - 2,627liabilitiesProvisions forlitigation159 41 20 - 138 55 2,258 - 2,341Of which: litigationagainst related80 0 0 - 80 0 0 - 80partyProvision forloyalty bonus1,813 472 434 - 1,775 266 395 - 1,904Provisions for theunused points onloyalty <strong>and</strong>715 216 237 - 736 389 323 - 670multipoint cardsProvisions forredundancy <strong>and</strong>604 189 22 - 437 326 8 - 119early retirementOther provisions 458 115 (59) - 284 183 226 - 327Total provisionsfor contingentliabilities112,434 6,402 8,167 9,377 123,576 15,818 26,889 (2,845) 131,802* Please see section 3.4.6. for further details.** The environmental expenses recognised were HUF 2,501 million in 2008, <strong>and</strong> HUF 2,037 million in 2009.*** Please see section 3.4.4. for further details.**** <strong>MOL</strong> Plc recognized provision for contingent liabilities arisen from his general construction activity concerningsubcontractors’ services performed but not charged during the reporting period. The provision recognised asexpense, includes self revision of previous years (with the amount of HUF 20 million).68
<strong>MOL</strong> <strong>Hungarian</strong> <strong>Oil</strong> <strong>and</strong> <strong>Gas</strong> <strong>Public</strong> <strong>Limited</strong> <strong>Company</strong>Supplementary Notes for the year ending on 31 December 200930. Long-term liabilitiesDetails of long-term liabilities by maturityBalance sheet item 2008Within a yearBetween 1 <strong>and</strong> 5yearsLong-termOver 5 yearsHUF millionLiabilities from bond issue 0 0 198,585 198,585Other long-term credits* 79,434 512,455 0 512,455Long-term liabilities to related parties 191 0 0 0Other long-term liabilities 0 402 0 402Total 79,625 512,857 198,585 711,442TotalHUF millionLong-termBalance sheet item 2009 Within a yearBetween 1 <strong>and</strong> 5yearsOver 5 years TotalLiabilities from bond issue 0 0 203,130 203,130Other long-term credits* 98,149 365,035 13,542 378,577Long-term liabilities to related parties 197 0 0 0Other long-term liabilities 19 249 40 289Total 98,365 365,284 216,712 581,996*The better financial conditions of the <strong>Company</strong> allowed to repay revolving credits with considerable amount.Liabilities secured with a mortgage or similar rightsThe <strong>Company</strong> does not have any liabilities secured with a mortgage or similar rights.31. Breakdown of long-term liabilities to related parties<strong>MOL</strong> Plc did not have long-term liabilities to related parties (long-term credit or liability to suppliers) in 2008 <strong>and</strong>2009.69
<strong>MOL</strong> <strong>Hungarian</strong> <strong>Oil</strong> <strong>and</strong> <strong>Gas</strong> <strong>Public</strong> <strong>Limited</strong> <strong>Company</strong>Supplementary Notes for the year ending on 31 December 200932. Liabilities, where the repayable amount exceeds the amount receivedAmount Amount repayableDescriptionreceived EUR EUR HUF millionHUF millionMaturityLong-term liabilities from bond issue 746,707,500 750,000,000 203,130 05.10.2015The <strong>Company</strong> signed the agreements related to EUR 750 million fixed rate Eurobond notes on 30 September2005. The notes will pay an annual coupon of 3.875 % <strong>and</strong> are in the denomination of EUR 50,000 each. Thenotes were offered as part of a private placement <strong>and</strong> are listed on the Luxembourg Stock Exchange.The amount of the liability in the balance sheet as of 2008 was HUF 198,585 million, the difference is attributableto the revaluation in 2009.33. Short- term loans<strong>MOL</strong> did not possess short-term loan against third parties in 2008 <strong>and</strong> 2009.34. Short-term creditsHUF millionDescription 2008 2009Long-term loans repayable within a year 79,434 98,149Total short-term credits 79,434 98,14935. Breakdown of short-term liabilities to related partiesHUF millionDescription 2008 2009Liabilities to subsidiaries 72,006 98,488Short-term loans 34,966 51,069Suppliers 30,822 40,131Other liabilities 6,218 7,288Liabilities to joint ventures 0 636Suppliers 0 636Liabilities to associated companies 3,411 3,499Suppliers 3,411 3,499Total 75,417 102,62370
<strong>MOL</strong> <strong>Hungarian</strong> <strong>Oil</strong> <strong>and</strong> <strong>Gas</strong> <strong>Public</strong> <strong>Limited</strong> <strong>Company</strong>Supplementary Notes for the year ending on 31 December 200936. Other short-term liabilitiesHUF millionDescription 2008 2009Tax <strong>and</strong> contribution liabilities 43,072 59,976Of which: VAT liability 20,926 30,542Excise duty 14,776 19,112Mining royalty 4,939 5,877Energy companies’ income tax 0 1,690Solidarity Surplus tax 24 1,379Personal income tax 1,196 1,032Liabilities to employees 13 1,575Price difference of acquisition 1,897 1,500Liabilities to the social security system 1,115 1,144Settlements with Magyar Szénhidrogén KészletezőSzövetség1,039 648Liabilities from filling station cards <strong>and</strong> services 1,992 623Liabilities to shareholders 649 421Of which: dividend payable 392 168Liabilities from joint operation 752 94Fine to be paid* 6,275 4Other other short-term liabilities 1,129 1,831Total 57,933 67,816* The sum in 2008 contains the paraffin fine imposed by the European Commission in the amount of EUR 23.7million.71
<strong>MOL</strong> <strong>Hungarian</strong> <strong>Oil</strong> <strong>and</strong> <strong>Gas</strong> <strong>Public</strong> <strong>Limited</strong> <strong>Company</strong>Supplementary Notes for the year ending on 31 December 200937. Net sales revenues by market segmentsHUF millionMarket segment,2008 2009region Product Service Total Product Service TotalEuropean Union 346,265 2,062 348,327 250,705 764 251,469Of which: Austria 105,963 38 106,001 52,692 58 52,750Slovakia 70,395 1,073 71,468 30,773 412 31,185Romania 31,803 226 32,029 26,523 140 26,663Central-EasternEurope110,283 170 110,453 90,939 52 90,991Of which: Croatia 67,970 156 68,126 67,653 20 67,673Other Europe 4,747 1 4,748 8,583 16 8,599Outside Europe 8,559 587 9,146 2,588 998 3,586Export total 469,854 2,820 472,674 352,815 1,830 354,645Total domestic 1,665,399 85,098 1,750,497 1,437,455 64,201 1,501,656Total 2,135,253 87,918 2,223,171 1,790,270 66,031 1,856,30138. Net sales revenues by core activitiesDescriptionNet domesticsalesrevenuesOf which:excise dutyNet exportsalesrevenuesNet salesrevenuesRefining &MarketingRetailservicesExploration &Production<strong>Gas</strong> <strong>and</strong>EnergyCorporate<strong>and</strong> other*HUF millionTotal984,353 304,164 172,124 187 40,828 1,501,656319,168 107,832 0 0 0 427,000333,965 9 443 13 20,215 354,6451,318,318 304,173 172,567 200 61,043 1,856,301*Services provided by the <strong>Company</strong> for subsidiaries.72
<strong>MOL</strong> <strong>Hungarian</strong> <strong>Oil</strong> <strong>and</strong> <strong>Gas</strong> <strong>Public</strong> <strong>Limited</strong> <strong>Company</strong>Supplementary Notes for the year ending on 31 December 200939. Import purchase by market segmentHUF millionMarket segment,2008 2009region Product Service Total Product Service TotalEuropean Union 501,867 35,916 537,783 220,913 20,468 241,381Of which: UK 273,449 3,085 276,534 43,088 1,795 44,883Cyprus 128,347 6,293 134,640 90,987 1,329 92,316Germany 25,020 7,633 32,653 6,320 6,749 13,069Slovakia 51,331 1,887 53,218 64,957 4,435 69,392Austria 10,438 3,926 14,364 7,221 3,895 11,116Other Europe 453,798 1,014 454,812 452,894 945 453,839Of which :Switzerl<strong>and</strong> 453,798 997 454,795 452,891 924 453,815Central-EasternEurope10,401 1,028 11,429 10,319 1,041 11,360Of which: Croatia 8,233 235 8,468 6,900 167 7,067Outside Europe 23,170 1,420 24,590 78,293 1,473 79,766Of which: USA 10,819 1,271 12,090 369 1,374 1,743Kazakhstan 10,784 59 10,843 7,990 28 8,018Total Import 989,236 39,378 1,028,614 762,419 23,927 786,346The table does not contain performed but non invoiced deliveries.73
<strong>MOL</strong> <strong>Hungarian</strong> <strong>Oil</strong> <strong>and</strong> <strong>Gas</strong> <strong>Public</strong> <strong>Limited</strong> <strong>Company</strong>Supplementary Notes for the year ending on 31 December 200940. Other operating income <strong>and</strong> expensesHUF millionOther operating income 2008 2009Eliminate of write-off of receivables* 512 77,184Provision used 6,402 15,818Of which: Release of provision for fulfilled but not chargedsubcontractor’s performance, related to investments568 8,676Release of environmental provision 2,799 4,295Release of field ab<strong>and</strong>onment provision 1,845 594Reversal of deferred income concerning emission rights** received freeof charge9 11,962Reversal of write-off for receivables*** 0 6,283Write off of negative goodwill arisen from acquisitions 2,023 2,017Surplus inventory 1,989 1,857Reversal of impairment of tangible assets 2,082 1,269Bank cost reimbursement related to borrowing 0 960Received penalty, fine, default interest <strong>and</strong> compensation 1,154 716Receivables sold 761 628Incomes from the sale of intangibles <strong>and</strong> property, plant <strong>and</strong> equipment 2,625 455Selling price of Mining Right**** 64,839 0Other 390 268Total other operating income 82,786 119,417* The amount presented for 2009 includes eliminated impairment with the amount of HUF 66,366 million,recorded in previous years attributable to repurchase of treasury shares.** <strong>Company</strong> sold emission rights received free of charge.*** Reversal of write off recorded due to lent treasury shares.**** Strategic <strong>and</strong> commercial gas storage mining rights sold to MMBF Zrt.74
<strong>MOL</strong> <strong>Hungarian</strong> <strong>Oil</strong> <strong>and</strong> <strong>Gas</strong> <strong>Public</strong> <strong>Limited</strong> <strong>Company</strong>Supplementary Notes for the year ending on 31 December 2009HUF millionOther operating expenses 2008 2009Excise duty 290,057 302,604Provisions recognised 8,226 26,909Of which: Provision recognised for field ab<strong>and</strong>onment 5,031 7,423Provision recognised for carbon dioxide emission surplus 514 5,243Provision recognised for natural gas price revision 0 4,309Provision recognised for fulfilled but not chargedsubcontractor’s performance, related to investments397 3,814Provision recognised for litigations 20 2,258Impairment* 106,632 12,973Fee to the Magyar Szénhidrogén Készletező Szövetség 12,104 12,246Extraordinary depreciation <strong>and</strong> impairment** 2,695 9,852Tax <strong>and</strong> duties paid to Government 11,431 9,362Use of emission rights 9 6,442Depreciation, scrapping <strong>and</strong> shortage of stocks 2,205 1,206Book value of receivables sold 738 625Grants <strong>and</strong> benefits 876 561Cost of intangible assets <strong>and</strong> property, plant <strong>and</strong> equipment sold 2,126 314Fines, penalties <strong>and</strong> self-revision penalty*** 6,106 171Other 2,266 998Other operating expenses 445,471 384,263* The amount of impairment in 2008 includes the impairment recognized for lent <strong>MOL</strong> shares of HUF 84,306million.** The amount of impairment contains impairment of field ab<strong>and</strong>onment provision capitalised in the value of l<strong>and</strong><strong>and</strong> buildings. (Please see section 3.4.6. for further details.)*** The sum in 2008 contains the paraffin fine imposed by the European Commission with the amount of EUR23.7 million.41. Other servicesHUF millionDescription 2008 2009Other tax <strong>and</strong> tax-type payments recognised as an expense 219,059 184,921Of which: Excise duty 109,700 114,690Mining royalty 108,801 69,745Bank expenses 832 3,769Insurance fees 2,705 2,387Authority charges, duties 1,301 1,396Environmental levy 271 206Other 0 8Total other services 224,168 192,68775
<strong>MOL</strong> <strong>Hungarian</strong> <strong>Oil</strong> <strong>and</strong> <strong>Gas</strong> <strong>Public</strong> <strong>Limited</strong> <strong>Company</strong>Supplementary Notes for the year ending on 31 December 200942. Dividend received (due)HUF millionDescription 2008 2009Dividend received (due) from subsidiaries 63,958 50,830Dividend received (due) from associated companies 1,662 358Received (due) dividend from related parties 65,620 51,188Received (due) dividend from other investments 81 49Other received (due) dividend 81 49Total received (due) dividend 65,701 51,23743. Sold <strong>and</strong> liquidated companiesName of the <strong>Company</strong> Date of divestment Book valueRevenuerecordedHUF millionEffect on profitAlgynvest Kft.* 31.10.2009 0 7 7<strong>MOL</strong> Energiakereskedő Zrt.** 18.12.2009 866 25 (841)<strong>MOL</strong> Földgázellátó Zrt.*** 31.03.2006 - 28,156 28,156Total 866 28,188 27,322* Algynvest Kft was liquidated.** <strong>Company</strong> sold his 50 % participation in <strong>MOL</strong> Energiakereskedő Zrt.*** The sale of 100 % stake of <strong>MOL</strong> Natural <strong>Gas</strong> Supply Plc <strong>and</strong> <strong>MOL</strong> Natural <strong>Gas</strong> Storage Plc to E.ON RuhrgasInternational was closed on 31 March 2006. The final purchase price of <strong>MOL</strong> Natural <strong>Gas</strong> Supply Plc wasdependent on the actual level of debt <strong>and</strong> working capital on the date of the closing <strong>and</strong> was subject to a numberof price adjustment items. The settlement of these price adjustments took place semi-annually until the end ofJune 2009. As a result of the deal HUF 28,156 million was recorded as financial revenue in 2009, due to the gainrealised on the investment sold.76
<strong>MOL</strong> <strong>Hungarian</strong> <strong>Oil</strong> <strong>and</strong> <strong>Gas</strong> <strong>Public</strong> <strong>Limited</strong> <strong>Company</strong>Supplementary Notes for the year ending on 31 December 200944. Other financial income <strong>and</strong> expensesHUF millionOther financial income 2008 2009Gain on non-hedge-type derivative transactions 30,765 118,807FX gain on monetary assets <strong>and</strong> liabilities denominated in foreignexchange188,114 73,489Of which: realised FX gain of loans <strong>and</strong> borrowings denominated inforeign exchange42,465 26,155realised FX gain of trade payables denominated in foreignexchange25,223 18,424realised FX gain of trade receivables denominated inforeign exchange20,703 14,141realised FX gain of other receivables denominated in foreignexchange61,136 8,486realised FX gain of other payables denominated in foreignexchange24,986 524unrealised FX gain at year-end valuation 2,629 256Loss given due to joint operation 276 186FX gain realised on sold treasury shares* 31,119 0Other, not specified financial income 1,298 619Total other financial income 251,572 193,101* The share purchase agreement as part of <strong>MOL</strong>-CEZ strategic alliance was financially closed <strong>and</strong> settled on 23January 2008. <strong>MOL</strong> sold 7,677,285 pieces of „A” series <strong>MOL</strong> shares to CEZ at HUF 30,000 per share. <strong>MOL</strong> hasan American call option for the shares with a strike price of HUF 20,000 per share which can be exercised within3 years. In 2009 the parties amended the agreement <strong>and</strong> the option period was prolonged until 2014.HUF millionOther financial expenses 2008 2009FX loss realised on sold treasury shares 26,288 83,118FX loss on monetary assets <strong>and</strong> liabilities denominated in foreignexchange150,178 73,529Of which: FX loss on credits <strong>and</strong> loans denominated in foreigncurrency58,189 20,633FX loss on suppliers denominated in foreign currency 40,672 17,622FX loss on other receivables denominated in foreigncurrency32,402 16,959FX loss on trade receivables denominated in foreigncurrency14,237 11,875FX loss on other payables denominated in foreigncurrency2,009 246Loss on non-hedge-type derivative transactions 233,872 29,516Take over loss due to joint operation 5,679 6,215Other, not specified financial expense 632 402Total other financial expenses 416,649 192,78077
<strong>MOL</strong> <strong>Hungarian</strong> <strong>Oil</strong> <strong>and</strong> <strong>Gas</strong> <strong>Public</strong> <strong>Limited</strong> <strong>Company</strong>Supplementary Notes for the year ending on 31 December 200945. Extraordinary revenues <strong>and</strong> expenditureHUF millionExtraordinary revenues 2008 2009In kind contribution value determined by the Article of Association* 5,229 9,083Extraordinary revenues from terminated investments** 0 1,780Extraordinary revenues from assets received free of charge 307 206Grant received 16 18Face value of treasury shares repurchased <strong>and</strong> withdrawn*** 5,483 0Other extraordinary revenues 355 12Total extraordinary revenues 11,390 11,099HUF millionExtraordinary expenses 2008 2009Book value of in kind contribution* 5,095 8,878Final transfer of cash <strong>and</strong> cash equivalents 105 141Book value <strong>and</strong> non-deductible VAT of assets given free of charge 135 102Extraordinary expenses from terminated investments 0 90Book value of treasury shares repurchased <strong>and</strong> withdrawn**** 122,727 0Other extraordinary expenses 3 0Total extraordinary expenses 128,065 9,211* The <strong>Company</strong> transferred assets to FGSZ Földgázszállító Zrt. <strong>and</strong> Dunai Gőzfejlesztő Kft. as in kindcontribution in 2008. <strong>MOL</strong> Plc transferred his 100 % participation in Dunai Gőzfejlesztő Kft. <strong>and</strong> in CM EuropeanPower Slovakia s.r.o. (acquired on 27 November 2009) to CM European International B.V, as in kind contributionin 2009.** <strong>MOL</strong> Energiakereskedő Zrt. was transformed from <strong>MOL</strong> Energiakereskedő Kft. on 31 October 2009. Thetransformed company is disclosed with the amount of HUF 1,732 million in <strong>MOL</strong> books based on its final asset<strong>and</strong> liability statement.*** Please see section 27. for further details.78
<strong>MOL</strong> <strong>Hungarian</strong> <strong>Oil</strong> <strong>and</strong> <strong>Gas</strong> <strong>Public</strong> <strong>Limited</strong> <strong>Company</strong>Supplementary Notes for the year ending on 31 December 200946. Grant received for development purposesTitle of subsidyDevelopment of newgeneration bio-fuel(primarily bio-diesel)Waste cracking pilotplant developmentInnovative technologydevelopment inenvironmentalprotectionAmountreceived2008 2009AmountusedAvailableamountAmountreceivedAmountusedHUF millionAvailableamount85 85 0 0 0 06 1 5 0 5 00 0 0 64 21 4347. Revenues from related partiesHUF millionDescription 2008 2009Net revenues from related parties 701,399 479,455Net revenues from subsidiaries 594,215 447,521Net revenues from associated companies 44,509 29,633Net revenues from joint ventures 9,039 2,301Net revenues from other investments 53,636 0Other revenues from related parties 69,681 13,452Other revenues from subsidiaries* 69,680 13,439Other revenues from associated companies 1 13* The increase of other revenues from subsidiaries was caused by the mining rights sold to MMBF Zrt. in 2008(with the amount of HUF 64,839 million).79
<strong>MOL</strong> <strong>Hungarian</strong> <strong>Oil</strong> <strong>and</strong> <strong>Gas</strong> <strong>Public</strong> <strong>Limited</strong> <strong>Company</strong>Supplementary Notes for the year ending on 31 December 200948. Permanent establishment in Slovakia<strong>MOL</strong> Plc owns permanent establishment in Slovakia. <strong>MOL</strong> concluded an agreement with CM European PowerSlovakia s.r.o. for engineering <strong>and</strong> construction activities. During the implementation in Bratislava the currentthermal plant will be modernized <strong>and</strong> its capacity will be increased. The permanent establishment as a part of<strong>MOL</strong> Plc is presented within the <strong>Company</strong>’s balance sheet <strong>and</strong> income statement.Major data of the permanent establishmentDescription 2009.HUF millionTrade receivables 4,694Advance payment to suppliers 1,274Advances from customers 1,346Suppliers 4,242Other payables 276Of which: VAT payable 246Income tax payable 30Result of the permanent establishmentDescription 2009.HUF millionNet sales revenue 4,105Value of services used 6Other services 2Value of services sold (intermediated) 3,931Profit or loss from operating activities 166Other financial income 56Other financial expense 49Financial profit or loss 7Ordinary business profit 173Profit before taxation 173Income tax (payable in abroad) 30Profit after taxation 14380
<strong>MOL</strong> <strong>Hungarian</strong> <strong>Oil</strong> <strong>and</strong> <strong>Gas</strong> <strong>Public</strong> <strong>Limited</strong> <strong>Company</strong>Supplementary Notes for the year ending on 31 December 2009Tax base of the permanent establishmentDescription 2009.HUF millionProfit before taxation 173Items increasing the tax base 0Items reducing the tax base 0Tax base 173Income tax payable abroad 30Profit after taxation 14381
<strong>MOL</strong> <strong>Hungarian</strong> <strong>Oil</strong> <strong>and</strong> <strong>Gas</strong> <strong>Public</strong> <strong>Limited</strong> <strong>Company</strong>Supplementary Notes for the year ending on 31 December 200949. Reconciliation of corporate tax base, solidarity surplus tax, energy companies’ income taxTax baseHUF millionDescription 2008 2009Profit before taxation (223,007) 272,779Temporary tax base adjustmentsTax base adjustment of provisions made <strong>and</strong> used (10,812) 6,836Tax base adjustment of impairment <strong>and</strong> reversal based on marketvaluation(235) 6,653Tax base adjustment of depreciation 1,965 6,483Tax base adjustment of impairment 104,452 (71,222)Other tax base adjustmentsTax base adjustments of non-repayable grants <strong>and</strong> benefits given 1,200 871Accounted costs <strong>and</strong> expenses not relating to business activities 905 638Tax base adjustment of tax penalty 5,910 114Non-repayable grants received as revenue (53) (36)50 % of received royalty revenues 0 (238)Other tax base adjustment 157 (421)100 % of research <strong>and</strong> development costs (1,212) (1,423)Tax base adjustment of the sale, contribution in kind, destruction orshortage of intangible assets <strong>and</strong> property, plant <strong>and</strong> equipmentNot realised FX difference due to not covered derivative transaction<strong>and</strong> long-term liabilities(1,442) (1,532)1,753 (2,188)Local tax recognised as an expense 0 (8,416)Interest in connection with related parties 0 (12,747)Dividend received (65,701) (51,237)Deferred loss from previous years 0 (144,741)Tax base of permanent establishment 0 (173)Tax base (186,120) 0Summary of tax base adjustmentsHUF millionDescription 2008 2009 ChangeItems increasing the tax base 191,304 134,703 (56,601)Items reducing the tax base (154,417) (407,309) (252,892)Tax base of permanentestablishment0 (173) (173)Change of tax base 36,887 (272,779) (309,666)82
<strong>MOL</strong> <strong>Hungarian</strong> <strong>Oil</strong> <strong>and</strong> <strong>Gas</strong> <strong>Public</strong> <strong>Limited</strong> <strong>Company</strong>Supplementary Notes for the year ending on 31 December 2009Solidarity surplus taxHUF millionDescription 2008 20091. Profit before taxation (223,007) 272,7792. Reduction items 67,308 64,902Dividend received 65,701 51,237Received subsidy <strong>and</strong> allowance, assets receivedfree of charge, assumed liabilityDirect cost of basic research <strong>and</strong> applied research<strong>and</strong> development394 12,2421,213 1,4233. Increasing items 1,271 951Given subsidy <strong>and</strong> allowances, assets given free ofcharge, assumed liability1,116 802Tax paid in abroad 155 148Historical value of services provided free of charge 0 14. Tax base (289,044) 208,8285. Tax base of permanent establishment 0 1736. Corrected tax base (289,044) 208,6557. Solidarity surplus tax 0 8,346Temporary surplus tax (Energy companies’ income tax)Description 2009.HUF million1. Profit before tax 272,7792. Reduction items 51,312Dividend received 51,237Received subsidy <strong>and</strong> allowance, assets received free of charge,assumed liability3. Increasing items 850Given subsidy <strong>and</strong> allowances, assets given free of charge,assumed liabilityTax paid in abroad 1484. Tax base 222,317Revenue based taxable part (%) 64.195. Corrected Tax base 142,7057. Temporary surplus tax 11,4177570283
<strong>MOL</strong> <strong>Hungarian</strong> <strong>Oil</strong> <strong>and</strong> <strong>Gas</strong> <strong>Public</strong> <strong>Limited</strong> <strong>Company</strong>Supplementary Notes for the year ending on 31 December 2009<strong>Company</strong> is subject to the income tax, as it is a mining proposition doing hydrocarbon exploration activities, crudeoils product producer <strong>and</strong> crude oil product wholesale dealer with mining tax licensee. <strong>MOL</strong> Plc owns severallicensees <strong>and</strong> has activities out of the force of the income tax law, therefore the <strong>Company</strong> is entitled to split its taxbase between taxable (64.19 %) <strong>and</strong> non-taxable (35.81 %) activities based on its sales revenue defined by theCorporate income tax law.50. Material errors of the previous years <strong>and</strong> their impactHUF millionBalance SheetOriginalamountsofpreviousAdjustments of current yearFor yearsAdjustedamountsofpreviousyear 2004 2005 2006 2007 2008 Total yearNON-CURRENT ASSETS 1,766,645 8 (21) (285) (475) (420) (1,193) 1,765,452Intangible assets 73,363 19 (6) (6) (17) (11) (21) 73,342Property, plant <strong>and</strong> equipment 344,267 (11) (15) (279) (458) (411) (1,174) 343,093Non-current financial assets 1,349,015 0 0 0 0 2 2 1,349,017CURRENT ASSETS 793,591 34 1 12 39 (439) (353) 793,238Inventories 125,009 0 0 0 1 132 133 125,142Receivables 396,825 34 1 12 38 (571) (486) 396,339Securities 103,590 0 0 0 0 0 0 103,590Cash <strong>and</strong> cash equivalents 168,167 0 0 0 0 0 0 168,167PREPAYMENTS 35,079 0 0 11 (2) 1,040 1,049 36,128TOTAL ASSETS 2,595,315 42 (20) (262) (438) 181 (497) 2,594,818SHAREHOLDERS’ EQUITY 1,376,897 4 (49) (290) (367) (846) (1,548) 1,375,349Share capital 104,519 0 0 0 0 0 0 104,519Share premium 223,866 0 0 0 0 0 0 223,866Retained Earnings 1,140,817 0 0 0 0 0 0 1,140,817Tied-up reserve 130,702 0 0 0 0 0 0 130,702Fair valuation reserve 0 0 0 0 0 0 0 0Net income for the period (223,007) 4 (49) (290) (367) (846) (1,548) (224,555)PROVISIONS 123,576 0 0 0 0 (20) (20) 123,556LIABILITIES 1,052,439 38 29 28 (71) 626 650 1,053,089Long-term liabilities 711,442 0 0 0 (4) 0 (4) 711,438Short-term liabilities 340,997 38 29 28 (67) 626 654 341,651ACCRUALS 42,403 0 0 0 0 421 421 42,824TOTAL SHAREHOLDERS’EQUITY AND LIABILITIES 2,595,315 42 (20) (262) (438) 181 (497) 2,594,81884
<strong>MOL</strong> <strong>Hungarian</strong> <strong>Oil</strong> <strong>and</strong> <strong>Gas</strong> <strong>Public</strong> <strong>Limited</strong> <strong>Company</strong>Supplementary Notes for the year ending on 31 December 2009HUF millionAdjustments of current yearTotalIncome StatementFor years2004 2005 2006 2007 2008Net sales revenue 102 94 8 23 59 286Capitalised own performance 0 0 0 0 1 1Other operating income* 0 0 0 3 12,499 12,502Material-type expenses (53) (43) 13 7 454 378Personal-type expenses 73 87 8 10 40 218Depreciation 0 6 283 (4) 452 737Other expenditures* 10 0 0 472 1,051 1,533PROFIT OR LOSS OF OPERATINGACTIVITIES 72 44 (296) (459) 10,562 9,923FINANCIAL PROFIT OR LOSS* (3) 1 2 8 (11,407) (11,399)ORDINARY BUSINESS PROFIT 69 45 (294) (451) (845) (1,476)EXTRAORDINARY PROFIT OR LOSS (49) (94) 0 0 (1) (144)PROFIT BEFORE TAXATION 20 (49) (294) (451) (846) (1,620)Income tax 16 0 (4) (84) 0 (72)PROFIT AFTER TAXATION 4 (49) (290) (367) (846) (1,548)Use of retained earnings for dividend 0 0 0 0 0 0Approved dividend <strong>and</strong> profit share 0 0 0 0 0 0NET INCOME FOR THE PERIOD 4 (49) (290) (367) (846) (1,548)* The correction in lent treasury shares’ accounting caused increase in other revenues with the amount of HUF12,496 million <strong>and</strong> in other expenditures with the amount of HUF 1,112 million meanwhile the financial profit wasdecreased by HUF 11,384 million.51. EmployeesStaff categoriesAveragestatisticalstaff(persons)2008 2009Personnel Averagetype statisticalexpenses staff(HUF million) (persons)Wages <strong>and</strong>salaries(HUFmillion)Wages <strong>and</strong>salaries(HUFmillion)HUF millionPersonneltypeexpenses(HUF million)Full-time employees 5,384 33,776 7,008 5,345 35,077 6,332- blue-collar 2,575 10,588 2,452 2,549 10,302 2,252- white-collar 2,809 23,188 4,556 2,796 24,775 4,080Other 58 1,313 466 61 882 218Total 5,442 35,089 7,474 5,406 35,959 6,55085
<strong>MOL</strong> <strong>Hungarian</strong> <strong>Oil</strong> <strong>and</strong> <strong>Gas</strong> <strong>Public</strong> <strong>Limited</strong> <strong>Company</strong>Supplementary Notes for the year ending on 31 December 200952. Board of Directors, Supervisory Board <strong>and</strong> top managementRemuneration paid to members of Board of Directors <strong>and</strong> Supervisory BoardDescriptionBoard ofDirectors2008 20098SupervisoryBoardTotalBoard ofDirectorsSupervisoryBoardHUF millionInterest on bonds 29 0 29 0 0 0Honorarium 115 76 191 122 84 206Compensation for interest onbonds16 0 16 0 0 0Bond programmecompensation323 0 323 0 0 0Total remuneration in theyear483 76 559 122 84 206The table only includes remuneration to non-executive members of the Board of Directors. The executivemembers employed by <strong>MOL</strong> Plc do not receive any additional remuneration for their participation in the Board.Fix remuneration to non-executive Board members (net 25,000 or 31,250 EUR/head/year) is paid after theAnnual General meeting.(In case the position of the Chairman is not occupied by non-executive director, it is thenon-executive Vice Chairman who is entitled for this payment.)Board members who are not <strong>Hungarian</strong> citizens <strong>and</strong> do not have permanent address in Hungary are providedwith 1,500 EUR on each Board meeting (maximum 15 times per year) when travelling to Hungary.TotalShares held by the members of the Board of Directors <strong>and</strong> Supervisory BoardDescriptionNumber of shares held2008 2009Board of Directors 466,441 421,490Supervisory Board 891 547Total 467,332 422,037Loans given to the members of the Board of Directors <strong>and</strong> Supervisory Board<strong>MOL</strong> Plc did not provide any loans, advances or guaranties to its responsible executive officers in 2008 <strong>and</strong> 2009<strong>and</strong> has no pension liabilities to its former responsible executive officers either.Incentives provided for directorsTo ensure uniformity <strong>and</strong> transparency, in addition to fixed remuneration, <strong>MOL</strong> operates an incentive scheme fordirectors, which supports commitment of the participants <strong>and</strong> by taking the <strong>Company</strong>’s profitability intoconsideration can ensure that the interests of the participants in the compensation program can coincide withthose of the shareholders.The basis of the effective incentive scheme for directors was approved by the Annual General Meeting (AGM) on23rd April 2009.86
<strong>MOL</strong> <strong>Hungarian</strong> <strong>Oil</strong> <strong>and</strong> <strong>Gas</strong> <strong>Public</strong> <strong>Limited</strong> <strong>Company</strong>Supplementary Notes for the year ending on 31 December 2009Elements of the incentive scheme:Profit sharing incentive system (based on Value added methodology)Convertible bond program is replaced by a value added methodology based profit sharing incentive from 1January 2009. The annual incentive of the Board Members – defined based on the <strong>Company</strong>’s efficiency - will bedetermined according to an economic value added methodology. The Economic Value Added will recogniseperformance as a result realized in the excess of cost of capital invested.The incentive consists of two parts: an absolute part (recognising the performance only of the given year) <strong>and</strong> anincremental part (recognising the performance of the given year compared to the average of the previous years).This methodology will increase commitment of participants thus reward the Board Members for increasingshareholder value on long-term <strong>and</strong> as a sustainable improvement.The new incentive system applies to non-executive <strong>and</strong> executive Board members as well.Incentive system for the top managementThe incentive system for the top management in 2009 included the following elements:Incentive (bonus)The maximum bonus amount is 40-100% of the annual base salary, paid in cash on the basis of the evaluationfollowing the Annual General Meeting.The elements of the incentive system include:1. Identification <strong>and</strong> evaluation of corporate <strong>and</strong> Group level key financial indicators (e.g. ROACE,operating cash-flow, Lost time injury frequency, CAPEX efficiency),2. Identification <strong>and</strong> evaluation of particular individual targets related to the responsibilities of the particularmanager in the given year.Relative performance incentiveThe basis of the relative incentive is 10% of the annual base salary, <strong>and</strong> is determined on the basis of rank ofmanager-specific performance ratings.Complex long-term managerial incentive systemThe complex long-term managerial incentive system which changes <strong>and</strong> supplements the previous, solely stockoption based system, has been implemented uniformly in the <strong>Company</strong> (Group) as of 1st January 2010. Purposeof the new incentive system is implementation of a new incentive system for key managers which corresponds tothe incentive system of the members of the Board of Directors of <strong>MOL</strong> Plc <strong>and</strong> keeps <strong>MOL</strong> group management’slong-term interest in the increase of the <strong>MOL</strong> stock price.Two incentives are employed parallelly in the new system, 50 % Incentive based on option + 50 % Profit-sharingincentive.Year 2009 was a transition period of time, when managers could decide between the previous incentive based onoption <strong>and</strong> the new complex incentive system. As of 2010 the long-term incentive should be determined for allentitled managers according to the rules of the new system.Main characteristics of the two incentives:1. Incentive stock optionPurpose of the incentive is to create the interest of <strong>MOL</strong> Group management in the increase of <strong>MOL</strong>stock price.The incentive stock option is a material incentive disbursed in cash, defined based on the realised profitarisen from the increase of <strong>MOL</strong> share stock price, calculated based on call options concerning <strong>MOL</strong>shares; it is determined as a gross benefit. The cycle time is 5 year periods starting annually.The new system identifies the previous one. There was a modification only regarding the length of thewaiting <strong>and</strong> redemption period: while in the old system a 2 year long redemption period followed the 3year long waiting period, in the new system the option can be called after 2 year waiting period.87
<strong>MOL</strong> <strong>Hungarian</strong> <strong>Oil</strong> <strong>and</strong> <strong>Gas</strong> <strong>Public</strong> <strong>Limited</strong> <strong>Company</strong>Supplementary Notes for the year ending on 31 December 20092. Profit sharing incentiveThe Profit-sharing incentive incites the long-term, sustainable increase of profitability, based on the valueadded methodology, thus ensuring that the interest of the participants of the incentive systemcorresponds with that of shareholders of <strong>MOL</strong> Plc.The Profit-sharing incentive is a cash-paid annual net bonus calculated on the basis of the increase ofthe value added. (Value added: recognises a profit performance generated in excess of the cost ofcapital invested)Since the base of the determination of one unit of the profit-sharing incentive for the given year is theaudited financial statement for the given year approved by the AGM (<strong>MOL</strong> Plc), the incentive should bedisbursed following the Annual General Meeting (<strong>MOL</strong> Plc) summoned to close the given year.Other Fringe BenefitsThese include company cars (also used for private purposes), life insurance, accident insurance, travelinsurance, liability insurance, <strong>and</strong> an annual medical check up.Remuneration of the members of the Supervisory BoardThe General Meeting held on 27 April 2005 approved a new remuneration scheme for the Supervisory Board.Under the new scheme, the members of the Supervisory Board receive remuneration of EUR 3,000/month, whilethe Chairman of the Supervisory Board receives remuneration of EUR 4,000/month. In addition to this monthlyfee, the Chairman of the Supervisory Board is entitled to receive EUR 1,500 for participation in each Board ofDirectors or Board Committee meeting, up to 15 times per annum.88
<strong>MOL</strong> <strong>Hungarian</strong> <strong>Oil</strong> <strong>and</strong> <strong>Gas</strong> <strong>Public</strong> <strong>Limited</strong> <strong>Company</strong>Supplementary Notes for the year ending on 31 December 2009Transactions with officers <strong>and</strong> management of the <strong>Company</strong>Mr. Csányi, deputy chairman of the Board of Directors is also the Chairman-CEO of OTP Bank Plc. <strong>MOL</strong> Plc. <strong>and</strong>some of its subsidiaries have contractual relationship with the members of OTP Group, including having bankaccounts <strong>and</strong> deposits, using credit card <strong>and</strong> brokerage services <strong>and</strong> obtaining loan financing. No transactionsout of the usual conduct of business has been concluded with OTP in 2009 or 2008. All of these transactions areon an arm’s-length basis.A close family member of Mr. Miklós Kamarás, member of the Board of Directors, has direct control over Roff-Petrol Bt., an operator of four fuel stations, which had HUF 84 million <strong>and</strong> HUF 78 million income from this servicein 2009 <strong>and</strong> 2008, respectively.The brother of Mr. János Major - former member of the Supervisory Board - is the managing director of CSÚCS94 Kft. which provided maintenance services to Petrolszolg Kft. amounting to HUF 20 million during 2008. In 2008there was rental service provided by <strong>MOL</strong> Plc. to CSÚCS 94 Kft. amounting to HUF 1 million. There was notransaction in 2009.Mr. Hatina, member of the Supervisory Board has an indirect interest of a Slovakian company Granitol a.s.through Slovintegra a.s. The Group has sold polyethylene to this company in 2009 <strong>and</strong> 2008 amounted to HUF3,153 million <strong>and</strong> HUF 193 million respectively, carried out on usual commercial terms <strong>and</strong> market prices.Additionally, Mr. Hatina has an indirect interest of a Slovakian company Real–H.M. s.r.o. through BAITEC Groupa.s. The Group has sold goods to this company in amount of HUF 2,614 million <strong>and</strong> HUF 5,170 million carried outon usual commercial terms <strong>and</strong> market prices during 2009 <strong>and</strong> 2008, respectively.Mr. József Molnár, Executive Vice President for Finance <strong>and</strong> his close family members are the owners of MoNa -Arbor Kft. The close family members are managing directors of the Kft, which provided services Petroszolg Kft. In2008 the Group has purchased services from the company in an amount of HUF 2.4 million carried out on usualcommercial terms <strong>and</strong> market prices.A close family member of Ms. Tünde Tóth-Zsiga, <strong>Company</strong>’s Head of Internal Audit is the majority shareholder ofL<strong>and</strong>impex Kft, which provided services to <strong>MOL</strong> Plc. In 2009 the Group has purchased services from thecompany in an amount of HUF 1.2 million carried out on usual commercial terms <strong>and</strong> market prices.53. Commitments <strong>and</strong> contingent liabilitiesCapital <strong>and</strong> contractual commitmentsThe total value of capital commitments as of 31 December 2009 was HUF 19,132 million, of which HUF 7,890million is expected to incur in 2010, HUF 2,123 million in 2011, HUF 7,160 million in 2012 <strong>and</strong> HUF 1,959 millionin 2013.Capital commitments relate to obligations to purchase of tangible <strong>and</strong> intangible assets, of which HUF 17,133million relates to the following project:• Improvement of diesel production (major facilities are as follows: build hydrocrack unit; <strong>and</strong> hydrationplant-3 , AV plant transformation, capacity increase in coke unit)Operating lease liabilities are as followsHUF millionDescription 31 December 2008 31 December 2009Liabilities due within one year 111 51Liabilities due within 2-5 years 80 29Liabilities due over 5 years 0 0Total 191 8089
<strong>MOL</strong> <strong>Hungarian</strong> <strong>Oil</strong> <strong>and</strong> <strong>Gas</strong> <strong>Public</strong> <strong>Limited</strong> <strong>Company</strong>Supplementary Notes for the year ending on 31 December 2009Authority procedures, litigationEU investigation on paraffin cartel activityThe European Commission started an investigation in April 2005, based upon the alleged cartel activity of paraffinproducers <strong>and</strong> traders in Europe. The investigation affected some ten major paraffin producers <strong>and</strong> tradersthroughout Europe. The decision was given in October 2008 <strong>and</strong> stated that the companies had harmonised theircommercial activities on the European (European Economic Area) paraffin market <strong>and</strong> participated in acontinuous cartel infringement. In case of <strong>MOL</strong> the fine was set at EUR 23.7 million which was paid by <strong>MOL</strong> inearly 2009.In relation to the above described EU Commission decision the former paraffin customers may have the right toclaim private damages from the paraffin cartel participants, which could affect <strong>MOL</strong>. Other paraffin producers thatwere also subject to the investigation are currently appealing against the decision of the European Commissionbefore the European Court of Justice. For the time being <strong>MOL</strong> is currently not able to make any legal or fiscalestimation about potential claims, if any.Proceedings initiated by Surgutneftegas OJSC (“Surgutneftegas”)Surgutneftegas brought four legal proceedings against <strong>MOL</strong>, two litigations in the Budapest Municipal Court <strong>and</strong>two judicial reviews in the Municipal Court of Budapest acting as Court of Registration.In the first claim Surgutneftegas alleges that the Resolution of the Board of Directors which in the absence of theacknowledgement of notice of the <strong>Hungarian</strong> Energy Office prevented the incorporation of Surgutneftegas intothe share register violates the provisions of relevant laws. The first hearing was held on 11 November 2009 butthe court has not yet examined the case on its merits. The next hearing is set for 5 May 2010.In the second proceeding Surgutneftegas is primarily seeking for the repeal of all the resolutions of the AGM heldon 23 April 2009 <strong>and</strong> alternatively for the repeal of the resolutions of the same AGM amending the Articles ofAssociation of <strong>MOL</strong> Plc. The first hearing was held before the Budapest Municipal Court on 13 November 2009,but the court has not yet examined the case on its merits. The next hearing is scheduled for 7 May 2010.Surgutneftegas has initiated a judicial review before the Municipal Court of Budapest, acting as Court ofRegistration in order to investigate the lawfulness of the resolution of the Board of Directors which in the absenceof the acknowledgement of notice of the <strong>Hungarian</strong> Energy Office refused the incorporation of the Surgutneftegasin the share register. The Municipal Court of Budapest, acting as Court of Registration refused the claim ofSurgutneftegas at first instance with its resolution issued on 26 January 2010. Surgutneftegas did not appeal thedecision.In the second judicial review before the same court Surgutneftegas supplemented its motion specified above(investigation of the lawfulness of the resolution of the Board of Directors when refusing the incorporation of theSurgutneftegas in the share register) claiming the Municipal Court of Budapest, acting as Court of Registration,should repeal all the resolutions of the annual general meeting held on 23 April 2009. The Municipal Court ofBudapest, acting as Court of Registration refused the claim of Surgutneftegas at first instance with its resolutionissued on 02 February 2010.Proceedings initiated by OMV Treasury <strong>and</strong> Clearing GmbH (“OMV”)One judicial review has been initiated by OMV against <strong>MOL</strong> in the Municipal Court of Budapest, acting as Courtof Registration. OMV claims that the provisions of the Articles of Association of <strong>MOL</strong> regarding its “B” shares <strong>and</strong>the 10 % voting limitation breach the requirements of Act XXVI of 2007 on golden shares <strong>and</strong> Act IV of 2006(Corporate Law). Furthermore, OMV states that it is discriminatory to waive certain entities (Magyar NemzetiVagyonkezelő Zrt. <strong>and</strong> its legal successors) from the 10 % voting limitation imposed by the Articles of90
<strong>MOL</strong> <strong>Hungarian</strong> <strong>Oil</strong> <strong>and</strong> <strong>Gas</strong> <strong>Public</strong> <strong>Limited</strong> <strong>Company</strong>Supplementary Notes for the year ending on 31 December 2009Association. The court of first instance has rejected OMV’s request. OMV has filed an appeal against thedecision.One further legal issue brought by OMV against <strong>MOL</strong> relates to a claim by OMV that a resolution approved by theAGM of <strong>MOL</strong>, which resolved to limit the number of recallable members of the Board of Directors to threemembers at any one time, is contradictory to the <strong>Hungarian</strong> Corporate Act.On this basis, OMV requested that the courts allow <strong>MOL</strong>’s AGM to take the necessary measures to correct theseissues. <strong>MOL</strong> stated that the 30-day non-extendable time period available for OMV as a shareholder present at theAGM to initiate any procedure against the resolutions of the AGM referred to above had already elapsed, <strong>and</strong> thatOMV had no other legal basis to proceed against these resolutions. The Court of First Instance accepted thesearguments <strong>and</strong> dismissed OMV’s claim. The plaintiff filed an appeal against this judgement. The Court of SecondInstance set aside the appealed judgement <strong>and</strong> referred the case back to the Court of First Instance. The Court ofFirst Instance has held two hearings but has not yet reached a decision. The next hearing before this court isscheduled for 1 June 2010.Environmental liabilities<strong>MOL</strong>’s operations are subject to the risk of liability arising from environmental damage or pollution <strong>and</strong> the cost ofany associated remedial work. <strong>MOL</strong> is currently responsible for significant remediation of past environmentaldamage relating to its operations. Accordingly, <strong>MOL</strong> has established a provision of HUF 11,964 million for theestimated cost as at 31 December 2009 for probable <strong>and</strong> quantifiable costs of rectifying past environmentaldamage. Although the management believes that these provisions are sufficient to satisfy such requirements tothe extent that the related costs are reasonably estimable, future regulatory developments or differences betweenknown environmental conditions <strong>and</strong> actual conditions could cause a revaluation of these estimates.Furthermore, the technology applied in oil <strong>and</strong> gas exploration <strong>and</strong> development activities by <strong>MOL</strong>’s <strong>Hungarian</strong>predecessor before 1976 (being the year when the act on environmental protection <strong>and</strong> hazardous waste hasbecome effective) may give rise to future remediation of drilling mud produced. This waste material has beentreated <strong>and</strong> disposed of in line with environmental regulations ruling at that time, however, subsequent changes inlegal definitions may result in further re-location <strong>and</strong> remediation requirements. The existence of such obligation,<strong>and</strong> consequently the potential expenditure associated with it is dependent on the extent, volume <strong>and</strong>composition of drilling mud left behind at the numerous production sites, which cannot be estimated currently, butis not expected to exceed HUF 3-5 billion.91
<strong>MOL</strong> <strong>Hungarian</strong> <strong>Oil</strong> <strong>and</strong> <strong>Gas</strong> <strong>Public</strong> <strong>Limited</strong> <strong>Company</strong>Supplementary Notes for the year ending on 31 December 200954. Effect of fair valuationFair valuation differences in assets <strong>and</strong> liabilities subject to fair valuationDescription2008ClosingbalanceChanges ofhistoricalvalueFinancialincomeP & L impactsFinancialexpensesHUF million2009ClosingbalanceOption for <strong>MOL</strong> share 26,787 0 25,413 0 52,200Share swap 0 0 496 0 496FX transactions 328 0 192 0 520Commodity transactions 371 0 0 69 302Non-hedge derivative transactions 27,486 0 26,101 69 53,518Positive valuation difference ofderivative transactions27,486 0 26,101 69 53,518Liability from Swap Agreement 0 (6,874) 0 12,276 5,402Fair valuation difference of otherlong-term liabilities0 (6,874) 0 12,276 5,402Option for <strong>MOL</strong> share 14,796 0 14,796 0 0Commodity transactions 125 0 0 130 255Non-hedge derivative transactions 14,921 0 14,796 130 255Negative valuation difference ofderivative transactionsDerivatives are valuated by third party (main bank).14,921 (6,874) 14,796 12,406 5,657Financial instruments subject to fair valuationDescriptionPurchasevalueValuationdifferenceHUF millionFair valueOption for <strong>MOL</strong> shares 98,073 (45,873) 52,200Share swap 0 496 496FX transactions 0 520 520Commodity transaction 0 302 302Non-hedge derivative transactions 98,073 (44,555) 53,518Positive valuation difference of derivative transactions 98,073 (44,555) 53,518Liabilities from Swap Agreement 12,438 (7,036) 5,402Other long-term liabilities 12,438 (7,036) 5,402Commodity transactions 0 255 255Non-hedge derivative transactions 0 255 255Negative valuation difference of derivative transactions 12,438 (6,781) 5,65792
<strong>MOL</strong> <strong>Hungarian</strong> <strong>Oil</strong> <strong>and</strong> <strong>Gas</strong> <strong>Public</strong> <strong>Limited</strong> <strong>Company</strong>Supplementary Notes for the year ending on 31 December 2009Open derivatives on the balance sheet dateDescriptionOption for <strong>MOL</strong> sharesTranche A**Option for <strong>MOL</strong> sharesTranche B***Subject of transactionCall <strong>and</strong> put option to<strong>MOL</strong> sharesCall option to <strong>MOL</strong>sharesTransactionvalue /volumeMaturity dateResult notsettled *Total effecton profitHUF millionExpectedeffect onCash flow5,220,000 pc. 19.03.2010 48,210 48,210 (43,805)7,677,285 pc. 23.01.2014 (3,745) (3,745) 0Share swap **** <strong>MOL</strong> share swap 5,010,501 pc. 11.07.2012 496 496 0Liability from SwapAgreement *****FX transactionsCommodity transactionsNon-hedge derivativetransactionsTotal derivativetransactionsExchange ratehedgingCommodity price riskhedge- 2016 (12,276) (12,276) 037,739,019EUR-January 2010 -September 2010January 2010 –June 2010520 520 52048 48 48- - 33,253 33,253 (43,237)- - 33,253 33,253 (43,237)* The column presents changes of fair valuation difference.** The put option of the option agreement signed on 14 March 2008 with ING Bank N.V. (“ING”) regarding1,404,217 Series “A” Ordinary shares was cash-settled on 19 March 2009, based on the strike price of USD107.90586. On 16 March 2009 <strong>MOL</strong> <strong>and</strong> ING signed a share purchase <strong>and</strong> a share option agreement. As a resultof the transactions on 19 March 2009 ING Bank N.V. became the owner of 5,220,000 “A” series <strong>MOL</strong> ordinaryshares <strong>and</strong> ING received a European put option from <strong>MOL</strong> <strong>and</strong> <strong>MOL</strong> received an American call option from INGfor these shares. The maturity is 1 year <strong>and</strong> the strike price is EUR 30.9841 per share for both options.*** The share purchase agreement as part of <strong>MOL</strong>-CEZ strategic alliance was financially closed <strong>and</strong> settled on 23January 2008. <strong>MOL</strong> sold 7,677,285 pieces of „A” series <strong>MOL</strong> shares to CEZ. <strong>MOL</strong> has an American call optionfor the shares with a strike price of HUF 20,000 per share which can be exercised within 3 years. In 2009 theparties amended the agreement <strong>and</strong> the option period was prolonged until 2014.**** On 16 April 2009 <strong>MOL</strong> <strong>and</strong> OTP entered into share-exchange <strong>and</strong> share swap agreements. Under theagreements <strong>MOL</strong> transferred 5,010,501 “A” series <strong>MOL</strong> ordinary shares to OTP on return for 24,000,000 OTPordinary shares. The expiration of the share swap agreement is 11 July 2012 until that time each party can initiatea cash or physical settlement of the deal.***** On 13 March 2006, <strong>MOL</strong> signed a share purchase agreement to sell 6,007,479 Series “A” Ordinary Sharesto Magnolia Finance <strong>Limited</strong> (“Magnolia”). Magnolia announced the sale of up to EUR 610 million of perpetualexchangeable capital securities, exchangeable into the Series “A” Ordinary Shares of <strong>MOL</strong> during the exchangeperiod to international financial investors. <strong>MOL</strong>, concurrently with the sale of ordinary shares, entered into a swapagreement in principle with Magnolia that gave <strong>MOL</strong> a call option to buy back the Series “A” Ordinary Shares of<strong>MOL</strong>. Present value of expected cash flow effect in the table above, is equal with the fair value of liability at thebalance sheet date.93
<strong>MOL</strong> <strong>Hungarian</strong> <strong>Oil</strong> <strong>and</strong> <strong>Gas</strong> <strong>Public</strong> <strong>Limited</strong> <strong>Company</strong>Supplementary Notes for the year ending on 31 December 2009Derivative transactions closed in the current yearDescriptionSubject oftransactionResultssettledfinanciallyCurrent yearResults notsettledfinancially*Total effecton profitHUF millionEffect onCash flowOption for <strong>MOL</strong> share**Call <strong>and</strong> putoption to <strong>MOL</strong>58,723 0 58,723 (71,503)sharesFX transactionsExchange ratehedging(1,365) 0 (1,365) (1,365)Commodity transactionsCommodity pricerisk hedge(1,418) 98 (1,320) (1,320)Non-hedge derivative transactions 55,940 98 56,038 (74,188)Total derivative transactions 55,940 98 56,038 (74,188)* Result not settled financially includes result of deals which are closed until the balance sheet preparation datebut the financial settlement will be after that date. Corresponding receivables <strong>and</strong> liabilities are presented withinthe other receivables <strong>and</strong> other short-term liabilities.** The call options of <strong>MOL</strong> concluded with BNP Paribas S.A. (“BNP”) on 7,552,874 Series “A” Ordinary Sharesissued by <strong>MOL</strong> have been exercised with the settlement date of 17 July 2009.The put option of the option agreement signed on 14 March 2008 with ING Bank N.V. (“ING”) regarding1,404,217 <strong>MOL</strong> Series “A” Ordinary shares was cash-settled on 19 March 2009, based on the strike price of USD107.90586. On 16 March 2009 <strong>MOL</strong> <strong>and</strong> ING signed a share purchase <strong>and</strong> a share option agreement. As a resultof the transactions on 19 March 2009 ING Bank N.V. became the owner of 5,220,000 “A” series <strong>MOL</strong> ordinaryshares <strong>and</strong> ING received a European put option from <strong>MOL</strong> <strong>and</strong> <strong>MOL</strong> received an American call option from INGfor these shares. The maturity is 1 year <strong>and</strong> the strike price is EUR 30.9841 per share for both options.Profit effect of derivative transactions in the current yearHUF millionDescriptionResults settled in the Result not settled Total profit effectcurrent yearOpen derivative transactions 0 33,253 33,253Closed derivative transactions 55,940 98 56,038Total 55,940 33,351 89,291Of which: other financial income 118,807other financial expense (29,516)55. Off-balance sheet joint <strong>and</strong> several liabilityType of liability Amount Currency Starting date Maturity date <strong>Company</strong>Joint <strong>and</strong> several31.03.2010 + 15 <strong>MOL</strong>- - 31.03.2009liabilitycalendar days Energiakereskedő Zrt.Joint <strong>and</strong> several<strong>MOL</strong>- - 17.12.2009 15.12.2012liabilityEnergiakereskedő Zrt.Comfort letter 216,225 EUR 11.02.2002 - <strong>MOL</strong> Romania PP Srl.26.11.2012 + 15 <strong>MOL</strong>TRADE-Comfort letter - - 30.11.2009calendar days Mineralimpex Zrt.Note: If the amounts or maturity dates are not indicated, the guarantee is not specified in terms of an amount ormaturity.94
<strong>MOL</strong> <strong>Hungarian</strong> <strong>Oil</strong> <strong>and</strong> <strong>Gas</strong> <strong>Public</strong> <strong>Limited</strong> <strong>Company</strong>Supplementary Notes for the year ending on 31 December 200956. Guarantees of <strong>MOL</strong> Plc, not included in the balance sheetType of liability Amount Currency Starting date Maturity date <strong>Company</strong>Parent companyguaranteeParent companyguaranteeParent companyguaranteeParent companyguaranteeParent companyguaranteeParent companyguaranteeParent companyguaranteeParent companyguaranteeParent companyguaranteeParent companyguaranteeParent companyguaranteeParent companyguaranteeParent companyguaranteeParent companyguaranteeParent companyguaranteeParent companyguaranteeParent companyguaranteeParent companyguaranteeParent companyguaranteeParent companyguarantee1,300,000,000 CZK 21.02.2009 20.02.201050,140,673.35 USD 04.12.200904.03.2010 or untilcontractualliabilities cease50,000,000 CHF 01.07.2009 30.09.201149,000,000 USD 05.11.200748,277,218.02 USD 26.10.2009 20.01.201030,800,000 EUR 22.01.2009 31.03.201115,000,000 EUR 01.01.2009 31.01.201010,000,000 EUR 30.06.2009 30.04.20108,568,199 EUR 31.10.2008 31.12.20105,000,000 USD 06.11.20071,000,0005,632,882USDRON1,500,000 EUR 17.01.20081,500,000 EUR 14.05.2009Slovnaft CeskaRepublika s.r.o.Italiana Energia eServizi S.p.A.Italiana Energia eServizi S.p.A.05.11.2012 orwhen PronodarPronodar Ltdpays the purchaseprice31.12.2032 or untilthe contractceasesItaliana Energia eServizi S.p.A.<strong>MOL</strong>Energiakereskedő Zrt.Italiana Energia eServizi S.p.A.<strong>MOL</strong>Energiakereskedő Zrt.<strong>MOL</strong>Energiakereskedő Zrt.Kalegran Ltd14.05.2007 - <strong>MOL</strong> Romania PP Srl.31.07.2010 or untilcontractualliabilities cease31.10.2011 or untilcontractualliabilities ceaseIntermol d.o.o.Intermol d.o.o.1,300,000 EUR 24.07.2009 24.07.2011 Geoinform Kft.1,000,000 USD 06.11.200731.12.2032 or untilthe contractceasesKalegran Ltd1,000,000 USD 06.11.2007 06.11.2010 Kalegran Ltd500,000 USD 15.09.2000 - <strong>MOL</strong> Romania PP Srl.400,000 USD 16.11.2009 30.06.201031,500 EUR27.03.2009 date,when rentalagreementcomes into forceGeofizikai SzolgáltatóKft.27.06.2024 <strong>MOL</strong> Romania PP Srl.- - 18.12.2001 - <strong>MOL</strong> Reinsurance Ltd95
<strong>MOL</strong> <strong>Hungarian</strong> <strong>Oil</strong> <strong>and</strong> <strong>Gas</strong> <strong>Public</strong> <strong>Limited</strong> <strong>Company</strong>Supplementary Notes for the year ending on 31 December 2009Parent companyguaranteeParent companyguaranteeParent companyguarantee- CZK* 08.02.2006 -- CZK* 08.02.2006 -- - 27.07.2009Until the contractceasesSlovnaft CeskaRepublika s.r.o.Slovnaft CeskaRepublika s.r.o.BMN Investment LtdNote: If the amounts or maturity dates are not indicated, the guarantee is not specified in terms of an amount ormaturity.* Foreign currency is not determined in the guarantee but subsidiary concluded Individual Bilateral LoanAgreement denominated in CZK with the bank.57. <strong>MOL</strong> Plc's securities offered as security deposit on 31 December 2009On 31 December 2009, <strong>MOL</strong> Plc did not have any shares placed as a security deposit.58. Evens after the preparation of Balance SheetOn 11 March 2010 <strong>MOL</strong> exercised its American call option with cash-settlement method under the optionagreement signed on 16 March 2009 with ING Bank N.V. (“ING”) regarding 5,220,000 <strong>MOL</strong> Series “A” Ordinaryshares. The settlement occured on 16 March 2010 <strong>and</strong> the strike price was EUR 30.97 per share.At the same time, <strong>MOL</strong> <strong>and</strong> ING signed a share option agreement <strong>and</strong> as a result of these transactions, INGreceived a European put option with respect to its 5,220,000 ’A’ series <strong>MOL</strong> shares <strong>and</strong> <strong>MOL</strong> received anAmerican call option regarding those shares. The maturity for both options is 1 year. The strike price for the call<strong>and</strong> put options is EUR 75.36 per share.96
Business report on <strong>MOL</strong> Plc activity of 2009<strong>MOL</strong> Plc’s business report includes the short analysis of the company's financial statements<strong>and</strong> other operational information (according to the <strong>Hungarian</strong> Accounting Regulations). Thebusiness report does not include such information, which is presented in <strong>MOL</strong> Plc’ssupplementary notes, such as the list of the events happened after the balance sheetdate. Beside this, it gives an overview about the forecasted changes of the company'sprofitability. Furthermore, the report contains information, which is crucial from the company’soperational aspect, such as the financial risk management policy of the company,shareholder structure <strong>and</strong> the analysis of the main, determining financial ratios.Financial ratios in 2009HUF bn2008 20092009/2008%Operating profit 102.3 186.3 82.1Net income (223.0) 253.0 -Investment <strong>and</strong> CAPEX 353.6 152.6 (56.8)ROACE% 9.1 21.7 138.5Operating cash flow 480.8 113.3 (76.4)Gearing % 28.7 23.9 (16.7)Despite the unfavourable external economic environment, the realised profit of <strong>MOL</strong> Plcwas HUF 186.3 bn in 2009. Operating profit improvement was caused by the considerableimpairment accounted for in 2008 in connection with the treasury shares lent, the higherother revenues in 2009, the implementation of the cost efficiency measures <strong>and</strong> the positiveeffect of the change in inventory of finished goods <strong>and</strong> work in progress compared to thebase period.Net income shows considerable improvement compared to the significant loss realised in2008, basically as a result of higher operating profit contribution <strong>and</strong> the favourable changein financial result. The main factors for the improvement in financial result were the positiveeffect of FX rates on option revaluation in 2009 <strong>and</strong> the significant impairment on treasuryshares accounted for in 2008. The latter was influenced by the financial crisis, (starting fromOctober) which affected stock exchange prices, including <strong>MOL</strong> shares, unfavourably. Furthernet income decreasing factor was the extraordinary loss realised in 2008 as a consequenceof the capital decrease (share cancellation) in 2008.<strong>MOL</strong> Plc spent HUF 152.6 bn on investments <strong>and</strong> CAPEX (including exploration spendingaccounted as costs), which decreased compared to the base period. This was basicallydriven by the realised acquisition of INA in 2008. Within the total equity <strong>and</strong> liabilities theshare of equity increased from 53.1% to 59.5% due to the favourable effect of net income.The considerable improvement of 12.6 percentage point in the ROACE value was basicallydriven by the 63.9 % growth in operating profit after tax caused by the factors detailed underNet income. The more favourable change in profit after tax improved the ratio by 5.8 %-point. Further improvement was fuelled by the drop in average capital employed by 31.5 %.The lower average capital employed was mainly caused by the decrease in receivables of2008 year, which was not reflected fully in 2008 yearly average capital employed due to thehigh closing value of 2007.1
Our gearing ratio improved from 28.7% in 2008 to 23.9%, which was caused by thedecrease in liabilities <strong>and</strong> the increase in Shareholders’ equity. The net debts declined byHUF 41.2 bn as a joint effect of the lower level of the long term loans <strong>and</strong> borrowings <strong>and</strong>cash <strong>and</strong> cash equivalents, while the Shareholders’ equity was higher by HUF 251.5 bn thanin 2008 due to the change in net income.Significant operating cash flow was realised in 2009. However, it was below the base yearlevel due to the repurchase of lent treasury shares in 2008, influencing positively the 2008cash flow via the decrease in other receivables.Overview of the Business EnvironmentChanges in the domestic <strong>and</strong> regional economic environment significantly affected thebusiness processes <strong>and</strong> financial performance of <strong>MOL</strong>Plc in 2009. The worldwide financialcrisis, which started in October, 2008 <strong>and</strong> has been continuing so far, influenced negativelythe profitability of economic operators including <strong>MOL</strong> Plc. GDP fall has slowed, from 0.6% in2008 to (6.3)% in 2009. Average consumer-price inflation was 4.2% in 2009, compared to6.1% in 2008.Average FX rates significantly increased compared to 2008. The <strong>Hungarian</strong> Forintweakened by 17.7% against the US Dollar <strong>and</strong> by 11.7% against the EUR.In 2009 the average crude oil price increased compared to the level of 2008 year-end, theaverage price reached the 61.7 USD/barrel, but lagged behind the average base year levelby 36.6 % (Brent Dtd). The yearly average Ural Blend oil price FOB Med (the determinanttype in the oil purchases of <strong>MOL</strong> Plc) was 61.2 USD/bbl, lower by 35.4 % compared to theyear 2008 (94.8 USD/bbl).The prices of the main oil products - similarly to the oil price – decreased significantly. Crackspreads, which determine the profitability of refinery, changed differently in case of thedifferent products. The gasoline crack spread was higher by 11.3 % than in previous year,while Crack spread of gasoil FOB Rotterdam decreased by 67.8%. The yearly average crackspread (FOB Rot vs. Brent) was lower by USD 85.6 USD /t in comparison to 2008.The motor fuel consumption in Hungary decreased by 0.4% in 2009, which was driven by thelower diesel consumption (down by 0.6 %). Dem<strong>and</strong> for gasoline increased by 0.2 %.Contribution of business to operating profitThe core activities of <strong>MOL</strong> Plc include exploration <strong>and</strong> production of crude oil, natural gas<strong>and</strong> gas products, refining, transportation <strong>and</strong> storage of crude oil, transportation, storagedistribution, retail <strong>and</strong> wholesale of crude oil products.Exploration <strong>and</strong> production activity includes producing oil <strong>and</strong> gas fields, <strong>and</strong> gas plants.<strong>MOL</strong> Plc operates two refineries in Hungary. The biggest one – Duna Refinery – isprocessing crude oil <strong>and</strong> its annual nominal crude oil processing capacity was nearly 8.4million tons in 2009, the actual distillation raw material refining in 2009 was 6.5 million tons.On 1 July 2001 in Tisza Refinery crude oil refining process ceased because of closing downthe distilling plant with capacity of 3 million tons. The core activities of this refinery are dieseloil desulphurisation <strong>and</strong> mixing gasoline. The Duna <strong>and</strong> Tisza Refineries are connecteddirectly to the crude oil <strong>and</strong> product pipelines of the <strong>Company</strong>. <strong>MOL</strong> Nyrt also operates abitumen manufacturing plant in Zalaegerszeg.The retail activities of refined products are based on filling stations <strong>and</strong> network operatedunder <strong>MOL</strong> br<strong>and</strong> name. Apart from motor fuel retail, the filling stations also sell non-fuelgoods (food, car care articles, top-up mobile phone cards, motorway stickers, etc.) <strong>and</strong>provide other services (automated <strong>and</strong> manual car wash, etc.). On 31 December 2009, the2
<strong>Company</strong> had 365 fuel stations in Hungary, of which 331 were operated by partners (ownedby <strong>MOL</strong> but operated by contractors selected in tenders), <strong>and</strong> 34 were operated in franchisesystem (operated with a <strong>MOL</strong> logo <strong>and</strong> product range, but not owned by <strong>MOL</strong>).The company operates via managing businesses, which are developed on the basis ofvalue-chain.A <strong>MOL</strong> Plc operating profit was HUF 186.3 bn in 2009 compared to HUF 102.3 bn in 2008.Changes of the world economic <strong>and</strong> domestic regulatory environment influenced theoperating profit of <strong>MOL</strong> Plc <strong>and</strong> business areas.Exploration <strong>and</strong> ProductionFinancial ratiosHUF bn2008 20092009/2008%Operating profit 174.6 85.5 (51.0)Operating profit (without Szőreg 109.3 85.5 (21.8)1 sales)EBITDA 193.1 104.4 (45.9)Investment <strong>and</strong> CAPEX 30.8 104.1 238.0Key operating data2008 20092009/2008%Crude oil production (kt) 743 715 (3.8)Natural gas production (m cm,2.480 2.280 (8.1)net dry)Condensate production (kt) 163 146 (10.4)LPG <strong>and</strong> other gas products (kt) 166 154 (7.2)In 2009 the divisional profit (excluding the one-off effect of Szőreg-1 reservoir sale)decreased, mainly as a result of lower crude oil price (lower by 37 % Brent price) <strong>and</strong> lowernatural gas average price in USD terms (by 25 %). The favourable effect of FX movementpartly decreased by the above mentioned negative impacts.The annual natural gas production lagged behind the previous year level by 8%, due to theweaker dem<strong>and</strong> in Hungary <strong>and</strong> natural production decrease.The reason for the drop of 4% in domestic crude oil production was the natural outputdecrease from matured fields. <strong>MOL</strong> Plc tries to compensate decreasing domestic productionwith the help of intensive exploration activity <strong>and</strong> international acquisitions.In 2009, in Hungary we classified 4 exploratory wells (Jánoshalma-D-1, Kunágota-4, Vízvár-Sekély-1<strong>and</strong> Zsáka-1) as gas producers, <strong>and</strong> 2 wells (Magyarbánhegyes-K-1, Ócsa-2) as oilproducing. 2 wells were classified as dry (Karcag-ÉK-2, Komádi-K-7). Well-test is in progressin case of Dombegyház-DNy-8 well, <strong>and</strong> Dravica-1, Potony-1 wells (drilled by co-operationwith INA). Further one unconventional well (Szabadkígyós-1) waiting for well-test.Significant CAPEX spending showed the effect of PEARL acquisition (gas <strong>and</strong>condensate fields in Curdistan).3
Refining & MarketingFinancial ratiosHUF bn2008 20092009/2008%Operating profit 29.0 26.8 (7.6)EBITDA 58.0 55.2 (4.8)Investment <strong>and</strong> CAPEX 35.8 24.3 (32.1)Key operating data*2008 20092009/2008%Total sales (kt) 9,164.0 8,552.7 (6.7)o/w: motor gasoline (kt) 1,394.6 1,370.9 (1.7)Diesel <strong>and</strong> heating oil (kt) 3,734.4 3,434.6 (8.0)naphtha (kt) 1,361.8 1,251.8 (8.1)other (kt) 2,673.2 2,495.4 (6.7)*with Retail transfer salesThe division operating profit, reflecting the unfavourable effect of economic environment,was nearly on the level of 2008. The low-level profit realisation was basically driven by thelower crack-spreads, Ural-Brent spread, crude oil discount <strong>and</strong> sales volumes, whichnegative effects were significantly compensated by the positive effect of inventory storagecosts, FX rates <strong>and</strong> the lower operating cost compared to the base period.Refinery product sales volume amounted to 8.6 Mt which was lower by 6.7 % in 2009 thanlast year. Domestic sales amounted to 6.3 Mt, slightly lagged behind the base volume, whileexport sales dropped by 18.8 % to 2.3 Mt.Despite the recession we maintained our position regarding domestic sales, while the drop ingasoil <strong>and</strong> bitumen sales are reflected in the decrease in export sales.• The motor fuel consumption in Hungary decreased by 0.4 %, but the motor fuel salesof <strong>MOL</strong> Plc increased by 2%. Increase of our motor gasoline sales was higher by3.0% despite the stagnating domestic market (0.2 %). Diesel consumption increasedon the <strong>Hungarian</strong> market, our sales exceeded the market growth by 1.1 % (26.5 kt).• Domestic <strong>and</strong> export sales of Jet A-1 amounted to 234.5 kt lagged behind the baselevel by 37.1 kt. The drop essentially occurred in domestic sales.• Total fuel oil sales was 141.8 kt in 2009, almost remained on base level (+1.5 kt),reflecting the favourable low proportion (similarly to the former period) in the totalsales.• Bitumen sales went down both on the domestic <strong>and</strong> foreign markets by 7.4 % (-43.4kt) on the whole.• The sales of PB <strong>and</strong> gas products amounted to 473.2 kt in 2009, which was nearbase level.4
Lower CAPEX spending in 2009 reflects the limited CAPEX use as it was targeted.Retail ServicesFinancial ratiosHUF bn2008 20092009/2008%Operating profit 10.7 5.6 (47.7)EBITDA 13.8 9.0 (34.8)Investments <strong>and</strong> CAPEX 10.4 11.8 13.5Key operating data2008 20092009/2008%Total sales (kt) 876.7 911.6 4,0o/w: motor gasoline (kt) 375.0 374.0 (0.3)Diesel <strong>and</strong> heating oil (kt) 488.0 523.0 7.2Other (kt) 13.7 14.6 6.6Retail division’s operating profit showed significant decrease compared to the base perioddespite <strong>MOL</strong> managed to achieve higher sales volumes <strong>and</strong> higher margin revenue in thestrong competitive environment. The positive effect of the margin revenue on operating profitwas offset by the impairment of goodwill (Tifon) accounted for as other expenditure <strong>and</strong> theincrease of internal service costs in connection with sales volumes.In Hungary (<strong>MOL</strong> Plc) our retail fuel sales volumes increased by 4% year-on-year in 2009 inspite of the economic downturn <strong>and</strong> the strong competitive environment. <strong>Gas</strong>oline salesremained stable, while diesel <strong>and</strong> LPG sales increased by 7% <strong>and</strong> 6%, respectively. Theretail market was still characterised with strong competition. Our retail fuel market share,according to MÁSZ (<strong>Hungarian</strong> Petroleum Association), increased to 36.5% in 2009 from35.7% in 2008. The ratio of fleet card sales to our total fuel sales remained stable in 2009 vs.2008. Our shop sales revenues remained stable in 2009 as the increasing sales of tobacco(14%) <strong>and</strong> pharmacy products (5%) almost offset the decrease in mobile recharges, lowerhighway-ticker sales, lower food <strong>and</strong> non food revenues.Slightly higher CAPEX spending, despite the limited CAPEX use, was due to the furtherTIFON acquisition in 2009.Components of <strong>MOL</strong> Plc’s operating profit changeAs a result of the changes in revenues <strong>and</strong> costs, operating profit was HUF 186.3 bn, higherby HUF 84.0 bn compared to the previous year, reflecting the still significant profit realisationpossibilities of the oil industry.Net sales revenue was HUF 1,856.3 bn, which decreased by 16.5% compared to 2008. Thedifference was caused by the followings:• <strong>Gas</strong> sales revenue was HUF 166.5 bn in 2009, which was lower by 9.7% compared to2008. The decrease was driven by sales prices which were lower by 8.6% in HUF term5
compared to the base level, which was further decreased by the drop in sales volumesby 1.1%.• Revenue of main refinery products with taxes were as follows: gasolines (withoutnaphtha) HUF 377.6 bn (-6.4 %), gas- <strong>and</strong> heating oils (without chemical gasoil) HUF713.3 bn (-23.6 %), fuel oils HUF 11.4 bn (-20.2 %), lubricants HUF 17.9 bn (-37.2%),bitumen HUF 47.5 bn (-16.7%), kerosene HUF 27.2 bn (-45.4%), secondary productsHUF 54.2 bn (-26.1%), naphtha <strong>and</strong> chemical gasoil HUF 141.3 bn (-23.6%), otherrefinery products HUF 27.5 bn (-29.7 %). The drop was caused by the significantlylower quoted prices <strong>and</strong> the lower sales volumes compared to 2008Operating costs (adjusted with capitalised own performance) decreased by HUF 414.2 bncompared to 2008 mainly due to the decrease of material type <strong>and</strong> other expenditures <strong>and</strong>favourable change of capitalised own performance.• The lower level of material type expenditures (HUF -334.8 bn) was primarily causedby the decrease of material cost (HUF -307.0 bn) mainly as a result of the lower costsof purchased production materials (basically due to the lower crude oil purchaseprices <strong>and</strong> lower other production material cost related to crude prices). The cost ofgoods sold slightly went up by HUF 25.7 bn, mainly as a result of the higher purchaseprice of crude oil (HUF+32.9 bn) <strong>and</strong> GHG ( HUF +19.9 bn).The increase wassignificantly reduced by the lower purchase proce of naphtha (HUF -8.7 bn) <strong>and</strong> gasproducts (HUF -7.5 bn) compared to the basic period. Further decreasing effect wasthe drop in value of services used – mainly due to lower cost of railway transport (dueto lower transportation volumes), maintenance <strong>and</strong> management cost. The cost ofother services also decreased basically as a consequence of lower by HUF 39.1 bnmining royalty caused by lower natural gas prices.• Personnel type expenditures lagged behind the previous year level to a smallextent (by 0.3 %) despite the salary increase of 3.7 %. Cost increasing effect of salaryrise was significantly reduced by the cost decreasing impact of lower averageheadcount as a result of cost efficiency measures <strong>and</strong> the cost saving on otherpersonnel- type expenses.• Changes among amortisation <strong>and</strong> depreciation basically reflected the loweramortisation of the producing wells <strong>and</strong> pipelines related to the economicallyrecoverable HC reserves. This drop was compensated by the amortisation increasingeffect of the revision on the field ab<strong>and</strong>onment provision capitalisation (HUF +1.8 bn)in 2009.• Other expenditures were lower by HUF 61.2 bn compared to 2008. The main reasonfor the decrease was the recorded impairment on the lent treasury shares in 2008(HUF -84.3 bn). The latter positive effect was reduced by HUF 10.5 bn higher taxes<strong>and</strong> duties (o/w: excise duty liability HUF +12.5 bn) <strong>and</strong> the change in provision forthe future liabilities (HUF +18.7 bn).• Value of the capitalised own performance improved our results by HUF 17.8 bn,basically as a result of the favourable changes in own produced inventories.Result on financial operation was considerably influenced by the change in externalenvironment. The significant profit realization was driven by the received dividend (HUF 51.2bn), gain on the sales of interest (HUF 28.2 bn), interest on non-current assets (HUF 46.5bn) <strong>and</strong> option revaluation (HUF 114.1 bn). These favourable effects exceeded the profitreducing impact of other factors. As opposed to the financial gain realised in 2009, in 20086
there was a financial loss mainly caused by the impairment on treasury shares, interests <strong>and</strong>securities (HUF 132.5 bn) <strong>and</strong> loss on fair valuation regarding BNP, CEZ, ING <strong>and</strong> Magnóliaoptions (HUF 205.3 bn).The loss booked among the extraordinary results was HUF 1.9 bn, compared to the loss ofHUF 116.7 bn in 2008. Extraordinary result of 2008 was caused by the redeemed <strong>and</strong>cancelled treasury shares that increased our expenditures by HUF 117.2 bn.Due to the profit before taxation, net income of the company was HUF 253.0 bn in 2009,compared to the HUF 223.0 bn loss realised in 2008 as a result of the above mentionedfactors.Main changes in Balance sheetTotal assets amounted to HUF 2,738.2 bn as at 31 December 2009, representing anincrease of 5.5% since 31 December 2008. The <strong>Company</strong>’s assets increased to a smallextent essentially due to acquisitions.Within the non-current assets the main increase occurred in financial investments (HUF230.4 bn) driven by the change in long-term investments in related entities (HUF+29.5 bn)<strong>and</strong> in other long-term participation (value of PEARL acquisition without loan assumed ofHUF 54.3 bn, OTP share purchase price of HUF 55.5 bn related to share – exchange).Further increase of HUF 78.4 bn occurred in case of long-term loans to subsidiariescompared to 2008, of which main items are: loans to subsidiaries of the internationalexploration portfolio (HUF 34.1 bn) <strong>and</strong> the loan given to INA of HUF 39.9 bn in 2009. In2009, the increase of HUF 12.7 bn in long-term loan to other investments was caused by theeffect of loan assumed in line with PEARL acquisition.The decrease in the current assets compensated by the asset increasing effect of long-terminvestments. The drop in current assets was basically influenced by the fall in cash <strong>and</strong> cashequivalents (HUF -72.3 bn), which was compensated by the impact of receivable rise (HUF+10.1 bn) compared to the previous year. In the receivable rise, in excess of the optionrevaluation (HUF +25.9 bn), trade receivables (HUF + 5.7 bn), <strong>and</strong> receivables from relatedparties (HUF + 38.7 bn, of which the trade receivable increase was HUF 29.7 bn) were thedeterminants. The increase was considerably moderated by the lower other receivablesgenerated from the decrease of HUF 68.3 bn in booked value of lent treasury shares. Theinventory level was lower by HUF 11.0 bn compared to the basic year which was essentiallydriven by the lower inventory volume.The change in the prepayments basically reflects the difference in deferred income relatedto the subsequent settlement in connection with gas business sale between 2008 <strong>and</strong> 2009.(2008: HUF +6.4 bn, 2009: there was not any deferred income)The shareholders’ equity went up basically as a result of the net profit for 2009. The drop inliabilities moderated the effect of shareholders’ equity increase. Within the liabilities thelong-term debts amounted to HUF 378.6 bn in 2009 compared to value of HUF 512.5 bn in2008 reflecting the impact of repayments. This decrease was reduced by the increase inshort-term debts (HUF +18.7 bn), short-term loan from subsidiaries (HUF 16.1 bn), VAT(HUF+9.6 bn) <strong>and</strong> excise duty (HUF +4.3 bn). The provision increase basically reflects therise of HUF 4.1 bn in provision for field ab<strong>and</strong>onment <strong>and</strong> field suspension(beyond a year)besides the provision for GHG emission (HUF +4.7 bn).The company's expectations in the following period2010 will still be effected by the financial/economic crises. The hectic changes of the externalenvironment increased the uncertainties further. <strong>MOL</strong> Group was able to respond quickly tothe environmental challenges <strong>and</strong> crisis in October 2008, made decisions <strong>and</strong> with these7
ensured its financial stability <strong>and</strong> cash-flow position in 2009. The main purpose also for 2010is to maintain financial stability <strong>and</strong> cash-flow position beside the changing environment <strong>and</strong>volatile presumptions. The achievement of this target requires huge effort from the companysince it is difficult to keep up the level of sales volumes in 2010 as a result of the economiccrisis <strong>and</strong> the possible increase in sales volumes means considerable challenge. Thelaunched cost decreasing actions <strong>and</strong> efficiency improvement projects contributessignificantly to the achievement of our purpose.In the framework of the related strategy revision, we’ll emphasise the optimization of thebusiness portfolio, considering the INA partnership <strong>and</strong> its integration to <strong>MOL</strong> Group.Cash flowOperating cash flow of the company amounted to HUF 113.3 bn versus the 2008 basevalue of HUF 480.8 bn. The considerable drop was driven by the adjusted profit which waslowerthan the base by HUF 88.1 bn. The adjustments related to non-cash items(depreciation, reserve change, impairment change) <strong>and</strong> non-operating cash flow items (gainfrom sold non-current assets).However, the significant change in current assets (without debtors, cash <strong>and</strong> cashequivalents) had a key effecton the cash flow decrease. This change was basically causedby the cash flow improving effect of the reversal of treasury shares lent, which wereaccounted for as other receivables in 2008. Further fall in cash flow was caused by thenegative effect (HUF 71.5 bn) of the change in working capital (inventories, debtors,creditors) compared to the base period. The latest was impacted by the higher debtors dueto the greater product sales price, which was compensated by the cash flow improving effectof the lower inventory level.Investments <strong>and</strong> CAPEXCapital expenditures of <strong>MOL</strong> Plc (including exploration costs) were HUF 152,6 bn in year2009 versus HUF 353.6 bn in 2008. The lower spending compared to the previous year – ofwhich the determinant factor was the INA acquisition - is detailed segments by segments asfollows:• At Exploration <strong>and</strong> Production division, CAPEX spending was HUF 104.1 bn that ishigher than previous year by HUF 73.3 bn due to the acquisition in Kurdistan (PearlCo. HUF 72.6 bn).• At Refining <strong>and</strong> Marketing division’s expenditures (HUF 24.3 bn) were lower than lastyear’s by HUF 11.5 bn because the Refinery key-project (VGO Hydrocrack) waspostponed <strong>and</strong> other maintenance type works were rescheduled in line with the strictCAPEX program in 2009.• At Retail division CAPEX spending in 2009 (HUF 11.8 bn) was higher than last yearby HUF 1.4 bn due to two opposite effects: Croatian acquisition of TIFON (HUF 8.1bn) which was offset by the reduction in network development <strong>and</strong> reconstructionworks in 2009.• At Management <strong>and</strong> Sevices division CAPEX was HUF 4.9 bn which was lower thanin 2008 by HUF 261.1 bn due to last year’s acquisitions (e.g. INA HUF 227.3 bn). Thistrend is reinforced by the strict CAPEX program in 2009.The principles of fair valuation on financial instrumentsThe <strong>Company</strong> applies the principle of fair valuation on financial instruments for tradingpurposes <strong>and</strong> derivatives for hedging <strong>and</strong> trading (non-hedging) purposes in order to8
harmonise its practice with regulations of the European Community. The Act allows theapplication of fair valuation to financial instruments available for sale, but the <strong>Company</strong> doesnot make use of this opportunity.Financial instruments are categorized based on the intention of the management taking intoconsideration the requirements of the Accounting Act.The <strong>Company</strong> applies fair valuation only to those financial instruments <strong>and</strong> financial liabilities<strong>and</strong>/or transactions in case of which the fair value can be reliably determined.The fair value is determined on the basis of the following (the list also represents the order incase there is more than one way to determine the fair value of a given instrument):• stock exchange quote,• over-the-counter market price, which reliably indicates the partner’s evaluation (mark–to-market value) or arm’s length agreements or supported by previous transactions<strong>and</strong> offers at the time of evaluation,• value calculated based on the market price of the components of the financialinstrument;• the value calculated by valuation procedures generally used in money marketevaluations (e.g. discounted present value of cash flows), using external premises,based on the market values on the balance sheet cut-off date.If it is not possible to determine the fair value based on the above methods, than fair valueshould be measured using other valuation techniques. In this case the company shoulddemonstrate that the valuation method used for calculating the fair value is suitable for thispurpose.In case of deliverable derivative transactions, the subject of the deal different from financialinstruments (goods, PP&E) the accounting treatment of sale of goods shall be applied. Allsettlement transactions <strong>and</strong> transactions closing with delivery of financial instruments aremeasured at fair value either they were designated as hedging or individual derivativetransaction.Derivative transaction should be accounted as hedge if the conditions of the transaction meetthe requirements of Accounting Act <strong>and</strong> also in line with the provisions of IAS 39 (there isdesignated hedging relationship, hedge documentation exists, hedge effectiveness can bedemonstrated). Transactions with characteristics of hedging instruments but without meetingthe requirements of IAS 39 are accounted as st<strong>and</strong>alone derivatives.Hedging instruments are designated at inception <strong>and</strong> matched with the hedged item <strong>and</strong>associated risks.Financial instruments in the Balance SheetFinancial instruments in the balance sheet include investments, other non-current assets,trade receivables, securities, other current assets based on contractual rights, cash <strong>and</strong> cashequivalents, short-term <strong>and</strong> long-term debt, other long-term liabilities, trade <strong>and</strong> otherpayables also based on contractual commitments. Derivatives are presented as positive ornegative valuation difference of derivative transactions.Carrying amounts <strong>and</strong> fair values of the financial instruments as of 31 December 2009 <strong>and</strong>2008 are the following:9
Carrying amount2008 2009HUF million HUF millionFinancial assetsNon-current financial investments 1,349,015 1,579,428Long-term investments 1,060,793 1,090,286Long-term loans to related parties 287,718 366,150Other long-term investments 432 110,215Long-term loans to other investments - 12,705Other long-term loans 72 72Receivables 374,656 388,209Trade receivables 76,583 82,307Receivables from related parties 177,429 216,159Receivables from other investments 46 -Other receivables (excluding receivables against tax <strong>and</strong> otherauthorities) 93,112 36,225Positive valuation difference of derivative transactions 27,486 53,518Securities 103,590 122,498From which: Treasury shares 103,407 122,278Cash <strong>and</strong> cash equivalents 168,167 95,905Financial liabilitiesLong-term liabilities 711,442 581,996Liabilities from bonds issued 198,585 203,130Liabilities from other long-term loans 512,455 378,577Other long-term liabilities 402 289Short-term liabilities 289,496 318,423Short-term borrowings - -Short-term loans 79,434 98,149Advances from costumers 1,572 1,141Trade payables 111,575 104,806Short-term liabilities to related parties 75,417 102,623Short-term liabilities to other investments 145 3Other short-term liabilities (excluding payables to tax <strong>and</strong> otherauthorities) 6,432 6,044Negative valuation difference of derivative transactions 14,921 5,65710
Financial instruments presented at fair value are the following:31 December 2009Initial valueHUF millionValuationdifferenceHUFmillionFair valueHUFmillionOption for treasury shares (1) - 48,210 48,210Option for treasury shares (2) 98,073 (94,083) 3,990Share swap (3) - 496 496Foreign exchange forward- 520 520transactionsCommodity price transactions - 302 302Positive valuation difference of derivative transactions 53,518Liability from swap agreement (4) 12,438 (7,036) 5,402Other long-term liabilities 5,402Commodity price transactions - 255 255Negative valuation difference of derivative transactions 5,657(1) Options on treasury sharesOn 14 March 2008 <strong>MOL</strong>, BNP Paribas SA (“BNP”) <strong>and</strong> ING Bank N.V. (”ING”) signed anagreement whereby <strong>MOL</strong> has appointed ING to exercise its call option on 1,404,217 “A”series <strong>MOL</strong> ordinary shares held by BNP, pursuant to which ING purchased these sharesfrom BNP. Following completion of the transaction, <strong>MOL</strong> received an American call option on1,404,217 “A” series <strong>MOL</strong> shares from ING, <strong>and</strong> ING received a European put option on thesame number of <strong>MOL</strong> shares from <strong>MOL</strong>. The maturity for both options is 1 year <strong>and</strong> theexercise price is USD 107.91 per share.On 19 March 2009 the European put option was cash-settled, with conditions specified in theagreement. In parallel <strong>MOL</strong> <strong>and</strong> ING signed a share purchase <strong>and</strong> share option agreementon 5,220,000 “A” series <strong>MOL</strong> shares. As a result of the transaction <strong>MOL</strong> received anAmerican call option <strong>and</strong> ING received a European put option on the same number of <strong>MOL</strong>shares. The maturity for both options is 1 year <strong>and</strong> the exercise price is EUR 30.98 pershare.(2) Options on treasury sharesTo strengthen the strategic alliance between <strong>MOL</strong> <strong>and</strong> CEZ, CEZ purchased 7,677,285pieces of “A” series <strong>MOL</strong> shares on 23 January 2008 from <strong>MOL</strong>. <strong>MOL</strong> also purchased anAmerican call option for the shares with a strike price of HUF 20,000 per share which can beexercised within 3 years. In 2009 the terms of the call option has been renegotiated by theparties, extending it to 2014.(3) Share swapOn 16 April 2009 <strong>MOL</strong> <strong>and</strong> OTP entered into a share-exchange <strong>and</strong> share-swapagreements. Under the agreements <strong>MOL</strong> transferred 5,510,501 “A” series <strong>MOL</strong> ordinaryshares to OTP on return for 24,000,000 OTP ordinary shares. The expiration of the shareswapagreement is in 11 July 2012 until that time each party can initiate a cash or physicalsettlement of the deal.11
(4) Liability from swap agreementOn 13 March 2006, <strong>MOL</strong> Plc signed a share purchase agreement to sell 6,007,479 Series “A”Ordinary Shares to Magnolia Finance <strong>Limited</strong> (“Magnolia”). Magnolia announced the sale ofup to EUR 610 million of perpetual exchangeable capital securities, exchangeable into theSeries “A” Ordinary Shares of <strong>MOL</strong> during the exchange period to international financialinvestors. <strong>MOL</strong>, concurrently with the sale of ordinary shares, entered into a swap agreementin principle with Magnolia that gave <strong>MOL</strong> a call option to buy back the Series “A” OrdinaryShares of <strong>MOL</strong>.Financial risk management policiesRisks are not identified for <strong>MOL</strong> Plc itself, but for the <strong>MOL</strong> Group as a whole, hence thefinancial risk management tasks are centralized at <strong>MOL</strong> Group level. iThe measurement ofrisks are performed by using the Monte Carlo simulation model. A monthly Financial RiskReport is submitted to the senior management.As a general approach, risk management considers the business as a well-balancedintegrated portfolio <strong>and</strong> does not hedge particular elements of its commodity exposure.Therefore, <strong>MOL</strong> actively manages its commodity exposures for the following purposes only:• Corporate Level Objectives – maintenance of financial ratios, protection against largecash transaction exposures etc.• Business Unit Objectives – To reduce the exposure of a Business Unit’s Cash-Flow tomarket price fluctuations in case of changes from the normal course of business (ex:planned refinery shutdowns)<strong>MOL</strong> follows two different strategies based on the level of Net Gearing. In the two scenarios,Risk Management focuses on the followings:• In a High Gearing situation, the prime objective of risk management is to reduce theprobability of breaching debt covenants, where a breach would seriously impair thecompany’s ability to fund its operations.• In Low Gearing status, the focus of risk management shall be directed more towardguarding of shareholder value by maintaining discipline in CAPEX spending, ensuringrisk-aware project selection.In line with <strong>MOL</strong>’s risk management policy, no speculative transactions are allowed. Anyderivative transaction the company may enter is under ISDA (International Swaps <strong>and</strong>Derivatives Association) agreements.Key ExposuresGroup Risk Management identifies <strong>and</strong> measures the key risk drivers <strong>and</strong> quantifies theirimpact on the group’s performance. <strong>MOL</strong> uses a bottom-up model for monitoring the keyexposures. According to the model, the diesel crack spread, the dated Brent price <strong>and</strong>gasoline crack spread have the biggest contribution to the cash-flow volatility. The impact of12
the FX rates through the key refined <strong>and</strong> petrochemical products on the cash-flow volatility isalso significant. The top 10 risk drivers explain cca 80% of the total cash-flow volatility.Commodity Price Risk Management<strong>MOL</strong> Group as an integrated oil <strong>and</strong> gas company is exposed to commodity price risk onboth the purchasing sales sides. The main commodity risks stem from long crude oil positionto the extent of its group level production, long refinery margin position to the extent of therefined product volumes <strong>and</strong> long petrochemical margin position.<strong>MOL</strong> can enter into hedging transactions for the above mentioned Corporate LevelObjectives <strong>and</strong> Business Unit Objectives purposes only.In 2008 <strong>MOL</strong> concluded short term commodity swap transactions for inventory hedgingpurposes. These transactions are initiated to reduce exposure to potential price movementsduring the refinery maintenance periods.As of 31 December 2009 the fair value of the open commodity derivative transactions wereHUF 302 million asset <strong>and</strong> HUF 255 million liability.As of 31 December 2008 the fair value of the open commodity derivative transactions wereHUF 371 million asset <strong>and</strong> HUF 125 million liability.Foreign Currency Risk ManagementThe <strong>Company</strong>’s oil business results in a long USD cash flow exposure, while itspetrochemical business in a long EUR cash flow exposure. At group level, the <strong>Company</strong> hasa net long USD, long EUR <strong>and</strong> short HUF, short SKK, short RUB, short HRK, short RONoperating cash flow position.When <strong>MOL</strong> is in high gearing status, the <strong>Company</strong> follows the basic economic currency riskmanagement principle that the currency mix of the debt portfolio should reflect the netoperating cash flow position of the Group.The <strong>Company</strong> may use cross currency swaps to adjust the currency mix of the debt portfolio.As of 31 December 2008 <strong>and</strong> 2009 there were no open cross currency transactions.The <strong>Company</strong> classifies its forward exchange contracts <strong>and</strong> currency exchange optionseither as fair value hedges, in case of debts, as cash-flow hedges in case a designatedhedging relationship exists or as st<strong>and</strong>-alone derivatives <strong>and</strong> carries them at fair value.As of 31 December 2009 the fair value of open currency exchange forwards was an asset ofHUF 520 million.As of 31 December 2008 the fair value of open currency exchange options was an asset ofHUF 328 million.Interest rate risk managementAs an energy company, <strong>MOL</strong> has limited interest rate exposure. The ratio of fix/floatinginterest debt is determined by the Board of Directors on the basis of the suggestion of GroupRisk Management from time to time, based on international best practice.13
As result of the successful 750M EUR Bond transaction, the fixed portion of the total debtincreased substantially. As of 31 December 2009 <strong>and</strong> 2008, 27.9% <strong>and</strong> 24.1% of the<strong>Company</strong>’s debt was at fixed rates respectively.The <strong>Company</strong> may use interest rate swaps to manage the relative level of the interest raterisk effect on its cash flow associated with floating interest-bearing borrowings.As of 31 December 2009 <strong>and</strong> 2008, there was no open interest rate swap transaction.Sensitivity analysis for key exposuresIn line with the international practice, Group Risk Management prepares sensitivity analysis.According to the Financial Risk Management Model, the key sensitivities on <strong>MOL</strong> Grouplevel are the following:Brent crude oil price, HUF/USD <strong>and</strong> HUF/EUR exchange rates,refining crack spread.Other ExposuresCredit riskThe <strong>Company</strong> provides a variety of customers with products <strong>and</strong> services, none of whom,based on volume <strong>and</strong> creditworthiness, present significant credit risk. <strong>Company</strong> proceduresensure that sales are made to customers with appropriate credit history <strong>and</strong> do not exceedan acceptable credit exposure limit.Liquidity riskThe <strong>Company</strong> policy is to maintain sufficient cash <strong>and</strong> cash equivalents or have availablefunding through an adequate amount of committed credit facilities to cover the liquidity risk inaccordance with its financing strategy. The amount of undrawn credit facilities of the<strong>Company</strong> as of 31 December 2009 consists of the following:HUFmillionLong - term loan facilities available (general corporate purpose loan facilities) 393,801Short - term facilities available 21,683Total loan facilities available 415,484__________The main pillars of <strong>MOL</strong> Group’s long-term funds are as follows, the EUR 1.5 billion, EUR825 million <strong>and</strong> EUR 700 million syndicated multi-currency revolving loan facility, <strong>and</strong> theEUR 750 million Eurobond raised by <strong>MOL</strong> Plc. <strong>and</strong> USD 1 billion syndicated multi-currencyrevolving loan facility taken by INA.Tanking into account the financial market situation <strong>MOL</strong> started its refinancing process of theEUR 2.1 billion syndicated multi-currency revolving loan facility maturing in 2010. InNovember, 2009 <strong>MOL</strong> signed a EUR 450 million forward start revolving facility agreement,which was increased to EUR 525 million in December. The facility will be available for the<strong>Company</strong> from 1 October 2010.14
The tenor of the Forward Start Loan is 18 months which can be extended by 6 months uponto <strong>MOL</strong>’s request. As part of this transaction EUR 600 million was cancelled out of theEUR 2.1 billion facility agreement, because it was largely undrawn.As the diversification of funding is a high priority for <strong>MOL</strong>, it initiated negotiations withalternative lenders about raising further funding.On 17 June 2009 <strong>MOL</strong> signed an 8 year, EUR 200 million loan agreement with EBRD(European Bank for Reconstruction <strong>and</strong> Development) to finance the strategic <strong>and</strong>commercial gas storage project.The existing bank facilities ensure both sufficient level of liquidity <strong>and</strong> financial flexibility forthe Group.The system of the company’s internal auditThe Financial <strong>and</strong> Risk-management Committee of the Board is responsible for thecompany’s risk management <strong>and</strong> its supervision by receiving regular information on theefficiency of the risk management processes, making the necessary steps to determine thekey risk areas, <strong>and</strong> determining the principles on the internal control systems.In 2006 the General Assembly formed an Audit Committee from the independent members ofthe Supervisory Board. The Audit Committee performs its tasks as it is required by thecorporate law.The internal control system created by the management <strong>and</strong> described in Operational &Organisational Rules ensures the h<strong>and</strong>ling of the risks associated with the company’sactivities <strong>and</strong> achieving the corporate goals. It is the management’s responsibility to create<strong>and</strong> maintain the control system.The company formed an independent internal audit function that reports to the Financial <strong>and</strong>Risk-management Committee of the Board <strong>and</strong> informs the Audit Committee at the sametime. The Internal Audit function reports the Financial <strong>and</strong> Risk-management Committee <strong>and</strong>the Audit Committee at least quarterly on the application of the internal controls. The Boardidentifies the potential control weaknesses <strong>and</strong> revises the related control activities using thereports submitted by Internal Audit. Internal Audit operates by an approved audit plan. Theaudit plan is proposed by the Financial <strong>and</strong> Risk-management Committee <strong>and</strong> it is approvedby the Board.Research <strong>and</strong> development<strong>MOL</strong> Plc deals with technology <strong>and</strong> asset development, product development, environmentalprotection, <strong>and</strong> patent - invention development within the frameworks of research <strong>and</strong>development. <strong>MOL</strong> Plc spent HUF 1.5 bn on these developments in 2009. (2008 yearlyspending amounted to HUF 1.4 bn)Sustainable Development (SD) & Health, Safety <strong>and</strong> Environment (HSE)Two years ago our <strong>Company</strong> successfully <strong>and</strong> organically integrated the principles ofSustainable Development into its operations, <strong>and</strong> these requirements are present in thecorporate processes, targets, decision-making mechanism, <strong>and</strong> last but not least there is aprofessional team in our organisational structure that can coordinate <strong>and</strong> support theseactivities. Every business unit has now its own annual sustainability action plan as a clearresult of the enhanced practice in this field. We have been participating in the SAMBenchmarking program for years, <strong>and</strong> we have been reporting our performance in15
accordance with the so-called GRI (Global Reporting Initiative) st<strong>and</strong>ard. The Swiss SAM(Sustainable Asset Management) prepares the analysis relating to the Dow JonesSustainability Index, <strong>and</strong> it has recently published its 2010 Sustainability Yearbook where<strong>MOL</strong> was the sole company from Central <strong>and</strong> Eastern Europe listed among the leadingglobal companies <strong>and</strong>, based on its results, won the „Best Developing <strong>Company</strong>” award inthe field of sustainability. Our report can meet the criteria for „B+” category according to GRI,<strong>and</strong> we have set the target to reach the „A+” level for 2010.In addition to integrating SD into our operations our key priority in the recent years has beenthe HSE cultural change program, eliminating chances for default or error due to humanfactors in order that unwanted events can be avoided or prevented. We have closed the„Safe Workplaces” project specifically designed for this area, <strong>and</strong> we, of course, maintain<strong>and</strong> further develop the results using our own internal resources. 2009 <strong>and</strong> rather 2010 was<strong>and</strong> will be dedicated to implement st<strong>and</strong>ardised HSE risk management <strong>and</strong> the relevantmethodologies. We have specifically designed <strong>and</strong> launched the COMPASS(Comprehensive Risk Assessment) project where we have developed ten internationallyrecognised methodologies that can cover all risk assessment areas related to workplaces,technologies, processes <strong>and</strong> the environment. Based on the identified HSE risks we willprepare a so-called risk map, which will present the most significant HSE risks with a list ofpriority. With the help of this map we will be able to plan our projects <strong>and</strong> maintenanceoperations related to safety, environment <strong>and</strong> health protection along a structure.Simultaneously we continued implementing the „Process Safety Management” project also in2009, <strong>and</strong> as a result detailed technological risk assessments were prepared in severaloperating units also in technologies, which are not subject to the SEVESO directive, <strong>and</strong> thisis also a complex management system aiming at keeping the high-risk processes undercontrol <strong>and</strong> managing eventually occurred changes, etc.Analysis has clearly proved that the HSE risk of our employees can emerge not only inconnection with the conditions at workplaces, but inappropriate way-of-life can also <strong>and</strong>organically contribute to unfavourable effects. In 2006 we launched the „Take a Step for yourHealth - STEP” health promotion program with the purpose to reduce the relevant risk factorsbased on voluntary participation. As a result of introducing new <strong>and</strong> new program elementswe reached 56.4 % participation rate by 2009 <strong>and</strong> we could detect some improvements alsoin the absentee rate. We have received several awards <strong>and</strong> prizes with this health promotionprogram or its various elements in 2008 <strong>and</strong> 2009.As a result of our environmental protection programs we could reach a level in 2009 whenthere was no overrun in legal requirements of emission into the air or effluents into surfacewaters, <strong>and</strong> we could minimise the risk of polluting the soil <strong>and</strong> groundwater as a result ofongoing storage tank reconstruction projects. Our responsibility also covers the protection ofthe global environment when we implement various actions in order to ensure compliancewith the laws <strong>and</strong> regulations for reducing carbon dioxide emission with the purpose tomitigate the so-called greenhouse effect, as widely known in the society. We have spentsignificant funds for implementing the system for measuring the carbon dioxide emission,<strong>and</strong> thus we could secure the basic conditions for a certified CO2 report.We carried on the elimination of cases of past pollution also in 2009, <strong>and</strong> we terminateddeposits of hazardous wastes <strong>and</strong> went on in our operations to remediate pollution to soil<strong>and</strong> groundwater. <strong>MOL</strong> spent 1.25 bn HUF in 2009 for environmental liabilities arising frompast operation.Our responsibility also covers the range of our products, as implementation of the REACHprogram can guarantee a safer utilisation or consumption of such products, <strong>and</strong> it also helpsus in better underst<strong>and</strong>ing of parameters, qualities <strong>and</strong> hazards embedded in these products.16
In 2008 we renewed the basis of the corporate HSE management system, <strong>and</strong> the newstructure can better fit to <strong>MOL</strong> new regulatory concept, <strong>and</strong> its revised content can betterpresent <strong>and</strong> follow the requirements applied in the major global oil companies. In 2008 wealso prepared <strong>MOL</strong> HSE Guideline, offering comprehensive expectations for the entireGroup, as well as we identified 21 HSE topics described in details in the relevant specificgroup level procedures. In 2009 we issues <strong>and</strong> introduced the said 21 group-levelregulations, <strong>and</strong> every business unit annually measures its compliance applying a selfassessment method.HSE performance in figures:We are happy <strong>and</strong> proud to report that there was no fatal accident involving either <strong>MOL</strong> orsub-contractor’s employees, <strong>and</strong> the sub-contractor pre-qualification audit system introducedin <strong>MOL</strong> could obviously contributed to this result.Despite the tendency improving for some years the Lost Time Injury Frequency (LTIF) wasless favourable in 2009, as in 2008 we had 1.08 accident per one million working hours, thisindex increased to 1.73 in 2009. However, most of the accidents were not of technologyorigin as a result of the continuous audits <strong>and</strong> corrective actions. In 2010 we dedicatedspecial attention to these events, <strong>and</strong> we are striving for preventing <strong>and</strong> avoiding such eventsby improving the employees’ awareness <strong>and</strong> organising safety campaigns.At the same time we were successful in reducing the Road Accident Rate (RAR) <strong>and</strong> theindex was 0.72, outst<strong>and</strong>ing in benchmarking.The number of occupational health diseases in 2009 dropped to zero versus one (1) in 2008figure, <strong>and</strong> this is fully in line with the relevant corporate target. We maintain high level ofoccupational health system through preparing professional protocols <strong>and</strong> ensuring regularprofessional supervision for the doctors employed for such services.The number of fire events showed stagnation in 2009 as we reported 8 fires in 2008 versus 7in 2008, nevertheless the value involved in these events was significantly higher. Wereviewed the status of fire protection actions in Hungary <strong>and</strong> identified the need for furtherlocal fire brigades in addition to the existing units in Százhalombatta <strong>and</strong> Tiszaújváros. Thuswe established new fire fighting units at Algyő <strong>and</strong> Komárom controlled <strong>and</strong> operated by FERFire Protection Ltd. (a <strong>MOL</strong> subsidiary), which are capable of providing adequate fireprotection for our facilities located in the relevant regions.The number of effluents exceeding 1 m3 increased, as we had 17 events in 2009 versus 11in 2008. We, of course, always start remediation actions immediately following the event(mostly leakage of pipeline) in order that any eventual load onto the environment can beminimised.17
Information on shareholders structure, treasury sharesShareholder structureNumber <strong>and</strong> nominal value of shares issued by <strong>MOL</strong> Plc, categorised by share type:Owner"A" series sharesNumber of shares (pcs.)"B" seriesshares"C" seriessharesTotal nominalvalue(HUF mn)Share ofownership (%)2008 2009 2008 2009 2008 2009 2008 2009 2008 2009MNV Zrt. 33 33 1 1 0 0 * * * *Foreign institutional<strong>and</strong> private investors76,134,650 81,633,580 0 0 0 0 76,135 81,634 72.84 78.10Of which:Surgutneftegas OJSC * 22,179,488 0 0 0 0 * 22,179 * 21.22Bayericshe Hypo-undVereinsbank AG.17,007,802 * 0 0 0 0 17,008 * 16.27 *Societe Generale 4.601.059 * 0 0 0 0 4.601 * 4.40 *CEZ MH B.V. 7,677,285 7,677,285 0 0 0 0 7,677 7,677 7.35 7.35Oman <strong>Oil</strong> Budapest<strong>Limited</strong>BNP ParibasArbitrage S.N.C.7,316,294 7,316,294 0 0 0 0 7,316 7,316 7.00* 7.007,600,583 * 0 0 0 0 7,601 * 7.27 *Magnolia Finance Ltd. 6,007,479 6,007,479 0 0 0 0 6,007 6,007 5.75 5.75ING Bank N.V.** * 5,220,000 5,220 4.99Crescent PetroleumInternational***3,161,116 3,161 3.02Dana gas PJSC*** 3,161,116 3,161 3.02Domestic institutional<strong>and</strong> private investorsOf which:19,602,436 15,450,134 0 0 0 0 19,602 15,450 18.76 14.76OTP Bank Nyrt. 8,857,438 6,707,832 0 0 0 0 8,857 6,708 8.47 6.42<strong>MOL</strong> Nyrt treasuryshares8,781,365 7,434,737 0 0 578 578 8,782 7,435 8.40 7.11Total 104,518,484 104,518,484 1 1 578 578 104,519 104,519 100.00 100.00The nominal value of series "A" <strong>and</strong> "B" shares is HUF 1,000, <strong>and</strong> of series "C" shares is HUF 1,001.Due to the higher nominal value, series "C" shares entitle their holders to 1.001 (one point onethous<strong>and</strong>th) of the votes, in contrast with the right to have one vote for series "A" shares.MNV Zrt. (<strong>Hungarian</strong> State Holding <strong>Company</strong> beforeh<strong>and</strong> ÁPV Zrt.) has one share series "B", to whichpreferential voting right is attached. (MNV Zrt.’s registered office: 1133 Budapest, Pozsonyi út 56.)* The owners had 0 % or less than 5 % interest in the given period.18
** According to the announcement of ING Bank N.V. because of its indirect ownerships its controlledvoting rights are above 5 percent.*** Crescent Petroleum <strong>Company</strong> International <strong>and</strong> Dana <strong>Gas</strong> PJSC announced that they are partiesacting in concern.Data of accentuated investors with ownership above 5% in 31 December 2009Name of the <strong>Company</strong> Seat Voting rights(%)Correctedownershipdue to ArticleofAssociation(%)Surgutneftegas OJSC628415 Surgut, TyumenskayaOblast Ul. Kukuyevitskogo 1.22.85 10.00CEZ MH B.V.Veena 340, 3012NJRotterdam, The Netherl<strong>and</strong>s7.91 7.91Oman <strong>Oil</strong> Budapest Ugl<strong>and</strong> House, Gr<strong>and</strong><strong>Limited</strong>Cayman, KYI-11047.54 7.54OTP Bank Plc1051 Budapest, Nádor utca16.6.91 6.91Magnolia Finance Ltd.22 Grenville Street, St Heiler,Jersey, Channel Isl<strong>and</strong>s, JE46.19 6.198PXING Bank N.V.Bijlmerplein 888, AmsterdamZuidoost, 1102 MG, The5.38 5.38Netherl<strong>and</strong>sCrescent Tower, Buhaira,Crescent Petroleum20th. Sharjah, United Arab<strong>Company</strong> International*Emirates3.26 3.26Crescent Tower, Buhaira,Dana <strong>Gas</strong> PJSC*20th. Sharjah, United Arab3.26 3.26Emirates* Crescent Petroleum <strong>Company</strong> International <strong>and</strong> Dana <strong>Gas</strong> PJSC announced that they are partiesacting in concern.The statement above has been prepared on the basis of registration request <strong>and</strong> shareholder’sannouncements <strong>and</strong> does not reflect the ownership structure registered in the Share Registrar. Theregistration is not m<strong>and</strong>atory. Shareholder may exercise his voting right only if he is registered in theShare Registrar. Based on <strong>MOL</strong>’s Articles of Association neither individual shareholder nor a group ofshareholders may exercise voting rights above 10 percentInformation on treasury sharesNumber of treasury shares held by <strong>MOL</strong> Plc 31 December 2008 <strong>and</strong> on 31 December 2009:31.12.2008 8,781,365 578Settlement of ING option 1,404,217New option agreement with ING bank N.V. (5,220,000)New treasury share lending agreement with MFB Invest Zrt (4,965,582)Modification of the treasury share lending agreement with OTP Bank Plc. 5,010,501Share-exchange <strong>and</strong> shareswap agreements with OTP Bank Plc. (5,010,501)Modification of the share lending agreement with OTP Bank Plc. 1,605,560Modification of the share lending agreement with MFB Invest Zrt. 4,665,582<strong>MOL</strong> paid 6,271,142 “A” series <strong>MOL</strong> shares for a 10% ownership package ofPearl (6,271,142)"A""C"19
Exercise of the call options regarding <strong>MOL</strong> shares held at BNP Paribas S.A. 7,552,874Sale of share on BSE to finance the share of <strong>MOL</strong> from the 2009 work programof Pearl project (67,047)Share transfer to Dana <strong>Gas</strong> <strong>and</strong> Crescent Petroleum to finance the share of<strong>MOL</strong> from the 2009 work program of Pearl project (51,090)31.12.2009 7,434,737 578Changes in organisation <strong>and</strong> senior management:The AGM approved the election of Dr. Sándor Csányi as a member of the Board of Directorsfrom 29th April 2009 until 29th April 2014.The AGM approved the election of Dr. Miklós Dobák as a member of the Board of Directorsfrom 29th April 2009 until 29th April 2014.The AGM dismissed Mr János Major from his position as employee member of theSupervisory Board from May 1, 2009.The AGM elected Mr József Kohán as employee member of the Supervisory Board from May1, 2009 to October 11, 2012.Supply <strong>and</strong> Trading division has been set up as a result of restructuring the <strong>Gas</strong> <strong>and</strong> Powerdivision from 1 July 2009. As a consequence of the successful aquisitions ofINA <strong>and</strong> IES, it isreasonable to establish an efficient, hydrocarbon <strong>and</strong> energy supply <strong>and</strong> trading division at agroup level which is in line with the international oil companies’ practice.Sándor Fasimon was delegated to lead the new division, while Lajos Alács the former leaderof the <strong>Gas</strong> <strong>and</strong> Power division became the director of Supply Chain Management <strong>and</strong> waselected to the Board of Directors of INA .Mr László Geszti, the Chairman of the Board of Directors of INA, focuses on developments atINA, therefore, Mr László Piry was delegated to be the Executive Vice President of Retail of<strong>MOL</strong> Plc as of 1 October 2009. Mr Piry has worked as Polymer Marketing <strong>and</strong> SalesManager of TVK Plc. since 7 June 2004.20