Creep Closure Rate of a Shallow Cavern - Brouard Consulting
Creep Closure Rate of a Shallow Cavern - Brouard Consulting
Creep Closure Rate of a Shallow Cavern - Brouard Consulting

Create successful ePaper yourself
Turn your PDF publications into a flip-book with our unique Google optimized e-Paper software.
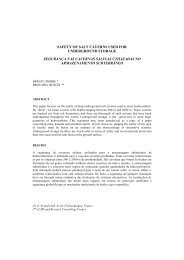
SOLUTION MINING RESEARCH INSTITUTE105 Apple Valley CircleClarks Summit, PA 18411, USATechnicalConferencePaperTelephone: +1 570-585-8092Fax: +1 505-585-8091www.solutionmining.orgPierre Bérest, Jean-François Beraud, Vincent de GreefLMS, Ecole Polytechnique, PalaiseauBenoît <strong>Brouard</strong>, <strong>Brouard</strong> <strong>Consulting</strong>, Paris, FranceEmmanuel Hertz, Cédric LheurCSME, Levallois-Perret, FranceSMRI Spring 2011 Technical Conference18 – 19 April 2011Galveston, Texas, USA
In this paper, we describe two such tests (Figures 1 and 2) performed in the 250-m deep SG13-14 cavern<strong>of</strong> the Gellenoncourt brine-field operated by Compagnie des Salins du Midi et Salines de l’Est (CSME) inLorraine, France. The objective <strong>of</strong> these tests was to assess long-term cavern closure rate. <strong>Cavern</strong>closure rate in such a shallow cavern is exceedingly slow, which raises specific measurement problems.Figure 1 - Brine outflow test (July 23, 2008 to May 25, 2009).Figure 2 -Shut-in pressure test (May 25, 2009 to November 19, 2009).2
2. THE SG13-14 CAVERN2.1. <strong>Cavern</strong> volumeFigure 3 – 3D view <strong>of</strong> the SG13-SG14 cavern (From November 2000 sonar survey: the cavern isviewed from East to West with a 10° downward dip angle.)CSME has operated a brine field at Gellenoncourt in Eastern France since the beginning <strong>of</strong> the 20 thCentury; this brine field, described in Buffet (1998) is located at the eastern (and shallowest) edge <strong>of</strong> theKeuper bedded-salt formation <strong>of</strong> Lorraine-Champagne, in which the salt thickness is 150 m. Fivehorizontal “salt pencils” have been described by geologists. The salt content <strong>of</strong> this field is highest in thefirst (shallowest) and third pencils.During the first half <strong>of</strong> the 20 th Century, single wells were brined out. After 1965, the hydro-fracturingtechnique was used. For this brine field, cased and cemented wells are drilled to a depth <strong>of</strong> 280-300 m— i.e., at the base <strong>of</strong> the third pencil. The horizontal distance between two neighboring wells typically is100 to 150 m. Through hydro-fracturing, a link is created between two such caverns at the base <strong>of</strong> thethird pencil. Water then is injected in one well, and brine is withdrawn from the other well. After sometime, the injection and withdrawal wells are switched. The caverns grow, and their ro<strong>of</strong>s actually reach thefirst pencil. Brining stops when the cavern ro<strong>of</strong> is 10 m below the salt ro<strong>of</strong>. This 10-m-thick salt slab is leftto protect the overlying strata, which are prone to weathering when in contact with brine.In 2007, CSME decided to perform tests to gain a better knowledge <strong>of</strong> cavern long-term mechanicalbehavior. The SG13-SG14 cavern was selected for performing in-situ tests, as this cavern isrepresentative <strong>of</strong> the field and had been kept idle for a long period <strong>of</strong> time. The SG13 and SG14 7’’-wellswere operated as brine-production caverns from July 1976 to July 1980. After some time, the two cavernscoalesced, and, in 1980, SG13-SG14 was composed <strong>of</strong> two parts connected by a large link, see Figure 3.<strong>Cavern</strong> volume was measured through sonar surveys; it is V = 240,000 m 3 .3
2.2. <strong>Cavern</strong> compressibility<strong>Cavern</strong> compressibility is the ratio between the injection (or withdrawal) rate q and the cavern pressurechange rate P during a rapid injection (or withdrawal), or q VP . It is proportional to cavern volume, orV, and it is related to the elastic (adiabatic) properties <strong>of</strong> the rock mass and <strong>of</strong> the fluids contained in thecavern (Bérest et al., 1999). SG13 -SG14 compressibility, as measured on July 3, 2008,3-4is V 130 m /MPa, from which a 5.4×10 /MPa cavern compressibility coefficient can be inferred.2.3. <strong>Cavern</strong> temperature-5 crAt SG13-14 depth, creep closure rate can be expected to be -10 /yr (-0.001%/yr). Brine thermalexpansioncoefficient is b-4 4.4×10 /°C. A brine temperature decrease rate <strong>of</strong> T c -0.02 °C/yr wouldgenerate a relative brine volume decrease rate <strong>of</strong> bT -5c -10 /yr — i.e., <strong>of</strong> the same order <strong>of</strong> magnitudeas that <strong>of</strong> the cavern creep closure rate: temperature evolution must be carefully assessed to preventsevere misinterpretation. By December 2008, a temperature gauge was lowered into the SG13 well. Thecavern temperature remained perfectly constant during the period December 2008 – June 2010. Gaugeaccuracy was tested as follows: in June 2010, cavern pressure was rapidly increased. In such a context,brine evolutions are almost perfectly adiabatic (any pressure change generates a (small) temperaturechange, Gatelier et al., 2008) and a T (°C) bTP bCb 0.03 P(MPa) temperature increase can beexpected ( bCbis the volumetric heat capacity <strong>of</strong> brine). In fact, gauge indication increased by 0.02°Cwhen pressure increase reached Pc 0.6 MPa (Figure 4) proving that the gauge was sensitive, that itsresolution was 0.02°C and that temperature evolution was exceedingly slow.Figure 4 - Checking temperature gauge accuracy. <strong>Cavern</strong> brine warms when brine pressureincreases. A pressure increase by 35 - 28.5 = 6.5 bars (900 psi) leads to an “adiabatic”temperature increase by 0.02°C (0.035°F) which is correctly observed by the temperature gauge.4
3. THE BRINE OUTFLOW TEST3.1. Average brine flow-rateFigure 4 - Cumulated expelled mass as a function <strong>of</strong> time from July 23, 2008 to May 25, 2009.In 2000 the cavern had been shut-in after a sonar survey. Eight years later, before the test began,wellhead pressure had built up to approximately 0.08 MPa. On July-3, 2008, the cavern was opened andwellhead pressure dropped to zero. Brine overflow was evacuated to a plastic container whose weightwas measured every minute.The outflow test began on July 23, 2008 and was completed by May 25, 2009. The average brine outflowrate, or q,results from cavern-creep closure and cavern-brine thermal expansion:q V TV(1)cr b cIn the case <strong>of</strong> the SG13-SG14 cavern, it was proven that temperature rate is exceedingly slow,T / . In other words, the observed average flow-rate is representative <strong>of</strong> cavern creep closurecbduring the test. The cumulated mass <strong>of</strong> expelled brine as a function <strong>of</strong> time is shown in Figure 5. Theaverage brine-outflow rate during this 306-day long test is q = 9.5 liters/day. As cavern volume is3V 240,000 m , the relative creep closure rate is crq V-13 1-5 -1 4.6×10 s 1.45×10 yr . Howeverbrine outflow clearly decreases during the test period; a part <strong>of</strong> the initial flow was triggered by the July-3cavern pressure drop and is transient in nature. The overall duration <strong>of</strong> the test is 306 days; during thefirst 200 days, transient effects, including transient creep and brine crystallization, play a significant role.During the last part <strong>of</strong> the test (from February 2009 to May 2009) cavern evolution is more representative<strong>of</strong> steady-state behavior.5
3.2. Flow-rate fluctuationsFigure 5 - Brine flow-rate from October 14 to 17, 2008.The average brine flow-rate over a 10-month-long period was computed in Section 3.1. Figure 5 displaysflow-rate evolution during a 3-day long period. Large fluctuations can be observed: periodically, the brineflow rate is several hundreds <strong>of</strong> liters per day. Conversely, for most <strong>of</strong> the time, the flow rate is nil and theair/brine interface drops down into the well (Figure 6). Several phenomena contribute to this apparentlyerratic behavior, among which atmospheric pressure variations.3.2.1. Atmospheric pressure fluctuationsh is the height <strong>of</strong> the brine column in the well; h = H when brine is evacuated through the venting hole.<strong>Cavern</strong> pressure, or Pc, and atmospheric pressure, or Patm, are related by (2), where bg is brinevolumetric weight:hP gdz + P or P gh+ P(2)c0b atm c b atmTwo cases must be considered. When brine is expelled from the cavern, h H, h 0, P c P atmand theflow <strong>of</strong> brine is:q V VP VP; h H(3)cr atm atmWhere VP atmis the cavern contraction rate generated by stress changes in the rock mass due toatmospheric pressure fluctuations and VP atmis the expelled brine flow rate resulting from cavernpressure changes. Atmospheric pressure fluctuations are transmitted to the rock mass through theground (and also through the brine column in the well). Except during a severe storm, pressure changesare almost uniform in a large horizontal domain whose dimensions are much larger than cavern depth( H 250 m ). Hence, at cavern depth, it can be assumed that the additional stresses generated by Pand P/ 1where is the Poisson’s ratio <strong>of</strong> thethese fluctuations can write: zz at xx yy atmrock mass. These stresses generate a cavern-volume variation <strong>of</strong>elastic properties <strong>of</strong> the rock mass and <strong>of</strong> the shape <strong>of</strong> the cavern. VP atmwhere is a function <strong>of</strong> the6
Figure 6 - Brine outflow from a shallow cavern: low atmospheric pressure and brine flow from thecavern (right); rapidly increasing atmospheric pressure with no observed brine flow (left).Conversely, when the brine/air interface is below the venting hole, h H , and:Combining (1) and (3) leads to:Sh V VP VP; h H(4)cr atm c S V bg h crV VPatm; h H(5)Where the cross sectional area <strong>of</strong> the well, or2Vbg 1.56 m ; SbgV 1S 22.110 m 2 , is much smaller than can be compared to the “barometric efficiency”, a notiondefined in wells tapped in aquifer layers (Jacob 1940).These equations prove that the cavern behaves as an extremely sensitive barometer. Equation (2)predicts that a change in atmospheric pressure by P atmgenerates a change in brine flow rateby q VP atm. It will be proven in that 0.542,or q / Patm -6 (liter/hPa). On a short timescale,erratic fluctuations <strong>of</strong> atmospheric pressure due for instance to a sudden gust <strong>of</strong> wind (say, severaldozens <strong>of</strong> Pa, or several thousandths <strong>of</strong> a psi) generate a dramatic flow-rate increase. However,atmospheric pressure fluctuations can be accurately measured and it was expected that the brine outflowrate could easily be corrected from their effects. Data processing led to relatively poor results. Severalfactors explain this disappointing result, as explained below.7
3.2.2 Dynamic oscillations <strong>of</strong> the brine column in the wellRapid changes in pressure trigger oscillations <strong>of</strong> the brine column in the well. Consider the case whenh H (brine is expelled from the well). Equations (1) and (2) must be rewritten as follows. The mass <strong>of</strong>brine contained in the well is SH b. When this mass moves up and down in the well, its acceleration is qS . When derivated with respect to time, Newton’s law <strong>of</strong> motion can be written:P c bgh P atm + bHqS(6)q crV VPactm VPc(7)In the context <strong>of</strong> rapid oscillations, the terms between brackets can be disregarded. Eliminating cavernS V q Hq = 0. Thispressure between (5) and (6) leads to a second order differential equation, bequation describes harmonic oscillations. As2Vbg 1.56 m andS 2 22.110 m , the period <strong>of</strong> smalloscillations is 2 H VbS or 4 minutes. These oscillations are slowly dampened (Bérest et al.,1999) and they blur the relation between atmospheric pressure variations and brine outflow to thecontainer.3.2.3. Cooling <strong>of</strong> the brine column rising inside the wellWhen the well is at rest, cavern brine temperature is warmer than brine geothermal temperature in thewell. When brine moves upward, cool brine expelled at ground level is substituted by warm brine flowingfrom the cavern and the brine column in the well is made lighter, cavern pressure decreases, and brineflow is made faster. Heat exchange in the well between the rock formation and the warm brine in the wellmust also be taken into account. Equation (1) must be re-written in the more precise form:HHbTP c gdz + P 0atm bgb dz P0atmt + (8)tIt can be proven (see Appendix) that when warm brine starts rising in the well, brine outflow rate can bewritten as follows: q 1 V bgbH S crV VPatm(9)Where 3 10 2 °C/m is the geothermal gradient and V bgbH S 0.24: (8) proves that brine rateis significantly accelerated when warm brine enters the well.3.2.4 ConclusionThis analysis proves that, even if the average brine flow-rate clearly is representative <strong>of</strong> cavern behavior,flow-rate daily behavior is blurred by large fluctuations from external origin. Interpretation <strong>of</strong> the shut-inpressure test will prove to be simpler.8
4 THE SHUT-IN PRESSURE TEST4.1 Average pressure build-up rateThe cavern was shut-in from May 25, 2009 to November19, 2009. During a shut-in test, the equationwhich describes averaged evolutions must be re-written:0 crcPc Pwhq V VP (9)where P whis the wellhead pressure, whose evolution is shown on Figure 7. Wellhead pressure increaseduring the 10-month period is 80 kPa, making the average pressure build-up rate due to cavern creepclosure P wh cr 47.1 Pa/day, from which it can be inferred that cavern closure rate is5 cr VV 0.9310/yr (<strong>Cavern</strong> complete closure is reached after more than 100,000 years.)Figure 7 – Wellhead pressure evolution during the shut-in test.4.2 Wellhead pressure fluctuationsWellhead pressure experiences significant fluctuations. Figure 8 displays wellhead pressure andatmospheric pressure as measured during a 2-month long period. The wellhead is closed; howeveratmospheric pressure fluctuations are transmitted to the cavern through the rock mass, as explainedabove. The coefficient <strong>of</strong> empirical correlation between cavern pressure variations and atmosphericpressure variations is 0.542.Daily fluctuations in wellhead pressure generated by daily changes inground level temperature will not be discussed here; they are relatively small. A Fourier analysis wasperformed and two peaks associated with Earth tides could be observed. In fact, fluctuations generatedby Earth tides are visible clearly on Figure 8, for instance between September 15 and September 25, awhperiod during which their amplitude is P 1 hPa, from which it can be inferred that cavern deformationwh-8is P 5×10 , a figure that is typical <strong>of</strong> the strains induced by Earth tides.9
Figure 8 - Wellhead pressure and atmospheric pressure during the Sept.-Nov. 2009 period.Earth tides effects are visible clearly, for instance in the Sept. 15 to 25 period.4.3 Steady-state cavern creep vs. transient cavern creepIt was observed during the brine outflow test that the average brine flow rate, computed from July 23,-5 2008 to May 25, 2009, was: q V 1.45×10 yr 1 . However brine flow-rate slowly decreases with time.During the shut-in test, from May 25, 2009 to November 19, 2009, the cavern creep closure rate, inferredfrom pressure increase rate, was slower, cr P-5 -1 0.93×10 yr . This last figure is more representative<strong>of</strong> steady-state creep closure rate, as transient effects are important at the beginning <strong>of</strong> the outflow test. Itwas mentioned that the cavern had been shut-in from 2000 to 2008; on July 2008, when thecompressibility test started the wellhead pressure dropped by slightly more than Pc 0.08 MPa — asmall figure, but large enough to trigger various transient phenomena. Salt crystallization and transientcreep are especially important. Immediately after the pressure drop, cavern brine is over-saturated in thenew pressure conditions and crystallization takes place till saturation is reached again. The volume <strong>of</strong>brine expelled as a consequence <strong>of</strong> crystallization can be assessed (see Appendix B)); it isexpV 1200 liters. Transient creep also has significant effects. It includes both the rheological transientcreep, as can be observed during a standard triaxial creep test performed at the laboratory and thegeometrical transient creep, or the slow redistribution <strong>of</strong> stresses in the rock mass following any cavernpressure change, an effect which is not present in the case <strong>of</strong> a uniformly loaded sample.CONCLUSIONSA 10-month long brine outflow test and a 6-month long shut-in test were performed in a 250-m deep saltcavern at Gellenoncourt in Lorraine, France. This cavern had been kept idle for 30 years before the testsand brine temperature changes were exceedingly small. The steady-state creep closure rate, asobserved during the shut-in test, is slightly slower than 10 -5 /year or 2 m 3 /year. This value proves that evenin the long term (several centuries) subsidence and possible brine leaks from the cavern should havenegligible impact from the point <strong>of</strong> view <strong>of</strong> environmental protection.10
REFERENCESBérest P., Bergues J., <strong>Brouard</strong> B. 1999. Review <strong>of</strong> static and dynamic compressibility issues relating todeep underground salt caverns. Int. J Rock Mech Min Sci 36:1031-1049.Bérest P., <strong>Brouard</strong> B., Karimi-Jafari M., Van Sambeek L. 2007. Transient behavior <strong>of</strong> salt caverns –Interpretation <strong>of</strong> mechanical integrity tests. Int J Rock Mech Min Sci, 44:767-786.Jacob C.E. 1940. On the flow <strong>of</strong> water in an elastic artesian aquifer. Eos Trans AGU, 21:574-586.<strong>Brouard</strong> B, Bérest P, Héas JY, Fourmaintraux D, de Laguérie P, You T. 2004. An in situ test in advance<strong>of</strong> abandoning <strong>of</strong> a salt cavern. Proceedings SMRI Fall Meeting, Berlin, Germany, p 45-64.Bérest P, Bergues J, <strong>Brouard</strong> B, Durup JG, Guerber B. 2001. A salt-cavern abandonment test. Int J RockMech Min Sci;38:343-55.Buffet A. 1998. The collapse <strong>of</strong> Compagnie des Salins SG4 and SG5 drillings. Proceedings SMRI FallMeeting, Roma, Italy, p 79-105.Gatelier N., You T., Bérest P., <strong>Brouard</strong> B. 2008. “Adiabatic” temperature changes in an oil-filled cavern.Proceedings SMRI Fall Meeting, Austin, Texas, p 81-104.Appendix ACooling <strong>of</strong> the brine column rising inside the wellWhen the well is at rest, cavern brine temperature, Tc, is warmer than brine temperature in the well,which is T z T z ; is the geothermal gradient. When brine moves upward, cool brine expelled at 0 cground level is substituted by warm brine flowing from the cavern, and the brine column in the well ismade lighter, cavern pressure decreases, and brine flow becomes faster. However, heat exchange in thewell between the rock formation and the warm brine in the well also must be taken into account. It isassumed that outflow takes place, h H , and Equation (1) must be re-written in the more precise form:where , H H HbTPc 0bgdz + Patm and P c gdz + P 0atm bgb dz P0atmt + (A1)tT z t is brine temperature in the well. It is assumed that well brine was at rest when t 0 (i.e.,q( t 0) 0 ) and that its temperature equaled the geothermal temperature <strong>of</strong> the rock, orT z, t 0() T0z . When brine rises in the well, its temperature, T T z,ttemperature, T , , R, is slightly warmer than rockr z t , at the same depth, and heat exchange takes place. Heat flux from the rock massshould be described by Fourier’s equation for heat conduction; however, because we are interestedmainly in orders <strong>of</strong> magnitude, the following simplistic model is accepted: the heat flux is assumed to beproportional to the difference between the virgin temperature <strong>of</strong> the rock and brine temperature:dT z, t T q T1 ( z,)( t ,) z t , T z,t T z t 0dt t S z t cT z,0() T0z Tc-; z 0, T t Tc2where a is the well radius , t a k , k 100csaltsalt(A2)2m yr is the thermal diffusivity <strong>of</strong> salt, andtc 1 to 2 hours.This partial differential equation must be solved according to the “characteristic lines”method. When brine flow rate (q) is assumed to be approximately constant for any t 0, the solution <strong>of</strong>(10) is:11