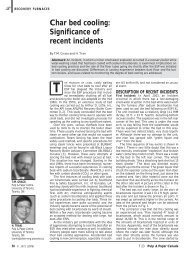
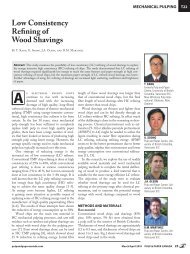
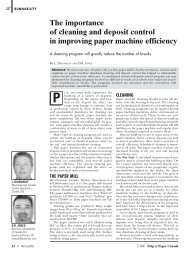
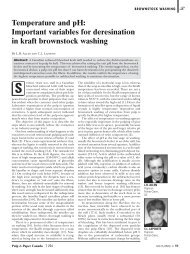
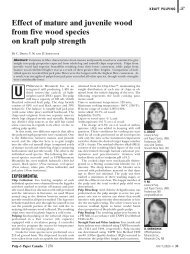
T31<strong>oxygen</strong> <strong>delignification</strong>Fig. 1. Flow diagram <strong>of</strong> the continuous stirred tank reactor(CSTR) system.Fig. 2. Delignification rate vs. residual lignin at different O 2pressures.where the constant K c= K HL*·[HL *total]·C.The reaction rate constant, k, is obtainedfrom the slope <strong>of</strong> the <strong>delignification</strong> rateversus L ccurve shown in Figure 2 fora commercial unbleached southern pinekraft pulp (Kappa 26). The linear decreasein <strong>delignification</strong> rate with HexA-freeresidual lignin content, L C, can be intermethod<strong>of</strong> Tenkanen et al. scaled down to200 mg pulp 9 . The residual lignin contentin pulp, L c, was calculated asHexA mg ligninL c= ( Kappa – ––––– ) 31.5 ( –—––––– ) (1)10 g pulpwhere the kappa number is calculated as theinitial pulp kappa number minus the amount<strong>of</strong> lignin dissolved as measured by UV. Thekappa number is corrected for the HexAcontent (in µmol/g pulp). Since 10 µmol/g <strong>of</strong>HexA is equivalent to one kappa unit 10 , theHexA content is divided by 10. The factor1.5 is the st<strong>and</strong>ard conversion <strong>of</strong> kappa to mglignin per gram <strong>of</strong> pulp. Ji has shown that theHexA content <strong>of</strong> pulp does not change during<strong>oxygen</strong> <strong>delignification</strong> except when a severeyield loss occurs so that HexA groups areremoved together with the carbohydrates 11 .The phenolic hydroxyl group content <strong>of</strong> theliquor <strong>and</strong> the pulp was determined from thedifference in UV absorbance <strong>of</strong> neutral <strong>and</strong>alkaline solutions at 300 <strong>and</strong> 350 nm 11-12 . Toavoid lignin precipitation, 100 µl <strong>of</strong> dioxanewas added to the samples.Data analysis procedureDetails about the data analysis procedurecan be found in earlier publications 8, 11 .Development <strong>of</strong> rate expression <strong>and</strong>determination <strong>of</strong> rate constantsIt is well accepted that the first <strong>step</strong> involving<strong>oxygen</strong> <strong>delignification</strong> is dissociation <strong>of</strong>phenolic groups forming an active ligninanion site 3, 5, . L *– . Oxygen <strong>delignification</strong><strong>kinetics</strong> can be interpreted as the result<strong>of</strong> the rate <strong>determining</strong> reaction betweenadsorbed <strong>oxygen</strong> <strong>and</strong> the active ligninanion site, L *– , as:L *– + O 2 $ L *. + O 2.–(2)forming a superoxide anion radical, O .– 2,<strong>and</strong> a lignin radical L *. . Therefore the rateexpression <strong>of</strong> <strong>oxygen</strong> <strong>delignification</strong> maybe written as:dL – ––––– C = k [L* – ]·[O 2] ads(3)dtwhere [L *– ] is the reactive lignin site concentration<strong>and</strong> [O 2] adsis the adsorbed <strong>oxygen</strong>concentration on the reactive ligninsite. The equilibrium constant K HL*<strong>of</strong> theprotonation <strong>of</strong> the lignin active site is:[L *– ][H + ]K HL*= –––––––– (4)[HL * ]When the total number <strong>of</strong> active ligninsites is defined as HL * = total L*– + HL * , it canbe derived that:dL CK HL*[HL * ][OH – ][Ototal 2] – –––– = k ––––––––––––––––––––– ads (5)dt K water+ K HL*[OH – ]where K water= [H + ] 3 [OH - ]. If it is nowassumed that the active sites are uniformlydistributed throughout the residual ligninL c, then [HL * ] = C·L , where C is atotal Cproportionality constant. Thus, equation(5) becomes:dL C[OH – ][O 2] – ––––ads/LC = k = K C= ––––––––––––– (6)dt K water+K HL*[OH – ]preted as a first order reaction in lignin.The wavy character <strong>of</strong> the data is causedby slow small temperature fluctuations(± 1°C) in the CSTR due to imperfectcontrol.Equation 6 predicts that when [OH – ]is very high, the reaction order in [OH – ]approaches zero, <strong>and</strong> that the reactionorder in [OH – ] should approach first orderwhen [OH – ] is close to zero. By taking theinverse <strong>of</strong> equation 6, we obtain1 K HL*K water1– = ––––––– + –––––––– · –––––– (7)k K C[O 2] adsK C[O 2] ads[OH – ]The terms K HL*/K c[O 2] ads<strong>and</strong> K water/K C[O 2] adsare constant when the temperature<strong>and</strong> <strong>oxygen</strong> pressure are kept constant.Thus, by plotting 1/k versus 1/[OH – ] atconstant temperature <strong>and</strong> <strong>oxygen</strong> pressure,but at variable [OH – ], a linear relationshipshould obtained. This is indeed the caseas shown in Figure 3. From the abscissa<strong>and</strong> slope <strong>of</strong> Figure 3 one obtains thatK HL*/K c[O 2] ads= 29.54 <strong>and</strong> K water/K C[O 2] ads= 3.28 or K * = 9.01·K . Since the pK HL water w<strong>of</strong> water, –log(K water), at 90°C is 12.40(Palmer et al. 2004), the pKa <strong>of</strong> the activelignin sites at 90°C is calculated as 11.5.This value is almost two units higher than9.8 measured for Indulin AT at this temperature13 , indicating that the lignin activesite is not a phenolic group.To include the effect <strong>of</strong> <strong>oxygen</strong> pressurein equation 6, a relationship was derivedbetween [O 2] ads<strong>and</strong> P O2based on the followingassumptions:1. Oxygen adsorption follows a Langmuirtype adsorption isotherm,2. The total number <strong>of</strong> adsorption sites isconstant,30 March 2009 Pulp & Paper Canada pulp<strong>and</strong>papercanada.com
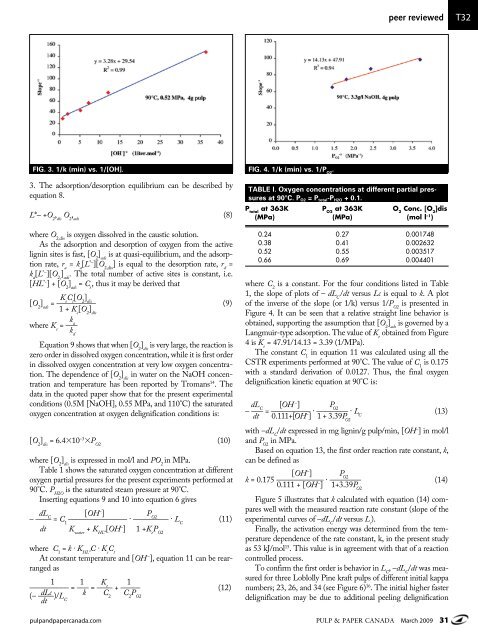
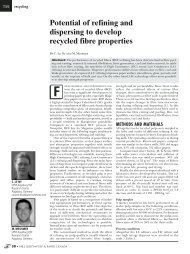
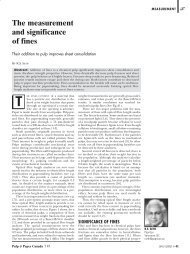
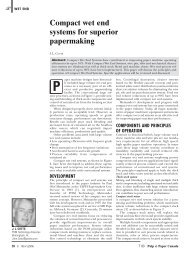
peer reviewedT32FIG. 3. 1/k (min) vs. 1/[OH]. FIG. 4. 1/k (min) vs. 1/P O2.3. The adsorption/desorption equilibrium can be described byequation 8.L*– +O 2, disO 2, ads(8)where O 2,disis <strong>oxygen</strong> dissolved in the caustic solution.As the adsorption <strong>and</strong> desorption <strong>of</strong> <strong>oxygen</strong> from the activelignin sites is fast, [O 2] adsis at quasi-equilibrium, <strong>and</strong> the adsorptionrate, r a= k a[L *– ][O 2,dis] is equal to the desorption rate, r d=k d[L *– ][O 2,] ads. The total number <strong>of</strong> active sites is constant, i.e.[HL *- ] + [O 2] ads= C t, thus it may be derived thatK eC t[O 2] dis[O2 ] ads= –––––––––– (9)1 + K e[O 2] disk where a Ke = –––kdEquation 9 shows that when [O 2] disis very large, the reaction iszero order in dissolved <strong>oxygen</strong> concentration, while it is first orderin dissolved <strong>oxygen</strong> concentration at very low <strong>oxygen</strong> concentration.The dependence <strong>of</strong> [O 2] disin water on the NaOH concentration<strong>and</strong> temperature has been reported by Tromans 14 . Thedata in the quoted paper show that for the present experimentalconditions (0.5M [NaOH], 0.55 MPa, <strong>and</strong> 110°C) the saturated<strong>oxygen</strong> concentration at <strong>oxygen</strong> <strong>delignification</strong> conditions is:[O 2] dis= 6.4310 –3 3P O2(10)where [O 2] disis expressed in mol/l <strong>and</strong> PO 2in MPa.Table 1 shows the saturated <strong>oxygen</strong> concentration at different<strong>oxygen</strong> partial pressures for the present experiments performed at90°C. P H2Ois the saturated steam pressure at 90°C.Inserting equations 9 <strong>and</strong> 10 into equation 6 givesdL C[OH – ] P O2– –––– = C 1––––––––––––––– · ––––––––– · L C(11)dt K water+ K HL*[OH – ] 1 +K eP O2where C 1= k · K HL*C · K eC tAt constant temperature <strong>and</strong> [OH – ], equation 11 can be rearrangedas1 1 K e1–––––––––– = ––– = –––– + ––––– (12)(– ––––)/L dLc k C 2C 2P O2dt Ctable i. Oxygen concentrations at different partial pressuresat 90°C. P O2 = P total -P H2O + 0.1.P totalat 363K P O2at 363K O 2Conc. [O 2]dis(MPa) (MPa) (mol l –1 )0.24 0.27 0.0017480.38 0.41 0.0026320.52 0.55 0.0035170.66 0.69 0.004401where C 2is a constant. For the four conditions listed in Table1, the slope <strong>of</strong> plots <strong>of</strong> – dL C/dt versus Lc is equal to k. A plot<strong>of</strong> the inverse <strong>of</strong> the slope (or 1/k) versus 1/P O2is presented inFigure 4. It can be seen that a relative straight line behavior isobtained, supporting the assumption that [O 2] adsis governed by aLangmuir-type adsorption. The value <strong>of</strong> K eobtained from Figure4 is K e= 47.91/14.13 = 3.39 (1/MPa).The constant C 1in equation 11 was calculated using all theCSTR experiments performed at 90°C. The value <strong>of</strong> C 1is 0.175with a st<strong>and</strong>ard derivation <strong>of</strong> 0.0127. Thus, the final <strong>oxygen</strong><strong>delignification</strong> kinetic equation at 90°C is:dL C[OH – ] P – ––– = –––––––––– · ––––––––O2· LC (13)dt 0.111+[OH – ] 1 + 3.39P O2with –dL C/dt expressed in mg lignin/g pulp/min, [OH – ] in mol/l<strong>and</strong> P O2in MPa.Based on equation 13, the first order reaction rate constant, k,can be defined as[OH – ] P k = 0.175 –––––––––––– · ––––––––O2(14)0.111 + [OH – ] 1+3.39P O2Figure 5 illustrates that k calculated with equation (14) compareswell with the measured reaction rate constant (slope <strong>of</strong> theexperimental curves <strong>of</strong> –dL C/dt versus L c).Finally, the activation energy was determined from the temperaturedependence <strong>of</strong> the rate constant, k, in the present studyas 53 kJ/mol 15 . This value is in agreement with that <strong>of</strong> a reactioncontrolled process.To confirm the first order is behavior in L C, –dL C/dt was measuredfor three Loblolly Pine kraft pulps <strong>of</strong> different initial kappanumbers; 23, 26, <strong>and</strong> 34 (see Figure 6) 16 . The initial higher faster<strong>delignification</strong> may be due to additional peeling <strong>delignification</strong>pulp<strong>and</strong>papercanada.com Pulp & Paper Canada March 2009 31