HOBOware User's Guide - Synotech Datenlogger
HOBOware User's Guide - Synotech Datenlogger
HOBOware User's Guide - Synotech Datenlogger
- No tags were found...

Create successful ePaper yourself
Turn your PDF publications into a flip-book with our unique Google optimized e-Paper software.
<strong>HOBOware</strong>® User’s <strong>Guide</strong>Onset Computer Corporation470 MacArthur Blvd.Bourne, MA 02532www.onsetcomp.comMailing Address:P.O. Box 3450Pocasset, MA 02559‐3450Phone: 1‐800‐LOGGERS (1‐800‐564‐4377) or 508‐759‐9500Fax: 508‐759‐9100Email: loggerhelp@onsetcomp.comTechnical Support Hours: 8AM to 8PM ET, Monday through FridayCustomer Service Hours: 8AM to 5PM ET, Monday through Friday© 2010–2013 Onset Computer Corporation. All rights reserved. Onset, HOBO, HOBOlink, <strong>HOBOware</strong>, BoxCar, and FlexSmart are trademarks or registered trademarks of Onset ComputerCorporation for its data logger products and configuration/interface software. Macintosh is a registered trademark of Apple, Inc. Microsoft and Windows are registered trademarks ofMicrosoft Corporation. All other trademarks are the property of their respective companies.12730‐L MAN‐BHW‐UG
ContentsChapter 1: An Overview of <strong>HOBOware</strong> .............................................. 6Introduction to <strong>HOBOware</strong> Pro .................................................................................................... 7Introduction to <strong>HOBOware</strong> Lite .................................................................................................... 7Advanced <strong>HOBOware</strong> Pro Features .............................................................................................. 8New <strong>HOBOware</strong> Features ............................................................................................................. 9Installing <strong>HOBOware</strong> .................................................................................................................. 11Activating <strong>HOBOware</strong> ................................................................................................................. 12<strong>HOBOware</strong> Setup Assistant (<strong>HOBOware</strong> Pro Only) .................................................................... 13Using a Trial Version of <strong>HOBOware</strong> ............................................................................................ 14A Tour of the <strong>HOBOware</strong> Interface ............................................................................................ 15Overview of a Plot ...................................................................................................................... 16The Details Pane ......................................................................................................................... 17The Points Table ......................................................................................................................... 18The Plot Setup Window .............................................................................................................. 19<strong>HOBOware</strong> Software Updates .................................................................................................... 19Chapter 2: Working with HOBO Data Loggers .................................. 20Connecting Devices .................................................................................................................... 20Connecting a USB Device ............................................................................................................ 21Connecting a Base Station or Coupler ........................................................................................ 21Connecting a Serial Device (<strong>HOBOware</strong> Pro Only) ..................................................................... 22Connecting Multiple Devices ...................................................................................................... 22Launching Devices ...................................................................................................................... 23Launch Logger Window .............................................................................................................. 24Launch Options for HOBO UX90 Series Loggers ......................................................................... 25Launch Options for HOBO UX100 Series Loggers ....................................................................... 28Launch Options for the HOBO 4‐Channel Pulse Input Data Logger (UX120‐017x)..................... 31Launch Options for Other U‐Series Loggers ............................................................................... 34Launch Options for Station Loggers ............................................................................................ 37Multiple Logging Intervals .......................................................................................................... 39Fast Logging Intervals ................................................................................................................. 40Repeating an Action on Multiple U‐Series Devices .................................................................... 40"Read Header Failed" Error ........................................................................................................ 41Launch Utilities ........................................................................................................................... 41Filter Series at Launch................................................................................................................. 41Data Assistants Window (Scaling) .............................................................................................. 43Configure Alarms ........................................................................................................................ 44<strong>HOBOware</strong> User’s <strong>Guide</strong> 2
Advanced Sensor Properties: Pulse Frequency and Lockout Time ............................................. 46Advanced Sensor Properties: Calibration ................................................................................... 47Advanced Sensor Properties: Occupancy ................................................................................... 48Statistics: Maximum, Minimum, Average, and Standard Deviation ........................................... 49Filtered Series vs. Statistics Logging ........................................................................................... 50Burst Logging .............................................................................................................................. 51Checking Device Status ............................................................................................................... 52The Status Window ..................................................................................................................... 53Device Details ............................................................................................................................. 53Current Readings ........................................................................................................................ 55Stopping a Device ....................................................................................................................... 55Lab Calibration ............................................................................................................................ 56Updating UX Series Logger Firmware ......................................................................................... 59Chapter 3: Reading Out, Plotting, and Analyzing Data...................... 61Reading Out Data........................................................................................................................ 61Setting up a Plot ......................................................................................................................... 62Data Types in Plots ..................................................................................................................... 63Opening Files .............................................................................................................................. 64Opening Files from Unsupported Loggers .................................................................................. 65Modifying a Plot ......................................................................................................................... 67Setting Series and Plot Properties .............................................................................................. 69Setting Properties for all Plots .................................................................................................... 70Setting Axis Properties ................................................................................................................ 72Setting Series Properties ............................................................................................................ 73Adding a Graph Label ................................................................................................................. 75Zooming, Panning, and Smart Scaling Plots ................................................................................ 76Copying a Series to another Plot ................................................................................................ 77Undoing and Redoing Plot Changes ........................................................................................... 77Saving Project Files ..................................................................................................................... 78Printing Plot Elements ................................................................................................................ 78Closing a Plot .............................................................................................................................. 79Viewing a Plot ............................................................................................................................. 79Viewing a Pie Chart ..................................................................................................................... 79Converting Units ......................................................................................................................... 81Viewing Subset Statistics ............................................................................................................ 81Overview of a Graph Subset ....................................................................................................... 82Setting Subset Statistics Properties ............................................................................................ 83<strong>HOBOware</strong> User’s <strong>Guide</strong> 3
Filtering a Series ......................................................................................................................... 84Cropping a Series ........................................................................................................................ 85Overlaying Series ........................................................................................................................ 86Merging Datafiles ....................................................................................................................... 87Removing a Series from a Plot .................................................................................................... 88Data Assistants ........................................................................................................................... 88Barometric Compensation Assistant .......................................................................................... 89Conductivity Assistant ................................................................................................................ 91Dissolved Oxygen Assistant ........................................................................................................ 94Grains Per Pound Assistant ......................................................................................................... 99Growing Degree Days Assistant ................................................................................................ 100kWh Assistant ........................................................................................................................... 103Linear Scaling Assistant............................................................................................................. 105Pulse Scaling Assistant .............................................................................................................. 107Importing Text Files .................................................................................................................. 108Import Text Files Requirements ............................................................................................... 110Importing Files from HOBOlink ................................................................................................. 112Exporting Data .......................................................................................................................... 112Exporting Table Data ................................................................................................................ 113Export Options (Multi File Export) ............................................................................................ 114Exporting Data in Classic (BoxCar Pro) Format ......................................................................... 114Exporting Details ....................................................................................................................... 114Copying Points Data into another Application ......................................................................... 114Formatting the Date/Time Column in Excel ............................................................................. 115The Bulk Export Tool ................................................................................................................. 115Working in Secure Mode: 21 CFR Part 11 Compliance ............................................................. 118Security Mode Issues ................................................................................................................ 119Chapter 4: Other Hardware ............................................................ 120Working with the HOBO U30 Station (<strong>HOBOware</strong> Pro Only) ................................................... 120Controlling the Relay on the HOBO U30 Station (<strong>HOBOware</strong> Pro Only) .................................. 121Changing the State of the U30 Relay Contact .......................................................................... 122The Alarms Window for the U30/NRC ...................................................................................... 123The Alarm Configuration Window for the U30/NRC ................................................................ 124Configuring FlexSmart Modules/Analog Sensor Ports .............................................................. 125The Configure Channel Window ............................................................................................... 126Setting Voltage Ranges and Scaling Parameters ...................................................................... 127Configuring Excitation Power ................................................................................................... 129<strong>HOBOware</strong> User’s <strong>Guide</strong> 4
Loading a Saved Configuration ................................................................................................. 130Resetting a Module to the Default Configuration .................................................................... 131Working with a Shuttle (<strong>HOBOware</strong> Pro Only) ......................................................................... 132The Shuttle Management Window .......................................................................................... 132Offloading and Saving Shuttle Files .......................................................................................... 134Saving Files from a Shuttle ....................................................................................................... 135Deleting Files from a Shuttle .................................................................................................... 136Configuring Loggers with the E50B2 Power & Energy Meter ................................................... 136Working with the HOBO U26 Dissolved Oxygen Logger ........................................................... 139Chapter 5: HOBOnode Manager ...................................................... 140A Tour of HOBOnode Manager ................................................................................................. 141Viewing Real‐Time Plots ........................................................................................................... 142Determining Data Node Type ................................................................................................... 143Changing Logging and Connection Intervals ............................................................................. 144Setting up External Sensors ...................................................................................................... 145Configuring Scaling on a Sensor................................................................................................ 146Setting HOBOnode Manager Preferences ................................................................................ 159Working with HOBOnode Manager Data ................................................................................. 161Enabling HOBOnode Viewer ..................................................................................................... 167Using HOBOnode Viewer .......................................................................................................... 169Setting up Data Delivery ........................................................................................................... 170Data Storage Location .............................................................................................................. 175Alarms ....................................................................................................................................... 175The Network Map ..................................................................................................................... 185Maintenance & Troubleshooting .............................................................................................. 189Chapter 6: Reference ..................................................................... 201Windows ................................................................................................................................... 201Menus ....................................................................................................................................... 204Setting Preferences .................................................................................................................. 214Tips for Working with Multiple Loggers ................................................................................... 231Setting the Language/Format on Your Computer .................................................................... 234Alarm & Readout Tool .............................................................................................................. 235<strong>HOBOware</strong> User’s <strong>Guide</strong> 5
Chapter 1:An Overview of <strong>HOBOware</strong><strong>HOBOware</strong> software is used for launching, reading out, and plotting data from HOBO ® data loggers and wirelessHOBO data nodes.<strong>HOBOware</strong> Pro combines fast logger launch and readout functions with powerful data plotting capabilities, makingit easy to analyze data recorded with HOBO data loggers and HOBO wireless data nodes. An intuitive interfaceallows you to select data parameters to display, format graphs, perform analysis, and save projects for future use.You can also export data to Microsoft ® Excel ® or other ASCII‐compatible programs for additional analysis.<strong>HOBOware</strong> Lite is entry‐level software for HOBO USB loggers, offering easy logger launch, readout, and dataplotting.For a comparison between <strong>HOBOware</strong> Pro and <strong>HOBOware</strong> Lite, seehttp://www.onsetcomp.com/sites/all/themes/foliage/hoboware_comparison.html.Getting StartedIf you are using HOBO data loggers, follow the instructions in the Getting Started <strong>Guide</strong> to install the software,connect your logger, launch, and readout data. You can expect to be comfortable with <strong>HOBOware</strong> fundamentalswithin a few minutes.Refer to the sections outlined below, depending on what hardware you are using.All Users InstallationData Loggers ReferenceIf you are using HOBO data loggers (such as the U14 or H12 series), refer to the following sections: Working with HOBO Data Loggers Plotting and Analyzing DataWireless HOBO data nodesIf you are using HOBO wireless data nodes, refer to the HOBOnode Manager section.Other HardwareRefer to Other Hardware if you are using a HOBO U30 Station, a HOBO Shuttle, or FlexSmart Modules/AnalogSensor Ports.Notes Any differences for <strong>HOBOware</strong> Pro and <strong>HOBOware</strong> Lite, for Windows ® or Macintosh ® are noted. Screen captures of windows are English versions. If you have a version of <strong>HOBOware</strong> in anotherlanguage, see the software for the translated windows.<strong>HOBOware</strong> User’s <strong>Guide</strong> 6
Introduction to <strong>HOBOware</strong> ProOverviewWith <strong>HOBOware</strong> Pro, you can quickly launch, read out, and plot data recorded by HOBO data loggers. <strong>HOBOware</strong>Pro allows you to analyze and view data numerous ways, including: Filtering data to extract key series information such as minimum, maximum, or average values. Scaling data to sensor units, Saving graphs for future use, Single‐file exporting or bulk exporting, and Working in Secure mode for 21 CFR Part 11 compliance.In addition, <strong>HOBOware</strong> Pro includes HOBOnode Manager for configuring and maintaining a wireless HOBO datanode network.See New <strong>HOBOware</strong> Pro Features and Advanced <strong>HOBOware</strong> Pro Features for additional details.To upgrade from <strong>HOBOware</strong> Lite to <strong>HOBOware</strong> Pro, call 1‐800‐564‐4377 and ask for Onset Customer Service.Getting StartedTo get up and running quickly, follow the instructions in the Getting Started <strong>Guide</strong> to install the software, connectyour logger, launch, and read out data. You can expect to be comfortable with <strong>HOBOware</strong> fundamentals within afew minutes.Devices<strong>HOBOware</strong> Pro is compatible with the following devices: HOBO U‐Series loggers HOBO Weather Stations, including HOBO U30 Station HOBO Micro Stations HOBO Energy Logger Systems HOBO U‐Shuttle and Waterproof Shuttle HOBO FlexSmart Modules HOBO Data Nodes (Wireless Sensors) HOBO 4‐Channel Pulse Input (UX120‐017) Energy and Power Meter (T‐VER‐E50B2)Introduction to <strong>HOBOware</strong> Lite<strong>HOBOware</strong> Lite is entry‐level software for HOBO U‐Series loggers, offering the following features: Easy logger setup/launch and readout Quick check of logger status and current readings Graphing and analysis with the ability to view multiple data files on one graph Filters to extract key series information such as minimum, maximum, or average values<strong>HOBOware</strong> User’s <strong>Guide</strong> 7
The ability to save changes to graphs in a project file Export of ASCII text data to Microsoft Excel or other programs for further analysisYou can open the following files in <strong>HOBOware</strong> Lite: .hobo ‐ including files created with Onset's GreenLine software and both Macintosh and Windows ‐compatible versions of <strong>HOBOware</strong> Lite and <strong>HOBOware</strong> Pro. .hsec .hprojTo upgrade from <strong>HOBOware</strong> Lite to <strong>HOBOware</strong> Pro, call 1‐800‐564‐4377 and ask for Onset Customer Service. Anupgrade to <strong>HOBOware</strong> Pro is required for certain devices.Advanced <strong>HOBOware</strong> Pro FeaturesSetup AssistantWhen you open <strong>HOBOware</strong> Pro for the first time, you are greeted by the <strong>HOBOware</strong> Setup Assistant, a series ofwindows to help you quickly change some key preference settings for device types and serial ports, units ofmeasurement, and data assistants. See <strong>HOBOware</strong> Pro Setup Assistant for more information.Data AnalysisAnalysis features can be used to extract key information from logged data. You can create new data series, whichcan be graphed or exported. You can also filter data over user‐specified intervals that can be in seconds, minutes,hours or days. The Subset Statistics tool (included with <strong>HOBOware</strong> Pro) calculates statistics over a user‐definedinterval.Time‐Saving OptionsLaunchingBy default, <strong>HOBOware</strong> Pro displays the Launch window when you initiate a launch. If you want to skip the launchwindow and launch the logger with the default settings, choose Automatically launch. This is particularly useful ifyou want to launch many loggers quickly without changing any settings. For more information, see Launch Time‐Saving Options.ReadoutThis feature allows you to skip a number of default actions when reading out a logger (such as being prompted tosaving or the Plot Setup window). For more information, see Readout Time‐Saving Options.Viewing Subset StatisticsThe Subset Statistics feature allows you to select a range of data in a graph, and display the maximum, minimum,average and standard deviation for the measurements in that range. See Viewing Subset Statistics for moreinformation.Data Assistants<strong>HOBOware</strong> Pro Data Assistants let you create new data series by combining data recorded by the logger withadditional data that you enter before you display the plot. For example, the kWh Assistant converts logged pulsedata from an energy transducer to kWh, average kW, and energy cost.All Data Assistants can be run from the Plot Setup window after you read out a logger or open a datafile. With thismethod you need to run the Data Assistant each time you read out the logger or open a datafile.<strong>HOBOware</strong> User’s <strong>Guide</strong> 8
New Features in Previous Releases<strong>HOBOware</strong> 3.3.2: Support for the following languages and their associated formats in the software user interface: Spanish(Spain), Portuguese (Portugal), and German (Germany); Help and user guides are available in English only. Improved field calibration accuracy in the Conductivity Assistant.<strong>HOBOware</strong> 3.3.1: Support for the new HOBO U26 Dissolved Oxygen logger, including launch and readout capability, a LabCalibration tool to calibrate the logger to 100% and/or 0% saturation, and a Dissolved Oxygen Data Assistantthat corrects for measurement drift from fouling and generates salinity‐adjusted DO concentration as wellas percent saturation data. The ability to update firmware for receivers and data nodes in the HOBO ZW Wireless System, with theoption to update a single device at a time or multiple data nodes in a group. A data encoding preference added to the General preferences that controls whether data in <strong>HOBOware</strong> isimported and exported based on UTF‐8 or operating system standards. French language support for the software user interface (Help and user guides are available in English only).<strong>HOBOware</strong> 3.3: Support for the new HOBO UX90 series data loggers, including launch capability, advanced sensorconfiguration, and pre‐launch filters. The models supported with this release are theState/Pulse/Event/Runtime logger (UX90‐001x), Light On/Off logger (UX90‐002x), Motor On/Off logger(UX90‐004x), and Occupancy/Light logger (UX90‐005x/‐006x).<strong>HOBOware</strong> 3.2.2: Enhanced display preferences for sorting data series in the Status and Plot Setup windows. A utility for upgrading the HOBOnode Manager database to improve performance. Performance improvements for the HOBO data nodes data delivery feature. A change to the FTP option for the HOBO data nodes data delivery feature so that it uses passive mode,which allows for better connections through firewalls. An update to the Conductivity Assistant, which includes refinements in the calculation of temperaturecompensation and a new option for non‐linear, sea water compensation based on PSS‐78. A revision to the calculation for T‐CDI‐5200‐10S and T‐CDI‐5400‐20S sensors when used with U‐Seriesloggers ensuring data is displaying properly. Support for Java 7®.<strong>HOBOware</strong> 3.2.1: The integration of the Alarm & Readout Tool, which is now automatically installed and available for use fromthe Tools menu. The ability for all non‐administrator users to run <strong>HOBOware</strong> on Windows (administrator privileges arerequired to install <strong>HOBOware</strong>, map and unmap file assocations, and load new Data Assistants). Compatibility with iMac ® and MacBook ® Pro and Intel ® Core i5 and i7 processors. A revision to the calculation for the S‐SMD Soil Moisture Sensor ensuring data is displaying accurately. The option to create new files or overwrite existing ones via FTP when using the Data Delivery feature forHOBO Data Nodes. This allows you to automatically import wireless node CSV data into other applications,such as Microsoft ® Excel ® .<strong>HOBOware</strong> User’s <strong>Guide</strong> 10
<strong>HOBOware</strong> 3.2:A redesigned launch window for quick logger configuration and easy sensor setup.Faster processing times for opening large data files (512KB and up).The ability to configure filtered series when launching the logger, which automatically generates customseries, such as average temperature per day, when you read out the logger and plot data.The ability to configure Pulse Scaling, Linear Scaling, and kWh Data Assistant series when launching anylogger with applicable external sensorsSupport for the new HOBO 4‐Channel Pulse Input Data Logger (UX120‐017x), including advanced sensorconfiguration for setting maximum pulse frequency and lockout times as needed in raw pulse and eventchannels.Support for the new E50B2 Power & Energy Meter (T‐VER‐E50B2), including single‐step configuration withthe HOBO 4‐Channel Pulse Input Data Logger (UX120‐017x) and automatic calculation of numerousadditional data series for analysis.Support for the new HOBO Conductivity Logger (U24‐002).The option to disable logging the battery channel by default on some loggers, which can extend battery lifeand memory space.Note: Loggers launched in <strong>HOBOware</strong> 3.2 or later with series created by the Pulse Scaling, Linear Scaling, and kWhData Assistants or with filtered series cannot be read out in earlier versions of <strong>HOBOware</strong>.Installing <strong>HOBOware</strong>You can install <strong>HOBOware</strong> from the Onset Web site or from the Installation CD. Note: You must be anadministrator to install <strong>HOBOware</strong>.The first time you install <strong>HOBOware</strong> it will be in Trial Mode. You will need to activate it entering your license key,or continue to run it in Trial Mode until the trial expires. If you are updating an existing version of <strong>HOBOware</strong> youwill not need to activate <strong>HOBOware</strong>. See Activating <strong>HOBOware</strong> (page 12).Before You Begin README fileRefer to the <strong>HOBOware</strong> website at http://www.onsetcomp.com/<strong>HOBOware</strong> or the README file on theinstallation CD for detailed information about the hardware and software needed to run <strong>HOBOware</strong>. If youhave additional questions, please contact Onset Technical Support. License KeyThe license key is located in the email confirmation or online receipt you received when purchasing thesoftware. If you have a <strong>HOBOware</strong> CD, the license key is printed on the back of the CD case. After you install<strong>HOBOware</strong> and run it for the first time you will be prompted to enter the license key.Installing <strong>HOBOware</strong> from the Onset Web SiteTo download <strong>HOBOware</strong> from the Onset Web site, go to the following URL and follow the instructions fordownloading and installing <strong>HOBOware</strong>:http://www.onsetcomp.com/products/softwareWhen you install <strong>HOBOware</strong> form the web it will be in Trial mode until you enter your License Key.<strong>HOBOware</strong> User’s <strong>Guide</strong> 11
Installing <strong>HOBOware</strong> from the Installation CDTo install the software from the CD:WindowsMac1. Insert the CD in your computer’s CD‐ROM drive.The installation program should start automatically. If it does not, navigate to the CD drive in MyComputer or Windows® Explorer and double‐click <strong>HOBOware</strong>_Setup.exe to launch the <strong>HOBOware</strong>installer.NOTE: <strong>HOBOware</strong> for Windows requires the Java Runtime Environment. If the correct Java RuntimeEnvironment version is not already installed on your computer, the <strong>HOBOware</strong> Setup program will ask ifyou want to install it now. (You must be logged in as an administrator on your computer to install the JavaRuntime Environment.) Click Yes and follow the prompts. After Java Runtime Environment is installed, the<strong>HOBOware</strong> installation will continue.2. Follow the prompts to install <strong>HOBOware</strong>.To start <strong>HOBOware</strong>, double‐click the <strong>HOBOware</strong> icon on your desktop or select Programs > OnsetApplications > <strong>HOBOware</strong> from the Start menu.1. Insert the CD in your computer’s CD‐ROM drive.2. Double‐click the CD icon in the Finder and double‐click the <strong>HOBOware</strong>.pkg to launch the <strong>HOBOware</strong>installer.3. When you reach the final screen of the installation program, click Restart.4. After restarting, open <strong>HOBOware</strong> by double‐clicking the <strong>HOBOware</strong> icon in your computer’sApplications folder.5. Proceed to Activating <strong>HOBOware</strong>.Software UpdatesIf you have an Internet connection, <strong>HOBOware</strong> will periodically ask if you would like it to check the Onset websitefor software updates. The default is to check once per week, but you can configure <strong>HOBOware</strong> to check daily ormonthly.Go to Preferences > General > Startup > Check for <strong>HOBOware</strong> updates.If you do not have an Internet connection, choose Never.You may check for updates manually at any time by clicking Check for Updates from the Help menu.NOTE: If you are using HOBOnode Manager with HOBO Data Node Wireless Network, you must stop devicecommunication to upgrade <strong>HOBOware</strong>.Upgrading to <strong>HOBOware</strong> ProTo upgrade from <strong>HOBOware</strong> Lite to <strong>HOBOware</strong> Pro, call 1‐800‐564‐4377 and ask for Onset Customer Service.Activating <strong>HOBOware</strong>The first time you install <strong>HOBOware</strong> it will be in Trial Mode. You will need to activate it entering your license key,or continue to run it in Trial Mode until the trial expires.<strong>HOBOware</strong> User’s <strong>Guide</strong> 12
Running the Setup Assistant at a Later TimeTo run the Setup Assistant at any time, go to:Windows: File > Preferences > GeneralMac: <strong>HOBOware</strong> > Preferences > Generaland click the Setup Assistant button in the bottom right of the pane.Using a Trial Version of <strong>HOBOware</strong>The first time you open <strong>HOBOware</strong> the License Key Manager window will appear. To run a Trial Version, checkI want to use <strong>HOBOware</strong> Pro Trial and click OK.The date your trial will expire appears at the top of the <strong>HOBOware</strong> window.Each time you open a Trial Version the License Key Manager window appears. Check I want to use <strong>HOBOware</strong> ProTrial to continue using the Trial Version, or, if you have purchased <strong>HOBOware</strong>, enter the license key in the LicenseKey text box.Trial ExpirationWhen the trial expires you will be prompted to enter a license key before you can continue using <strong>HOBOware</strong>.<strong>HOBOware</strong> User’s <strong>Guide</strong> 14
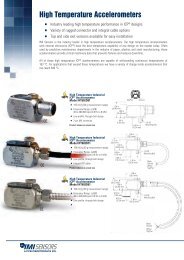
A Tour of the <strong>HOBOware</strong> InterfaceThe illustration below shows the <strong>HOBOware</strong> main window, including a plot generated from opening an existingdata file.1. Main Menu ‐ From the Main Menu you can perform operations on a device or a project.2. Toolbar ‐ The toolbar includes icons for performing operations on a device as well as tool tomanipulate a plot or graph. For more information see The Toolbar on page 210.3. Points Table ‐ Logger data presented in a tabular format. See The Points Table on page 18.4. Details Pane ‐ Information and statistics about the launch. See The Details Pane on page 17.5. Plot ‐ A graphical representation of the sensor readings and events. See Overview of a Plot on page16.6. Views ‐ Use these icons to toggle between views when you have multiple plots open.<strong>HOBOware</strong> User’s <strong>Guide</strong> 15
7. Message Bar ‐ Indicates devices connected as well as various actions in progress (such as readout,launch).Overview of a PlotA plot is a visual representation of the series you selected to view when you opened the plot.To change default plot settings, see Plotting Preferences on page 222.1. TitleTitle of the graph (default is the description entered at launch). Show or hide the Title from the Viewmenu.To change the title properties, double‐click the title or select the title and click the Properties icon .The following options are available on the Title Properties window:Name: Enter up to a 40‐character title for the graph. By default, the name is the description entered whenlaunching the logger.Location: Move the title to either the top or bottom of the graph. The default location is the top of thegraph.Font: Select a font type, size, and appearance.2. AxesThe graph can contain several value axes depending on the number of series displayed.Y axisAlso called the value axes; displays the values for all sensor series, such as temperature in degreesFahrenheit or Celsius, or battery level in Volts.X axisAlso called the time axes; displays the time ranges for the data.3. Gridlines<strong>HOBOware</strong> User’s <strong>Guide</strong> 16
Show or hide vertical and horizontal gridlines from the View menu.4. LegendThe legend is the area that lists the keys for each series (line colors and marker types). If the crosshair toolis in use, it also lists the date, time and point values currently selected by the crosshair. Show or hide theLegend from the View menu.To change the legend properties, double‐click the legend or select the legend and click the Properties icon.The following options are available on the Legend Properties window:Name: Enter up to a 40‐character title for the legend. There is no default name.Location: Move the legend to either the left or right side of the graph. By default, the legend appears onthe right.Show Border: Toggles whether a box is drawn around the legend. By default, a border is shown.For secure files (<strong>HOBOware</strong> Pro: .hsec and .dsec; <strong>HOBOware</strong> Lite: .hsec) a padlock iconlegend next to the names of the series that were verified as original data.appears in theThe Details PaneFor each series, event, and state, the Details Pane contains information and statistics, including: Devices ‐ Device Info such as the model and serial number. Deployment Info ‐ Such as series name, launch description, and launch time. (Does not apply to HOBOdata nodes) Series Statistics ‐ Such as number of samples, average reading, and sample time. Sensor information (for station‐type loggers) ‐ Including the sensor location, serial number, andresolutionIn <strong>HOBOware</strong> Pro, if you do not want plots to open with the sensor location shown in the Points and Details panes,go to Preferences > Plotting > Points Table and Details pane and disable the "Include sensor Location (if available)in points table and details pane" option.To display the Details pane in <strong>HOBOware</strong> Lite, choose Details Pane from the View menu. Choose Details Paneagain to hide the pane.Deployment information ‐ Such as the launch description, deployment number, start time andtime zone, logging interval, and battery voltage at launch.Series statistics ‐ Including the total sensor samples and events, time of the first and last sample,and the maximum, minimum, average, and standard deviation for each sensor series in the plot<strong>HOBOware</strong> User’s <strong>Guide</strong> 17
Audit trail information for secure filesTo fully expand the details tree, click the Show All button. To fully collapse the tree, click Hide All.Click a series node in the details tree to select the corresponding series on the graph and corresponding column inthe Points Table.To print the details tree, go to the File menu and choose Print Details. To export the details tree to a text file, go tothe File menu and choose Export Details.To resize the pane, drag the divider between the Details pane and the graph.You can hide the Details pane. From the View menu, choose Details Pane. Choose Details Pane again to redisplaythe Details pane.NOTE: You can configure if the Details pane is shown by default with the Show the details pane when plotting dataoption in Preferences > Plotting > Layout.The Points TableThe Points table lists logger data in a table. The Points table is linked to the graph: only the data for the sensormeasurements, states, and events displayed on the graph are listed in the Points table.The data points are listed chronologically. All the measurements, state changes, and events recorded by the loggerat a given time are listed in a single row. Each series is displayed in a column. You can resize the columns byclicking and dragging the dividers between the column headers.Use the arrow keys or scroll bars to move up, down, left, and right in the Points table. Additionally, as you click thecrosshair tool in the graph, the corresponding point is selected in the Points table; if you click a value or eventcell in the Points table, the crosshair will appear on the graph at the time corresponding to that cell.To print the points, go to the File menu and choose Print Points (available only with Java 1.5 or higher). To copypoints, use the mouse to select the cells you want to copy, then press Ctrl+Command‐C to copy them to theclipboard.Tip: You can export the data points to a text file for use in Microsoft® Excel® or other programs.To resize the pane, drag the divider between the Points table and the graph.To hide the Points table, from the View menu, choose Points Table.If you do not want the Points table to be displayed by default when you view data, go to Preferences> Plotting> Layout and disable "Show the points table when plotting data" option.<strong>HOBOware</strong> ProIf you do not want plots to open with the sensor location shown in the Points and Details panes, disable the"Include sensor Location (if available) in points table and details pane" setting under Points Table & Details Paneon the Plotting Preference pane.<strong>HOBOware</strong> User’s <strong>Guide</strong> 18
<strong>HOBOware</strong> LiteTo display the Points table, choose Points Table from the View menu. Choose Points Table again to hide the Pointstable.The Plot Setup WindowAfter you read out a logger or open a saved datafile, the Plot Setup window appears.1. Description ‐ Enter text to describe the plot.2. Select Series to Plot ‐ Select the series you want to plot and the units, if applicable.3. Select Internal Logger Events to Plot ‐ Select internal logger events to plot (only available for someloggers).4. Offset from GMT ‐ Set the Time Zone Offset from GMT if required.5. Data Assistants (<strong>HOBOware</strong> Pro Only) ‐ See Data Assistants on page 88.<strong>HOBOware</strong> Pro Data Assistants let you create new data series by combining data recorded by the loggerwith additional data.NOTE: The following Data Assistants can also be run from the Launch window: Pulse Scaling, LinearScaling, kWh.6. Plot Button ‐ Click this button to plot the selected data on a graph.<strong>HOBOware</strong> Software UpdatesIf you have an Internet connection, <strong>HOBOware</strong> will periodically ask if you would like it to check the Onset websitefor software updates. The default is to check once per week, but you can configure <strong>HOBOware</strong> to check daily ormonthly.Go to Preferences > General > Startup > Check for <strong>HOBOware</strong> updates.If you do not have an Internet connection, choose Never.You may check for updates manually at any time by clicking Check for Updates from the Help menu.<strong>HOBOware</strong> User’s <strong>Guide</strong> 19
Chapter 2: Working with HOBO Data LoggersWorking with HOBO data loggers involves the following basic steps:1. Connect the logger to the computer for the initial setup and launch.2. Launch the logger. Enter or select the appropriate parameters for the logger deployment and thenlaunch, or start, the logger.3. Check the status of the logger. You have the option of checking the current status of the logger andany current readings while it is still connected to the computer. This can be helpful to verify that thelaunch configuration is as expected.4. Read out the logger. After deploying the logger, read out all recorded data and save it to a file. Manydevices also work with shuttles that allow you to keep the logger in the field, but still read out anyrecorded data. You can then bring the shuttle back to the office, connect it to the computer, offloadand save the files.5. Plot the data. After reading out the logger and saving the data, you can select and define the dataseries you wish to plot in a graph. <strong>HOBOware</strong> Pro also provides Data Assistants for automatic scalingof certain data when plotting.6. Analyze the data and customize the plot. There are numerous tools available for working with the dataand changing the plot, such as exporting, filtering, merging files, cropping, and more.7. Save changes to the plot as a project file. Changes to the axis, series, plot, and legend properties aswell as any filtering or merging can be saved as a .hproj file.NOTE: If you are configuring HOBO data nodes, see the summary of tasks on page 1 for setting up data nodes.Connecting DevicesMost HOBO data loggers and shuttles connect to the computer with an Onset‐supplied USB cable. TheHOBO Weather Station, HOBO Micro Station, and HOBO Energy Logger connect to the computer with a serial cable(or to a USB port with a Keyspan serial adapter).Some loggers require an optic USB base station/coupler to connect to the computer. Consult the manual thatcame with your device for specific information about required base stations/couplers or cables.Refer to one of these topics for details about connecting your device to the computer:NOTES: Connecting a USB Device (page 21) Connecting a Base Station/Coupler (page 21) Connecting a Serial Device (<strong>HOBOware</strong> Pro Only) (page 22) Connecting Multiple Devices (page 22) For instructions on connecting <strong>HOBOware</strong> compatible shuttles or using the HOBO Waterproof shuttleas a base station, refer to the shuttle's user guide. <strong>HOBOware</strong> Lite can be used with most HOBO U‐Series Data Loggers, which communicate with thecomputer by connecting to a USB port. For details on working with HOBO Data Nodes, see System Overview.<strong>HOBOware</strong> User’s <strong>Guide</strong> 20
Connecting a USB DeviceYou can connect most devices to the USB port by using an Onset‐supplied USB interface cable.Some loggers require an optic USB base station/coupler or serial cable (<strong>HOBOware</strong> Pro only) to connect to thecomputer. Consult the manual that came with your device for specific information about required basestations/couplers or cables.NOTE (<strong>HOBOware</strong> Pro): For instructions on connecting shuttles, or using the HOBO Waterproof Shuttle as a basestation, refer to the shuttle’s user guide.NOTE: If you are using a Base Station or Coupler, see Connecting a Base Station or Coupler (page 21).StepsTo connect a logger or shuttle to <strong>HOBOware</strong> using a USB cable:1. Open <strong>HOBOware</strong>.2. Plug the large end of the USB interface cable into a USB port on the computer.3. Plug the small end of the USB interface cable into the port on the device. (Refer to the diagram andinstructions that came with the device if you need help finding the port.)When the device is recognized by <strong>HOBOware</strong>, the right side of the status bar at the bottom of the <strong>HOBOware</strong>window will update to reflect the number of devices connected. At this point, you can begin using the device.NOTES (Windows Only): If the device has never been connected to this computer before, it may take some time for thecomputer to detect the new hardware and report that it has connected successfully. One or moremessages will appear, indicating that new hardware has been found. You may also hear a chime.Your computer may tell you to reboot before you can use the device. It is not necessary to reboot.Disconnecting a DeviceTo disconnect the device, simply unplug it from the USB cable. Wait for the status bar to update the number ofdevices before continuing.Connecting a Base Station or CouplerSome loggers require an optic USB base station/coupler or serial cable to connect to the computer. Consult themanual that came with your device for specific information about required base stations/couplers or cables.NOTES (Windows Only): If you are connecting a base station/coupler or logger that has never been connected to this computerbefore, it may take some time for the computer to detect the new hardware and report that it hasconnected successfully. One or more messages will appear, indicating that new hardware has beenfound. You may also hear a chime.You may be prompted to reboot you computer before you can use the logger. It is not necessary toreboot.StepsTo connect a logger to a base station/coupler:1. Open <strong>HOBOware</strong>.<strong>HOBOware</strong> User’s <strong>Guide</strong> 21
2. Plug the base station/coupler cable into a USB port on the computer.Important: Make sure the base/station coupler is the correct model for the logger you want to use. Consultthe manual that came with the logger if you are not sure.3. Attach the logger to the base station/coupler as described in the documentation that came with yourlogger.When the logger is recognized by <strong>HOBOware</strong>, the right side of the status bar at the bottom of the <strong>HOBOware</strong>window will update to reflect the number of loggers connected. At this point, you can begin using the logger.To disconnect a logger, simply unplug it from the base station/coupler. Wait for the status bar to update thenumber of devices before continuing.To attach another logger via a base station/coupler, remove the logger, leaving the base station/couplerconnected. Then connect the next logger.Connecting a Serial Device (<strong>HOBOware</strong> Pro Only)To connect a device to a computer using a serial cable:1. Open <strong>HOBOware</strong> Pro.2. Plug the 9‐pin end of the serial interface cable into a serial port on the computer or Keyspan adapter.3. Plug the other end of the serial interface cable into the communications port on the device. (Refer tothe diagram and instructions that came with the device if you need help finding the port.)4. Click the Select Device icon on the toolbar to ensure that the device is listed in the Select Devicewindow. Click the button next to the device in the window, then click OK.5. Configure Serial Port Settings (Optional)If you are using a serial port other than COM1 (PC) or Default (Macintosh), you will need to set up<strong>HOBOware</strong> to look at another port.To change the Serial Ports setting go to:PC: File > Preferences > CommunicationsMac: <strong>HOBOware</strong> Pro > Preferences > CommunicationsNote that checking multiple serial ports can take some time, even when no devices are attached.The status bar at the bottom of the <strong>HOBOware</strong> Pro window will update to reflect that the device is connected andselected. At this point, you can begin using the device.To disconnect the device, simply unplug it from the serial cable.Connecting Multiple DevicesOverviewIf your computer has multiple USB and serial ports, you can connect multiple devices and work with one at a time(<strong>HOBOware</strong> Lite can only be used for USB Ports). When multiple devices are connected, the Select Device windowopens every time you select Launch, Readout, Stop, or Status from the Main Menu.Click the button next to a device on the list to select it, then click OK. The selected action will proceed.To access the Select Device window at any time, click the Select Device icon on the toolbar, or choose SelectDevice from the Device menu.<strong>HOBOware</strong> User’s <strong>Guide</strong> 22
With <strong>HOBOware</strong> Pro, if you work with multiple U‐Series devices frequently, you can set the Default Action toLaunch (Device menu) and enable Launch Time‐Saving Options to work more efficiently.NOTE (<strong>HOBOware</strong> Pro): If serial devices are selected in Preferences, it may take some time for <strong>HOBOware</strong> Pro toscan all of the serial ports. You can select the device you want as soon as it is displayed. You do not have to wait forall of the ports to be scanned.Verifying Selected DeviceIf the Blink Device Light button is available, you can click it to verify that you have selected the appropriate device.This briefly illuminates the light on the devices that you have selected.If the device does not have a light, or if the light is not visible when the devices is in the base station/coupler,simply check the serial number (S/N) on your devices to make sure that it matches the one that is selected in thiswindow.When the Select Device window is not open, you can check the status bar at the bottom of the screen to quicklydetermine which device is selected. The left side of the status bar indicates the model, description, and serialnumber of the device; the right side indicates the total number of devices connected.NOTE (<strong>HOBOware</strong> Pro): Serial devices that you have added or removed are not reflected in the device count untilyou click the Select Device icon on the toolbar to update the device list.Launching DevicesTo set up a logger to record data, you must specify several parameters and launch, or start, the logger.Tip: Check that the time on the computer is correct before configuring a launch. If it is not, close <strong>HOBOware</strong>,update your computer's clock manually or synchronize it with an online time server (if available) and then reopen<strong>HOBOware</strong>.To launch a logger:1. Connect the logger to the computer.2. Click the Launch icon on the toolbar, or choose Launch from the Device menu.3. Different messages may appear depending on the state of the logger. Answer each of the promptsaccordingly:A warning appears if the logger has already been launched. Click Yes to continue, or click No to cancel.For U‐Series loggers only (other than the HOBO U30 Station), a warning appears if the logger has recordeddata since its last readout. Click Yes to proceed to the launch window, or click No to cancel the launch andread out the data first.Because loggers are tested before shipping, there may be data in your logger the first time you launch it.In this case, it is not necessary to read out the logger. Click Yes to proceed.4. Configure the launch parameters in the Launch Logger window.5. To verify that the sensors are working correctly or to review settings from the previous launch, clickthe Status button.6. Click the Start button when you are finished setting the launch parameters (note that this text on thisbutton changes depending on when you chose logging to begin).<strong>HOBOware</strong> displays the progress of the launch and warns you not to unplug the logger while it is beingconfigured.Once the logger begins logging, it will continue logging until you stop it, the memory is full, or the battery runs out.<strong>HOBOware</strong> User’s <strong>Guide</strong> 23
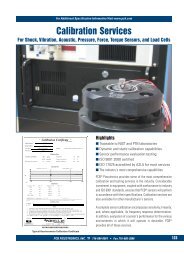
Launch Logger WindowUse the Launch Logger window to set up your logger to record data. The Launch Logger window is divided into thefollowing three panes: Logger Information: The name of the logger currently selected appears at the top of this pane,which also includes the serial number, deployment number, and current battery level.Use the Description field to type up to a 40‐character name for the logger deployment. Thedescription you enter here will be used as the default file name when you read out the logger andsave the data. It will also be the default title on the plot.Click the Status button in this pane to see the current status of the logger and the settings used onthe previous launch.A User Notes button may also appear for some loggers. Click it to enter more extensive notes aboutthe deployment. Sensors: This pane displays a list of the sensors available for the logger. Choose the sensors, orchannels, that you wish to log in this deployment, and select any external sensors you may be using.This pane also displays any utilities available for your logger, such as Alarms, Scaling, and Filters. Deployment: Use this pane to select the logging interval (the rate at which you want the logger torecord data) and to choose when the logger should begin recording data. This pane also displays thelogging duration, which is the approximate time it will take to fill the logger memory based on thelogging interval, sensors, and other settings currently selected.For some loggers, you can also set a sampling interval, choose when to stop logging, and select otheroptions in this pane.When you are done choosing the launch settings, click the button in the lower right‐hand corner of the window tosend the settings to the logger. Note that the button text changes based on when you chose to start logging.<strong>HOBOware</strong> Pro Tip: If you will be using the same launch settings for multiple deployments of the same logger type,select the Skip Launch Window Next Time checkbox to bypass this window the next time you launch a device. Thiswill cause the next logger to be launched with either the previous launch settings or the current logger settings asset in Launch Time‐Saving Options preferences.The options available in the Logger Launch window vary depending on the type of logger you are using. For moredetails about launching your particular device, refer to the following topics: Launch Options for the HOBO UX90 Series Loggers Launch Options for the HOBO UX100 Series Loggers Launch Options for the HOBO 4‐Channel Pulse Input Data Logger (UX120‐017x) Launch Options for U‐Series Loggers Launch Options for Station Loggers<strong>HOBOware</strong> User’s <strong>Guide</strong> 24
Launch Options for HOBO UX90 Series LoggersThe following launch options are available for HOBO UX90 series data loggers. Note that the Launch Loggerwindow may vary from the example shown below.Logger InformationSensorsDescription: Enter a description for the launch, up to 40 characters, in this field. This description is used asthe default file name when you read out and save the data recorded by the logger. It is also the defaulttitle of the plot.Serial Number: This is the serial number for the logger. Note that some external sensors or devices alsohave serial numbers, which are not listed here.Deployment Number: This is the number of times (including this time) the logger has been launched.Each time you start a new launch, the deployment number increases by one.Battery Level: This shows the current battery level in the logger.Status: Click the Status button to check the logger settings from the previous launch.The Sensors List displays all internal and external sensors available for recording data. Choose the sensors, orchannels, that you wish to log in this deployment. To configure a sensor:1. Select the sensor(s) you wish to log.2. Choose the measurement to log (e.g. State, Runtime, etc.) from the drop‐down list.3. Complete additional details for the sensor. This will vary depending on what the logger will be measuring.For most sensors, type a name and select a description pair from the drop‐down list. For external Pulsechannels, click the button for the corresponding channel in the sensor list to select the sensor type asshown below. If you select Raw Pulse for the sensor type, you can use Data Assistants to set up kWh andpulse scaling information as necessary (<strong>HOBOware</strong> Pro only), which will also display on the logger<strong>HOBOware</strong> User’s <strong>Guide</strong> 25
LCD screen. Note that sensors that support Data Assistants at launch time display the kWh and/or scalingicon next to their name.4. Repeat steps 1 through 3 if your logger supports multiple sensors.5. Set the units that display on the logger's LCD screen. When the sensor is configured to log State orRuntime, choose either:“Time” to show the total amount of time the switch has been closed or on since logging began,ranging from seconds to days; or“%” to show the percentage of time the switch has been closed or on since logging began.When the sensor is configured to log Pulse or Event, the LCD will display the units in three characters.Accept either the default units or type your own three‐character units.Notes on configuring sensors:DeploymentClick the Filters button to create additional filtered series for any of the channels you configured. Thefiltered series will then be automatically calculated when you read out the logger and plot the data.Click the Advanced button to access the following settings specific to the logger: Pulse Frequency andLockout Time, Occupancy, and Calibration.When setting up a pulse sensor, consider setting up the launch for a delayed or push button start, andthen connect the sensors/devices later, before logging begins. Important: Sensors that are connectedafter logging begins may not log accurate data.The Occupancy/Light logger (UX90‐005x/‐006x) also automatically generates additional series uponreading out the logger to give you combined statistics, such as how long the lights were left on while theroom was unoccupied. These series will be available in the Plot Setup dialog when opening the datafile.You have the option to record the logger's battery voltage at each sample time; this is the last channel inthe sensors list. Like the other data channels, logging the internal battery channel consumes some of thelogger's memory. Unless you suspect abnormal battery performance, you do not need to log the batteryvoltage. This logger will record a bad battery event even if it is not logging the battery channel. You canalso hide the battery channel with Series preferences (in Preferences, select Display, then Series).Logging Interval. Select how often the logger will record data (only available for sensors configured to logPulse or Runtime). You can choose either one of the preset logging intervals or specify a custom logginginterval. The minimum logging interval is one second and the maximum for most loggers is 18 hours, 12minutes, and 15 seconds. The shorter the logging interval, the more quickly memory fills and batterypower is consumed.Logging Duration. This lists the approximate time it will take to fill the logger memory based on thelogging interval and sensors currently selected. This is a theoretical estimate only; battery life andfrequent state and event logging will affect your deployment. This estimate is only available when thesensors are configured to log Pulse or Runtime. For estimates with State and Event logging, refer to thelogger documentation, also available at http://www.onsetcomp.com/support/manuals.<strong>HOBOware</strong> User’s <strong>Guide</strong> 26
Start Logging. Select when to launch the logger. This defaults to the setting for the logger's previouslaunch. See Launch Time‐Saving Options (<strong>HOBOware</strong> Pro). You can choose to launch this logger:• Now. Logging begins as soon as you click the Start button in the Launch Logger window.• At Interval. Logging will begin at an exact interval (for example 9:00:00 rather than 8:47:00 whenyou choose a one‐hour logging interval). The exact start time depends on the logging interval youchoose. This option is only available when the sensors are configured to log Pulse or Runtime.• Push Button. Logging will not start until you press the Start/Stop button on the logger and hold itdown for at least three seconds. The LCD screen on the logger will display "Start" until you pressthe button.• On Date/Time. Logging will begin at a date and time you specify, up to approximately six monthsfrom the present. The LCD screen will count down to that start date/time and then logging willbegin.Stop logging. Select when you want the logger to stop logging. You can choose:• When memory fills or Never (wrapping). If you select "When memory fills," then the logger willstop recording data once the memory is full. If you select "Never (wrapping)," the logger willrecord data continuously until either the logger battery runs out or you stop it. Once the logger isfull, the newest data will overwrite the oldest data. When wrapping, the memory segment on thelogger LCD screen will blink.• Push button. When this option is selected, the logger will stop recording data when you press theStart/Stop button on the logger itself for 3 seconds. The LCD screen on the logger will display"Stop" when this option has been selected.• Specific stop date. Select the date you want the logger to stop recording data. Choose either apreset time or set your own custom date and time.Options. Select "Turn LCD off" if you want the logger to operate in "stealth mode" with the LCD screenturned off. You can override this temporarily by pressing the Start/Stop button on the logger. The LCD willthen remain illuminated for 10 minutes.Skip launch window next time (<strong>HOBOware</strong> Pro)Check this box if you would like to bypass the Launch Window the next time you choose Launch from the Devicemenu or click the Launch icon. This will cause the next logger to be launched with either the previous launchsettings or the current logger settings as set in Launch Time‐Saving Options in the General tab of preferences.<strong>HOBOware</strong> User’s <strong>Guide</strong> 27
Launch Options for HOBO UX100 Series LoggersThe following launch options are available for HOBO UX100 series data loggers. Note that the Launch Loggerwindow may vary from the example shown below.Logger Information Description. Enter a description for the launch, up to 40 characters, in this field. This description isused as the default file name when you read out and save the data recorded by the logger. It is alsothe default title of the plot.Sensors Serial Number. This is the serial number for the logger. Note that some external sensors or devicesalso have serial numbers, which are not listed here. Deployment Number. This is the number of times (including this time) the logger has beenlaunched. Each time you start a new launch, the deployment number increases by one. Battery Level. This shows the current battery level in the logger. Status. Click the Status button to check the logger settings from the previous launch.The Sensors List displays all sensors available for recording data. Choose the sensors, or channels, that you wish tolog in this deployment. If connecting a thermocouple, select the appropriate type from the drop‐down list.Notes: Click the Alarms button to set an alarm for this logger. Note that the Logging Mode must be set toNormal or Statistics to configure an alarm. Click the Filters button to create additional filtered series for any of the channels you configured. Thefiltered series will then be automatically calculated when you read out the logger and plot the data.<strong>HOBOware</strong> User’s <strong>Guide</strong> 28
You have the option to record the logger's battery voltage at each sample time; this is the last channelin the sensors list. Like the other data channels, logging the internal battery channel consumes someof the logger's memory. Unless you suspect abnormal battery performance, you do not need to logthe battery voltage. This logger will record a bad battery event even if it is not logging the batterychannel. You can also hide the battery channel with Series preferences (in Preferences, select Display,then Series).Deployment Logging Interval. Select how often the logger will record data. You can choose either one of thepreset logging intervals or specify a custom logging interval. The minimum logging interval is onesecond and the maximum for most loggers is 18 hours, 12 minutes, and 15 seconds. The shorter thelogging interval, the more quickly memory fills and battery power is consumed. Logging Mode. Select the type of logging mode you wish to use: Normal, Burst Logging, or Statistics.With Burst Logging mode, you can configure the logger to use a different logging interval whenspecific conditions are met. With Statistics mode, you can configure the logger to calculate maximum,minimum, average, and standard deviation for all enabled sensors (except battery voltage) duringlogging at a sampling interval you specify. Keep in mind that the more statistics you record, theshorter the logger duration and the more memory is required. Once you launch the logger, theselected statistics will be displayed on the logger LCD. After you set up Burst or Statistics logging,there will be an Edit button next to Logging Mode in the Launch Logger window to make additionalchanges as necessary. Note that Normal or Statistics mode is required if you want to set up alarms forthe logger. Logging Duration. This lists the approximate time it will take to fill the logger memory based on thelogging interval, logging mode, and sensors currently selected. This is a theoretical estimate only;battery life and other factors will also affect the deployment. Start Logging. Select when to launch the logger. This defaults to the setting for the logger's previouslaunch (you can change this in <strong>HOBOware</strong> Pro with the Launch Time‐Saving Options subcategory ofthe General preferences). You can choose to launch this logger:• Now. Logging begins as soon as you click the Start button in the Launch Logger window.• At Interval. Logging will begin at an exact interval (for example 9:00:00 rather than 8:47:00 whenyou choose a one‐hour logging interval). The exact start time depends on the logging interval youchoose.• On Date/Time. Logging will begin at a date and time you specify, up to approximately six monthsfrom the present. The LCD screen will count down to that start date/time and then logging willbegin.• Push Button. Logging will not start until you press the Start/Stop button on the logger and hold itdown for at least three seconds. The LCD screen on the logger will display "Start" until you pressthe button. Stop Logging. Select when you want the logger to stop logging. You can choose:• When memory fills or Never (wrapping). If you select "When memory fills," then the logger willstop recording data once the memory is full. If you select "Never (wrapping)," the logger willrecord data continuously until either the logger battery runs out or you stop it. Once the logger isfull, the newest data will overwrite the oldest data. When "Never (wrapping)" is selected, a wrapindicator icon will display on the logger LCD screen. Note: You cannot select “Never (wrapping)”if Burst is selected for the Logging Mode.• Push button. When this option is selected, the logger will stop recording data when you press theStart/Stop button on the logger for three seconds. The LCD screen on the logger will display"Stop" when this option has been selected.<strong>HOBOware</strong> User’s <strong>Guide</strong> 29
• Resume logging on next button push. This setting is available when "Push button" is selected as a"Stop Logging" option. If you select this option, you can resume logging on a stopped logger bypressing the Start/Stop button for three seconds. For example, press the Start/Stop loggingbutton on the logger once to stop logging. Then, a few minutes, hours, or even days later whenyou are ready to continue logging, press the Start/Stop button on the logger again and loggingwill resume using the same logging interval from the last launch. You can then continue to startand stop logging as often as you'd like during this same deployment. Any gaps between whenyou stopped and restarted logging during this deployment will be reflected on the plotted datawhen you read out the logger. Once you relaunch the logger with <strong>HOBOware</strong> or the U‐Shuttle, anew deployment and new datafile will begin. The data from the previous deployment will not becarried over to the new one.• Specific stop date. Select the date you want the logger to stop recording data. Choose either apreset time or set your own custom date and time. Note: If you select a specific stop date andalso have the logger configured to resume logging on the next button push, then the logger willstop logging at the date you select regardless of how many times you stop and restart the loggerwith the Start/Stop button. Options. Select "Turn LCD off" if you want the logger to operate in "stealth mode" with the LCDscreen turned off. You can override this temporarily by pressing the Start/Stop button on the logger.The LCD will then remain illuminated for 10 minutes.Skip launch window next time (<strong>HOBOware</strong> Pro)Check this box to bypass the Launch Window the next time you choose Launch from the Device menu or click theLaunch icon. This will cause the next logger to be launched with either the previous launch settings or the currentlogger settings as set in the Launch Time‐Saving Options subcategory of the General preferences.Important: After you choose the launch settings in this window and click Start, the settings are then loaded intothe logger. The LCD screen on the logger will display “LOAD” during this process. If you disconnect the logger fromthe USB cable before this process is finished, “Err” will appear on the LCD screen instead. If you see “Err” at anypoint during launch configuration, check the USB connection between the computer and the logger, reopen theLaunch Logger window and click Start again.<strong>HOBOware</strong> User’s <strong>Guide</strong> 30
Launch Options for the HOBO 4‐Channel Pulse Input Data Logger(UX120‐017x)The following launch options are available for the HOBO 4‐Channel Pulse Input Data Logger (UX120‐017x). Notethat the Launch Logger window may vary from the example shown below.Logger Information Description. Enter a description for the launch, up to 40 characters, in this field. This description isused as the default file name when you read out and save the data recorded by the logger. It is alsothe default title of the plot.Sensors Serial Number. This is the serial number for the logger. Note that some external sensors or devicesalso have serial numbers, which are not listed here. Deployment Number. This is the number of times (including this time) the logger has beenlaunched. Each time you start a new launch, the deployment number increases by one. Battery Level. This shows the current battery level in the logger. Status. Click the Status button to check the logger settings from the previous launch.The Sensors List displays all internal sensors and external channels available for recording data. Choose thesensors, or channels, that you wish to log in this deployment. To configure a channel:1. If you are using the logger with an E50B2 Power & Energy Meter, then select “for E50B2 Power& Energy Meter” in the Configure Sensors drop‐down list at the top of the Sensors pane. This willautomatically preselect the appropriate channels and pulse scaling factors, which you can thencustomize further in the following steps.<strong>HOBOware</strong> User’s <strong>Guide</strong> 31
For all other sensors/devices, select “Manually” in the Configure Sensors drop‐down list.2. Make sure the checkbox is enabled for the external channel you wish to log.3. Choose either Pulse, State, Event, or Runtime from the drop‐down list.4. For Pulse channels, click the button for the corresponding channel in the sensor list to select thesensor type as shown below. If you select Raw Pulse for the sensor type, you can use Data Assistantsto set up kWh and pulse scaling information as necessary (<strong>HOBOware</strong> Pro only. You can also adjustmaximum pulse frequency and lockout time by clicking the Advanced button. Note that sensors thatsupport Data Assistants at launch time display the Scaling and/or kWh icon next to their name.For State channels, type a name and select the Open and Closed state descriptions.For Event channels, type a name, adjust the increment, and type a unit description (or accept thedefault "units" for the description).For Runtime channels, type a name and select the % or time Off/On descriptions.5. Repeat steps 1 through 4 for each channel you wish to configure.Notes on configuring sensors: Although it is helpful to see the connected sensors/devices when setting up the launch, it is notrequired that you physically connect them while selecting sensor type options. You may set up thelaunch for a delayed or push button start, then connect the sensors/devices later, before loggingbegins. Important: Sensors that are connected after logging begins may not log accurate data. Click the Filters button to create additional filtered series for any of the channels you configured. Thefiltered series will then be automatically calculated when you read out the logger and plot the data. You have the option to record the logger's battery voltage at each sample time; this is the last channelin the sensors list. Like the other data channels, logging the internal battery channel consumes someof the logger's memory. Unless you suspect abnormal battery performance, you do not need to logthe battery voltage. This logger will record a bad battery event even if it is not logging the batterychannel. You can also disable the battery channel with Series preferences (in Preferences, selectDisplay, then Series).Deployment Logging Interval. Select how often the logger will record data. You can choose either one of thepreset logging intervals or specify a custom logging interval. The minimum logging interval is onesecond and the maximum for most loggers is 18 hours, 12 minutes, and 15 seconds. The shorter thelogging interval, the more quickly memory fills and battery power is consumed. If you did not selectany channels to log, this field will be disabled.<strong>HOBOware</strong> User’s <strong>Guide</strong> 32
Logging Duration. This lists the approximate time it will take to fill the logger memory based on thelogging interval and sensors currently selected. This is a theoretical estimate only; battery life andfrequent state and event logging will affect your deployment. If you are logging only state changesand events, no estimation is possible. Start Logging. Select when to launch the logger. This defaults to the setting for the logger's previouslaunch. See Launch Time‐Saving Options (<strong>HOBOware</strong> Pro). You can choose to launch this logger:• Now. Logging begins as soon as you click the Start button.• At Interval. Logging will begin at an exact interval (for example 9:00:00 rather than 8:47:00 whenyou choose a one‐hour logging interval). The exact start time depends on the logging interval youchoose.• Push Button. Logging will not start until you press the button on the logger and hold it down for atleast three seconds. The Waiting LED will blink on the logger until you press the Start/Stop button.• On Date/Time. Logging will begin at a date and time you specify, up to approximately six monthsfrom the present. The Waiting LED will blink on the logger until logging begins on the selecteddate/time. Stop logging. Select when you want the logger to stop logging. You can choose:• When memory fills or Never (wrapping). If you select "When memory fills," then the logger willstop recording data once the memory is full. If you select "Never (wrapping)," the logger willrecord data continuously until either the logger battery runs out or you stop it. Once the logger isfull, the newest data will overwrite the oldest data.• Push button. When this option is selected, the logger will stop recording data when you press theStart/Stop button on the logger itself for 3 seconds. If you also configured a Push Button start,then you must wait 5 minutes after logging begins before you can use the button to stop logging.• Specific stop date. Select the date you want the logger to stop recording data. Choose either apreset time or set your own custom date and time. Options. Select "Turn LEDs off" if you want the logger to operate in "stealth mode," which disablesthe Logging LED on the logger. The Waiting LED and the Test button/Activity lights will still remainoperational when this option is selected.Skip launch window next time (<strong>HOBOware</strong> Pro)Check this box if you would like to bypass the Launch Window the next time you choose Launch from the Devicemenu or click the Launch icon. This will cause the next logger to be launched with either the previous launchsettings or the current logger settings as set in Launch Time‐Saving Options preferences.<strong>HOBOware</strong> User’s <strong>Guide</strong> 33
Launch Options for Other U‐Series LoggersThe following launch options are available for USB U‐Series loggers other than the UX90, UX100, and UX120‐017x.Note that the Launch Logger window may vary from the example shown below.Logger Information Description. Enter a description for the launch, up to 40 characters, in this field. This description isused as the default file name when you read out and save the data recorded by the logger. It is alsothe default title of the plot.Sensors Serial Number. This is the serial number for the logger. Note that some external sensors also haveserial numbers, which are not listed here. Deployment Number. This is the number of times (including this time) the logger has beenlaunched. Each time you start a new launch, the deployment number increases by one. Battery Level. This shows the current battery level in the logger. Status. Click the Status button to check the logger settings used in the previous launch.The Sensors List displays all internal sensors and external channels available for recording data. Choose thesensors, or channels, you wish to log in this deployment. To configure an external sensor:1. Make sure the checkbox is enabled for the external channel you wish to configure.2. Click the button for the corresponding channel in the sensor list to select the sensor type as shownbelow. If the external sensor has not been configured, the button reads .Otherwise, the previous sensor type selected will be displayed on the button.3. Select the measurement category and then the specific sensor part number and range (if applicable).Note that the sensor part number must match the part number listed on the shrink tube on the sensorcable to record accurate data.<strong>HOBOware</strong> User’s <strong>Guide</strong> 34
4. Repeat steps 1 through 4 for each additional external sensor you wish to configure.Notes on configuring sensors: Although it is helpful to see the connected sensors when setting up the launch, it is not required thatyou connect the sensors during launch set‐up. You may set up the launch for a delayed or push buttonstart, then connect the sensors later, before logging begins. Important: Sensors that are connectedafter logging begins will not log any data. Alternatively, if you select an external channel, but do notplug the sensor in, false data will be recorded for that channel. Some loggers with RH or pressure sensors require that you also select the internal temperature sensorto log relative humidity or pressure. The dependency may be noted in the sensors list (see RelativeHumidity channel in the example above). Refer to the manual that came with your logger foradditional information. When both the internal temperature and RH sensors are selected, dew point will be calculatedautomatically. If external events or states are available for your logger, you can enter names to identify the eventand state channels that are in use. You can also rename the Open and Closed descriptions for eachstate, and enter increments and units for each event channel. <strong>HOBOware</strong> Pro Data Assistants let you create new data series by combining data recorded by thelogger with additional data. When you use a Data Assistant from the Launch Logger window, theparameter set is saved and applied to data every time you read out a logger or open the resultantdata file. The derived data is also shown when you check the latest readings in the Status window.Click the Scaling button to access the Data Assistants window and choose the Linear Scaling or PulseScaling Assistant. Click the Create button to run the assistant. After you enter values, click Save.Sensors that support Data Assistants at launch time display the Scaling icon next to their name. Some loggers have alarm functionality. Click the Alarms button, if available, to set alarms as desired.Sensors that have alarm functionality display the Alarms icon next to their name. Click the Filters button to create an additional filtered series, such as average temperature per day,automatically when you read out the logger and plot the data. You have the option to record the logger's battery voltage at each sample time; this is the last channelin the sensors list. Like the other data channels, logging the internal battery channel consumes someof the logger's memory. Unless you suspect abnormal battery performance, you do not need to log<strong>HOBOware</strong> User’s <strong>Guide</strong> 35
the battery voltage. A U‐Series logger (other than a HOBO U30 Station) will record a bad battery eventeven if it is not recording the battery channel. You can also disable the battery channel with Seriespreferences (in Preferences, select Display, then Series).Deployment Logging Interval. Select how often the logger will record data. You can choose either one of the presetlogging intervals or specify a custom logging interval. The minimum logging interval is one second andthe maximum for most loggers is 18 hours, 12 minutes, and 15 seconds. The shorter the logginginterval, the more quickly memory fills and battery power is consumed. If you did not select anychannels to log, this field will be disabled. See also Multiple Logging Intervals and Fast LoggingIntervals. Logging Duration. This lists the approximate time it will take to fill the logger memory based on thelogging interval and sensors currently selected. This is a theoretical estimate only; battery life andfrequent state and event logging will affect your deployment. If you are logging only state changesand events, no estimation is possible. DO Sensor Cap Expires (HOBO U26 Dissolved Oxygen logger only). If a DO sensor cap is installed onthe U26 logger, the date the cap expires is listed. The logger will not collect any data after the capexpires. For more details on the DO sensor cap, see Working with the HOBO U26 Dissolved OxygenLogger. Start Logging. Select when to launch the logger. This defaults to the setting for the logger's previouslaunch. See Launch Time‐Saving Options (<strong>HOBOware</strong> Pro). For U‐Series loggers, you can choose tolaunch the logger:• Now. Logging begins as soon as you click the Start button.• At Interval. Logging will begin at an exact interval (for example 9:00:00 rather than 8:47:00 whenyou choose a one‐hour logging interval). The exact start time depends on the logging interval youchoose.• Push Button/Using Coupler. (Available only on certain loggers.) Logging will not start until youpress the button on the logger and hold it down for at least three seconds, or return the logger tothe coupler without the base station for at least three seconds (refer to your logger manual formore information). If the logger has a light, it will flash quickly when logging begins.• On Date/Time. Logging will begin at a date and time you specify, up to approximately six monthsfrom the present.Skip launch window next time (<strong>HOBOware</strong> Pro)Check this box if you would like to bypass the Launch Window the next time you choose Launch from the Devicemenu or click the Launch icon. This will cause the next logger to be launched with either the previous launchsettings or the current logger settings as set in Launch Time‐Saving Options preferences.<strong>HOBOware</strong> User’s <strong>Guide</strong> 36
Launch Options for Station LoggersThe following launch options are available for Station loggers, which connect to the computer via serial cableinstead of USB cable. Note that the Launch Logger window may vary from the example shown below.Logger Information Description. Enter a description for the launch, up to 40 characters, in this field. This description isused as the default file name when you read out and save the data recorded by the logger. It is alsothe default title of the plot.Sensors Serial Number. This is the serial number for the logger. Note that some external sensors also haveserial numbers, which are listed in the Sensors pane. Deployment Number. This is the number of times (including this time) the logger has beenlaunched. Each time you start a new launch, the deployment number increases by one. Battery Level. This shows the current battery level in the logger. User Notes. Click this button to type up to 2000 characters of information about the deployment.This text will be displayed in the Details pane after you read out the logger and plot the data. Status. Click the Status button to check the logger settings from the previous launch.Only the sensors that are currently plugged in or built into the logger are listed. Sensors are listed in ascendingorder by serial number, regardless of their physical position in the logger. If you add or remove sensors, click theRefresh button to make sure your changes are seen by the logger and displayed in this list.You can assign a name to each sensor (up to 30 characters). This is helpful if you want to specify a location wherethe sensor will be placed or if you need to differentiate multiple sensors of the same type.<strong>HOBOware</strong> User’s <strong>Guide</strong> 37
Sensors must be connected prior to launching if you will be entering a name for the sensor or configuringFlexSmart modules or Analog Sensor Ports (use the Configure button to the right of the Label field). Otherwise,sensors do not have to be connected when setting up the launch. You may set up the launch for a delayed or pushbutton start, then connect the sensors later before logging begins.Notes about configuring sensor channels: Do not attach more than 15 channels of sensors. The logger cannot accommodate more than 15channels. In addition to logging up to 15 channels, the HOBO Energy Logger and HOBO U30 Station can recordtheir internal battery channel (other sensors must be attached; the logger cannot log battery alone).The logger's battery voltage is recorded at each interval. However, logging the internal batterychannel consumes some of the logger's memory. Unless you are using excitation power or suspectabnormal battery performance, you probably do not need to log the battery voltage in loggers otherthan the HOBO U30 Station. Always enable the logger's internal battery channel when logging with excitation power. This will helpyou determine whether and when excitation power was turned off during a deployment. <strong>HOBOware</strong> Pro Data Assistants let you create new data series by combining data recorded by thelogger with additional data. When you use a Data Assistant from the Launch Logger window, theparameter set is saved and applied to data every time you read out a logger or open the resultantdata file. The derived data is also shown when you check the latest readings in the Status window. Youcan use the following Data Assistants from the Launch window (others can only be used from the PlotSetup window): Pulse Scaling, Linear Scaling, and kWh. This feature is available for the HOBO U30, theHOBO H21 (Weather Station and Micro Station) and the HOBO H22 (Energy Logger) loggers. Click thekWh or Scaling button to access the Data Assistants window. Select the desired assistant and click theCreate button to run the selected assistant. After you enter values, click Save. Sensors that supportData Assistants at launch time display the Scaling and/or kWh icon next to their name. Click the Filters button to create an additional filtered series, such as average temperature per day,automatically when you read out the logger and plot the data.Deployment Logging Interval. Select how often the logger will record data. You can choose either one of thepreset logging intervals or specify a custom logging interval. The minimum logging interval is onesecond and the maximum for most loggers is 18 hours, 12 minutes, and 15 seconds. The shorter thelogging interval, the more quickly memory fills and battery power is consumed. Some sensors(specifically, the FlexSmart TRMS modules) require a logging interval of two seconds or greater. If youchoose a faster logging interval, erroneous data will be logged on these channels. Sampling Interval. The sampling interval allows you to take multiple measurements within thelogging interval, then average them together to create a single logged measurement. The samplinginterval is optional and is valid only for sensors that support measurement averaging. Refer to thesensor's user manual to determine whether measurement averaging is available on the sensor. If youhave at least one sensor that supports measurement averaging, click the Enable button, then set thesampling interval at less than or equal to the logging interval (up to four minutes). Rapid sampling(faster than one minute) will reduce the logger's battery life. If you do not have any sensors withmeasurement averaging or wish to turn off the sampling interval, click the Disable button. Logging Duration. This lists the approximate time it will take to fill the logger memory based on thelogging interval and sensors currently selected. This is a theoretical estimate only; battery life andfrequent state and event logging will affect your deployment. If you are logging only state changesand events, no estimation is possible. If you add or remove sensors while viewing the Launch window,click the Refresh button to get an updated Logging Duration. Start Logging. Select when to launch the logger. This defaults to the setting for the logger's previouslaunch. See Launch Time‐Saving Options (<strong>HOBOware</strong> Pro). You can choose to launch the logger:<strong>HOBOware</strong> User’s <strong>Guide</strong> 38
• Now. Logging begins as soon as you click the Start button. If you do not have at least one sensorattached, the logger will not launch.• At Interval. Logging will begin at an exact interval (for example 9:00:00 rather than 8:47:00 whenyou choose a one‐hour logging interval). The exact start time depends on the logging interval youchoose.• Push Button. Logging will not start until you press the button on the logger and hold it down for atleast three seconds. If the logger has a light, it will flash quickly when logging begins. This is notavailable for the U30 Station.• On Date/Time. Logging will begin at a date and time you specify, up to approximately six monthsfrom the present.• Save Settings in Logger. Logging will not start, but the launch settings will be saved so that you donot have to re‐enter them when you are ready to launch at a later time. The next time you viewthe Launch window for this logger, the settings you entered will still be in place. Stop Logging. There are two options for stopping the logger: either "when memory fills" or "never(wrapping)." If you select "when memory fills," then the logger will stop recording data once thememory is full. If you select "never (wrapping)," the logger will record data continuously until eitherthe logger battery runs out or you stop it. Once the logger is full, the newest data will overwrite theoldest data.Skip launch window next time (<strong>HOBOware</strong> Pro)Check this box if you would like to bypass the Launch Window the next time you choose Launch from the Devicemenu or click the Launch icon. This will cause the next logger to be launched with either the previous launchsettings or the current logger settings as set in Launch Time‐Saving Options preferences.Note: For additional details on launching the HOBO U30 Station, see Working with the HOBO U30 Station.Multiple Logging IntervalsOverviewSome loggers can be configured with multiple logging intervals, which allow you to define separate intervals fordifferent phases of the deployment.If multiple logging intervals are available for your logger, you will see an Add New Interval button on the Launchwindow for your logger.Because internal logger events, such as coupler events, do take up some of the logger's memory, the number ofsamples and end times are only estimates. Frequent events will cause the logger to fill up sooner.StepsTo configure multiple logging intervals:1. Click the Add New Interval button until you have as many intervals as you want (up to the numberof intervals available for the logger).2. Set the hours, minutes, and seconds for each interval, and the number of samples you want the loggerto record at each interval.3. Use the Start and End times in the Duration column to help you decide how many samples to recordat each interval.To delete an interval, click the Remove button next to the interval.<strong>HOBOware</strong> User’s <strong>Guide</strong> 39
Fast Logging IntervalsSome loggers can be configured with fast logging intervals, which allow you to log more than once per second, upto 100 measurements per second (hertz). If fast logging intervals are available for your logger, the Launch windowfor your logger will offer Logging Interval choices of Normal and Fast.To use fast logging intervals, click the Fast button. Then choose a logging frequency from the Hertz drop‐down list,or enter the logging interval in decimal form in the Sec field.NOTES A logger cannot communicate with a computer or shuttle while it is logging at a fast interval. Once ithas started logging, if you connect it to a computer, base station, or shuttle to check status or read itout, the logger will stop. Be aware that a fast logging interval typically means a very short Logging Duration. Make sure thelogger will run long enough to collect the data you need. Disabling unnecessary channels will give youmore time. Because fast logging deployments are so brief, the logger must be launched with a trigger start. Followthe instructions that came with your logger for a trigger (coupler or button) start. If the logger has alight, the light will flash quickly when logging begins.Repeating an Action on Multiple U‐Series DevicesNOTE: This feature is only available with <strong>HOBOware</strong> Pro.If you have many U‐Series devices, the Default Action option on the Device menu may help you work moreefficiently. The Default Action function can save you the most time when you are launching many loggers,especially if the loggers are the same model and will have similar launch settings.NOTE: This feature is available only for U‐Series devices.DescriptionBy default, <strong>HOBOware</strong> does not take any action when you connect a device. You can change the Default Action toLaunch, Readout, or Get Status and <strong>HOBOware</strong> Pro will perform that action each time you connect a device.For example, if you choose Readout and then you connect a logger, <strong>HOBOware</strong> Pro will read out that loggerimmediately. You can then disconnect that logger, connect another logger, and that logger will be read outautomatically. If you connect a shuttle, the shuttle's new files will be offloaded automatically.The Default Action only works when a single device is plugged in.Steps1. Set the Default Action to Launch.2. Go to Preferences > General > Launch Time‐Saving Options3. Select the Fill launch window with contents of option.Each time you connect a logger, the Launch window will open. If the logger is the same model as the last loggerlaunched, the Launch window will be populated with the settings from the previous launch, and an indicator onthe upper‐right corner of the Launch window will remind you that the Previous launch preference is in use.Important Note for Windows: The first time you connect a device the Default Action may not be triggered. Afterthe device has been connected to the computer and disconnected at least once, the Default Action should betriggered.<strong>HOBOware</strong> User’s <strong>Guide</strong> 40
"Read Header Failed" ErrorOccasionally, when trying to launch, check status, or read out a U‐Series logger (other than a HOBO U30 Station),HOBO Waterproof Shuttle, or HOBO U Shuttle, you may receive the following error: "Read Header Failed."These messages occur when a device's header cannot be read, usually because of a communication error orcorrupted header. Disconnect the device from the computer, then reconnect it and try to launch, check status, orread out again.If you receive the message again, the header has probably become corrupted. The most common cause of headercorruption is a communication problem during launch, such as the USB cable coming loose or an optical loggerslipping out of its base station/coupler while the Launching Logger progress bar is displayed. In that case, there is apossibility that valid data has been logged, but cannot be read out.You can restore the header by launching the logger or shuttle. This will reset the device's launch options to factorydefaults. However, it will also cause any logged data or offloaded data from a shuttle to be lost. If you receive a"Read Header Failed" message and are unable to read out the logger or offload a shuttle, please contact thevendor that sold you the device. It may be possible to retrieve the logged data.Launch UtilitiesThere are several utilities available from the Launch Logger window for setting up customized data series,configuring alarms, and setting advanced logger options. These utilities vary depending on the type of logger youare using. They include: Scaling Filters Alarms Advanced Sensor Properties: Pulse Frequency and Lockout Time Advanced Sensor Properties: Calibration Advanced Sensor Properties: Occupancy Statistics: Maximum, Minimum, Average, and Standard Deviation Filtered Series vs. Statistics Logging Burst LoggingFilter Series at LaunchAs part of the launch setup, you can create a filtered series that automatically calculates additional values, such asmaximum, minimum, average, or total, for a set interval upon readout of the logger. The filtered series is saved asan additional series in the datafile so it is always available when plotting your data. This saves you the time ofmanually filtering data for each series after readout using the regular <strong>HOBOware</strong> filter tool, although this tool isstill available should you need to further filter data later.<strong>HOBOware</strong> User’s <strong>Guide</strong> 41
To set up a filtered series at launch:1. Select the channel, or sensor type, you wish to filter.2. Select the type of filter and the interval you wish to use. In this example, the type of filter is "AverageTemperature" in every hour. Filters vary depending on the channel's measurement type.3. Edit the Resultant Series Name as desired and click Create New Series. In this example, theResultant Series Name is edited to be "Avg Hourly Temperature."4. The newly created series is added to the Filtered Series list as shown below.To make a change to a filtered series, either double‐click the series name or select the series name andclick Edit.<strong>HOBOware</strong> User’s <strong>Guide</strong> 42
To delete a filtered series, select the series name and click Delete.5. Repeat steps 1 through 4 to create additional filtered series. Not only can you create filtered series forall channels, but you can also create multiple filtered series on a single channel (for example, you canshow the maximum, minimum, and average temperature for a single temperature channel).6. Click Done when finished. The number of filtered series that you created is displayed on the Filterbutton in the Logger Launch window.7. After you launch the logger and read it out, the filtered series will automatically be listed in the PlotSetup dialog, from which you can select the series you wish to plot. Note: If you change theGMT offset for the filtered series, the data points will not reflect that change. They will continue to befiltered based on times within the original GMT offset at launch.Notes: Loggers launched in <strong>HOBOware</strong> 3.2 with series created by the Pulse Scaling, Linear Scaling, and kWhData Assistants or with filtered series cannot be read out in earlier versions of <strong>HOBOware</strong>. Filtered series created at launch time are not available for use with the Barometric Compensation,Grains Per Pound, and Conductivity Data Assistants.Data Assistants Window (Scaling)When you run a Data Assistant from the Launch Logger window, you can create a derived series, which is anadditional data series automatically calculated each time you read out the logger. The Data Assistants window listsonly those assistants available for the currently selected sensor and logger at launch time. There may be otherData Assistants available for use after reading out the logger.To set up a derived series with a Data Assistant:1. Select the Data Assistant you wish to use and click Create.2. Select the information, or parameters, you want the series to contain and click Save.3. The new series appears in the My Derived Series list. Create additional series as desired.To make a change to a derived series, either double‐click the derived series name or select it and thenclick Edit.<strong>HOBOware</strong> User’s <strong>Guide</strong> 43
To delete a derived series, select the series and then click Delete.4. After you have finished creating or editing the derived series, click Done. Depending on the type oflogger you are using, the total number of derived series created appears on the kWh and/or Scalingbuttons in the Launch Logger window. Derived series are also listed in the Status window.Notes:After you launch the logger and read it out, the derived series will automatically be listed in the Plot Setupdialog, from which you can select the series you wish to plot.Loggers launched in <strong>HOBOware</strong> 3.2 with series created by the Pulse Scaling, Linear Scaling, and kWh DataAssistants or with filtered series cannot be read out in earlier versions of <strong>HOBOware</strong>.When setting up kWh or scaling for UX90 series loggers, the scaled series information will appear on theLCD screen on the logger. In addition, only the Energy series appears on the LCD screen when configuringkWh. Average power and cost series will not display on the screen; they are available in <strong>HOBOware</strong> only.Configure AlarmsYou can set an alarm to trip when a sensor reading rises above or falls below a specified value on certain loggermodels, including the UA‐001, U14‐00x, and, and UX100 series. Note: The U30 Station also has alarms capability;see the Alarms Window for the U30/NRC for more details.To set an alarm:1. If the Alarms window is not already open, click the Alarms button from the Launch Logger window. Ifthere is no Alarms button, then the logger does not have alarm capability. If the Alarms button isdisabled, be sure you have enabled logging on a sensor that supports alarms. If the Alarms button isdisabled for a UX100 series logger, make sure the Logging Mode is not set to Burst. Alarms are notavailable for UX100 series loggers when the Logging Mode is set to Burst.2. In the Alarms window, select the sensor that you want to have an alarm. Note: The example below isfor a UX100 series logger. Any differences for other logger models are noted in these steps.<strong>HOBOware</strong> User’s <strong>Guide</strong> 44
3. Select the High Alarm checkbox if you want an alarm to trip when the sensor reading rises above thehigh alarm value. Type the reading next to the High Alarm checkbox or drag the red upper slider. Inthis example, we've set an alarm to trip when the temperature rises above 85°F.4. Select the Low Alarm checkbox if you want an alarm to trip when the sensor reading falls below thelow alarm value. Type in the reading next to the Low Alarm checkbox or drag the blue lower slider. Inthis example, we've set an alarm to trip when the temperature falls below 32°F.Note: The actual values for the high and low alarm limits are set to the closest value supported by thelogger. For example, the closest value to 85°F that the UX100 series logger can record is 84.990°F andthe closest value to 32°F is 32.043°F. In addition, alarms can trip or clear when the sensor reading iswithin the logger specifications of 0.02°C resolution. This means the value that triggers the alarm maydiffer slightly than the value entered. For example, if the High Alarm is set to 75.999°F, the alarm cantrip when the sensor reading is 75.994°F (which is within the 0.02°C resolution).5. Set the "Number of out‐of‐range samples (UX100 series and U14‐00x) (UA‐001)before alarm is raised," which is the number of samples that are needed to trigger each alarm. Forexample, we’ve set this number to 5. This means there will need to be 5 sensor readings above 85°F orbelow 32°F before the alarm will trip. The time indicates how long it would take for the alarm to tripbased on the number of samples you entered and the logging interval (UA‐001 loggers) or theLCD refresh rate (UX100 series and U14‐00x). In the example above, it would take 1 minute for thealarm to trip (only if Consecutive is selected as described in the next step). Note: The UA‐001 andU14‐00x loggers have two "Number of out‐of‐range samples...." fields: one for the high alarm and aseparate one for the low alarm.6. UX100 series and UA‐001 loggers only: Select either Cumulative or Consecutive for the Sensor AlarmMode. If you select cumulative, then the alarm will trip after a specific number of samples (as set inthe previous step) are outside the limits (the high or low samples do not need to be consecutive). Ifyou select Consecutive, then the alarm will trip after a specific number of samples (as set in theprevious step) outside the limits are logged in a row. In the example above, if there are 5 readings in arow above 85°F, then an alarm will trip. If we had chosen Cumulative, the 5 readings could have takenplace at any time during the deployment for the alarm to trip.7. UX100 series and U14‐00x loggers only: Choose how long the logger should maintain the sensor alarmonce it has tripped. Select “Host has relaunched logger” if you want the alarm to remain visible on theLCD until the next time you relaunch the logger. Select “Sensor reading within limits” if you want thealarm to clear once the sensor reading returns to the normal range between the high and low alarmlimits. UX100 series loggers have an additional option; select “Cleared with button press” if you wantthe alarm to remain on and visible on the LCD until you press the Alarm button on the logger.8. U14‐00x loggers only: You can set the Relay Contacts to Normally Open or Normally Closed asdescribed in the logger manual. Click the Test Set Alarm button to test the relay switches. Deselect the“Set Alarm on Low Battery” checkbox if you do not want an alarm to trip when the logger’s battery isrunning low.9. Click OK to save the alarm settings and return to the Launch Logger window.Once the logger is launched, alarms will trip as determined by these settings. Logger alarms will display on the LCDscreen for UX100 series and U14‐00x loggers. For UA‐001 loggers, a "high" or "low" LED will blink when an alarm istripped. Note for UX100 series and U14‐00x loggers: The alarm limits are only checked when the logger'sLCD screen refreshes. This is every 15 seconds for UX100 series loggers and every 30 seconds for U14‐00x loggers.Therefore, if you set the logging interval to less than 15 seconds on a UX100 series logger or less than 30 secondson a U14‐00x logger and the sensor reading falls outside the alarms limits, the alarm will not trip until the nextrefresh cycle. (UA‐001 loggers check the alarm alarms at every logging interval.)When you read out the logger, high and low alarm levels will be displayed on the plot. In the example below, thetemperature rose above 85°F so those readings are in the red, or high alarm, portion of the plot. The temperaturenever fell below the low alarm limit, which is the blue portion at the bottom of the plot. UX100 series loggers alsodisplay alarm events showing when the alarm tripped (and cleared if applicable). In this example, there are "Chan 1<strong>HOBOware</strong> User’s <strong>Guide</strong> 45
Alarm Tripped" and "Chan 1 Alarm Cleared" events showing when the temperature alarm tripped and cleared. The"Chan 1 Alarm Cleared Event" contains the value that was furthest out of range for the sensor before the alarmcleared (see the Points table for the actual value).Advanced Sensor Properties: Pulse Frequency and Lockout TimeUse the Advanced Sensor Properties window to set the maximum pulse frequency for raw pulse channels and tospecify a lockout time for raw pulse and event channels, which prevents false readings from mechanical sensors astheir relay state changes.Setting maximum pulse frequency is not required, but it can help optimize logging duration. The maximum pulsefrequency, multiplied by the logging interval, determines the maximum count of pulses possible within eachinterval. The logger then can use this value to adjust the amount of memory (bits) used to log each data point. Thismeans the logger uses memory as efficiently as possible, which in turn maximizes logging duration.To configure maximum pulse frequency and lockout time:1. Select the sensor that corresponds with the pulse channel you wish to configure.2. Set the maximum pulse frequency, which controls how many pulses per second can be processed bythe logger on a single pulse channel. The option to set the maximum pulse frequency is only availablefor raw pulse channels (sensors for which you have selected Raw Pulse as the sensor type in theLaunch Logger window). Refer to the specifications in your sensor or device documentation forrecommended maximum pulse frequency values. In general, the larger the maximum pulse frequency,the shorter the logging duration will be for the deployment. Note that the pulse frequency ranges inthis window vary depending on the logger model.3. Click the "Apply lockout time" checkbox if you wish to specify a time period when pulses will beignored. Select the lockout time value from 1 to 10. On sensors with both pulse frequency and lockout<strong>HOBOware</strong> User’s <strong>Guide</strong> 46
Notes:time settings, lockout time will affect the maximum pulse frequency: the higher the lockout time, thelower the maximum pulse frequency will be. If the logger has multiple sensors, then all sensors will have the same lockout time. This meansif you are using multiple sensors with different lockout time requirements, this may result inlost pulses or false pulses. Lockout time is only available for raw pulse channels and event channels. When lockout time is enabled, you can specify a value from 1 to 10 (with a default of 5), whichis then multiplied by 100 milliseconds for a range of 0.1 to 1 second. The available range forthe maximum pulse frequency is automatically recalculated based on the lockout time. Forexample, if the lockout time is set to 2, the maximum pulse frequency range changes to 0.01 to5 Hz. The maximum pulse frequency also varies depending on the logger model. Refer to thespecifications in the logger documentation for maximum pulse frequency (documentation isalso available at http://www.onsetcomp.com/support/manuals).4. Click Save. Note that the selections will not take effect in the logger until you launch it.Advanced Sensor Properties: CalibrationUse the Advanced Sensor Properties window to set the calibration method used for internal light or motor sensorsin UX90 series data loggers. The default calibration method is to "calibrate from logger," which is an autocalibrationprocedure using the Calibrate button on the logger. Alternatively, you can set the calibration method toa maximum or minimum sensitivity level as defined by <strong>HOBOware</strong>. To change the calibration method:1. Select the sensor that corresponds with the internal light/motor channel you wish to configure.2. Select "Calibrate from logger" to use auto‐calibration or select "Set to maximum or minimum sensitivity"to use <strong>HOBOware</strong> for calibration. See below for more details on both procedures.3. Click Save. Note that the selections will not take effect in the logger until you launch it.Calibrate from LoggerCalibrating from the logger with the calibration button, also called auto‐calibration, is used to calibrate the ON andOFF threshold of the logger to achieve reliable readings in an environment where motor or light levels areunknown prior to deployment or where logger light levels are variable. In the auto‐calibration process, the lightlevel or the AC magnetic field for a motor sensor is measured via a built‐in analog‐to‐digital converter and theresulting value is used to generate a calibration threshold.The logger has a built‐in hysteresis level of approximately 12.5% for the light sensor and 6.25% for the motorsensor to prevent the sensor from toggling between ON and OFF when the signal level is near the calibrationthreshold. This plot shows how the logger handles hysteresis. The logger interprets the signal as ON until it drops<strong>HOBOware</strong> User’s <strong>Guide</strong> 47
elow the lower level of the calibration threshold. Once it switches to off, the signal will not switch back to ONuntil it bypasses the upper limit of the calibration level.When auto‐calibrating from the logger (button calibrating):1. Deploy the logger near the light/motor to be monitored. Turn the light source or motor on.2. Press the Calibrate button for 1 second. The LCD screen will display the signal strength of the light ormotor. The signal strength should ideally be at least 3 bars. Orient the logger as necessary to increase thesignal strength. The signal strength indicator will remain on the display for ten minutes or until calibrationis complete.3. Press the Calibrate button for 3 seconds while “HOLD” appears on the LCD screen. For the light sensor,move your hand away from the logger to prevent shadowing. The LCD screen will display the signalstrength of the light/motor. The logger will count down to the auto‐calibration and then display either“PASS” or “FAIL” after calibration is complete.4. If the auto‐calibration fails, point the sensor directly at the light or position it closer to the motor sourceand then repeat these steps.Set to Maximum/Minimum SensitivityIf you cannot manipulate the light source or access the motor, you can set the calibration level in this window. Thelower the light/magnetic field level, the higher the sensitivity needs to be to record changes between ON and OFFconditions. For light sensors, the maximum sensitivity is approximately 100 lux (for rooms with low light levels,such as residential environments) and the minimum sensitivity is approximately 500 lux (for rooms with high lightlevels, such as retail environments). For motor sensors, the maximum sensitivity is approximately 40 mG (for aweak magnetic field) and the minimum sensitivity is set to approximately 100 mG (for a strong magnetic field).Advanced Sensor Properties: OccupancyUse the Advanced Sensor Properties window to set the timeout value for an occupancy sensor (UX90‐005x/006xmodels). The timeout value is the period of inactivity required for the sensor to consider the area unoccupied. Thetimeout value is set to 1 minute by default. You can change this to one of the preset values or enter a customvalue.To change the timeout value for an occupancy sensor:<strong>HOBOware</strong> User’s <strong>Guide</strong> 48
1. Select the sensor that corresponds with the occupancy channel you wish to configure.2. Select a preset timeout value as shown in the example below or select Custom and enter your own valuein minutes and seconds.3. Click Save. Note that the selections will not take effect in the logger until you launch it.Statistics: Maximum, Minimum, Average, and Standard DeviationYou can configure UX100 series loggers to calculate maximum, minimum, average, and standard deviationstatistics for all enabled sensors during logging at a sampling interval you specify. This will result in up to fouradditional series per sensor that record the following information at each logging interval: The maximum, or highest, sampled value, The minimum, or lowest, sampled value, An average of all sampled values, and The standard deviation from the average for all sampled values.For example, let’s say both the temperature and RH sensors have been enabled, the logging interval is set to 5minutes and the sampling interval is set to 30 seconds (with maximum, minimum, average, and standard deviationall enabled). Once logging begins, the logger will measure and record the actual temperature and RH sensor valuesevery 5 minutes. In addition, the logger will take a temperature and RH sample every 30 seconds and temporarilystore them in memory. The logger will then calculate the maximum, minimum, average, and standard deviationusing the samples gathered over the previous 5‐minute period and log the resulting value(s). When reading out thelogger, this would result in 10 data series (not including any derived series, such as dew point): two sensor series(with temperature and RH data logged every 5 minutes) plus eight maximum, minimum, average, and standarddeviation series (four for temperature and four for RH with values calculated and logged every 5 minutes based onthe 30‐second sampling).Note: Statistics are not available for logging if Normal or Burst has been chosen as the Logging Mode in the LaunchLogger window.To configure statistics:1. If the Statistics window is not already open, select Statistics from the Logging Mode drop‐down menuin the Launch Logger window. Or, if Statistics has already been configured, click the Edit button.2. Click the Maximum, Minimum, Average, and Standard Deviation checkboxes for each of the statisticsyou want to calculate during logging. Note that Average is automatically selected when selectingStandard Deviation. Important: Statistics apply to all enabled sensors; every selected statistic will becalculated for all sensors (except battery voltage). For example, if both the temperature and RHsensors have been selected in the Launch Logger window and you select Average, then the averagewill be calculated for both temperature and RH. In addition, the more statistics you record, the shorterthe logger duration and the more memory is required.<strong>HOBOware</strong> User’s <strong>Guide</strong> 49
3. Set the sampling interval, which must be less than and a factor of the logging interval. Choose either apreset sampling interval or select Custom and enter your own sampling interval. Keep in mind that themore frequent the sampling rate, the greater the impact on battery life.4. Click OK when done. This will return you to the Launch Logger window. Click the Edit button next toLogging Mode in the Launch Logger window to make additional changes.Once logging begins, press the Alarm button on the logger for 1 second to cycle through the current maximum,minimum, average, and standard deviation data (as applicable) on the LCD screen (it is not available in the<strong>HOBOware</strong> Status window). You can plot the statistics series once you read out the logger.Filtered Series vs. Statistics LoggingUX100 series loggers support filtered series and statistics logging, both of which involve calculating maximum,minimum, and average values that you can plot after the logger is read out. Both are accessed from the LaunchLogger window; for filtered series, click the Filters button and for statistics logging, select Statistics as the LoggingMode. However, there are some key differences between the two features. The following table compares filteredseries to statistics logging so that you can choose the best solution for your deployment. Note: There isalso another filtering option available after you read out the logger, which is available from the Filter button on thetoolbar. This allows you to create filtered series based on the data in the plotted datafile. For more information onfiltering after reading out a logger, see Filtering a Series.What logger models workwith this feature?Which sensors does thisapply to?Which measurement typesare compatible?Can I view the data on thelogger's LCD screen (ifavailable)?What kind of data can becalculated with this feature?How often can data becalculated?Filtered SeriesAll logger models.Only those that you select; you must set upindividual filters for each sensor.All measurement types, including state,event, pulse, and runtime.No, filtered series are only available afterthe logger is read out.Maximum, minimum, and average;standard deviation is not available.By day, hour, minute, or second usingsamples taken at the logging interval. Thefilter interval should be greater than theStatistics LoggingOnly UX100 series loggers.Automatically calculated for allenabled sensors (each sensorselected in the Launch Loggerwindow except for Battery).Only those supported by the UX100series (temperature and RH).Yes, you can press the Alarm/Statsbutton on the logger to cyclethrough each of the enabledstatistics.Maximum, minimum, average, andstandard deviation.Data is calculated at each logginginterval using samples taken at thesampling interval. The sampling<strong>HOBOware</strong> User’s <strong>Guide</strong> 50
Can I select differentintervals for each calculatedseries?How is the data recorded?Filtered Serieslogging interval. It is also recommendedthat it is a multiple of the logging intervalso that every filter interval has an equalnumber of samples.Yes, you can select a different interval foreach filter you set up.Sensor data is recorded at every logginginterval and filtered data points arecalculated at the rate you specified (forexample, the average temperature iscalculated every hour). This requires morememory as every sample is recorded.Statistics Logginginterval must be less than and afactor of the logging interval (i.e., ifthe logging interval is set to 10minutes, statistics cannot becalculated every hour; the samplinginterval would have to be less thanand a factor of 10 minutes).No, the logging and samplingintervals apply to all selectedstatistics.The logger takes a sample at everysampling interval, but only recordsstatistics data at the logginginterval. This requires less memoryas every sample is not recorded.Burst LoggingBurst logging is a logging mode available for UX100 series loggers that allows you to set up more frequent loggingwhen a specified condition is met. For example, let's say the logger is recording data at a 5‐minute logging intervaland burst logging is configured to log every 10 seconds when the temperature goes above 85°F (the high level) orfalls below 32°F (the low level). This means the logger will record data every 5 minutes as long as the temperatureremains between 85°F and 32°F. Once the temperature reaches 90°F, for example, the logger will switch to thefaster logging rate and record data every 10 seconds until the temperature falls back below the high level (or 85°Fin this case). At that time, logging then resumes every 5 minutes at the normal logging interval. Similarly, if thetemperature falls to 30°F, for example, then the logger would switch to burst logging mode again and record dataevery 10 seconds. Once the temperature rises back to 32°F, the logger will then return to normal mode, loggingevery 5 minutes.Notes: Burst logging is not available if alarms have been enabled for the logger. The Stop Logging option "Never (wrapping)" is not available when burst logging is configured. The actual values for the burst logging levels are set to the closest value supported by the logger. Forexample, the closest value to 85°F that the logger can record is 84.990°F and the closest value to 32°Fis 32.043°F. Burst logging mode can begin or end when the sensor reading is within the logger specifications of0.02°C resolution. This means the value that triggers burst logging may differ slightly than the valueentered. For example, if the High Level for a temperature alarm is set to 75.999°F, burst logging canstart when the sensor reading is 75.994°F (which is within the 0.02°C resolution). Once the high or low condition clears, the logging interval time will be calculated using the lastrecorded data point in burst logging mode, not the last data point recorded in "normal mode." Forexample, assume the logger has a 10‐minute logging interval and logged a data point at 9:05. Then,the high level was surpassed and burst logging began at 9:06. Burst logging then continued until 9:12,when the sensor reading fell back below the high level. Now back in normal mode, the next logginginterval will be 10 minutes from the last burst logging point, or 9:22 in this case. If burst logging hadnot occurred, the next data point would have been at 9:15. A New Interval event will appear on the plot (if you select events for plotting in the Plot Setupwindow) each time the logger enters or exits burst logging mode.To set up burst logging:<strong>HOBOware</strong> User’s <strong>Guide</strong> 51
1. If the Burst Logging window is not already open, select "Burst logging" from the Logging Mode dropdownmenu in the Launch Logger window. Or, if Burst logging has already been configured, click theEdit button.2. Select the sensor you want to configure for burst logging.3. Select the High Level checkbox if you want to set up a condition in which burst logging will occur whenthe sensor reading rises above the high level value. Type in the value or drag the red upper slider.4. Select the Low Level checkbox if you want to set up a condition in which burst logging will occur whenthe sensor reading falls below the low level value. Type in the value or drag the blue lower slider.In this example, both the high and low levels were selected. You may choose only one if you wish.5. Set the burst logging interval, which must be less than the logging interval. Select either a preset burstlogging interval or select Custom and enter your own interval. Keep in mind that the more frequentthe burst logging rate, the greater the impact on battery life and the shorter the logging duration.6. Click OK when done. This will return you to the Launch Logger window. Click the Edit button next toLogging Mode in the Launch Logger window to make additional changes.Once the logger is launched, the high and low burst logging levels are only checked when the logger's LCD screenrefreshes once every 15 seconds. Therefore, if you set the logging interval to less than 15 seconds and the sensorreading falls outside the levels, the burst logging will not log until the next 15‐second refresh cycle.Checking Device StatusThe Status window displays real‐time information about the attached logger, including: state of the logger time logging will begin current readings<strong>HOBOware</strong> User’s <strong>Guide</strong> 52
logger memory usedYou can check the status for a logger whether it is waiting for logging to begin, actively logging (unless it is loggingat a fast logging interval), or stopped.NOTE (<strong>HOBOware</strong> Pro): When a Station logger is logging, <strong>HOBOware</strong> can only display the last sample taken by thelogger, at the last interval.Important: Battery power is drained more rapidly while checking status. Keep this in mind when frequentlychecking status during a deployment. You can significantly reduce the demand on the battery by adjusting theScreen Refresh Interval to five seconds or higher (not available on all loggers).StepsTo check the status of a logger:1. Connect the logger to the computer.2. Click the Status icon on the toolbar, or choose Status from the Device menu.You can also access the Status window by clicking the Status button on the Launch window.The Status WindowThe Status window displays the current status of the logger. If you clicked Status from the Launch Logger window,then details from the previous launch is displayed.The Status window is divided into the following panes: Device Identification, which lists the device name and model number, description entered when thelogger was last launched (which is also used as the default file name and title in the plot), serialnumber, and firmware number. Device Details, which includes the battery level, how much memory has been used, the date and timethe device was last launched, the deployment number, current status, and current state (ifapplicable). Current Readings, which lists the latest readings for attached sensors, and where you can set therefresh rate.A Contact HOBOlink button also appears at the bottom of the Status window for the HOBO U30 Station only. Clickthis button when you want the HOBO U30 Station to connect to HOBOlink. When you click Contact HOBOlink, aconfirmation message is displayed. Once you click Yes, the Status screen will close and then the HOBO U30 Stationwill attempt to connect to HOBOlink within 30 seconds. A warning may appear in the event that a live connectionwith HOBOlink is already underway.To change the order of series displayed in the Status window, go to the Preferences and select Display and thenSeries.Device DetailsThis topic describes the elements of the Device Details section of the Status window.Battery Level/Battery StateCondition of the battery. Consult the logger documentation for specifics on battery capacity.Memory UsedPercentage of the logger's memory that is full.<strong>HOBOware</strong> User’s <strong>Guide</strong> 53
Note: If the battery died while the logger was logging, this will be 100% even if only a small amount of the memorywas used.Stops LoggingFor some loggers, displays when the logger will stop logging.Last LaunchedDate, time, and offset to Greenwich Mean Time (GMT), also known as Coordinated Universal Time (UTC), when thelogger was last launched. This is not necessarily the time when the first sample was recorded; it is the time all ofthe launch parameters were loaded in the logger.Delayed Start (if applicable)If the logger has been launched, but is waiting for a delayed or interval start, the scheduled start time is shownhere in local time.Deployment NumberNumber of times the logger has been launched. The number listed includes the most recent launch.Logging IntervalRate at which the logger was set up to record data the last time the logger was launched, if applicable. If multiplelogging intervals are available for your logger, the interval currently in use (if the logger is logging) will be shown inbold.Sampling Interval (<strong>HOBOware</strong> Pro only)For station loggers only, this is the sampling interval that was entered the last time the logger was launched, ifapplicable.DO Sensor Cap Information (HOBO U26 Dissolved Oxygen logger only)For HOBO U26 Dissolved Oxygen loggers, the DO sensor cap expiration date, initialization date, and manufactureddate is shown. For more details about the DO sensor cap, see Working with the HOBO U26 Dissolved OxygenLogger.Current StatusMessages that describe the state of the logger.For the HOBO U30 Station (<strong>HOBOware</strong> Pro only) the current state of the relay is also noted. After the state of thelogger, the message “Relay is open” or “Relay is closed” will display. Awaiting Button/Coupler StartThe logger has been launched with a trigger start (if available). Press and hold down the button on thelogger for three seconds to begin logging, or follow the instructions that came with your logger if itoffers a triggered start but does not have a button. If the logger has a light, the light will flash quicklywhen logging begins. Awaiting Delayed StartThe logger will begin recording data at a specific time because either Delayed Start or Start atInterval was chosen at launch. Launched, LoggingThe logger has been launched and is actively recording data. Logger Is FullThe logger has reached its memory capacity and is no longer recording data.<strong>HOBOware</strong> User’s <strong>Guide</strong> 54
Logger is stoppedThe logger is not logging, is not full, and is not awaiting a delayed or trigger start. On Hold for Later Launch (<strong>HOBOware</strong> Pro only)The logger has been launched with a Save Settings start (if available). Logging is not scheduled tobegin, but the launch settings have been entered and saved.Current States (U‐Series loggers except the U30)If your logger has an event button, most often the current state will be Button Up, meaning the button is not beingpressed.Current ReadingsThis topic describes the elements of the Current Readings section of the Status window.Screen Refresh IntervalFrequency with which the Current Readings are updated, up to 3600 seconds (one hour). A higher number meansless stress on the logger's battery. The Status icon blinks when the readings are updated.Tilt meters (not labeled)For acceleration loggers only, color‐coded meters display X, Y, and Z‐axis tilt (relative to vertical, assuming that theonly acceleration force on the logger is gravity) graphically.Sensor ReadingsSensor readings, updated in real time.NOTES Readings are displayed for all available sensors, even if they are not being logged. If a channel is notbeing logged, its name is dimmed in the display. If a logger has channels for external sensors, a description and reading will be given for the externalchannels even if no sensors are plugged in. If a U‐Series logger (other than a HOBO U30 Station) has channels for external sensors, a descriptionand reading will be given for the external channels even if no sensors are plugged in. For event loggers, the event count in the Current Readings box will always start at zero, even if manyevents have already been logged. (<strong>HOBOware</strong> Pro) For station loggers, the location (if defined) is displayed next to the reading. (<strong>HOBOware</strong> Pro) If a HOBO U30 Station has an Analog Sensor Port, readings for one or both channelsare displayed. (<strong>HOBOware</strong> Pro) The RSSI (Signal Level) is displayed for the HOBO U30/GSM Station. This helps youdetermine if there is enough signal strength in the current location for the HOBO U30 Station tocontact a cellular tower for connecting with HOBOlink. Signal level is measured on a scale of 0 to 10,with 0 being no signal, 1 being a weak signal, and 10 being a strong signal. The battery voltage is displayed for some loggers.Stopping a DeviceA logger automatically stops recording data when the memory is full (unless it has been configured to never stoplogging) or when the battery runs down.<strong>HOBOware</strong> User’s <strong>Guide</strong> 55
You can also stop the logger manually at any time with the stop command.To stop a logger:1. Connect the logger to the computer.2. Click the Stop icon on the toolbar, or choose Stop from the Device menu.After the logger has been stopped, the data remains in the logger until the next launch.Lab CalibrationLab calibration is available for HOBO Dissolved Oxygen (U26‐001) loggers. Use this tool when you need to calibratethe logger before deploying it or after replacing an expired sensor cap. The tool sets the gain and offset adjustmentvalues for the logger by:Restoring logger calibration values to the factory defaults,Using your own gain and offset adjustment values, orCalculating the values with a three‐step calibration procedure.In the three‐step procedure, the logger is first calibrated to 100% saturation by placing it in water‐saturated air.Then, you can calibrate the logger to 0% saturation by placing it in sodium sulfite or another 0% oxygenenvironment (recommended if the logger will be deployed in water with DO levels of 4 mg/L or less).IMPORTANT: Lab calibration only affects future launches; any data saved in the logger will be based on theprevious calibration values.To complete these steps, you will need fresh water, the calibration boot and sponge supplied with the logger, anda source for current barometric pressure at your current location. You will also need sodium sulfite solution and a3 inch beaker if you will be calibrating to 0% saturation.The fresh water, logger, and sodium sulfite (if applicable) should be left out in the lab where the calibration isbeing done long enough so that they are at room temperature. If the logger had been deployed previously, makesure the sensor is clean and dry (see the logger manual for more details).To use the Lab Calibration tool:1. Connect a HOBO Dissolved Oxygen logger to the computer. Stop the logger if it is currently logging orawaiting a coupler or delayed start.2. From the Device menu, click Lab Calibration. Note: If the sensor cap is installed and it has not yet beeninitialized, you will be prompted to do so. Follow the instructions on the screen. The sensor cap will expirein seven months once initialized.3. The current gain and offset adjustments are displayed in the top pane of the window, along with the dateand time the last lab calibration was completed (if applicable). Completing Steps 1 through 3 in thiswindow will result in new gain and offset adjustment values based on the current logger conditions.Continue to the next section for details on how to complete these steps.If you already know what the gain and offset values should be (for example, the values from a previouscalibration that you want to use again) or want to return to the default factory values, click the “I knowmy values, skip to Finish” button. This will automatically move you to “Step 3: Finish.” Either click the“Reset to Factory Defaults” button or type in new gain adjustment and new offset adjustment values andclick the “Send Calibration to the Logger” button. Note: If you decide you do not need to change thecalibration, click Close to cancel the calibration and revert back to the last saved logger values.Step 1: 100% Saturation1. Enter the barometric pressure for your current location in one of five available units. If the barometricpressure reading has been adjusted for sea level (such as a reading taken from the National Weather<strong>HOBOware</strong> User’s <strong>Guide</strong> 56
Service weather station), select the “If using sea level barometric pressure, enter elevation” checkbox andenter your elevation in either meters or feet.2. Make sure the logger either has the protective guard or the anti‐fouling guard installed (whichever guardyou plan to use in the deployment) so that the sensor is covered.3. Wet the small sponge that shipped with the logger with fresh water. Squeeze out any excess water.4. Place the sponge in the end of the calibration boot.5. Insert the logger in the calibration boot so that there is approximately a 1 cm (0.5 inch) overlap betweenthe end of the boot and the body of the logger. This will ensure there is enough space between the end ofthe logger and the sponge (the logger should not be pressed up tightly against the sponge).6. Wait for approximately 15 minutes until the logger reaches temperature equilibrium. Important: Thelogger will “go to sleep” if there is no activity for 30 minutes. To avoid this, click the “Get DO value fromthe logger” button as described next in step 7 well before 30 minutes have passed. If the logger does goto sleep, a message will appear indicating that there was a communication failure. You may need to closeand reopen the Lab Calibration window to reactivate the logger. Follow the instructions on your screen.7. Click the “Get DO value from the logger” button to display the 100% saturation results. You can click thisbutton as often as needed. The results are updated each time you click the button. To check forequilibrium, click the “Get DO value from the logger” button several times in a row to check the current“DO Conc from logger at 100% Saturation” value. If the value remains the same or varies very little witheach button click, then temperature equilibrium has likely been reached.8. When you are satisfied with the results displaying, click the Next button to proceed to “Step 2: 0%Saturation.”Step 2: 0% Saturation (optional)If the logger will be deployed in water with DO levels greater than 4 mg/L, click the “Skip this Step” button.Otherwise, continue with the following procedure.1. Make sure the logger either has the protective guard or the anti‐fouling guard installed (whichever guardyou plan to use in the deployment) so that the sensor is covered.2. Pour the sodium sulfite into the beaker so that it is about two‐thirds full.<strong>HOBOware</strong> User’s <strong>Guide</strong> 57
3. Place the sensor end of the logger into the solution so that the entire protective cap or anti‐fouling guardand at least 2.5 cm (1 inch) of the logger body are submerged in the beaker. Allow it to rest on the bottomof the beaker.4. Wait a few minutes until the logger reaches temperature equilibrium. Important: The logger will “go tosleep” if there is no activity for 30 minutes. If this happens, you will need to close and reopen the LabCalibration window to reactivate the logger and, as a result, repeat the calibration for 100% saturation. Toavoid this, click the “Get DO value from the logger” button as described next in step 5 well before 30minutes have passed.5. Click the “Get DO value from the logger” button to display the 0% saturation results. As with the 100%calibration, you can click this button as often as needed. The results are automatically updated each timeyou click the button. If the value remains the same or varies very little with each button click, thentemperature equilibrium has likely been reached.6. When you are satisfied with the results displaying in the Step 2: 0% Saturation tab, click the Next buttonto proceed to “Step 3: Finish.”Step 3: FinishThe results from the first two steps are displayed as well as the overall calibration results and the new gain andoffset adjustment values. If you are satisfied with the results, click the “Send Calibration to Logger” button. Thelogger will then be calibrated based on the new values. Click the Back button to return to a previous step if youwish to repeat Step 1 or Step 2. These values will not take effect until the logger is launched. If you do not want tosave these values, click Close to cancel the calibration and revert back to the last saved logger values. Or, click“Reset to Factory Defaults” to return to the original values. If you performed Step 2, then remove the logger fromthe solution and thoroughly rinse it with fresh water to remove any excess sodium sulfite. See the logger manualfor additional details on cleaning the logger.<strong>HOBOware</strong> User’s <strong>Guide</strong> 58
Updating UX Series Logger FirmwareYou can update the firmware in a UX series logger as needed with <strong>HOBOware</strong>. You may see that an update isavailable when opening the Launch Logger or Status window, or Onset Technical Support will notify you when thisis necessary.To update UX series logger firmware:1. Connect a UX series logger to the computer.2. Important: Stop and read out the logger and save the file before updating the firmware.The update process will delete all existing data in the logger so be sure to stop and read out the loggerbefore continuing with the next step.3. From the Help menu, select Update Logger Firmware and then select Update UX Series LoggerFirmware. Note: This is not necessary if a message indicates that a firmware update is available afteropening the Launch Logger or Status window. Continue with the next step instead.4. If there is a newer firmware version available than the version currently installed in the logger, amessage appears indicating a firmware update is available. Click Yes to continue.If a newer firmware version is not detected, then a message appears indicating there are no updatesavailable for this logger. There may be instances where you have downloaded a firmware .hex filefrom the Onset website and need to locate this file. If so, click Yes when this message appears to findthe file. Otherwise, click No to close the message and exit the update process.5. In the Update UX Series Logger Firmware window, the suggested firmware file for use with the currentlogger is displayed. The logger model number will be listed within the file name for you to doublecheckthat it is the correct version for the logger you are updating. If the file listed is the one you wishto use, then click Continue. If it is not the correct file or you wish to locate a different file based oninstructions from Onset Technical Support, click Select Firmware and locate the appropriate file.Note: If you click Cancel, you may still be prompted for an additional firmware update in someinstances. Click Cancel again to completely exit the procedure.6. A message appears warning you not to disconnect the logger until the update process is complete.The update process should take a couple of minutes. If you have not already read out the logger andsaved the data, then click No to cancel the update and return to step 2. Otherwise, if you are ready toupdate the firmware in the logger, click Yes to continue.<strong>HOBOware</strong> User’s <strong>Guide</strong> 59
7. As the firmware update process takes place, "Boot" will display on the logger LCD screen. Do notdisconnect the logger during this process. Once the update is complete, a message will appearindicating the update was successful. Note that UX100 series loggers require an additional firmwareupdate. A message will appear automatically if a second update is necessary. Repeat steps 4–7 ifanother firmware update is available. Note: If "Boot" remains on the logger LCD screen after this iscomplete, the device may need to be reset. From the Device menu, select Utilities, and then selectReset UX Logger. If "Boot" still remains on the LCD screen, contact Onset Technical Support.8. After the firmware update process is complete, you will need to launch the logger before you can useit again. If you'd like to launch the logger immediately, click Yes. Otherwise click No to close themessage and click Launch from the Device menu to launch the logger at a later time.Note: Selecting the preference “Only show Select Device window if a device has not been selected” (availablewithin Preferences > General > Selecting Devices) can prevent auto‐update notifications. If this occurs, access thefirmware update from the Help menu as described in step 3.<strong>HOBOware</strong> User’s <strong>Guide</strong> 60
Chapter 3: Reading Out, Plotting, andAnalyzing DataAfter a logger has recorded data, you can then do the following: Read out the data from the logger Plot the data Modify the plot if desired Analyze the data Export the dataReading Out DataTo retrieve data recorded by a logger, you must read out the logger. Reading out the logger copies data from thelogger to your computer, allowing you to save the data in a datafile and view the plot. During readout, the loggercontinues to record data unless you have stopped the logger or the logger is full.You can also read out many logger types to a shuttle and then offload the datafiles from the shuttle to yourcomputer. See Offload Files from a Shuttle for more details.To read out a logger:1. Connect the logger to the computer.2. Click the Readout icon on the toolbar, or choose Readout from the Device menu. If the logger isstill logging, a message asks whether you want to stop the logger. Click either Don't Stop or Stop asdesired.3. A progress bar displays while the data is being read out. Once the readout is complete, choose alocation and/or a new filename or accept the default location and name to save the data. The defaultlocation is: C:\Documents and Settings\\My Documents\<strong>HOBOware</strong>(for Windows XP) C:\Users\\Documents\<strong>HOBOware</strong>(for Windows 7 or Windows 8) Users//Documents/<strong>HOBOware</strong>(for Macintosh OS X)Click Save. The datafile has the following extension:<strong>HOBOware</strong> Lite: Most U‐Series loggers: .hobo<strong>HOBOware</strong> Pro: Most U‐Series loggers: .hobo or .hsec Station loggers: .dtf or .dsec<strong>HOBOware</strong> User’s <strong>Guide</strong> 61
If you save the file to a different folder, that folder will be the new default save location for futurereadouts.4. After saving the data, select the data channels and/or events you wish to display in a graph and clickPlot. See the Plot Setup window for more details on the options available.Note:Once a logger is read out, the data will remain in the logger memory until the next time the logger islaunched. Logger memory is therefore never empty.You can read out the HOBO 4‐Channel Pulse Input Data Logger (UX120‐017) even if the batteries are bad.In this case, a warning appears before the readout begins indicating the battery is very low and that youmay experience communications problems. The readout is able to continue as normal despite the lowbattery because this logger can be powered by a USB cable. Once the readout is complete, be sure toreplace the batteries as suggested.You can bypass the Save window during the readout process by setting the Readout Time‐Saving Optionsin the General subcategory of Preferences.Setting up a PlotAfter you read out a logger, the Plot Setup window appears. Follow this procedure to set up a plot.Steps1. Select the series you wish to view on the plot.Click each checkbox individually to select or clear sensor measurements, states, and events, or clickthe All or None buttons to select or clear all sensor measurements, states, and events.Select the units you want to display for each series, if available.2. Select Internal Events to plot, if applicable for your logger.3. Adjust the time zone offset, if necessary.By default, data is shown in the offset used to launch the logger with <strong>HOBOware</strong> (not a shuttle). Toselect a different offset, enter the hours offset from GMT (UTC) in decimal form. You may find this<strong>HOBOware</strong> User’s <strong>Guide</strong> 62
useful if you logged in multiple time zones, or if you took the logger to a different time zone afterlaunching it.4. <strong>HOBOware</strong> Pro Only: If data assistants are available, you can use them to create additional series.Select an assistant from the list and click Process.5. When you have made your selections, click the Plot button. The plot is displayed.To change the order of series displayed in the Plot Setup window, go to the Preferences and select Display andthen Series.Note: If a pie chart icon appears in the Plot Setup window, this means the data in the file you are plotting can alsobe plotted in a pie chart. See Viewing a Pie Chart for more details.Data Types in PlotsFour kinds of data can be displayed on a plot:Sensor measurementsSensor measurements include the channels you selected to log at an interval during the launch, such astemperature, RH, or battery voltage. This type of data series consists of all the logged data points for that channel.In addition, if the logger recorded both temperature and RH, a dew point series can be plotted. Note: Data seriesfor smart sensors or FlexSmart modules are listed in order by sensor serial number, from lowest to highest.StatesStates are condition changes that can be recorded at any time during deployment, regardless of the logginginterval (if any). Only state loggers, such as the U9 and U11, can record state changes.External EventsExternal Events are momentary switch closures (e.g., from turnstiles) that are recorded by loggers with externalevent channels, such as the U11 logger.Internal logger EventsInternal Logger Events are individually logged occurrences that can be recorded at any time during deployment,regardless of the logging interval. U‐Series loggers (Other than the HOBO U30 Station) record internal loggerevents.Examples of internal logger events include: End of File: Marks the last record that was found in the logger. Bad Battery: Time the battery capacity fell to an extremely low level (if applicable). If you see a BadBattery event, replace the battery before deploying the logger again. Stopped: Time the logger was manually stopped with <strong>HOBOware</strong>. Host Connected: Time the logger was connected to the computer. Coupler Connected/Coupler Disconnected: Time the logger was connected or disconnected fromthe coupler, if the logger uses a coupler to communicate with the computer. Button Down/Button Up: For U‐Series loggers that have event buttons, each button push of atleast one second is logged as a Button Down event and a Button Up event. Interval Change: For loggers that can be configured with multiple logging intervals, an IntervalChange event marks the moment when a new logging interval began.<strong>HOBOware</strong> User’s <strong>Guide</strong> 63
On some loggers, the Started and Stopped internal events can only occur once. However, UX100 series loggers canstart and stop logging multiple times in a single deployment (as configured in the Launch Logger window). Multiplestopped and started events in a single file are not only displayed on the plot (if selected in the Plot Setup window),but the resulting gap that occurs in the data is also represented in the series. In this example, the logger wasstopped at 1:19 and then started again at 2:35; both events are on the plot. The temperature series shows a breakbetween those two times. That represents the gap between when logging was stopped and when it resumed, bothusing the button on the logger.Opening FilesThe following files can be opened by <strong>HOBOware</strong> Pro:StepsTo open a file: .hobo ‐ Including files created with Onset's GreenLine software and both Macintosh and Windows ‐compatible versions of <strong>HOBOware</strong> Lite and <strong>HOBOware</strong> Pro. .hsec ‐ Secure files (21 CFR Part 11 Conformance) for U‐Series loggers. .hproj ‐ <strong>HOBOware</strong> Project. .dtf ‐ Files with an extension of .dtf must come from a HOBO U30 Station, Weather Station, MicroStation, or Energy Logger. Other .dtf files are not compatible with <strong>HOBOware</strong> Pro. .dsec ‐ Secure Files (21 CFR Part 11 Conformance) for Station loggers. .txt/.csv ‐ .txt or .csv files, as well as most ASCII files, can be imported.From Windows Desktop or Mac FinderDouble‐click a compatible file. <strong>HOBOware</strong> automatically launches itself (if it is not open already) and opens the file.From <strong>HOBOware</strong><strong>HOBOware</strong> User’s <strong>Guide</strong> 64
Click the Open iconand click Open.on the toolbar, or choose Open Datafile from the File menu. Select a file or multiple filesIf verification fails, see Verification Failure in the Working in Secure Mode topic (page 118).Complete the Plot Setup window to select the items you wish to view in the plot. Then click the Plot button. Theplot is displayed. If you selected multiple files, you will be prompted with a Plot Setup window for each file.Tip: If you never use data assistants or change time zones, and would like to bypass the Plot Setup window everytime you open a datafile, go to Preferences > General > Open File Time‐Saving Options and select When opening adatafile: Automatically plot. This displays the plot with default Plot Setup selections.Project FilesTo open a project file, choose Open Project from the File menu. Then select a project (.hproj) file and click Open.Click the File menu and select a recently opened datafile or project file from the Recent Files list.Opening Files from Unsupported LoggersAlthough the following loggers cannot be launched or readout using <strong>HOBOware</strong>, data files from these loggers canbe opened and plotted by <strong>HOBOware</strong> Pro and <strong>HOBOware</strong> Lite. All graphing tools, filters, and Data Assistants can beused with the files and data can be exported to text and XML project files.H08 (8‐bit) H08‐001‐04 H08‐002‐04 H08‐003‐04 H08‐004‐04 H08‐006‐04 H08‐008‐04TBI/WTA TBI32‐05+37 TBI32‐20+50 WTA08‐05+37 WTA08‐39+75 WTA32‐05+37 WTA32‐39+75H08 (12‐bit) H08‐030‐08 H08‐031‐08 H08‐032‐08H20H06 H20‐001 H06‐001‐02<strong>HOBOware</strong> User’s <strong>Guide</strong> 65
H06‐002‐02 H06‐003‐02 H06‐004‐02H07 H07‐001‐02 H07‐001‐04H14 H14‐001 H14‐002H12 H12‐001 H12‐002 H12‐003<strong>HOBOware</strong> User’s <strong>Guide</strong> 66
Modifying a PlotThis topic covers the ways in which you can modify a plot using the Tool Bar and the Plot menu.1. ToolsUse the tools in the tool bar to perform a number of operations on the plot. Use the Arrow tool to point to and select items on the graph to edit their properties Use the Crosshair tool to zero in on a specific date and time in the plot and any data pointsassociated with that date and time.<strong>HOBOware</strong> User’s <strong>Guide</strong> 67
2. Actions Use the Hand tool to move different areas of the graph into view or adjust the position of oneseries so it can be viewed more easily. This is particularly useful when you are zoomed into thegraph and want to see another section of the graph without zooming out and then zoomingback in on the new location. Use the Zoom tool to focus on one area of the graph, allowing you to see more detail. Use the Subset Statistics tool to view statistics for a particular time span.Use the Actions buttons to perform a number of actions on a plot or a series.Click the Open properties icon to open the properties window for the plot element that is currentlyselected (such as gridlines, legend, axis).Use the Gridline icons to toggle all horizontal or all vertical gridlines on and off.You can also toggle gridlines on and off for each axis individually. Using the arrow tool, double‐click an axisto get the Axis Properties window. Check the Show Gridlines box to display gridlines for that axis, or clearthe Show Gridlines box to hide the gridlines.Click the Convert units icon to open the Convert Plot window, which allows you to convert some or all ofthe series on the currently focused plot to other units (for example, from degrees Fahrenheit to degreesCelsius).Click the Filter series icon to open the Filter Series window. See Filtering a Series on a page 84 forinformation.Click the Add Graph Label button to label a graph.3. Plot MenuRight‐click a series or an empty area in the plot to open a menu of options for modifying the series or plot.Available options depend on whether you click on a series or an empty area of the plot.NOTE: You can also access these options in the View and Edit menus from the main menu.To move a series to the front or back, select the series, right‐click and select either Bring Series to Front orSend Series to Back. This is helpful if one series is hidden behind another. It also changes the order of seriesin the Details pane, Points table, and the legend.NOTE: After you adjust the order of the series for optimal viewing, copy the graph as a bitmap to paste intoother programs, such as Microsoft Word or PowerPoint®.<strong>HOBOware</strong> User’s <strong>Guide</strong> 68
Setting Series and Plot PropertiesThis topic covers some of the ways you can modify a plot or a series using properties.To change properties for all plots, see Setting Properties for all Plots on page 70.1. View PropertiesDouble‐click in an empty area of the plot to open the View Properties window, where you can show orhide the legend, plot title, and borders.<strong>HOBOware</strong> User’s <strong>Guide</strong> 69
2. Title PropertiesDouble‐click the Plot Title to open the Title Properties window, where you can change the title name,location, and font.3. Legend PropertiesDouble‐click the legend to open the Legend Properties window, where you can add a label to the legend,change its position, and show or hide the border.4. Series PropertiesDouble‐click on a series to open the Series Properties window. See Setting Series Properties on page 73for more information.5. Axis PropertiesDouble‐click on one of the axis to open the Axis Properties window. See Setting Axis Properties on page72 for more information.Setting Properties for all PlotsThis topic outlines preferences that you can apply to all plots that you generate or open in <strong>HOBOware</strong>. To accessplotting preferences, from the main menu select Preferences and then click the Plotting tab.1. Show/Hide Points TableIn the Layout section of the Plotting Preferences you can control the display of the Points Table.2. Show/Hide Details Pane<strong>HOBOware</strong> User’s <strong>Guide</strong> 70
In the Layout section of the Plotting Preferences you can control the display of the Details Pane.3. Include Sensor Label in Points Table and Details PaneBy default, labels added for station‐type loggers are shown in the Points and Details panes. If you do notwant to include the label, deselect Use sensor Location in the Points Table & Details Pane section of thePlotting Preferences.4. Customize Series LinesUse the lines preferences to define the appearance of lines in the plot for a specific series type.5. Apply Min/Max to Y‐Axis BoundsUse the Value Axis Preferences to apply a minimum and maximum value for the Y‐Axis to for plots for aspecific series type.6. Enable Auto ScrollingNormally, if you are zoom in and click a point in the Points table that is outside the zoom area, the plotwill scroll so that the marked point is in view, while retaining your zoom factor. Uncheck the Whenselected value in table is out of plot range, drag series to that value box if you do not want to scroll topoints outside of the current view.7. Plot SetupThe Plot Setup section of the Plotting Preferences gives you two options when generating a plot: Automatically select all data series for plotting Automatically select internal events for plotting8. Label Time AxisBy default, the time axis is not labeled when you display a plot. If you enable this preference, the time axiswill have a default name of "Time" when you open a plot.9. Mark PointsBy default, points on a series are not marked. To have all points marked by default, go to Preferences> Plotting > Other Options and select the Mark all points when plotting data option. NOTE: Opening alarge plot with all points marked takes longer and consumes more system memory10. Include Sensor Labels in LegendIf a label has been assigned to a sensor, include it in the legend.11. Show/Hide GridlinesBy default, vertical gridlines are always shown for the time axes; horizontal gridlines are not shown. Youcan use the gridline icons and on the toolbar, or the Gridlines item on the View menu, to toggleall horizontal or all vertical gridlines on and off.You may also toggle gridlines on and off for each axis individually. Using the arrow tool, double‐click anaxis to get the Axis Properties window. Check the Show Gridlines box to display gridlines for that axis, orclear the Show Gridlines box to hide the gridlines.Go to Preferences > Plotting > Gridlines to control whether plots open with horizontal and/or verticalgridlines displayed.<strong>HOBOware</strong> User’s <strong>Guide</strong> 71
Custom Tick MarksChoose this option to specify different major and minor tick marks for the axis.4. BoundsMin: Enter the minimum value you want displayed for the axis. For the time axis, you can select a dateand time.Max: Enter the maximum value you want displayed for the axis. For the time axis, you can select a dateand time.5. Miscellaneous Show Gridlines: Toggles whether gridlines are displayed in the background. By default, gridlines areshown for the time axis only. Hide Axis: Toggles whether the axis is displayed or temporarily hidden. Axes for sensor series arevisible by default. Lock Axis Scaling and Tick Marks: Toggles whether the axis and associated tick marks remain in theoriginal position when zooming or navigating with the hand tool. Locking the axis and tick marks helpsto avoid inadvertently zooming or navigating to an area on the graph without data. Color: Changes the color of the axis. Black is the default color for the time axis. The color of the valueaxis matches the series color by default.Setting Series PropertiesA series is the group of data points for the sensor measurement, state, or event you selected to display in the plot.To change series properties, double‐click the series you wish to modify or select the series and click the Propertiesiconon the main menu.The following options are available in the Series Properties window:1. Description: Enter up to a 40‐character name for the series. The series name is displayed in thelegend. The default name for a series with sensor data is the property that was measured and the<strong>HOBOware</strong> User’s <strong>Guide</strong> 73
Adding a Graph LabelYou can add multiple labels to a graph to identify specific points or call attention to a region of the graph.1. Right‐click the graph at the desired location and choose Add Graph Label from the pop‐up menu(Alternative: Choose Add Graph Label from the Edit menu)NOTE: To change an existing label's properties, double‐click the label or select the label and click theProperties icon on the main menu.The Graph Label Properties window appears.2. Enter values in the Label Properties window as required. See Setting Label Properties for moreinformation. Label Text ‐ Enter up to a 24‐character name for the label. BehaviorAttach to Series: To attach the label to a point on a series, check this box and choose the name of theseries from the drop‐down list. (After you exit this window, you can use the hand tool to drag the labelto the correct point.)Include Data Value in Label: If the label is attached to a series, check this box to have the label show thevalue of the labeled point.Location: If the label is attached to a series, choose a compass point to describe the preferred position ofthe label relative to the labeled point.Important: The Location indicates the preferred location of the label (space permitting) with respect tothe data point it references. This is available only when the label is attached to a series. Appearance<strong>HOBOware</strong> User’s <strong>Guide</strong> 75
Draw Label Over Colored Background: Check this box if you want the label to appear in a box with acolored background.Label Color Background: If you chose to give the label a colored background, click this button to select abackground color.Label Color Text: Click this button to select a color for the label text.% Transparency: Adjust the label's transparency. Transparency refers to the ability to see the graphthrough the label. At 0%, the label is opaque, and you cannot see the graph through it. At 100%, the labelis invisible, and only the graph can be seen.Font: Select a font for the label text.Font Size: Select a font size for the label text.2. Click the Apply button to apply the new label and keep the window open so you can add more labels.3. Position LabelsUse the Hand tool to drag labels to another location if required.If the label is attached to a series, you can drag the label to attach it to any other point on the graph. (Thehand tool must be close enough to a point to attach the label.) Labels that are attached to a point willmove with that point during zooming and panning. Free‐floating labels do not move during zooming andpanning.4. When you have completed adding labels, click Done to close the window.Deleting a LabelTo delete a label from the graph, select the label you wish to remove and press the Delete key (Fn‐Delete on alaptop computer), or right‐click the label and choose Remove from the menu that appears.Zooming, Panning, and Smart Scaling PlotsYou can adjust the viewing area of the plot by zooming, panning, and smart scaling.There are two ways to zoom: either by using the zoom tool or by selecting Zoom In or Zoom Out fromthe toolbar or the View menu. Use the zoom tool to zoom anywhere on the plot that you select, clicking the rightmousebutton to zoom in or out. Use the Zoom In/Zoom Out icons to keep the plot centered as you zoom. Toconstrain the zoom to horizontal or vertical zooming, place the cursor over the axis you want to zoom and click themouse button. Hold the mouse button down to continue to zoom. Click the right‐mouse button to switch fromzooming in to zooming out, and click it again to switch back.Use the hand tool to pan the graph, which is dragging the plot viewing area along the x‐ or y‐axis. Panning isespecially helpful when you are zoomed into a detailed plot and want to focus on a different area without zoomingout. To limit dragging to horizontal or vertical panning, place the cursor over the axis you want to drag, hold downthe mouse button, and drag in the direction you want the plot to move.When you first display a graph, the numerical bounds of the axes are on tick marks. After you have panned orzoomed, this may no longer be the case. Use smart scaling to correct that. With the hand, arrow, or crosshair tool,right‐click anywhere on the graph and select SmartScale Graph. This will automatically adjust the axes to end ontick marks.Tip: You can always return to the original plot view by clicking the View at Full ScaleView menu.from the toolbar or the<strong>HOBOware</strong> User’s <strong>Guide</strong> 76
Copying a Series to another PlotTo copy a series from one plot to another:1. Open the source plot (the plot which includes the series you want to copy) and the destination plot(the plot where you want to paste the series).2. In the source plot, choose the arrow tool and select the series you want to copy.3. Copy the series:right‐click on the series and choose Copy Series from the pop‐up menuor, from the Main Menu select Edit > Copy Seriesor press Ctrl+C (Windows) or Command‐C (Mac)4. Go to the other plot and with the arrow tool, right‐click anywhere on the destination plot andchoose Paste Series from the pop‐up menuor, from the main menu select Edit > Paste Seriesor, press Ctrl+V (Windows) or Command‐V (Mac)The new series is added to the graph, the Details pane, and the Points pane.Undoing and Redoing Plot ChangesYou can undo and redo changes made to the plot display, including zooming, panning, crosshair placement, graphand axis properties modifications, and more.To undo the most recent change, click the Undo Actionmenu.icon on the toolbar or select Undo Action from the EditTo redo the most recent change that had previously been undone, click the Redo Actionselect Redo Action from the Edit menu.icon on the toolbar orWhen using the Edit menu for Undo or Redo, the most recent change is listed with the menu choice. In thefollowing example, the most recent change that can be undone is to "Click Crosshair" and the most recent changethat can be redone is to "Drag Plot."<strong>HOBOware</strong> User’s <strong>Guide</strong> 77
<strong>HOBOware</strong> keeps track of the changes that you make within each plot window and temporarily stores them as"undoable actions." To see a complete list of all the actions that can be undone or redone, click the down arrow tothe right of either icon on the toolbar.The number of undoable actions stored is set within the plot preferences. You can configure <strong>HOBOware</strong> to eitherstore a specific number of undoable actions or an unlimited number. In addition, you can enable or disable thefeature altogether. Note that storing an unlimited number of actions can impact <strong>HOBOware</strong> performance onslower computers.Saving Project FilesA project file (.hproj) is a plot that you have customized using the various features and tools of <strong>HOBOware</strong>. Whenyou open a project file, the plot appears as it did when you saved the project file, and contains all of the samedata.To save your current data with a customized view of the plot, click the Save icon on the toolbar, or chooseSave Project from the File menu. To open an existing project file, choose Open Project from the File menu.Printing Plot ElementsPrinting a GraphYou can simply print the graph, or you can set up the page and preview it before printing.To set up the paper for printing the graph:1. From the File menu, choose Page Setup.2. Change the paper type, orientation, and margins as necessary and click OK.3. To preview how the graph will look on the page: from the File menu, choose Print Preview.4. Zoom as necessary5. Click the Print icon to print directly from Print Preview. Or, click Close to exit the preview windowwithout printing.To print the graph:1. Click the Print icon on the toolbar, or choose Print from the File menu.2. Select the appropriate printer, if applicable, and click OK.Printing Points and DetailsYou can print all of the data in the Points or Details panes. From the File menu, select Print Points (available onlywith Java 1.5 or higher) or Print Details.If you highlight a selection of points with your mouse before choosing Print Points, you will also be given theoption to print only the selected points.<strong>HOBOware</strong> User’s <strong>Guide</strong> 78
Closing a PlotImportant: Property changes are not saved when you close the datafile. To preserve these changes, you can pastea bitmap of the graph into other programs, or save changes to the plot in a .hproj project file.To close a plot, click the Close iconTo close a plot when you are in Tabbed View:on the toolbar, or choose Close from the File menu. Windows: click the Close icon on the tab of the plot. Mac: click the red button in the upper‐left corner of the internal frame containing the plot.If you made changes to the plot and then attempt to close it, a message appears asking if you wish to save yourchanges to a project file. Click Save to create an .hproj file.To close all plots, choose Close All from the File menu.NOTE: If you are sure that you do not want <strong>HOBOware</strong> to prompt you to save a plot as a project file when youclose it: go to Preferences > Warnings > General and clear the checkmark next to "Prompt me if there is anyremaining unsaved data when closing plot or application."Viewing a PlotYou can change your view of various aspects of the plot as you analyze the data.Changing the Order of a SeriesYou can shuffle the order of series by moving a series to the front or back. This is helpful if one series is hiddenbehind another. It also changes the order of series in the Details pane, Points table, and the legend.To change the order of the series:1. Select the arrow tool from the toolbar.2. Select the series you wish to move.3. Right‐click and select either Bring Series to Front or Send Series to Back.NOTE: After you adjust the order of the series for optimal viewing, copy the graph as a bitmap to paste into otherprograms, such as Microsoft Word ® or PowerPoint ® .Viewing Multiple PlotsUse the Window menu to organize several plots by Tabbed View , Tile Horizontally, or Tile Vertically . See TheWindow Menu Error! Bookmark not defined. for more details.Viewing a Pie ChartPie charts are available for plotted state series, such as those from the UX90 data loggers. This provides you with agraphical representation of the data for viewing, saving, and printing in addition to the default line graph. This isparticularly useful for the UX90 Occupancy/Light Data Logger (UX90‐005x/‐006x) because it allows you to quicklycompare when the:Lights were on and the room was unoccupiedLights were on and the room was unoccupiedLights were off and the room was occupiedLights were off and the room was unoccupied<strong>HOBOware</strong> User’s <strong>Guide</strong> 79
To view a pie chart:1. Open a file from a logger with state series and plot the state series and derived series (as applicable) thatyou want to view in the pie chart.2. Click the Pie Chart button on the toolbar.3. A pie chart is drawn based on the selected series. In this example, light & occupancy are plotted in the piechart. The legend at the bottom of the chart indicates what series each piece of the pie represents.Percentages for each pie wedge are shown in the yellow boxes To change the series used to generate the pie chart, click the "Select a Series" drop‐down arrow andthen click the Update Chart button. To change the timeframe used to create the pie chart, change the Start and End Date/Time asnecessary and then click the Update Chart button. To reset the pie chart to use the Start and End Date/Time for the current selected series, click theReset/Show at Full Scalebutton To save the pie chart as an image (.png file), click the Savebutton. To print the pie chart, click the Printbutton.Notes:4. When you are done viewing pie charts, click the Close button.The pie chart button on the toolbar will only be enabled when one or more state series is plotted. If youhave plotted data and the pie chart button is not enabled as expected, close the plot. Reopen the file and<strong>HOBOware</strong> User’s <strong>Guide</strong> 80
make sure you select the state series from the Plot Setup window. Note that if the sensor channels wereconfigured as runtime instead of state, then pie charts will not be available.If you merge datafiles, pie charts may not function properly if the time overlaps between merged series. Ifyou are having difficulty viewing a pie chart for a merged file, try returning to the original separate files toview the individual pie charts from each file.If you are working with a plot that has two series, such as Light and Occupancy, and you crop one of thoseseries, the time range for the pie chart data will be constrained to the shorter of the two series.If you paste a new state series into the plot, it will also be available from the Select a Series pull‐down list.You will need to select the series to view it in a pie chart; it will not display automatically.Converting UnitsTo change the units of an individual series, right‐click the series with the arrow tool and choose Convert SeriesUnits. Select the new unit type from the drop‐down list.To change the units for multiple series, use the Convert Plot window.To access the Convert Plot window: click the Units iconon the toolbar or, from the Main Menu select Edit > Convert Units.If a series can be configured with multiple units, there will be drop‐down list in the units field. Select the desiredunits from the drop‐down list, then click Convert. This changes the units displayed on the axis, in the legend, in theDetails pane, and in the Points table.Viewing Subset StatisticsNOTE: The Subset Statistics feature is only available with <strong>HOBOware</strong> Pro.The Subset Statistics feature allows you to select a range of data in a graph, and display the maximum, minimum,average and standard deviation for the measurements in that range.Demo: To view a Demo on Viewing Subset Statistics, visit http://www.onsetcomp.com/BHW_GraphingAnalysis.Steps1. Select the Subset Statistics tool from the toolbar:Alternate Method: Press the S key on your keyboard when the mouse pointer is on the graph.The mouse cursor will become the Subset Statistics Tool icon .2. Draw Subset<strong>HOBOware</strong> User’s <strong>Guide</strong> 81
With the left mouse button, click within the graph to define the start time of the subset and drag to theright. Release the mouse button when you reach the end time of the subset.The graph subset appears in the graph, and the subset statistics pane appears in the left frame. SeeOverview of a Graph Subset for more information.NOTE: When you first draw the subset, it is attached to the oldest time axis on the graph (the time axisthat was created when you displayed the plot).3. Refine Subset RangeTo refine the range of the subset, click the checkmark icon in the Subset Statistics pane. This opens theSubset Statistics properties section of the Axis Properties window. See Setting Subset Statistics Propertiesfor more information.Overview of a Graph SubsetThe Subset Statistics Tool allows you to select a subset of a graph, and display the maximum, minimum, averageand standard deviation for the measurements in that range.1. Subset Range:Two vertical indicators (black) appear on the graph to show the range of the subset.To adjust the start or end of the subset, click and drag the left or right end of the Edit Subset Bar. You canalso use the arrow keys to move the left boundary, and Ctrl+ (Windows) or Command‐ (Mac) arrow keysto move the right boundary. Place the cursor in the middle of the bar and drag to move the entire rangeleft or right.2. Subset Duration:A labeled horizontal indicator (blue) shows the duration of the subset. Use the up and down arrows tomove the horizontal indicator up or down.3. Edit Subset Bar:<strong>HOBOware</strong> User’s <strong>Guide</strong> 82
Resizing/Moving Subset: Place the cursor in the middle of the bar and drag to move the entire range leftor right. Place the cursor at the edge of the bar to move the range. If you have multiple time axes, clickinside the subset statistics bar to drag it to a different time axis.Show/Hide Display: Double‐click on the Edit Subset statistics bar to toggle between showing and hidingthe display of subset indicators and labels.4. Subset Statistics pane: Summarizes the data within the subset.5. Subset Statistics Properties: Click on the check mark to access the Subset Statistics Properties window,which allows you to refine the subset to a precise time range.Removing the SubsetTo remove the graph subset and related elements: Right‐click on the graph and select Remove Subset Stats from the pop‐up menu, or Choose Remove Subset Stats from the View menu, or Click the X icon in the upper‐right corner of the Subset Statistics pane.Setting Subset Statistics PropertiesThis topic describes the Subset Statistics section of the Axis Properties window, which you use to refine the rangeof a subset of a graph that you created using the Subset Statistics tool.Subset Statistics Properties Window1. Show/Hide Subset ElementsShow subset statistics for time bounds belowCheck this box to enable subset statistics for this time axis. Only one time axis can have a subset. Ifyou enable subset statistics for one time axis when another time axis already has a subset, theother time axis's subset will be removed.Show times, duration, & vertical indicators on graph<strong>HOBOware</strong> User’s <strong>Guide</strong> 83
Example 1Check this box to toggle the display of subset indicators and labels on the graph. If you disable thisoption, the Subset Statistics pane and the shaded subset statistics bar on the time axis will stillremain visible.2. Configure Subset RangeThe easiest method to set a range for the subset is to indicate a fixed Start Date/Time or End Date/Time,and then indicate the duration.Alternatively, you can enter both a Start Date/Time or End Date/Time without specifying a durationTo set a range beginning at 8:00 a.m. on 1/23/08 with a duration of 2 hours:1. Check the Show subset statistics box.2. Set the Start Date to 1/23/083. Set the Start Time to 08:00:00.000 AM4. Check the Anchor Start Point box.5. Set the Duration to 2 Hours.Example 2To configure a range of 1 day prior to 10:00 PM on January 23, 2008:1. Set the End Date to 1/23/082. Set the End Time to 10:00:00.000 PM3. Check the Anchor End Point box.4. Set the Duration to 1 Day.Filtering a SeriesYou can create a new series in a plot based on statistical analysis of an existing series over specified periods oftime.<strong>HOBOware</strong> User’s <strong>Guide</strong> 84
StepsTo filter a series:1. Access the Filter Series window.Option 1: Choose the arrow toolmenu., select the series, right‐click and choose Filter Series from the pop‐upOption 2: Click on the series and then from the Main Menu select Edit > Filter Series2. Choose the type of statistic to use for the filter:For sensor series, you can create a series showing the minimum, maximum, or average over a period oftime.For external event series, you can create a series showing a cumulative sum, or a count over a period oftime.For internal event series, you can create a series showing a count over a period of time.For series created by Data Assistants (<strong>HOBOware</strong> Pro Only), additional filters may be available.3. Specify the interval over which you want these values to be calculated.4. Enter a new Resultant Series Name, if desired.5. Click OK. The new series is added to the graph, the Details pane, and the Points pane. Note thatwhen you apply a filter, the graph rescales to accommodate all of the displayed data.Note: This filter only applies to existing data files/plots. There is an additional filter tool available when launchingmost loggers.Cropping a SeriesThis feature allows you to remove data from a series by changing the time frame. You can crop one or multipleseries in a plot.1. To crop multiple series, right‐click anywhere in the plot (without a series selected). To crop a singleseries, right‐click on the series and select Crop Series.The Series to Crop window appears.<strong>HOBOware</strong> User’s <strong>Guide</strong> 85
1. Series to CropDeselect any series you do not want to crop.2. Set Time RangeDefine the boundaries of the new series (inclusive, and limited to the minimum and maximum date andtime of the Time Axis in the plot). If the stats tool has been used on the plot, the stats tool start and endpoints will be selected by default.3. Click the OK button.The Selected Series will be cropped, as shown in the example below.The Cropped Series will be indicated in the Details Pane, and the Points Table will reflect the new time range.Overlaying SeriesIf the series you are comparing were logged at different times, you will need to make some adjustments to the plotin order to view the series together.1. Display the source plot(s) and the destination plot.2. On the destination plot, choose the arrow tool3. Double‐click the time axis to access the Axis Properties dialog.4. In the Axis Properties dialog, give the axis a unique Name5. Click Done.6. Copy a series from a source plot.7. Paste the series into the destination plot.When you paste the series, a new time axis will appear on the graph.<strong>HOBOware</strong> User’s <strong>Guide</strong> 86
8. Double‐click the new time axis to access the Axis Properties dialog.9. Give the axis a unique Name10. Click Done.11. Repeat steps 6‐10 for each series you want to paste.12. Identify the periods of interest in each series you want to combine and note the times for each. Also,determine which period is the longest; this should be the length of time shown on each axis.13. Double‐click a time axis and adjust its Min and Max bounds. The new bounds should include theperiod of interest for the series, and be the same length as the longest period identified in step 4.Repeat for each time axis.14. Use the hand tool on each time axis to adjust the series horizontally as needed.Merging DatafilesThis feature allows you to combine multiple datafiles from a deployment into one file. Note that only series of thesame type and name can be merged and there cannot be an overlap in the time in the series.1. Open the first file (oldest).2. Select Merge Datafile(s) from the File menu.3. Select the datafiles you want to merge.4. Click Open. The Merge Series Setup window appears. See The Merge Series Setup window for details.There will be a gap between the last sample in the older series and the first sample in the next series as shownhere in both the Temperature and RH series.After the series have been merged, the Details Pane will be regenerated and the Series Statistics will berecalculated. The Points Table will be regenerated and will show samples of both series in one column. The newlogger information is added to the Details Pane, showing the specific information about the different loggers thatcollected the data samples.<strong>HOBOware</strong> User’s <strong>Guide</strong> 87
Removing a Series from a PlotYou can remove sensor, state, and event data series from the plot. This is helpful if the datafile contains multipleseries and you cannot easily view them all together.StepsTo remove a series from a plot:1. Select the arrow tool from the toolbar.2. Click the series you wish to remove and press the Delete key, or right‐click the series and chooseRemove from the menu that appears.On a laptop computer press Fn‐Delete.A warning appears, indicating that the only way to add the series back to the plot is to reopen the plot.3. Click Yes.The series is removed from the graph, the Details pane, and the Points table.Data AssistantsWith Data Assistants, you can create new series by combining data recorded by the logger with additional data foranalysis. For example, the kWh Assistant converts logged pulse data from an energy transducer to kWh, averagekW, and energy cost.When you read out a logger or open a datafile, all available assistants are listed in the Data Assistants section atthe bottom of the Plot Setup window. To use a Data Assistant, click the assistant name to select it, and then clickthe Process button.For some data loggers, you can also run the Linear Scaling, Pulse Scaling, and kWh Data Assistants from the LaunchLogger window to create additional data series that are automatically available each time you read out the loggerand open the resultant data file. To use an assistant from the Launch Logger window, click the Scaling or kWhbutton and then double‐click the desired assistant, or select the assistant and click the Create button.The following Data Assistants are available in <strong>HOBOware</strong> Pro: Barometric Compensation Assistant. Use the Barometric Compensation Assistant to compensatefor barometric pressure and create a water level or sensor depth series. The BCA uses water pressuredata from a HOBO U20 Water Level logger and additional information you provide. Conductivity Assistant. Use the Conductivity Assistant to apply compensation to absoluteconductance data from a HOBO U24 Conductivity logger. Dissolved Oxygen Assistant. Use the Dissolved Oxygen Assistant to generate a series adjusted forsalinity and a series for percent saturation based on data from a HOBO U26 Dissolved Oxygen logger.Also use this assistant to enter field calibration readings to compensate for fouling. Grains Per Pound Assistant. Use the Grains Per Pound Assistant to calculate the absolute amountof water in the air, based on temperature, humidity, dew point, and altitude. You can also create analtitude‐corrected dew point series. Growing Degree Days Assistant. Use the Growing Degree Days Assistant to calculate growingdegree days based on temperature data spanning at least one full calendar day (midnight tomidnight). Growing degree days are used for agricultural and turf management applications, such asestimating harvest time or pest growth.<strong>HOBOware</strong> User’s <strong>Guide</strong> 88
kWh Assistant. Use the kWh Assistant to convert logged pulse data from a WattNode, Veris, or otherenergy transducer to kWh, average kW, and energy cost. The kWh Assistant can be run during PlotSetup or at Launch. Linear Scaling Assistant. Use the Linear Scaling Assistant to convert a data series from a compatiblesensor to some other measurement. You enter two raw values and their corresponding measurementvalues. The conversion must be based on a linear relationship. Nonlinear scaling is not available. Pulse Scaling Assistant. Use the Pulse Scaling Assistant to convert a data series from a compatiblesensor to some other measurement. You enter a raw value and its corresponding measurement value.The Pulse Scaling Assistant can be run during Plot Setup or at Launch.Default SettingsThe parameters last entered into any given Data Assistant will be the default used the next time the Data Assistantis run, unless it is being used to edit existing series. If you run a Data Assistant at Plot Setup time and then later yourun it from the Launch Logger window, the default values are the value you entered at Plot Setup time.Hiding AssistantsTo prevent unwanted assistants from appearing in the Plot Setup window, or to bring back assistants that you havepreviously hidden, click the Manage button. This will open the Preferences window to allow you to change thesesettings.Software UpdatesIf you have an Internet connection, <strong>HOBOware</strong> Pro can periodically check the Onset website for software updates.This includes updates to your data assistants.The default is to check once per week, but you can configure <strong>HOBOware</strong> Pro to check daily or monthly. InPreferences, go to the General pane and select Startup. In the Check for <strong>HOBOware</strong> Updates drop‐down list, selecthow frequently you want the software to check for updates.You may also check for updates manually at any time. Choose Check for Updates from the Help menu.Installing a Data AssistantData Assistants are automatically installed (they require a <strong>HOBOware</strong> Pro license key). There may also be timeswhen a new Data Assistant is available between <strong>HOBOware</strong> releases and needs to be installed manually. To dothis, click the Load button on the Plot Setup window and select the assistant's .jar file. Note: On Windows, youmust be an administrator to load a new Data Assistant. To temporarily run <strong>HOBOware</strong> as an Administrator, rightclickthe <strong>HOBOware</strong> icon and select Run as Administrator. Enter the Administrator name and password asprompted.License AgreementThis software is furnished in accordance with a separate license agreement included with the software, andsubject to any restrictions set forth therein. For more information about Onset's licensing terms and policies,contact Onset Customer Service at 1 800 LOGGERS, or visit http://www.onsetcomp.com/legal.Barometric Compensation AssistantThe Barometric Compensation Assistant uses water pressure data from a HOBO U20 Water Level Logger andadditional information from you to compensate for barometric pressure and create a water level or sensor depthseries.After you use the assistant and display the plot, you may apply filters to the new series.To create a water level or sensor depth series:<strong>HOBOware</strong> User’s <strong>Guide</strong> 89
1. Read out a logger or open a datafile that contains water pressure data from a U20 Water Level Logger.2. From the Plot Setup dialog, select Barometric Compensation Assistant and click Process.3. Provide Fluid Density information by choosing a water type (fresh, salt, or brackish), entering a specificconstant value, or using the temperature series (if logged) to use temperature‐compensated densityassuming fresh water.4. To enter a reference water level, check the Use a Reference Water Level box, enter the water level,and indicate whether it is in feet or meters. Enter the water level as a positive number if it is measured upward from a reference pointbelow the water's surface, such as the water's height above sea level. Enter the water level as a negative number if it is measured downward from a reference pointabove the water's surface, such as a well cap.Then, from the drop‐down, select the logged time and value that is closest to the time when you measuredthe water level. When selecting a logged value and time to link to the reference level, make sure the loggerreadings have stabilized. When a logger is first deployed in water, it takes some time for itstemperature to reach equilibrium. You will get the best accuracy if you link your referencereading to a stabilized logger reading. When using a reference water level, the resulting series data will contain water level valuesrelative to this reference level. If you do not use a reference water level, the resulting seriesdata will contain values for absolute sensor depth.5. You can either use a barometric data file from another source, or enter a fixed barometric pressure.For the most accurate water level results, use a reference water level and a barometric data file. Thebarometric data can come from another HOBO U20 Water Level Logger in air; a HOBO WeatherStation, HOBO Micro Station, HOBO U30, or HOBO Energy Logger; or a text file from another source. To use another file to provide barometric information, click the Use Barometric Datafile buttonand enter (or browse to) the name of a .hobo, .hsec, .dtf, .dsec, or .txt file that contains abarometric pressure series from an overlapping time period. You will have the option to<strong>HOBOware</strong> User’s <strong>Guide</strong> 90
display this series on the plot. Important: To use a .txt file, see Import Text FilesRequirements. To use a constant pressure value, click the Use Constant Barometric Pressure button. Enter theconstant value and indicate whether it is in psi or kPa. (You cannot use a constant pressurevalue in combination with a reference water level.)6. Keep the default Resultant Series Name, or enter a new one. You may also enter User Notesconcerning the series you are creating.NOTE: Your settings are retained, so you do not need to re‐select your density and barometric file eachtime you use the Barometric Compensation Assistant as long as they still apply to the new water leveldata set.7. Click Create New Series. The new series is listed and selected in the Plot Setup dialog. You can clickProcess on the Plot Setup dialog again to create another series using different barometriccompensation parameters.8. Click the Plot button. The scaled series will appear in the plot and the settings for the scaled series arelisted in the Details pane:After the plot is displayed, you may apply minimum, maximum, and average filters to the new water level orsensor depth series as you would for any sensor data series in <strong>HOBOware</strong> Pro.Conductivity AssistantThe Conductivity Assistant converts raw conductivity data from a U24 logger to Specific Conductance and/orSalinity. It also allows using field calibration measurements recorded at the beginning and end of a deployment forcalibration and to compensate for drift and sensor fouling effects.1. Read out a U24 series logger or open a datafile from a U24 logger.2. From the Plot Setup window, select the Conductivity Assistant and click the Process button.3. In the Conductivity Assistant dialog, select the conductivity series that corresponds to the range ofyour data. Note: If you only selected one range at launch time, only one series will be listed. For the U24‐001 logger, select either Conductivity Low Range when the data is always less than1000 µS/cm or select Conductivity Full Range (default) when the data goes above 1000 µS/cmas shown below.<strong>HOBOware</strong> User’s <strong>Guide</strong> 91
For the U24‐002 logger, select either Conductivity Low Range when the data is always less than10,000 µS/cm or select Conductivity High Range (default) when the data goes above 10,000µS/cm as shown below.4. Select your desired Temperature Compensation method. Use "Non‐linear, Natural Water Compensation per EN27888" for freshwater lakes and streams. Use "Linear compensation default at 2.1 %/°C" or "Linear compensation at "for NaCl solutions or other linear solutions. Use "Non‐linear, Sea Water Compensation based on PSS‐78" for salt water or salt marshes.5. Select a Calibration Method. By default, data is calibrated using the factory calibration. To enter yourown calibration values, select “Use measured points for calibration” and then enter temperature and<strong>HOBOware</strong> User’s <strong>Guide</strong> 92
actual conductivity (not specific conductance) values from your calibration readings taken with a fieldmeter. These field measurements will be used to provide calibrated conductivity and salinity dataseries by adjusting the data as a percentage of the reading. See Calibration below for moreinformation. Starting and Ending Value: This method calibrates your data and adjusts for sensor drift orfouling. This assumes there is a linear change in calibration adjustment required. Starting value only: All readings are adjusted up or down by a fixed percentage of the readingbased on this calibration point. Ending Value Only: The factory calibration value is used as the starting point. This assumesthere is a linear change in calibration adjustment required.Note: You cannot use a zero‐point calibration solution for starting and ending values. The first datapoint cannot be used as the ending value; consider using that as the starting value instead.6. Select the Only Report Data Between the Selected Points checkbox if you want readings from beforeor after the calibration points to be removed from the resulting series.7. In the Series Name field, keep the default name or type a new one.8. Type any User Notes concerning the series you are creating (optional).9. Click the Create New Series button.10. The Plot Setup dialog lists a series called Specific Conductance (or the name you entered for SeriesName). The default units are microSiemens/cm (µS/cm). You can change the units to milliSiemens/cm(mS/cm) if desired. The default units for salinity are ppt (parts per thousand) and this cannot bechanged.11. Click the Plot button to plot the data. The Details Pane will show the series selected in the Plot Setup:<strong>HOBOware</strong> User’s <strong>Guide</strong> 93
After the plot is displayed, you may apply minimum, maximum, and average filters to the scaled series asyou would for any sensor data series in <strong>HOBOware</strong> Pro.12. Save this plot as a Project to preserve this processed data.CalibrationIt is important to take temperature and conductivity calibration readings with a portable conductivity meter atboth the beginning (launchtime) and end of a deployment (readout) because these readings are necessary for datacalibration and to compensate for any measurement drift during deployment. The temperature and conductivitycalibration readings should be the actual conductivity values (not in specific conductance at 25°C), and should berecorded in a notebook with the time and location of the reading. See the logger manual for details on differentmethods of obtaining water samples to record these values.Notes:1. Once the logger is deployed and logging, record in a notebook the temperature and actualconductivity meter readings along with the date and time which will be entered into the ConductivityAssistance to correct the field data.2. Before you remove the logger and read out its data, take another temperature and conductivityreading with the meter and record the exact date and time.3. Enter these values under the "Use measured points for calibration" option in the ConductivityAssistant.Whenever a logger is removed for downloading data, clean the sensor window using a cotton swabwith a mild detergent and rinse.If the water in the field is not accessible to the conductivity meter sensor, such as in a deep well, abailer can be used to fetch a water sample for testing. See the logger manual for more details.Dissolved Oxygen AssistantThe Dissolved Oxygen Data Assistant corrects for measurement drift from fouling and provides salinity‐adjustedDO concentration as well as percent saturation data.1. Read out a U26 series logger or open a datafile from a U26 logger.2. From the Plot Setup window, select the Dissolved Oxygen Assistant and click the Process button.3. With the Dissolved Oxygen Data Assistant, you can adjust the data for salinity (step 4), enter barometricpressure information for percent saturation calculation (step 5), select the resultant series you wish togenerate (step 6), and enter field calibration data (step 7).<strong>HOBOware</strong> User’s <strong>Guide</strong> 94
4. Adjust for salinity. If you deployed the logger in saltwater, you must adjust for salinity to get either a DOconcentration or percent saturation. To do this, select the “Adjust for Salinity” checkbox (you will alsoneed to select the checkboxes under Resultant Series Information for the series you would like). Selectwhether the series should be adjusted based on salinity or specific conductance.If you chose salinity: Select “Salinity value” if you have a specific value from a conductivity meterreading or other source; type the value in ppt as shown below. This works well if the salinity isconstant during the deployment. If the salinity changes during the deployment, select “Salinitydatafile” to use a data file from a U24 conductivity logger or a text file. Click the Choose button andselect the file. (See the Important note for more details about using files.)If you chose specific conductance: Select “Sp. cond. Value” if you have a specific conductance valuefrom a meter reading or other source; type the value in either µS/cm or mS/cm as shown below. Thisworks well if the specific conductance is constant during the deployment. If it is not constant, select“Specific conductance datafile” to use a data file from a U24 conductivity logger or a text file. Clickthe Choose button and select the file. (See the Important note for more details about using files.)<strong>HOBOware</strong> User’s <strong>Guide</strong> 95
IMPORTANT: When using a file for salinity or specific conductance data, you can select either a .hobo filefrom a HOBO U24 Conductivity Logger or a .txt file from a U24 logger after it has been calibrated with theConductivity Assistant. Using a U24 .hobo file is the easiest while a calibrated U24 text file provides thehighest accuracy. Follow these steps to create a text file from a U24 Conductivity Logger in the properformat:A. Click Cancel to close the DO Assistant and Plot Setup windows if they are open.B. From the File menu, select Preferences.C. In the General Preferences, select Export Settings.D. Click the “Use default BoxCar Pro export settings” button and click OK. This will ensure the textfile you create is the proper format for the Dissolved Oxygen Assistant.E. From the File menu, select Open Datafile and select the U24 .hobo file.F. In the Plot Setup window, select the Conductivity Assistant and click Process.G. In the Conductivity Assistant, create a calibrated specific conductance or salinity data series.H. Back in the Plot Setup window, select the specific conductance or salinity series only. Click Noneunder Select Internal Events to Plot so that no events are plotted.I. Click the Plot button.J. From the File menu, select Export Table Data. Choose “Export to single file” if prompted.K. To use the calibrated conductivity file, open the DO file again. In the Plot Setup window, selectthe Dissolved Oxygen Assistant and click Process. Select the text file you just created in theprevious step for the salinity or specific conductance datafile. This file will be used to generatethe series adjusted for salinity.5. Use barometric pressure (for percent saturation). Check the “Use barometric pressure (for percentsaturation)” box if you want to generate a DO percent saturation series (you will also need to select theDO Percent Sat. checkbox under Resultant Series Information). For the best accuracy, use a data file froma HOBO Water Level logger deployed in the air or a nearby weather station. Select “Barometric Datafile”and click the Choose button to select the .hobo or .txt file. Important: If you are using a .txt file from anon‐HOBO device, it must follow specific requirements as described in Import Text File Requirements inthe <strong>HOBOware</strong> Help.If you do not have a barometric pressure file, then select “Barometric data value” and type in the averagebarometric pressure during your deployment in one of the five available units.If the barometric pressure readings are from barometric data that has been adjusted to sea level readings(such as those taken from a National Weather Service weather station), then you must also select the “Forsea level barometric pressures, enter elevation” checkbox and type the elevation where the logger wasdeployed in either meters or feet. Absolute pressure values, such as those obtained from a HOBO WaterLevel logger, do not need to be adjusted for elevation.<strong>HOBOware</strong> User’s <strong>Guide</strong> 96
6. Resultant Series Information. Make sure the series you want to plot are selected in the Resultant SeriesInformation pane. To generate a series for adjusted DO concentration, check the “DO Adj Conc.” box. Togenerate a series for percent saturation, check the “DO Percent Sat.” box. The default series namesdisplay automatically to the right of the selected series. Edit those series names as needed. You can alsotype up to 250 characters of optional user notes.7. Perform Field Calibration. Use field calibration to compensate for measurement drift due to fouling or ifthe logger was not lab calibrated. (Lab calibration typically remains accurate for the full 6‐month life ofthe sensor cap if there is no fouling.) Check the “Perform field calibration” checkbox and select the type offield calibration: either “Using Dissolved Oxygen Meter or Dissolved Oxygen Titration” or “Using 100%Water‐Saturated Air.”For calibration using a dissolved oxygen meter or titration: Select the “Starting calibration point”checkbox and select the date/time of the calibration reading. View the logged data values shown inthe drop‐down box to be sure that the logger readings have stabilized. It is more important that youuse a good stabilized logger reading than exactly matching the times. Type in the Meter/TitrationDO Measurement in mg/L taken at that date/time. If you are using an ending calibration reading,select the “Ending calibration point” checkbox and select the date/time of that calibration reading.Make sure the logger reading you use for calibration is one from when the logger was in the water,keeping in mind that the logger time may be slightly different from the time used for your fieldreadings. You can usually see the data points that were recorded when the logger was out of thewater. Type in the Meter/Titration DO Measurement in mg/L for this ending calibration point.Note: If only an “Ending calibration point” is entered (“Starting calibration point” not checked), thenthe assistant will use the logger calibration for the starting calibration. This assumes you are startingwith an accurately calibrated logger and saves you from having to do your own starting point<strong>HOBOware</strong> User’s <strong>Guide</strong> 97
calibration. However, if you select a “Starting calibration point” and no “Ending calibration point,” theseries will be adjusted for the one calibration point. This may be accurate enough for applicationswhere there is no significant fouling during the deployment time.For calibration using 100% water‐saturated air: Select the “Starting calibration point” checkbox andselect the date/time for the first calibration reading. View the values shown in the drop‐down list tobe sure the readings are stable at this calibration point (using a calibration point from when thelogger is in air or has not reached temperature equilibrium will result in incorrect calibration). Selectthe source of the barometric pressure readings. From the Barometric Pressure drop‐down list, select"from the left" to use the barometric pressure data file already entered in the assistant or select"entered here" to enter a specific barometric pressure value in one of five available units. If you areusing an ending calibration reading, select the “Ending calibration point” checkbox and select thedate/time of that calibration reading following the same guidelines as you did for the startingcalibration point. For the ending point, enter the barometric pressure information (select “from theleft” or “entered here” as described above).Check the “Only report data between selected points” if you want the new series to only include databetween the selected calibration points. Leave this option unchecked to include all data.8. Click the Create New Series button when finished entering information in the data assistant.9. Depending on which series you selected to add, the Plot Setup dialog lists two news series: DO Adj Concand DO Percent Sat (or the names you entered for Series Names). The default units for the DO Adj Concseries are mg/L. You can change the units to ppm if desired.<strong>HOBOware</strong> User’s <strong>Guide</strong> 98
10. Click the Plot button to plot the data. After the plot is displayed, you may apply minimum, maximum, andaverage filters to the scaled series as you would for any sensor data series in <strong>HOBOware</strong> Pro.11. Save this data and plot setup as a Project to preserve the new series you created for future use.Field ValuesThese are the minimum and maximum values allowable in the fields in this assistant.Measurement, Units Minimum Maximumpressure, mm Hg 380.00 836.00pressure, in Hg 14.9700 32.9100pressure, millibars 507.0 1,114.0pressure, kPa 51.000 112.000pressure, Pa 51,000 112,000pressure, psi 7.3480 16.1600elevation, m ‐304.80 2 2,438.40elevation, ft ‐1000.00 8,000.00salinity, ppt 0.0000 42.0000sp. cond., µs/cm 0.0 65,000.0sp. cond., ms/cm 0.0000 65.0000meter/titration DO conc, mg/L 0.00 30.00Grains Per Pound AssistantThe Grains Per Pound Assistant calculates the absolute amount of water in the air, based on temperature,humidity, dew point, and altitude. You can also create an altitude‐corrected dew point series.To create a grains per pound and altitude‐corrected dew point series:1. Read out a logger or open a datafile that contains temperature, humidity, and dew point series.<strong>HOBOware</strong> User’s <strong>Guide</strong> 99
2. From the Plot Setup window, select the Grains Per Pound Assistant and click the Process button.3. In the Grains Per Pound Assistant dialog, choose the data series you want to convert from theTemperature, Relative Humidity, and Dew Point Series drop‐down lists.4. To correct for the Altitude above Sea Level (optional), enter the altitude and use the drop‐down menuto indicate whether this number is in feet or meters.5. Select the Add Altitude‐Corrected Dew Point Series to Graph checkbox to plot an altitude‐correcteddew point series.6. In the Resultant Series Name field, keep the default name or type a new one.7. Type any User Notes concerning the series you are creating (optional).8. Click the Create New Series button.9. The new grains per pound series (and altitude‐corrected dew point series, if applicable) is listed andselected in the Plot Setup dialog. Click the Plot button.10. The scaled series will appear in the plot and the settings for the scaled series are listed in the Detailspane:After the plot is displayed, you may apply minimum, maximum, and average filters to the grains per pound andaltitude‐corrected dew point series as you would for any sensor data series in <strong>HOBOware</strong> Pro.Growing Degree Days AssistantThe Growing Degree Days Assistant calculates growing degree days based on temperature data spanning at leastone full calendar day (midnight to midnight). Growing degree days are used for agricultural and turf managementapplications, such as estimating harvest time or pest growth.<strong>HOBOware</strong> User’s <strong>Guide</strong> 100
One growing degree day (GDD) is equivalent to a one degree increase above a minimum threshold temperature fora period of one day. For example, assuming no horizontal cutoff, if the minimum threshold temperature is 70°Fand the temperature was a constant 85°F for the day, the GDD for that day is 15 GDD.A single GDD value is calculated for each full calendar day of temperature data, and plotted at noon for that day.GDD values are cumulative; that is, the GDD for each day adds to the previous days’ GDD value.Important: Time of day is a factor in the GDD computation. When you launch a logger, be sure that yourcomputer’s clock is set to the proper time zone for the area where the logger will be deployed. If you try to correctit later by entering a different offset in the Plot Setup dialog, you may get confusing or misleading results.To create a series for growing degree days:1. Read out a logger or open a datafile that contains data from a temperature sensor.2. From the Plot Setup window, select Growing Degree Days Assistant and click the Process button.3. In the Growing Degree Days Assistant dialog, choose the data series you want to convert from theTemperature Series drop‐down list.4. Select the Calculation Method you want to use. Average Method: Calculates the average of the high and low temperatures for the day(adjusted to the lower and upper thresholds, if necessary), then subtracts the low threshold tocompute the GDD. Single Triangle (no Cutoff): Uses the low and high daily temperatures to compute a set oftwo linear equations to generate a triangle. The area between the curve and the low thresholdis then used to compute the GDD. Single Triangle (with Horizontal Cutoff): Uses the low and high daily temperatures tocompute a set of two linear equations to generate a triangle. Then it adjusts any temperaturesabove the upper threshold to the upper threshold. The remaining area between the curve andthe low threshold is then used to compute the GDD.<strong>HOBOware</strong> User’s <strong>Guide</strong> 101
Single Sine (no Cutoff): Uses the low and high daily temperatures to compute a sine wavethat assumes the low temperature occurred at midnight and the high temperature occurred atnoon. The area between the curve and the low threshold is then used to compute the GDD. Single Sine (with Horizontal Cutoff): Uses the low and high daily temperatures to computea sine wave that assumes the low temperature occurred at midnight and the high temperatureoccurred at noon. Then it adjusts any temperatures above the upper threshold to the upperthreshold. The remaining area between the curve and the low threshold is then used tocompute the GDD. Actual Temperature Method (no Cutoff): Uses the logging interval of the temperaturedata to perform a numerical integration. The area between the curve and the low threshold isused to compute the GDD. Actual Temperature Method (with Horizontal Cutoff): Adjusts any temperatures abovethe upper threshold to the upper threshold. Then it uses the logging interval of thetemperature data to perform a numerical integration. The area between the curve and the lowthreshold is then used to compute the GDD. Actual Temperature Method (with Vertical Cutoff): Uses the logging interval of thetemperature data to perform a numerical integration. Any interval in which the temperatureexceeds the upper threshold is excluded from the calculation. The remaining area between theactual curve and the low threshold is then used to compute the GDD.5. Select lower and upper Development Threshold values. These are the minimum and maximumthresholds that will be used in the GDD calculation. Use the sliders to set these thresholds, or enterthe values manually. If the calculation method you chose does not use an upper threshold, the upperthreshold option will be disabled. Temperatures are in degrees Fahrenheit if your default unitpreference is US, and in degrees Celsius if your default unit preference is SI.6. In the Biofix Parameters panel, choose a date that marks the beginning of the development phase forthe Biofix date. The dates in this list are the full days contained in the datafile.7. In the Degree Days to Event, enter the number of degree days needed to reach an event of interest(harvest time, pest emergence, etc.). This will create an alarm line on the graph to indicate when theevent took place. Degree days are in Fahrenheit (DDf) if your default unit preference is US, and inCelsius (DDc) if your default unit preference is SI.8. In the Event Description field, type any text to identify the event (optional).9. In the Resultant Series Name field, keep the default name or type a new one.10. Type any User Notes concerning the series you are creating (optional).11. Click the Create New Series button.12. The new series is listed and selected in the Plot Setup dialog. Click the Plot button.13. The scaled series will appear in the plot and the settings for the scaled series are listed in the Detailspane:<strong>HOBOware</strong> User’s <strong>Guide</strong> 102
kWh AssistantThe kWh Assistant converts logged pulse data to kWh, average kW, and energy cost with WattNode, Veris, orother energy transducers, and from Raw Pulse sensors attached to a HOBO 4‐Channel Pulse Input Data Logger(UX120‐017x).This assistant can be applied to logged data from a S‐UCA‐xxxx or S‐UCC‐xxxx Electronic Switch Pulse InputAdapter. It is not compatible with the S‐UCB‐xxxx or S‐UCD‐xxxx Contact Closure Pulse Input Adapter.After you use the assistant and display the plot, you may apply filters to the new series.This data assistant is one of several launch utilities that can also be used at launch time for certain loggers.Using the kWh AssistantFrom the Logger Launch window:1. At launch time: Using a logger or sensor that supports scaling at launch time, click the Launch iconon the toolbar. Click the Scaling button. Double click the assistant name or select the assistant andclick the Create button.At plot setup: Read out a logger or open a file that supports kWh scaling. Select the kWh Assistant andclick the Process button.2. In the kWh Assistant dialog, choose the data series you want to convert from the Pulse Series dropdownlist.<strong>HOBOware</strong> User’s <strong>Guide</strong> 103
3. In the Setup panel, select the Energy Transducer that was used, and choose the model number fromthe drop‐down list. (Since the Veris transducers have a switch to define kWh/pulse, you must specifythat here as well.) If your transducer is not listed, select Other and enter the conversion factor.Choose the type of conversion (Wh/pulse per CT Rated Amp, Wh/pulse, or kWh/pulse) from the dropdownlist. Refer to the manual that came with your energy transducer for help with identifying theconversion factor4. Enter the current transformer size (in Amps) in the CT Size field. (Veris transducer CT sizes arepredefined.)5. In the Output Series panel, select one or more series you wish to create. For each series, you maykeep the default Resultant Series Name or type a new one. To create a series that shows energy in kWh, check the Energy box. To create a series that shows average power, check the Average Power per interval box. To create a cost series, check the Usage Cost box and enter the cost per kWh.6. Type any User Notes concerning the series you are creating (optional).7. Click Create New Series.8. If you are running this assistant at launch time, the kWh button displays the number of newly createdseries. If using this assistant while plotting, the new series is listed and selected in the Plot Setupdialog. Click the Plot button to display the series.9. The scaled series will appear in the plot immediately or when you read out the logger if configuringthis at launch time. The settings for the scaled series are listed in the Details pane of the plot:<strong>HOBOware</strong> User’s <strong>Guide</strong> 104
After the plot is displayed, you may apply filters to the new series as you would for any other series in <strong>HOBOware</strong>Pro. In addition to the minimum, maximum, and average filters that are available for most series, the energy andcost series allow you to create new series showing totals over a period of time.Linear Scaling AssistantThe Linear Scaling Assistant converts a data series from a compatible sensor to some other measurement whenyou enter two raw values and their corresponding measurement values. The conversion must be based on a linearrelationship. Nonlinear scaling is not supported.Supported SensorsThis assistant is available for the following sensors: CABLE‐2.5‐STEREO Voltage Input Cable (for U12 loggers) CABLE‐4‐20‐mA Input Cable (for U12 loggers) CABLE‐ADAP5 (for U12 loggers) CABLE‐ADAP10 (for U12 loggers) S‐CIA‐xxxx 12‐bit 4‐20mA Input Adapter S‐VIA‐xxxx 12‐bit Voltage Input Adapter S‐FS‐CVIA FlexSmart Analog Module S‐FS‐TRMSA FlexSmart TRMS Module U30 Analog Sensor Port S‐LWA‐xxxx Leaf Wetness S‐SMx‐xxxx Soil MoistureThe Linear Scaling Assistant can be applied only to logged data from these sensors.Other Types of ScalingThere are also other types of scaling available within <strong>HOBOware</strong> Pro which may apply to your configuration: FlexSmart modules are set up for scaling prior to launch, as part of the module configurationprocess. You can later rescale these scaled series using the Linear Scaling Assistant if you need tocreate a different measurement. See Configuring an Analog Module/Port. The Pulse Scaling Assistant is similar to the Linear Assistant, but only allows scaling of pulse data.Using the Linear Scaling Assistant1. At launch time: Using a logger with a sensor that supports scaling at launch time, click the Launchicon on the toolbar. Click the Scaling button. Double click the assistant name or select the assistantand click the Create button.At plot setup: Read out a logger or open a file that supports linear scaling. Select the Linear ScalingAssistant and click the Process button.2. In the Linear Scaling Assistant dialog, choose the data series you want to convert from the Raw Seriesdrop‐down list.<strong>HOBOware</strong> User’s <strong>Guide</strong> 105
3. In the Scaled column of the Parameters panel, type the units name for the scaled series and enter thescaled values in the Scaled column to correspond with the numbers in the Raw column. (The defaultvalues in the Raw column are based on the high and low values supported by the sensor, but you mayuse different values, as long as those values fall within the sensor's range.) These numbers establish alinear relationship between raw and scaled values.4. In the Resultant Series Name field, keep the default name or type a new one.5. Type any User Notes concerning the series you are creating (optional).6. Click the Create New Series button.7. If you ran the assistant from the Launch window, the Scaling button displays the number of newlycreated series. If using this assistant while plotting, the new series is listed and selected in the PlotSetup dialog. Click the Plot button to display the series.8. The scaled series will appear in the plot immediately or when you read out the logger if configuringthis at launch time. The settings for the scaled series are listed in the Details pane of the plot:After the plot is displayed, you may apply minimum, maximum, and average filters to the scaled series as youwould for any sensor data series in <strong>HOBOware</strong> Pro.<strong>HOBOware</strong> User’s <strong>Guide</strong> 106
Pulse Scaling AssistantThe Pulse Scaling Assistant converts a data series from a compatible sensor to some other measurement when youenter a raw value and its corresponding measurement value. The conversion must be based on a linearrelationship. Nonlinear scaling is not supportedThe Pulse Scaling Assistant can be run from the Launch window (Pre‐set Parameters) or from the Plot Setup dialog.If you run the assistant from the Plot Setup dialog, you must run the assistant each time you readout the logger oropen a datafile.Supported SensorsThis assistant is available for the following sensors: S‐UCA‐xxxx and S‐UCC‐xxxx Electronic Switch Pulse Input Adapter S‐UCB‐xxxx and S‐UCD‐xxxx Contact Closure Pulse Input Raw Pulse sensors connected to the HOBO 4‐Channel Pulse Input Data Logger (UX120‐017x)Other Types of ScalingThere are also other types of scaling available within <strong>HOBOware</strong> Pro which may apply to your configuration: FlexSmart modules are set up for scaling prior to launch, as part of the module configurationprocess. See Configuring an Analog Module/Port. The Linear Scaling Assistant is similar to the Pulse Scaling Assistant, but has slightly different inputoptions and is compatible with a different group of sensors. See the Linear Scaling Assistant for moreinformation.Using the Pulse Scaling Assistant1. At launch time: Using a logger with a sensor that supports scaling at launch time, click the Launchicon on the toolbar. Click the Scaling button. Double click the assistant name or select the assistantand click the Create button.2. At plot setup: Read out a logger or open a file that supports pulse scaling. Select the Pulse ScalingAssistant and click the Process button.3. In the Pulse Scaling Assistant dialog, choose the data series you want to convert from the Raw Seriesdrop‐down list.<strong>HOBOware</strong> User’s <strong>Guide</strong> 107
4. In the Scaled column of the Parameters panel, enter the units name for the scaled series and enter ascaled value in the Scaled box to correspond with the number in the Raw box. These numbersestablish the relationship between the raw and scaled values.5. In the Resultant Series Name field, keep the default name or type a new one.6. Type any User Notes concerning the series you are creating (optional).7. Click the Create New Series button.8. If you ran the assistant from the Launch window, the Scaling button displays the number of newlycreated series. If using this assistant while plotting, the new series is listed and selected in the PlotSetup dialog. Click the Plot button to display the series.9. The scaled series will appear in the plot immediately or when you read out the logger if configuringthis at launch time. The settings for the scaled series are listed in the Details pane of the plot:After the plot is displayed, you may apply filters to the scaled series as you would for any other series in<strong>HOBOware</strong> Pro. In addition to the minimum, maximum, and average filters that are available for most series, thescaled pulse series allows you to create a new series showing totals over a period of time.Importing Text FilesNOTE: This feature is only available in <strong>HOBOware</strong> Pro.You may graph non‐<strong>HOBOware</strong> data by importing data from certain text files: You can easily open text files that were created by Onset’s Alarm & Readout Tool version 2.0 orhigher.<strong>HOBOware</strong> User’s <strong>Guide</strong> 108
Steps You can also open text files that were exported from Onset's BoxCar Pro 4.3 software, using thedefault BoxCar export settings. This allows you to view data from Onset loggers that cannot bereadout using <strong>HOBOware</strong> Pro. With some adjustments, you can open text files that were exported from other software. You can alsobuild text files from scratch, using historical or other types of information.To import data from a properly formatted text file:1. From the File menu, choose Import Text Data.2. Select a text file (.txt) and click Open.3. If the text file was created by the Alarm & Readout Tool, skip ahead to step 8.Otherwise, <strong>HOBOware</strong> Pro attempts to parse the text file and displays the Text Import Informationwindow. To conserve system resources, it displays only the first several records in the file, not theentire contents.4. Look at the data in the Delimiter Preview area to be sure that the date, time, and data columnswere separated correctly. If they were not, use the Data Separator, Date/Time Separator, and Decimal Separatorpull down menus to choose other delimiters until the data looks correct. You can resize the columns by clicking and dragging the dividers between the column headers. For text files that were not exported in BoxCar's default format, click the Edit Date/TimeFormat button and ensure that the import function is interpreting incoming date, time, andyear formats and separators correctly. Use the current date and time displayed in the Samplepanel as a guide. Make changes as needed, then click OK.5. When the Delimiter Preview is correct, click OK.6. Depending on the file's contents, the Plot Setup window may be displayed at this time. If so, skipahead to step 8.Otherwise, the Text File Information window is displayed. This window allows you to add optionalinformation and change units, if needed.7. Click OK. Enter a Description, which will become the plot title and be included in the Detailspane. Select a Model from the list. If you select Other/3rd Party, you can enter a description(up to 20 characters) of the logger or other data source in the next field. Enter the logger's Serial Number, if applicable. In the Channel Parameters box, verify that the units are correct for the data in thefile.8. The Plot Setup window is displayed. Select the series you wish to view in the plot. You also have theoption of changing the times on the plot to a different time zone.9. When you have made your selections, click the Plot button. The plot is displayed. You may want tosave your work in a project (.hproj) file for quick viewing later.<strong>HOBOware</strong> User’s <strong>Guide</strong> 109
Import Text Files RequirementsWhen you import a text file, the file must meet certain requirements. You can view or edit text files in a text editoror word processor. To delete, rearrange, or reformat columns of data, you may need to use a spreadsheetprogram. Remember to save the corrected file in text (.txt) format. This feature is only available in <strong>HOBOware</strong> Pro.Serial NumberThe file can contain an optional header for serial number information located at the beginning of the file, beforethe column headings. The header must have the phrase "Serial Number:" followed by a space, then the serialnumber, then two dashes:Serial Number: 733329 ‐‐Note: Text files originating from HOBOlink and the Alarms & Readouts Tool may also contain YAML headers at thetop of the file.ContentsBelow the header (if any), there should be the data, starting with column headings. There must be no other text inthe file other than the optional header, column headings, and data. The first column must be date, the next mustbe time, and the rest must be data.DelimitersValid delimiters for separating date and time are space, comma, tab, and semicolon. Valid delimiters for separatingother data are comma, tab, and semicolon. The delimiter used to separate the date from the time may be differentfrom the delimiter used to separate the data.DateThe date column must have the heading, "Date" and date values should be formatted as mm/dd/yy. If they are in adifferent format, remember to indicate the correct format in the Edit Date/Time Format window when you importthe file.TimeDate12/31/0412/31/0401/01/0501/01/05The time column must have the heading, "Time" and time values should be formatted in 24‐hour format ashh:mm:ss.sss (decimals are optional). If they are in a different format, remember to indicate the correct format inthe Edit Date/Time Format window when you import the file. UTC offset is assumed to be the same as yourcomputer's current time zone.Time23:59:5923:59:59.500:00:0000:00:00.5 No thousands separator can be used. Rows of data must be separated with a paragraph return.<strong>HOBOware</strong> User’s <strong>Guide</strong> 110
MeasurementsData column headings must have the format "Measurement (Units)". Additional information (such as channelnumber or serial number) can follow, but is optional. Only spaces can be used between the end of themeasurement name and the opening parenthesis. An example is "RH (%)".RH (%)38.738.939.039.0If the column header and units of an imported series exactly matches the text in the table below, <strong>HOBOware</strong> willrecognize the measurement and be able to perform unit conversions, apply data assistants, etc. to that series.Measurements listed below that either have only one unit type, or can be any unit type, cannot have their unitsconverted, but may still be used with applicable data assistants.Measurement Type Column Header UnitsAcceleration x accel, y accel, z accel g, m/s2, ft/s2Carbon Dioxide co2 ppmConductivity low range, full range, high range µS/cm, mS/cmCounts counts [any units]Dew Point dew point F, CGust Speed gust speed m/s, km/hr, mph, knotsLeaf Wetness leaf wetness [any units]Light Intensity intensity lux, lum/ft2PAR par [any units]Pressure pres kPa, Pa, mbar, mm Hg, psi, in HgRain rain mm, inRelative Humidity rh %Salinity salinity pptSoil Moisture soil moisture [any units]Specific Conductance conductance µS/cm, mS/cmSum Vector sum vector g, m/s2, ft/s2Temperature temp F, CTilt x tilt, y tilt, z tilt deg, radWind Speed wind speed m/s, km/hr, mph, knotsWind Direction wind dir [any units]Measurements that are not listed in the table (or do not exactly match the text below) can be exported, butwithout any units conversions or use of Data Assistants.Air VelocityBatteryCompressed AirflowConductanceCurrent<strong>HOBOware</strong> User’s <strong>Guide</strong> 111
Gauge PressurePowerSolar RadiationTemperature for ThermocouplesWater FlowVolatile Organic CompoundVoltageAsynchronous Events/ReadingsStateRuntimeImporting Files from HOBOlinkNOTE: This feature is only available in <strong>HOBOware</strong> Pro.This feature allows you to import the current data file for a remote HOBO U30 Station from HOBOlink directly into<strong>HOBOware</strong> for analysis.To import a file from HOBOlink into <strong>HOBOware</strong>:1. Select File > Import Data File from HOBOlinkThe Import File from HOBOlink window appears.2. Enter the serial number of the HOBO U30 Serial Number3. Enter the Username and Password of the HOBOlink account.4. To have your log in information saved, select the Save this information box.5. To import the file, click Go.Exporting DataWhile <strong>HOBOware</strong> offers many tools for analyzing data, there may be instances where you need to export data foruse in other software. Refer to the following for exporting data and other related topics: Exporting Table Data Export Options (Multi File Format)<strong>HOBOware</strong> User’s <strong>Guide</strong> 112
Exporting Data in Classic (BoxCar Pro) Format Exporting Details Copying Points Data into Another Application Formatting the Date/Time Column in Excel The Bulk Export ToolExporting Table DataYou can export the data shown in the points table to a Microsoft Excel file or to a text file (.csv or .txt) forimporting into other applications. You can also export the data points gathered in a ZW wireless network via thePlot/Export Wireless Data window.To export data:1. From <strong>HOBOware</strong> files: Open a data or project file. Make sure the points table includes the series youwant to export. This might include series pasted from other datafiles or series derived through filtersor Data Assistants. Make any changes as necessary.From the Plot/Export Wireless Data window: Make the changes necessary to select the desired series andthen click the Export button. Skip to step 3.2. From the File menu, select Export Table Data or click the Export icon on the toolbar.3. To change the export settings, click the Preferences button . Make any changes to the settingsand then click OK in the Preferences window to return to the Export window.4. Select the series you wish to include in the exported file. Use the All and None buttons or thecheckboxes in the Select column to make your changes. Note: Only the series that are listed in thepoints table in a plotted <strong>HOBOware</strong> file or selected from the Plot/Export Wireless Data window areavailable to export from this window. To make additional series appear in this window, click Canceland go back to step 1.5. The data will be exported in the order displayed in the Export window. To change this sort order, clicka column header in the Export window. You can sort the Measurement, Units, S/N, and Label columnsin both ascending and descending order. To return to the original sort order, click the Restore Orderbutton .6. Click the Export button and then select where you want to save the file.<strong>HOBOware</strong> User’s <strong>Guide</strong> 113
7. Click Save. You can now open the exported file in Excel or another software application.Note: Multi File Export is an option available if you have a version of Excel older than 2007 or are exporting adatafile with more than 1,000,000 rows. See Export Options (Multi‐file Export) for more details.Export Options (Multi File Export)There is an option to break up an exported file into multiple files using the Multi File Export button. Use this optionif your version of Excel is earlier than 2007 or if the datafile contains more than 1,000,000 rows.In the Export options window:1. Select the number of rows you wish to include in each exported file.2. If you wish to change the default folder where the files will be saved, click the Choose button.Navigate to a different location and click Select.3. Back in the Export Options window, make any changes to the default filename prefix as desired. Asshown in the sample in the window, the name for the exported files will be "filename prefix PageX,"where "X" indicated the order of the file, starting with zero.4. Click Export. Open the files in Excel or another other software program.Exporting Data in Classic (BoxCar Pro) FormatBoxCar Pro is legacy software from Onset Computer. <strong>HOBOware</strong> includes a preference setting that allows you toexport and import data in a format compatible with Onset's Box Car Pro software. To change the exportpreferences to use settings compatible with BoxCar Pro:1. From the File menu in Windows or the <strong>HOBOware</strong> menu on Macintosh, select Preferences.2. Select the General category and then click Export Settings.3. Click the "Use classic export settings" button and then click OK.See Export Settings for details on all export preference settings.Exporting DetailsYou can export the information in the Details pane to a text file, which can be opened in any text editor orimported into numerous applications, such as Microsoft Word or Excel.To export details:1. Make sure the Details pane includes the series you want to export. This might include series pastedfrom other datafiles or series derived through filters or Data Assistants.2. From the File menu, select Export Details.3. Accept the default file name, or type a new name.4. Click Save.Copying Points Data into another ApplicationTo copy a series from one graph into another:1. Select the data in the Points Table.<strong>HOBOware</strong> User’s <strong>Guide</strong> 114
2. Copy DataWindows: press Ctrl CMac: press Command‐ C3. Open any text editor, word processor, or spreadsheet software.4. Paste the data into the other application.Windows: press Ctrl VMac: press Command‐VFields are delimited by tabs, and records are separated by paragraph returns.You can also copy the graph as a bitmap for pasting into other programs and documents. The graph must be visiblewhen you do this.With the graph visible, select Copy Graph to Clipboard from the Edit menu.Formatting the Date/Time Column in ExcelIn Excel, dates and times for each data point may initially appear as #######. Times also may not have secondslisted.StepsTo display the full date and time with seconds in Excel:1. Adjust the time column width so you can see the whole date and time.2. Select the time column from row 3 down.3. From the Format menu, click Cells.4. Select the Custom category and then select m/d/yyyy h:mm as the type.5. Add ":ss" (or ":ss.000" if you used a fast logging interval) to the end of the string in the Type field:6. Click OK.m/d/yyyy h:mm:ss (normal logging interval)m/d/yyyy h:mm:ss.000 (fast logging interval)The seconds should be listed automatically.To export the date and time in separate columns go to Preferences> General > Export Settings and enable the Dateand time format: Separate into two columns.The Bulk Export ToolThe Bulk Export Tool is a plug‐in tool for <strong>HOBOware</strong> Pro that exports <strong>HOBOware</strong> files to text or Microsoft Excelformat for use in other programs. This tool is particularly helpful when you need to export multiple files at once.With the Bulk Export Tool, you can export the following file types:• .hobo• .dtf• .hsec<strong>HOBOware</strong> User’s <strong>Guide</strong> 115
• .dsecAny naming conflicts are automatically resolved to prevent overwriting any pre‐existing files. A log summarizingthe export results is saved in the same directory as the newly exported files.The Bulk Export Tool uses the general export settings for <strong>HOBOware</strong> Pro. To configure the Export Settings, go tothe File menu in Windows or the <strong>HOBOware</strong> menu in Macintosh and select Preferences. In the General category,select Export Settings.Using the Bulk Export ToolTo export files with the Bulk Export Tool:1. From the Tools menu, select Bulk File Export and then Select Files to Export ...2. In the Select Files to Export dialog, select the files you wish to export and click Continue.3. In the Choose Exports Folder dialog, navigate to the directory where you want the files to be exportedand click Export.4. A progress bar indicates the status of the export (if this happens very quickly, you may not see thebar). A message appears when the export is complete. Click OK.The exported files are saved to the specified directory.<strong>HOBOware</strong> User’s <strong>Guide</strong> 116
The native file extension is removed and appended with the file type selected in the export preferences (.txt, .csv,or .xls). For example, if the Export File Type preference is set to Excel, then foo.hobo is renamed foo.xls. If a filename already exists, new files will be appended with "_0", "_1" etc. For example:foo.xlsfoo_0.xlsfoo_1.xlsA log file showing the result of each exported file is also saved to the same directory. The log file lists either thesuccessful export with the resulting file names or an error message if there was a problem. The log file has the dateand time of the export in its file name like this:Export______.logImportant: The Bulk Export Tool will not export files properly if the "Show export dialog" setting is selected in theexport preferences. To disable this setting, select Preferences from the File menu in Windows or the <strong>HOBOware</strong>menu in Macintosh. In the General category, select Export Settings. Make sure "Show multi‐file export dialog" isnot selected. Even if the "Automatically export table data upon readout of logger" option is disabled, the "Showexport dialog” must not be selected for the Bulk Export Tool to export files properly. Your preferences must looklike this:or this:but not like this:for files to export correctly.YAMLYou can choose to have YAML ("YAML Ain't a Markup Language") headers added to the exported files (they are notinserted by default). If enabled, YAML headers are inserted at the front end of the file. You can remove the YAMLheader using any text editor.YAML (rhymes with “camel”) is a human‐friendly, cross language; Unicode based data serialization languagedesigned around the common native data structures of agile programming languages. For more information seeyaml.org.<strong>HOBOware</strong> User’s <strong>Guide</strong> 117
To enable YAML headers:1. Go to the File menu in Windows or the <strong>HOBOware</strong> menu in Macintosh and select Preferences.2. Scroll down to the Bulk Export category and select YAML.3. Check the Export with YAML Headers box.Working in Secure Mode: 21 CFR Part 11 ComplianceYou can create secure files in <strong>HOBOware</strong> Pro to comply with 21 CFR Part 11, or simply to add a level of securitywhen working with datafiles. When Secure Mode is enabled, <strong>HOBOware</strong> Pro begins an audit trail in the loggerwhen you launch it, and adds an encoded digital signature to the new datafile when you read it out.A digitally signed file, or "secure file," has a filename extension of .hsec (for most U‐Series loggers) or .dsec (forstation‐type loggers).NOTE: Issues may arise if you do not always use <strong>HOBOware</strong> Pro in the Secure Mode, if you sometimes use<strong>HOBOware</strong> Lite, or if you sometimes use a version of <strong>HOBOware</strong> prior to 2.3.0. See Security Mode Issues.Enabling Secure Mode (<strong>HOBOware</strong> Pro Only)Secure Mode must be enabled to create a secure file.NOTE: Project (.hproj) and export files are not secure, even if you create them from secure files.To enable Secure mode:1. Go to Preferences > General.2. Select Enable Secure Mode.When Secure mode is enabled, a padlock iconwindow.appears in the lower right corner of the main <strong>HOBOware</strong> ProOpening a Secure FileSecure files can be opened with <strong>HOBOware</strong> Pro 2.3.0 or greater. You can open .hsec files only with <strong>HOBOware</strong> Lite2.3.0 or greater.Every time you open a secure file – even when you are not in Secure mode – <strong>HOBOware</strong> verifies the encodeddigital signature to detect whether the file has been corrupted or tampered with. If even one bit of the data has<strong>HOBOware</strong> User’s <strong>Guide</strong> 118
changed since readout, a warning message will appear when you open the file, and none of the series will bemarked as verified.The padlock iconappears in the legend next to the series that were verified as original data.In the Details pane, audit trail information is displayed under the Data Verification node for each series. <strong>HOBOware</strong>Pro automatically obtains the Launch User and Readout User names from your computer's operating system. Tosave the Launch User name, you must have Secure Mode enabled when you launch the logger.Verification Series that were created by filtering are not verified. Series that were created as a result of user input after readout, such as running a data assistant orentering a constant temperature value for pressure or humidity, are not verified. Series retain their verification status (and padlock icon) when copied and pasted into other plots.Verification FailureIf <strong>HOBOware</strong> cannot verify the digital signature when you open a file, it will display a message that verification hasfailed. This means that the file has been altered or become corrupted since it was originally saved. It will offer todisplay the plot if possible, but will not display the padlock icon in the legend or provide signing details in theDetails pane. You will still be able to perform typical <strong>HOBOware</strong> functions on the file.Security Mode IssuesIssues may arise if you do not always use <strong>HOBOware</strong> Pro in Secure mode, if you sometimes use <strong>HOBOware</strong> Lite, orif you sometimes use a version of <strong>HOBOware</strong> prior to 2.3.0.Depending on the type of logger, the version of <strong>HOBOware</strong> that launched the logger, and the version of<strong>HOBOware</strong> that reads out the logger, the resulting datafile may not be compatible with versions of <strong>HOBOware</strong>prior to 2.3.0, or you may not be able to read out the logger at all. Launch non‐Secure (any version of <strong>HOBOware</strong>)Readout non‐Secure (any version of <strong>HOBOware</strong>)A backward‐compatible datafile (.hobo or .dtf) is created. Launch non‐Secure (any version of <strong>HOBOware</strong>)Readout in Secure modeA secure file (.hsec or .dsec) is created with an audit trail that lists the readout user, but not thelaunch user. Secure files are not backward‐compatible. Launch in Secure mode;Readout in pre‐2.3 version of <strong>HOBOware</strong>Most U‐Series loggers: The logger cannot be read out.Station‐type loggers: A backward‐compatible datafile (.dtf) is created. Launch in Secure mode;Readout non‐Secure in <strong>HOBOware</strong> 2.3Most U‐Series loggers: A datafile (.hobo) is created, but it is not backward‐compatible.Station‐type loggers: A backward‐compatible datafile (.dtf) is created. Launch in Secure mode;Readout in Secure modeA secure file (.hsec or .dsec) is created with a full audit trail. Secure files are not backward‐compatible.<strong>HOBOware</strong> User’s <strong>Guide</strong> 119
Chapter 4: Other Hardware<strong>HOBOware</strong> supports several devices in addition to loggers: HOBO U30 Station FlexSmart Modules Shuttle Compact Power and Energy Meter DO sensor cap for the HOBO Dissolved Oxygen loggerWorking with the HOBO U30 Station (<strong>HOBOware</strong> Pro Only)The HOBO U30 Station is designed primarily for use with HOBOlink which allows for continuous logging andtransmission of data using mobile network technology. There are, however, some features that are only accessiblethrough <strong>HOBOware</strong> Pro, and some recommended guidelines for using <strong>HOBOware</strong> Pro.Overriding HOBOlinkIf you attempt to launch, read out, or check that status of the HOBO U30 Station using <strong>HOBOware</strong> Pro, you maysee a message indicating there is already a live HOBOlink session underway. You can choose to override theHOBOlink connection and use <strong>HOBOware</strong> Pro instead.Alternatively, you may see a message indicating the HOBO U30 Station is busy and a <strong>HOBOware</strong> Pro session cannotbegin. Try again in a few minutes.The readout configuration you define in HOBOlink sets up how frequently the HOBO U30 Station will connect toHOBOlink. For example, if you set a connection interval for 4 hours then the HOBO U30 Station will contactHOBOlink automatically every 4 hours.There may be circumstances in which you want to override this schedule and contact HOBOlink immediately. Forexample, you moved the HOBO U30 Station to a different location and you want to make sure it can still connectto HOBOlink, but you don’t want to wait four hours until the next connection. Click the Contact HOBOlink button inthe Status window to force an immediate connection.Which Software to UseThe following table details when to use <strong>HOBOware</strong> Pro instead of HOBOlink.LaunchingIt is strongly recommended that launching be done exclusively through HOBOlink. Any launch that you haveconfigured with HOBOlink will override the launch parameters set with <strong>HOBOware</strong> Pro.Reading outReadouts are done automatically on a schedule that you set with HOBOlink. Use <strong>HOBOware</strong> Pro to read out only ifyou are conducting a test or if you need an immediate readout.Checking status and signal strengthCheck HOBOlink for the latest data, current status, and alarm information.<strong>HOBOware</strong> User’s <strong>Guide</strong> 120
Open the Status window in <strong>HOBOware</strong> Pro if you wish to check how powerful the cellular signal for the HOBO U30Station in the current location. This will help you determine if you need to reposition the station for optimal signalstrength.Configuring the Analog Sensor PortThis can only be done in <strong>HOBOware</strong> Pro and is accessed through the Launch window. See Configuring FlexSmartModules and Analog Sensor Ports for details.Changing the default relay setting or testing the relayThe default relay setting for the HOBO U30 Station is normally open, and can only be changed in <strong>HOBOware</strong> Pro.You can also use <strong>HOBOware</strong> Pro to test the relay.See Controlling the Relay on the U30 Station for details.Use HOBOlink to set up individual alarms.Testing individual Smart SensorsUse <strong>HOBOware</strong> Pro to test the accuracy of individual Smart Sensors.When the HOBO U30 Station is not logging,1. Unplug all Smart Sensors.2. Plug one Smart Sensor back in.3. Check the current reading for the sensor in the <strong>HOBOware</strong> Pro launch window.4. Repeat with the remaining Smart Sensors.Note: Sensors are listed in ascending order by serial number, regardless of their physical position in the logger.Additional plotting and analysis of datafilesHOBOlink displays data read‐out from the HOBO U30 Station in line graphs and shows the readings from the lastconnection. The data is also saved in a datafile that can be downloaded and saved to your computer. You can thenopen the datafile in <strong>HOBOware</strong> Pro and view and plot the data in different ways.Controlling the Relay on the HOBO U30 Station (<strong>HOBOware</strong> Pro Only)NOTE: You can only configure the relay on the HOBO U30 Station using <strong>HOBOware</strong> Pro.The HOBO U30 Station has a built‐in, system‐wide relay. The default setting is deactivated (open).StepsTo change the relay:1. Connect the HOBO U30 Station to the computer with the USB cable.2. From the Device menu, select Manage U30.3. Select Control U30 Relay.4. Select Set default (deactivated) state.5. Select either Open or Closed.Testing the RelayTo conduct an immediate test of the relay:<strong>HOBOware</strong> User’s <strong>Guide</strong> 121
1. Connect the HOBO U30 Station to the computer with the USB cable.2. From the Device menu, select Manage U30.3. Select Control U30 Relay.4. Select Activate (close) relay. You should hear a click in the HOBO U30 Station.4. Select Deactivate (open) relay. You should hear the click again.Use HOBOlink to configure alarms for individual sensors, low battery, and low memory.Changing the State of the U30 Relay ContactThe U30 relay contact is a latching relay that can be configured as either Normally Open or Normally Closed. Thefactory‐default setting is Normally Open. You can change the default relay settings in the Sensor Alarms window in<strong>HOBOware</strong>.StepsThis procedure assumes the U30 Station is connected to a computer running <strong>HOBOware</strong>.1. From the Device menu, select Manage U30.2. Select Configure U30 Alarms and then select Configure Alarms to open the Sensor Alarms window,3. In the Relay Contacts section, select Normally Open or Normally Closed.Alternate Method: From the Device menu, select Manage U30 > Control U30 Relay > Set default(deactivated) state and then select either Open or Closed.3. If you are setting an Alarm Action of Pulse Relay, you can set the Relay Pulse Width. The default is1 s.4. Click Set to send the alarm configuration to the U30 Station.5. To test the relay, click the Close Relay or Open Relay button (button that appears depends on whichstate the relay is in). You should hear a click in the HOBO U30 Station. Click the button again to returnto the default state. Use a digital multimeter to check for continuity to confirm that the relay isopened and closed as expected.Alternate Method: From the Device menu, select Manage U30 > Control U30 Relay > Activate Relay, thenselect Deactivate Relay.<strong>HOBOware</strong> User’s <strong>Guide</strong> 122
The Alarms Window for the U30/NRCThis topic describes the Alarms window for the HOBO U30/NRC. Use the Alarms window to add, edit, or removeU30/NRC alarms.1. ChannelsThis section includes all of the channels that support alarms. Select a channel and click Add to configurean alarm.2. Alarms: This section includes all of the alarms that have been configured.3. Relay ContactsSelect if the relay is Normally Open or Normally Closed. This only applies if the Alarm Action (configured inthe Alarm Configuration window) is set to Activate Relay or Deactivate Relay.4. Close RelayTo test the relay alarm function, click the Close Relay/Open Relay button.5. Click Help to open the Help topic for this window.6. Click Add to open the Alarm Configuration window and configure an alarm.7. Click Edit to open the Alarm Configuration window and edit an existing alarm.8. Click Remove to remove the selected alarm.9. Relay Pulse WidthThis sets the duration of the Relay Pulse when the Alarm Action is set to Pulse Relay. The default is 1second.10. Click Set to send the alarm configuration to the logger.11. Click Cancel to cancel any entries you have made and return to the Launch window.<strong>HOBOware</strong> User’s <strong>Guide</strong> 123
The Alarm Configuration Window for the U30/NRCUse Alarm Configuration window to configure alarm thresholds and actions for the U30/NRC. You access thiswindow from the Alarms window.1. Alarm ValuesSet the Alarm high/low threshold and the number of samples.Select the check box for the High Alarm and/or the Low Alarm. Enter an alarm in the box(es) or use thesliders. If you enter values manually, the software may adjust them slightly to the nearest valuessupported by the logger.If only a high value is entered, the alarm will trigger if the reading exceeds that value. If only a low value isentered, the alarm will trigger if the reading is below that value. If both high and low are entered, thealarm will trigger if the reading falls outside of that range.You can also set the number of samples that must be displayed before the alarm will be triggered. Thesample period is whatever you have configured as the sample rate on the logger.Note: To avoid unintended activation of the relay contact, set the number of samples to allow foranticipated breaches of the alarm threshold. If the measurement is still out of range when the number ofsamples is reached, the relay contact will be activated.2. Alarm ActionSelect an action to occur when the alarm is triggered: Activate Relay (Open/Close), Deactivate, Pulse,Toggle, Open, Close.By default, the relay is deactivated when the alarm clears. To disable this, uncheck the box next toDeactivate on Alarm Clearing.3. Click Help to open the Help for this window.4. Number of Samples: See Alarm Values above.5. OK to return to the Alarms window.6. Click Cancel to cancel all entries and return to the Alarms window.<strong>HOBOware</strong> User’s <strong>Guide</strong> 124
Configuring FlexSmart Modules/Analog Sensor PortsThis topic describes how to configure an analog sensor port on the HOBO U30 Station or a FlexSmart module in theHOBO Energy Logger.NOTE: Analog Module/Port Configuration is only available in <strong>HOBOware</strong> Pro.OverviewThe HOBO Energy Logger is compatible with Onset smart sensors and FlexSmart modules. The HOBO U30 Stationuses smart sensors and an optional analog sensor port. FlexSmart modules and the analog sensor port are userconfigurableto accommodate a wide range of Onset and third‐party sensors. To take advantage of thisadaptability, <strong>HOBOware</strong> Pro lets you configure these modules/ports at launch time, or create and save differentconfigurations to be loaded into the modules/ports whenever needed. Note: Sensors are listed in ascending orderby serial number, regardless of their physical position in the logger.StepsNOTE: This procedure is for creating a new configuration and sending it to a port. To send an already savedconfiguration to a port, see Loading a Saved Configuration (page 1).To configure an analog module or port, perform the following steps:1. From the Launch window click the Configure button (or from the Device menu, choose ConfigureModules/Ports).If the logger is already logging, you will be warned that the logger will have to be stopped first.The Select Channel to Configure window will appear showing all configurable Analog Sensors attached to thelogger sorted by serial number in ascending order.If you are using the HOBO Energy Logger, you can attach additional modules while viewing this window. whendone, click Refresh to update the module list.2. Click on the + sign to expand the entry and show the channels.Each channel in the module is defined by its channel number (the physical order in the module), the configuredchannel name, and any location (assigned at launch) defined for this channel in the logger.NOTE: The default channel names Voltage and Current are just place holders and either channel can be configuredto measure voltage or current. For example, both channels can be used to monitor sensors with 4‐20 mA output.3. Select a channel name and then click the Configure button to open the Channel Configurationwindow.NOTE: You can also access the Channel Configuration window from the Launch window. In the Channelsto Log section, double‐click the module/port name to expand it, click the channel name to select it, andclick the Configure button.The Configure Channel window appears.<strong>HOBOware</strong> User’s <strong>Guide</strong> 125
4. Change any relevant configurable parameters:5. Save the Configuration (Optional).You do not have to save the configuration if you are going to send it to the module/port right away, butyou may find it convenient to save the configuration for future use, especially if you have defined customsensor settings.To save this configuration for future use with any module/port of the same type, click Save, enter a namefor the file and click Save.By default, the file is saved to the following location with an extension of .hcfg.Windows: My Documents\<strong>HOBOware</strong>\ConfigsMac: Users//Library/Application Support/<strong>HOBOware</strong>/Configs6. To send the currently displayed configuration to the module/port, click Configure.The module will remain in this configuration until you send it a different configuration.The Configure Channel WindowThis topic describes the elements in the Configure Channel window.Channel InfoModule NameFlexSmart module model and description.Firmware VersionVersion number of the module's firmware.Serial NumberSerial number of the module.Channel NumberPhysical order of the channel in the module, starting at 1.<strong>HOBOware</strong> User’s <strong>Guide</strong> 126
Channel NameDescription, up to 16 characters, of the physical property this sensor will measure. For example, if the externalsensor attached to this channel was a flow meter, you could specify Flow rate as the measured property. Chooseone of the predefined names from the pull‐down menu, or choose Custom to display a dialog that allows you todefine a new name.If you check the Save this value for next time box, the name will be added to the Channel Name pull‐down menuso that it can be selected in the future when using the same type of module. Saved names are stored aspreferences, and are removed when you restore preference defaults.Excitation PowerSome modules can supply power to attached sensors using the logger's battery. Click the Set Excitation Powerbutton to display the Excitation Power dialog. Check the Excitation Power Used box to enable excitation powerand then select the mode. See Configuring Excitation Power on page 129.Measurement TypeNative measurement recorded by the module, if applicable. Some modules have multiple types of nativemeasurements. For example, the FlexSmart Analog module can measure either current or voltage. If your moduleoffers more than one type of input, select the correct one for your sensor.Scaling ParametersSee Setting Scaling Parameters on page 127.Setting Voltage Ranges and Scaling ParametersThis topic describes the settings for the scaling parameters section of the Configure Channel pane.RawUnits:This is the type of output the sensor has; either V or mA, corresponding to the type of sensor selected. Raw Value1 and Raw Value 2 should be input in these units. For example, if the external sensor has an output of 4 – 20 mA,the raw units would be in mA.Value 1The low raw value given by the external sensor. In the previous example, this would be 4 mA.<strong>HOBOware</strong> User’s <strong>Guide</strong> 127
Value 2The high raw value given by the external sensor. In the previous example, this would be 20 mA. Raw Value 2 mustalways be greater than Raw Value 1.Important: The number entered for Raw Value 2 determines the voltage range the analog port will use. Use thistable to determine what the range will be depending on the number entered in the Value 2 field.ScaledUnitsIf the raw voltage entered inthe Value 2 field is:The voltage range forthe analog port will be:Less than 2.5 2.5VGreater than 2.5 and less than orequal to 5Greater than 5 and less than orequal to 10Greater than 10 and less than orequal to 20Choose one of the predefined units from the pull‐down list, or choose Custom to define units for other types ofsensors. See Custom Units below.Value 1The value you will see on the graph when the sensor reports a raw value equal to Raw Value 1. This value shouldbe entered in the same units that are specified in the Scaled Units box.Value 2The value you will see on the graph when the sensor reports a raw value equal to Raw Value 2. This value shouldbe entered in the same units that are specified in the Scaled Units box.Custom UnitsIf you select Custom in the Scaled Units drop‐down list, the following window appears.5V10V20VEnter a description up to eight characters of the units associated with the physical property to be measured. Forexample, if the sensor attached to this channel was a flow meter that measured flow rate, you could specify CFS(Cubic Feet per Second) as the scaled unit. If you want to see data in particular SI or US units, you need to enterthe appropriate scaling values and units here.Custom units do not allow for conversion between SI to US units. It is only a reference used to indicate how themodule is configured and how the resulting data should be labeled.Check the Save this value for next time box to have this unit name added to the Scaled Units drop‐down list sothat it can be selected in the future when using the same type of module.Custom unit names are removed when you restore preference defaults.Click OK to return to the Configure Channel window.<strong>HOBOware</strong> User’s <strong>Guide</strong> 128
Configuring Excitation PowerNOTE: Analog Sensor Port Configuration is only available with <strong>HOBOware</strong> Pro.DescriptionYou can configure sensor excitation power and warm up on the Analog Sensor Ports. Sensor excitation is a voltageoutput provided by the HOBO U30 Station to power a sensor that is connected to it. This power may be neededbecause the sensor is not self‐powered, or because the sensor’s power capacity cannot support a longdeployment.When sensor excitation is required, the logger can provide 12 V DC sensor excitation voltage up to 200 mA total fortransducers that require external power for proper operation. The excitation voltage has a programmable warm uptime and is controlled by the Analog Sensor Port.A warm up time can be up to 120 seconds. If the warm up required is longer than 120 seconds, or if you are notconcerned with battery life, you may choose the Continuous option, which will power the sensor for the entiredeployment. Then click OK to return to the Configure Channel window.Battery LifeProviding excitation power drastically decreases the logger's battery life. (Consult the logger manual for moreinformation.) In order to save battery power, you may specify the minimum time needed to power the sensorbefore taking a measurement. For example, if you specify a Warm Up of one second and set the logging interval inthe logger to one minute, the logger will power the external sensor for one second, log data and then turn off theexcitation power for the next 59 seconds.Always enable the logger's internal battery channel when logging with excitation power. If the battery becomestoo low to provide excitation power, excitation power is turned off, but logging continues as long as the batterycan power the logger. This will cause the further readings on that channel to become inaccurate. If you are loggingthe internal battery channel when this happens, an Excitation Off event will be shown in your datafile to mark thepoint at which excitation power was disabled.ConfigurationYou configure Excitation Power from the Configure Channel window.1. Click on the Set Excitation Power button to open the Excitation Power window.<strong>HOBOware</strong> User’s <strong>Guide</strong> 129
ModesWarm up2. Check off the Excitation Power Used box.3. Select the Mode.4. Click OK.a. If the Mode is Warm Up , select the warm up time in seconds.When in Warm up Mode the logger supplies excitation power for a brief, user‐programmable period prior to eachmeasurement. This mode allows you to select the minimum warm up time needed to allow for sensor stabilization,while conserving battery power.For example, if you specify a warm up of one second and set the Logging Interval to one minute, the HOBO U30Station will power the external sensor for one second, log a measurement, and then turn off the excitation powerfor the next 59 seconds. The warm up time can be up to 120 seconds.If the warm up time selected is greater than the logging interval selected, the logger will interpret the excitationmode as continuous.ContinuousWhen in Continuous Mode the logger supplies constant excitation power to the sensor for the entire duration ofthe deployment. This mode will result in reduced battery life. Continuous mode is required if the sensor needsmore than two minutes of warm up time.The Analog Sensor Ports begin functioning when logging begins. When the ports are functioning correctly, theActive indicator LED on the port blinks once per logging interval to indicate that a successful measurement hasbeen made. The Ex. On indicator LED will also be lit when excitation is enabled.Loading a Saved ConfigurationNOTE: Analog Sensor Configuration is only supported with <strong>HOBOware</strong> Pro.Once you have created and saved a sensor configuration, you can load it into any module/port of the same type.For example, a configuration for a FlexSmart TRMS module can be loaded into any other FlexSmart TRMS module,but not into a FlexSmart Analog module.Steps1. From the Device menu, choose Configure Modules/Ports.2. Click the Load button.The resulting dialog lists all defined configurations in the currently selected folder that are compatible with themodule/port.3. Choose a configuration:If you are experiencing problems with the module, you can reset the channel to its default configuration. SelectUse Default Module Configuration, then click Continue.To use one of the defined configurations, click the button next to Use Configuration File, then click the button nextto the name of the configuration file you want to use. Then click Continue.4. To send the currently displayed configuration to the module/port, click Configure.<strong>HOBOware</strong> User’s <strong>Guide</strong> 130
The module/port will remain in this configuration until you send a different configuration to it.Resetting a Module to the Default ConfigurationIf you are experiencing problems with a module, you can reset it to the default configuration.Steps1. From the Device menu, choose Configure Modules/Ports.2. In the Select Channel to Configure window, select a channel and click Configure.3. In the Configure Channel window, click the Load button.The Load Configuration window appears. This lists all defined configurations in the currently selectedfolder that are compatible with the module/port.4. Choose a configuration.To use one of the previously saved configurations, click the button next to Use Configuration File, thenclick the button next to the name of the configuration file you want to use.To get a file from a different location, click on Choose Folder and browse to the desired directory.NOTE: If you are experiencing problems with the module, you can reset the channel to its defaultconfiguration by selecting Use Default Module Configuration, then click Continue.5. Click Continue.This will take you back to the Configure Channel window.6. To send the currently displayed configuration to the module/port, click Configure.The module/port will remain in this configuration until you send a different configuration to it.Default Module ConfigurationsThe following screen shots show the default configuration for the analog modules. The configuration is the samefor both channels.<strong>HOBOware</strong> User’s <strong>Guide</strong> 131
Working with a Shuttle (<strong>HOBOware</strong> Pro Only)NOTE: HOBO Shuttles require <strong>HOBOware</strong> Pro.HOBO shuttles provide a convenient way to read out and relaunch loggers in the field. The HOBO U‐Shuttlefeatures a text display and is compatible with all loggers that can be used with <strong>HOBOware</strong> Pro. The HOBOWaterproof Shuttle communicates with <strong>HOBOware</strong>‐compatible optic loggers.NOTE: To use a U‐Series logger (other than the HOBO U30 Station) with a shuttle, the logger must first be launchedwith <strong>HOBOware</strong> version 2.2 or higher at least once. Consult the shuttle user guide for details.<strong>HOBOware</strong> Pro allows you to launch these shuttles, collect logger data in the field, and offload the datafiles fromthem. Shuttle Management window Offloading Files from a Shuttle Saving Files from a Shuttle Deleting shuttle filesFor detailed instructions refer to the user guide that came with your shuttle.Shuttle StatusTo check the shuttle status, go to the Shuttle Management window.U‐Shuttle Firmware UpdatesOccasionally, a firmware update may be available for the U‐Shuttle. To check whether an update is available or ifyou are directed to update the firmware from Onset Technical Support:1. Connect the U‐Shuttle to the computer.2. From the Help menu, select Update Device Firmware and then select U‐DT‐1/U‐DT‐2 from thesubmenu.3. Follow the instructions on the screen to complete the upgrade process.The Shuttle Management WindowThis topic describes the fields in the Shuttle Management window for the U‐Shuttle and Waterproof Shuttle.NOTE: You can only offload HOBO Shuttles using <strong>HOBOware</strong> Pro.U‐Shuttle Battery LifeWhile the Shuttle Management window is displayed, the U‐Shuttle remains on battery power for up to an hour.After one hour, or any time the U‐Shuttle's main battery level becomes low, the window closes and the shuttlepowers down. To further conserve the shuttle's battery life, you should close the window, disconnect the shuttle,and turn the shuttle off as soon as you finish working with it.The Waterproof Shuttle is powered by the USB port, and does not need to be turned off.<strong>HOBOware</strong> User’s <strong>Guide</strong> 132
1. Device DetailsDevice Type: Shuttle model and description.Serial Number: Serial number of the shuttle.Firmware Version: Version number of the shuttle's firmware.Main Batt Level (AA)(U‐Shuttle only)Condition of the shuttle's main batteries. Consult the U‐Shuttle <strong>User's</strong> <strong>Guide</strong> for specifics on batterycapacity.Clock Batt Level (CR1225) (U‐Shuttle only)Condition of the battery that provides backup power to the shuttle's clock. Consult the U‐Shuttle<strong>User's</strong> <strong>Guide</strong> for details.Battery Level (Waterproof Shuttle only)Condition of the shuttle's batteries when you opened the Waterproof Shuttle Management window.If the batteries are low, remember to change them before going into the field. Consult theWaterproof Shuttle <strong>User's</strong> <strong>Guide</strong> for specifics on battery capacity.Last LaunchedDate, time, and offset to Greenwich Mean Time (GMT, also known as UTC) when the shuttle was lastlaunched.Computer Clock: Time reported by the computer's clock.Shuttle ClockStatus of the shuttle's clock in relation to the computer's clock. If the difference is more than fiveseconds, the shuttle clock label and icon will flash red. The shuttle's clock is synchronized to thecomputer when you launch the shuttle or press the Set Shuttle Clock button.2. Files on ShuttleThis panel lists the logger datafiles that are available to be offloaded from the shuttle. If the shuttleis empty, this will say "No Files Available on Shuttle."<strong>HOBOware</strong> User’s <strong>Guide</strong> 133
Status: Message that describes the state of the datafile on the shuttle. When <strong>HOBOware</strong> Pro isoffloading a file from the shuttle, the status message is replaced by a progress bar.For the U‐Shuttle only, the status message AWAITING OFFLOAD appears when <strong>HOBOware</strong> Pro isoffloading files from the shuttle, and FINISHED after each file is offloaded.For the Waterproof shuttle only, files have the status message OFFLOADED only if the file has beenoffloaded from the shuttle and saved as a datafile. If the file has not been offloaded, or it has beenoffloaded but not saved, its status is NOT OFFLOADED.Logger Type: Model and description of the logger that logged the data in this file.Serial No.: Serial number of the logger that logged the data in this file.Launch Desc.: Description entered when the logger was launched. This description will be the defaultdatafile name.Launch Time: Date, time, and offset to Greenwich Mean Time (GMT, also known as UTC) when theshuttle was last launched.File Size: Actual size of the datafile.3. Check All/Uncheck AllUse these buttons to check or uncheck all of the files on the shuttle to be offloaded.4. Synch Shuttle ClockClick this button to synchronize the shuttle's clock to the computer clock without launching theshuttle. (Exit <strong>HOBOware</strong> Pro if you need to update the computer's clock first.)Important: If the difference between the shuttle's clock and the computer's clock is more than 59minutes, the Set Shuttle Clock button is not available. You must launch the shuttle to correct thetime difference.5. Launch ShuttleClick this button to Launch the shuttle. Launching the shuttle will delete all datafiles and reset theshuttle's clock.Re‐Launching the shuttle also repairs a corrupted header.6. Offload CheckedClick this button to offload all checked files to the computer.Offloading and Saving Shuttle FilesNOTE: HOBO Shuttles require <strong>HOBOware</strong> Pro.To offload datafiles from a shuttle to a computer:1. Connect the shuttle to the computer.2. Choose Manage Shuttle from the Device menu.Alternate Method: To quickly offload all of the new datafiles that are on the shuttle, choose Readoutfrom the Device menu.3. Choose files to offload:<strong>HOBOware</strong> User’s <strong>Guide</strong> 134
U‐ShuttleAll files are selected by default if the shuttle has not been offloaded before. To uncheck all files, clickthe Uncheck All button. To uncheck individual files, click the checkbox next to each file.Waterproof ShuttleOnly the files that have not previously been offloaded and saved are selected by default. To check oruncheck individual files, click the checkbox next to each file. Use the Check All and Uncheck Allbuttons next to Previously Offloaded Files and New Files (Not Offloaded) to control the selection ofthese groups of files.To automatically delete files from a Waterproof Shuttle after you offload and save them, enable theDelete Contents Upon Offload option. Files will be automatically deleted only after you successfullysave them to the host computer.4. Offload FilesClick the Offload Checked button to begin offloading the datafiles.Once offloading begins, the Offload Checked button will change to Cancel Offload. When offloading iscomplete, the Files on Shuttle panel on the Shuttle Management window will change to a FilesOffloaded From Shuttle panel.You can now save the files to your computer. See Saving Files from a Shuttle 135.Saving Files from a ShuttleBefore you can save files, you must offload them from the shuttle. See Offloading Files from a Shuttle 134.Saving FilesThe illustration below shows the parts of the Shuttle Management window related to saving files.1. Save FolderThe default location for the save is indicated in the Save Folder box. To change to another location, click Chooseand browse to the location2. Automatically Open FilesTo have the folder automatically open on the desktop after the files are saved, check:Windows: Open Folder in Windows Explorer after Save.Mac: Open Folder in Finder after Save.3. Choose files to save.By default, all of the files you offloaded will be selected for saving.To uncheck individual files, click the checkbox next to each file.<strong>HOBOware</strong> User’s <strong>Guide</strong> 135
To uncheck all files, click the Uncheck All button.To save all files (if you have already unchecked a few), click the Check All button.4. Datafile NameEnter a new name if desired.5. Cancel SaveTo exit without saving any files, click Cancel Save.6. Save CheckedClick this button to save all checked files.The files are saved to the specified folder.Deleting Files from a ShuttleNOTE: HOBO Shuttles require <strong>HOBOware</strong> Pro.NOTE: If the Files Offloaded From Shuttle panel is displayed, you must save the offloaded files (or cancel withoutsaving) before deleting any files.Deleting Files from a U‐ShuttleTo delete all files from a U‐Shuttle, whether they have been offloaded and saved or not, click the Launch Shuttlebutton on the Shuttle Management window to launch the shuttle. You cannot delete individual files from a U‐Shuttle.NOTE: Because the shuttle's header information occupies 64 KB, 3.94 MB is the maximum amount of free memoryavailable on a U‐Shuttle.Launching also resets the shuttle's clock and its Last Launched time.Deleting Files from a Waterproof ShuttleTo automatically delete files after you offload and save them, enable the Delete Contents Upon Offload optionbefore clicking Offload Checked. Files will be automatically deleted only after you save them.To select specific files to delete, click the checkbox for each unwanted file on the Shuttle Management window. Toselect all of the files that have already been offloaded, click the Check All button next to Previously OffloadedFiles. Then click Delete Checked.To delete all files from a Waterproof Shuttle, whether they have been offloaded or not, click the Launch Shuttlebutton on the Shuttle Management window to launch the shuttle. This will also reset the shuttle's clock and itsLast Launched time.Configuring Loggers with the E50B2 Power & Energy MeterWhen the E50B2 Power & Energy Meter (T‐VER‐E50B2) is combined with a supported logger, there is a customsetting available to quickly configure the applicable channels or sensor types. To access this setting:1. Connect a logger to the computer that supports the meter, such as the HOBO 4‐Channel Pulse InputData Logger (UX120‐017x), and select Launch from the Device menu.2. In the Launch Logger window, select "for E50B2 Power & Energy Meter" in the Configure Sensorsdrop‐down list. The first three sensors, or data channels, listed will automatically be updated todisplay the appropriate settings for the E50B2 Power & Energy Meter as shown below.<strong>HOBOware</strong> User’s <strong>Guide</strong> 136
When these settings are selected, the logger will record the default values from the Onset Power Meter.This means that when you read out the logger, the first three data channels will record the following bydefault: Reactive energy, at a rate of 1 pulse equal to 1 VARh Real energy, at a rate of 1 pulse equal to 1 Wh Amp hours, at a rate of 1 pulse equal to 0.01 AhYou can change the scaling for these three channels. Click one of the channel or sensor buttons and selectthe measurement type, sensor name, and then scaling factor. The example below shows changing scalingon channel 2 after clicking the "T‐VER‐E50B2 Wh (1000 Wh per pulse)" button. Note: The scaling factormust be the same for VARh and Wh channels. WARNING: If you change the default scaling parameters,you must also change the settings on the Onset Power Meter. Similarly, if you change the scaling on thedevice itself, you must also change the scaling in the software to match. Refer to the Compact Power andEnergy Meter (T‐VER‐E50B2) Full Install <strong>Guide</strong> for details on how to change the settings on the device.<strong>HOBOware</strong> User’s <strong>Guide</strong> 137
3. Select any other Launch settings as desired and then click Start to launch the logger with the OnsetPower Meter settings (note that the Start button name changes depending on when you chose tobegin logging).Additional Series for Plot SetupDatafiles from a logger with Onset Power Meter settings not only list logged sensor data, but they also containadditional derived series automatically calculated in relevant units. <strong>HOBOware</strong> uses the logged data from each ofthe three enabled sensors (reactive energy, real energy, and amp hours) to derive, or calculate, up to six additionaldata series that you can plot. These derived series are numbers 9 through 14 in the Plot Setup dialog box examplebelow. Select the series you wish to view and then click Plot. These series are always available for plotting any timeyou open the datafile.<strong>HOBOware</strong> User’s <strong>Guide</strong> 138
The following table lists the calculations for all derived series. It also specifies which of the three Onset PowerMeter sensors/channels must be enabled at launch time for these series to be available upon readout.Derived SeriesNameCalculated ByRequires these Channel(s)to be Enabled at LaunchVAR VARh / (logging interval in seconds / 3600) Reactive Energy (VARh)VAVAh / (logging interval in seconds / 3600), where VAh= SQRT (Wh² + VARh²)Reactive Energy (VARh) andReal Energy (Wh)Volts (V) VAh / Ah, where VAh = SQRT (Wh² + VARh²) Reactive Energy (VARh) andAmp Hours (Ah)Power Factor (PF) Wh / VAh, where VAh = SQRT (Wh² + VARh²) Reactive Energy (VARh) andReal Energy (Wh)Power (W) Wh / (logging interval in seconds / 3600) Real Energy (Wh)Power (kW)Wh / (logging interval in seconds / 3600) / 1000 OR W/ 1000Real Energy (Wh)Amps (A) Ah / (logging interval in seconds / 3600) Amp Hours (Ah)Working with the HOBO U26 Dissolved Oxygen LoggerThe HOBO U26 Dissolved Oxygen logger has a replaceable DO sensor cap intended for six months of use plus aone‐month grace period. Once the cap is initialized, an internal clock within the logger will count down to theseven‐month expiration date.A new sensor cap can be initialized several ways:When the logger is launched, it will automatically be initialized when logging begins.You will be prompted to initialize it when checking the Status.You will be prompted to initialize it when using the Lab Calibration tool.If you replace an existing sensor cap while the logger is logging, it will automatically be initialized.Once the 7‐month countdown begins, you can see information about the sensor cap in the Status window asshown below.In the Device Details pane, three key DO sensor cap dates are displayed:Expiration date, at which time you'll need to replace it with a new cap. IMPORTANT: The logger will notcollect any data after the cap has expired.Initialization date, which is the date the cap was initialized and the date the 7‐month countdown began.Manufactured date; the cap has a shelf life and must be used within two years of this date.For details on installing or replacing the DO sensor cap, see the logger manual.<strong>HOBOware</strong> User’s <strong>Guide</strong> 139
Chapter 5: HOBOnode ManagerHOBOnode Manager is the software tool within <strong>HOBOware</strong> Pro for setting up and managing a ZW wireless datanetwork, which consists of a receiver, data nodes, and router nodes.For information about setting up a network, refer to the ZW Series Wireless Network Quick Start <strong>Guide</strong> availableon onsetcomp.com.For help with deploying a network in your facility, refer to the HOBO Data Node Deployment <strong>Guide</strong> also availableat onsetcomp.com.To open HOBOnode Manager for the first time, select the Device menu and choose Manage HOBO Data NodeNetwork.Notes about operating HOBOnode Manager: When HOBOnode Manager is open, two <strong>HOBOware</strong> icons appear in the Windows taskbar. You cannot access HOBOnode Manager if a <strong>HOBOware</strong> window, such as Logger Launch or Status, isopen. You can close HOBOnode Manager and leave <strong>HOBOware</strong> running, but you cannot close <strong>HOBOware</strong>and leave HOBOnode Manager running. If you close both HOBOnode Manager and <strong>HOBOware</strong>, devicecommunication can continue to run, which allows incoming data from the network to be uploaded tothe computer. A <strong>HOBOware</strong> icon appears in your system tray when device communication is running.Note that the next time you open HOBOnode Manager, it could take several minutes for the real‐timeplots to reflect all the stored data.To stop device communication, right‐click (or left‐click on a Mac) the system tray <strong>HOBOware</strong> icon toaccess the Device Communication menu, which shows the receiver status and has options for stoppingdevice communication and starting HOBOnode Manager. Device communication must be stopped whenupdating <strong>HOBOware</strong> software. An icon appears in the status bar at the bottom of the main <strong>HOBOware</strong> window to show whether thereceiver is currently connected. If the receiver is connected, you'll see thisin the bottom right corner of the <strong>HOBOware</strong> window. If the receiver is disconnected, you'll see thisinstead. The "No devices connected" message next to the receiver icondoes not refer to devices within your data node network; it indicates that other devices, such asloggers and shuttles, are not currently connected. If you were to connect a logger or a shuttle, thatmessage is updated independently of the receiver icon.<strong>HOBOware</strong> User’s <strong>Guide</strong> 140
A Tour of HOBOnode ManagerThis topic provides a description of the elements in HOBOnode Manager.1. Tabs. Click the tabs to toggle between the Plots, Map, and Alarms pages.2. Device Table. The Device Table displays information about the receiver and each node and configuredsensor in your network. Use the Device Table to: Select a device by checking the appropriate box in the Select column. Double‐click the field to assign a name, or label, to the node or sensor. Typein the name and press Enter. See a list of all network devices in the Type column, which lists the device by part number,followed by sensor part number as applicable. View the serial number for the device in the S/N column. Check the current status of the device, listed in the Status column. Data nodes and routernodes are listed as either Active (communicating with the receiver) or Missing (notcommunicating with the receiver). As with data notes and router nodes, sensor status can beActive or Missing, but it also be listed as Off if it is an external sensor that has not beenconfigured. Receiver status is either listed as Connected or Not Connected. See what the sensor is configured to measure in the Meas. type column. The measurementtype is automatically filled in for internal sensors. The measurement type listed for externalsensors is determined by the selections in the Configure Sensor dialog. Check the latest reading for each sensor in the Reading column, and the time that reading wastaken in the Time column. View device readings in a real‐time plot. Check the box in the Plot column to generate a realtimeplot for that device. See what group(s) the sensor has been assigned to in the Group column.<strong>HOBOware</strong> User’s <strong>Guide</strong> 141
Add the device to a map. Check the box in the Map column to add that device to the map. Dragthe icon to the desired location on the map click the mouse button. Check whether an alarm has tripped for a specific device in Alarm column. A grey alarm iconmeans an alarm has not been set up for the device. A green alarm icon means an alarm hasbeen set up, but has not tripped as of the latest reading. A red alarm indicates the alarm forthat sensor has tripped. Check the signal strength between the device and receiver or the device and the nearestrouter in the Signal column. If the signal is low, there may be obstructions or otherinterference preventing the device from communicating to the receiver or router. Check the battery level for a specific device in the Battery column.You can change the sort order in a column by clicking the column header. Right‐click anywhere in theDevice Table to restore the sort order. You can also show or hide individual columns by clicking the iconabove the vertical scroll bar in the Device Table.3. Configuration Bar. Use the Configuration Bar to select all or none of the devices, to quickly change thesensor type for external sensors, to assign sensors to groups, or to open the Configure window foradditional sensor settings.4. Help button. Click this button to access HOBOnode Manager help. Click the Open topic withnavigation link to open the full Help table of contents.5. Actions button. From the Actions button, you can print a copy of the device table, edit preferences, orcreate a new deployment.6. Plot/Export Data button. Click this button to open the Plot/Export Wireless Data window, from whichyou can select sensor data to plot in <strong>HOBOware</strong> or export to a .csv or .txt file for use in anotherprogram.7. Form Network button. Click this button to create a network and add data nodes and router nodes toit.Viewing Real‐Time PlotsIn the plots window, you can view sensor data in real‐time plots. You can plot a maximum of 20 sensors at once.To view the real‐time plot for sensors:1. Select the Plot box in the Device Table for each sensor you want to view.2. Select Sensor or Measurement view tab.In Sensor View, there is a separate plot for each sensor.In Measurement View, there is one plot for each Measurement Type (such as temperature), which maycontain separate entries for multiple sensors.3. Change the time frame of the plot using the Time Frame tabs.<strong>HOBOware</strong> User’s <strong>Guide</strong> 142
Use the Sort Plots By drop‐down list to change the order of the plots. Use the Reorder Plots arrow to reverse the order of plots. Use the Plot Toolbar to zoom in or out, pause the plot, or print the plot.Plotting PreferencesTo change preferences that apply to real‐time plots only, see Setting HOBOnode Manager Preferences.Use the general <strong>HOBOware</strong> Plotting Preferences to change the appearance of plots. To apply changes to real‐timeplots, re‐start HOBOnode Manager or uncheck the sensor Plot box and then re‐check. To open the PlottingPreferences, from the main <strong>HOBOware</strong> menu select File > Preferences and then click the Plotting tab.Determining Data Node TypeThere are three types of devices displayed within HOBOnode Manager: the data receiver (ZW‐RCVR), end‐pointdata nodes (ZW‐0xx), and node/routers. A node/router can be either a data node (ZW‐0xx) that was initiallypowered by an AC adapter instead of batteries or a router node (ZW‐ROUTER) that routes data only and does nothave recording capability. Use the icons in the device table to identify data node types. This is particularly helpful ifyou need to verify whether a data node (ZW‐0xx) is acting as a data node only or if it also has routing abilities.<strong>HOBOware</strong> User’s <strong>Guide</strong> 143
For another way to see whether the device is a data node only or a data node/router, double‐click the device toopen the Configure Node dialog. Check the Device Type for the device part number and description. In theexample below, the device is operating as a both a data node and a router so the Device Type is listed as “ZW‐006(Node/Router).” If this device was powered by batteries only, then it would be operating as a data node and not arouter, and listed as “ZW‐006 (Node).”Changing Logging and Connection IntervalsThere are two types of intervals associated with data nodes: the logging interval, which is how often the node records data and the connection interval, which is how often the node transmits data to the receiver.When a data node joins a network, it uses the default logging and connection intervals that are set within thegeneral preferences (upon installation of the software, the default logging interval is 1 minute and the defaultconnection interval is 10 minutes). However, you can also define logging and connection intervals on a per‐nodebasis, which gives you the flexibility of having data nodes logging and transmitting data at different rates.Changing Default Values in PreferencesTo change the default logging and connection intervals, click the Actions button in HOBOnode Manager and selectEdit HOBO Data Node Preferences. Or, within <strong>HOBOware</strong>, select File > Preferences on Windows or <strong>HOBOware</strong> >Preferences on Macintosh and click Data Nodes. The default logging and connection intervals are under theGeneral category of the data node preferences.Select a preset value or set a custom interval. The minimum logging interval is 1 minute, and the minimumconnection interval is 2 minutes.These default values will only be used for new data nodes that join the network. Changes to these default intervalswill not affect data nodes that are already logging or that have been previously configured with their ownindividual logging or connection interval.Changing Intervals for Individual Data NodesTo change the logging and connection intervals on an individual data node:<strong>HOBOware</strong> User’s <strong>Guide</strong> 144
1. Double‐click the data node entry in the Device Table to open the Configure Device window.2. Change the logging interval and connection interval as required.3. Click OK.The changes will take effect the next time the data node connects to the receiver; they will only apply to thatparticular data node and its sensors. All other data nodes in the network will continue logging and connecting attheir current intervals.Setting up External SensorsIMPORTANT: Refer to the documentation that came with your sensor for specific connection and wiringinformation.Data nodes support various external sensors that plug into one of two kinds of ports:Most external sensors are not automatically configured. You must assign a sensor type for any external sensorsconnected to the data node (except for the External Temp/RH sensor). If you do not assign a sensor type, thedevice will not record any data for that sensor.The ZW‐005 and the ZW‐007 support the External Temp/RH sensor (Part # CABLE‐TEMP/RH), which plugs into theExternal Temp/RH Sensor Port (#1 in the photo above). This sensor is preconfigured and you do not have to selecta sensor type. Separate rows appear under the node for the Temperature and RH channels with correspondingentries in the Type column.Some data nodes support up to four configurable external sensors, which plug into one of the 2.5mm Stereo Portsshown (#2 in the photo above).<strong>HOBOware</strong> User’s <strong>Guide</strong> 145
You must select a Sensor Type in HOBOnode Manager for these sensors. When the data node appears in theDevice Table, configurable external sensors will not have an entry in the Type column.To select a Sensor Type for an external sensor:1. Double‐click the row for the sensor in the Device Table.2. Select the Sensor Type from the drop‐down list.3. Add a label for the sensor (optional).4. Click OK.Once you select a sensor type, the Status will change to ACTIVE and the appropriate measurement type will appearin the Measurement Type column.Some sensors must be scaling to give you meaningful data. Refer to Configuring Scaling on a Sensor for moredetails.Configuring Scaling on a SensorSome sensors need to be scaled to provide meaningful data. Scaling is set through the Configure Scaling window.To open this window:1. Double‐click the sensor in the Device Table to open the Configure Sensor window.2. Select the Sensor Type if not already selected.3. Click the Configure button.To set scaling for the sensor:1. Check the scaling type is correct. The scaling type is automatically selected based on the type ofsensor selected. Linear scaling is enabled for analog sensors; pulse scaling is enabled for pulse sensors.2. Enter the scaled measurement type. The Raw Measurement is the source measurement type, such asCurrent, Voltage, or Counts.<strong>HOBOware</strong> User’s <strong>Guide</strong> 146
3. Enter the scaled units. The Raw Units is the type of output the sensor uses, either V or mA,corresponding to the type of sensor selected. Raw Value 1 and Raw Value 2 should be entered usingthese units.4. Type in the Raw and Scaled numbers for Value 1. For Raw Value 1, enter the low raw value given bythe external sensor. For Scaled Value 1, enter the value in the same units that were specified in theScaled Units box. The Scaled Value 1 is the value that will appear on the plot when the sensor reportsa raw value equal to Raw Value 1.5. Type in the Raw and Scaled numbers for Value 2. For Raw Value 2, enter the high raw value given bythe external sensor. For Scaled Value 2, enter the value in the same units that were specified inthe Scaled Units box. The Scaled Value 2 is the value that will appear on the plot when the sensorrepors a raw value equal to Raw Value 2.6. Click OK when done.Once scaling is configured on a sensor, the scaled icon will appear in the Meas. Type column in the Device Table.Wattnode Scaling Factors: T‐WNB‐3Y‐208/T‐WNB‐3D‐240/T‐WNB‐3D‐480Use the table below to find the Kilowatt‐hours per pulse for your CT Size and WattNode model and enter it in theScaled Value 1 box.Cable Required/Sensor Type: CABLE‐2.5‐STEREOExampleThis example shows the values you would enter in the Configure Scaling window for a Wattnode 3Y‐208 with a 5amp CT. Pulse should be selected automatically. In the Scaled column, type "Energy" for Measurement and "kWh"for Units. For this example, the Raw Value 1 is "1" and the Scaled Value 1 is "0.000125."<strong>HOBOware</strong> User’s <strong>Guide</strong> 147
Kilowatt‐hours per pulseKilowatt‐hours per pulseCT Size (amps) Model #: 3Y‐208/3D‐240 Model #: 3D‐4805 0.000125 0.000288515 0.000375 0.000865620 0.0005 0.001154130 0.00075 0.001731350 0.00125 0.002885460 0.0015 0.003462570 0.00175 0.0040396100 0.0025 0.0057708150 0.00375 0.0086563200 0.005 0.011542250 0.00625 0.014427300 0.0075 0.017313400 0.01 0.023083600 0.015 0.034625800 0.02 0.0461671000 0.025 0.0577081200 0.03 0.069251500 0.0375 0.0865632000 0.05 0.115423000 0.075 0.17313Veris Scaling Factors: T‐VER‐8051‐300/T‐VER‐8053‐800The consumed energy in kilowatt‐hours (kWh) per pulse for these sensors is determined by the DIP switch settingon the transducer. The default is “1.00” kWh / pulse, at which the scaling factor is 1 = 1. If you change the defaultDIP switch settings, adjust your scaling factors accordingly, as shown below.The data recorded by the data node will be the number of counts (pulses) per sampling interval.Cable Required/Sensor Type: CABLE‐ 2.5‐STEREO<strong>HOBOware</strong> User’s <strong>Guide</strong> 148
1 Pulse Per kWh (Default).5 Pulse Per kWh<strong>HOBOware</strong> User’s <strong>Guide</strong> 149
.25 Pulse Per kWh.10 Pulse per kWhVeris Scaling Factors: T‐VER‐H970‐200The T‐VER‐H970‐200 has a selectable range for Linear Scaling: mA or Volts ‐> Amps. An AC‐DC power adapter witha minimum of 6W @ 35mA is required for excitation power.Cable Required/Sensor TypeUse the appropriate cable to connect the sensor to the data node and select the corresponding cable in the SensorType drop‐down when configuring the External Sensor in HOBOnode Manager. For 4‐20mA output, use CABLE‐4‐20mA. For 0‐5vdc output, use CABLE‐ADAP5.<strong>HOBOware</strong> User’s <strong>Guide</strong> 150
0‐50 Amps0‐100 Amps0‐200 AmpsVeris Scaling Factors: T‐VER‐971BP‐200The T‐VER‐971BP‐200 has a selectable range for Linear Scaling: mA or Volts ‐> Amps for current flow in bothdirections.Cable Type/Sensor TypeUse a CABLE‐4‐20mA to connect the sensor to the data node and select CABLE‐4‐20mA in the Sensor Type dropdownwhen configuring the External Sensor in HOBOnode Manager.Notes:<strong>HOBOware</strong> User’s <strong>Guide</strong> 151
Span Setting Requires 12‐24VDC @ 35 to 110 mA excitation power depending on DC current load. An AC‐DC power adapter with a minimum of 6W @ 65mA is required. For currents over 120 Amps, supply voltage to CT must be at least 15V to maintain accuracy. Minimum Warm‐up Time is 8‐10 seconds.The H971 comes preset at the maximum (0‐200A) span. To adjust the H971 to a different span, locate thepotentiometer on the top of the device. This potentiometer is a multi‐turn device, taking about 23 turns to adjustthe span from ±20A to ±200A. Use the potentiometer to adjust the maximum amperage range used by the sensor.The smallest amperage range (0 to ±20 A) is set by turning the potentiometer fully counterclockwise; the greatestamperage range (0 to ±200 A) is set by turning the potentiometer fully clockwise.To determine the best amperage range for an application, first set the load to the maximum amperage that will beused. Use the LED as a guide to adjust the potentiometer to its optimum setting. Verify the measured outputcurrent matches the load current using a current clamp meter.LED ActivitySteady green blinkRapid green blinkPotentiometer AdjustmentTurn CCW until LED blinks rapidly, then slowly turn CW just until blink returns tosteady rate.Turn CW until LED blinks at a steady rate.For an alternate method, see the Veris Installation Manual:Scaling Graphhttp://www.veris.com/docs/Installs/h971_971SP_i0d2.pdf<strong>HOBOware</strong> User’s <strong>Guide</strong> 152
0‐20mA0‐100mA<strong>HOBOware</strong> User’s <strong>Guide</strong> 153
0‐200mAVeris Scaling Factors: T‐VER‐PXU‐L/T‐VER‐PXU‐XThese Veris differential pressure transducers use Linear Scaling, mA or Volts ‐> "WC".The analog output for these Veris sensors is determined by which screw terminals are connected either to aCABLE‐4‐20mA or to CABLE‐ADAP5 or to CABLE‐ADAP10. See the documentation that came with the hardware fordetails.Both models have switch‐selectable ranges and scales. The examples below show the scaling parameters you enterin the Configure Scaling window for the supported output ranges and raw values.<strong>HOBOware</strong> User’s <strong>Guide</strong> 154
0 ‐ 0.1 in. W.C.0 ‐ 0.25 in. WC<strong>HOBOware</strong> User’s <strong>Guide</strong> 155
0 ‐ 0.5 in. WC0 ‐ 1.0 in. WC<strong>HOBOware</strong> User’s <strong>Guide</strong> 156
0 ‐ 2.5 in. WC0 ‐ 5.0 in. WC<strong>HOBOware</strong> User’s <strong>Guide</strong> 157
0 ‐ 10.0 in. WCIon Scaling Factors: ION‐TVOCThe ION‐TVOC uses Linear Scaling, mA ‐> ppm.Cable Required/Sensor Type: CABLE‐4‐20mANOTES Requires Loop power of 22 mA. Lamp and electronics require 65 mA. An AC‐DC power adapter with a minimum of 6W @ 35mA is required for excitation power.0‐10 ppm<strong>HOBOware</strong> User’s <strong>Guide</strong> 158
0‐100 ppm0‐1000 ppmSetting HOBOnode Manager PreferencesYou can change preferences for several features within HOBOnode Manager. You can access HOBOnode Managerpreferences one of two ways: In <strong>HOBOware</strong>, select File > Preferences on Windows or <strong>HOBOware</strong> > Preferences on Macintosh andclick Data Nodes. At the bottom of the HOBOnode Manager window, click the Actions button and select Edit HOBO DataNode Preferences.General PreferencesThe following general preferences are available: Default Logging Interval. This is how often data nodes will log data. The default is 1 minute.<strong>HOBOware</strong> User’s <strong>Guide</strong> 159
Default Connection Interval. This is how often data nodes will send data to the receiver. The default is10 minutes. Timeout when forming network. This is the amount of time that you can add a data node to thenetwork after you click the Form Network button. By default, Form Network mode will remain activeuntil you click the X on the Form Network progress indicator. A node is MISSING when it is late by. This is how long a node must go without sending data toHOBOnode Manager for it to be marked as missing. When a data node is missing, its status in theDevice Table will be MISSING, and a MISSING NODE alarm will be tripped (if configured). The default is10 minutes. When the HOBOnode Manager is closed, keep device communication running. This controls whetherdevice communication automatically remains running when you exit HOBOnode Manager. The defaultis to keep it running. Start the HOBOnode Manager and device communication automatically when <strong>HOBOware</strong> starts.This controls whether HOBOnode Manager and the device communication automatically startsimmediately upon opening <strong>HOBOware</strong>. The default is to not automatically open HOBOnode Managerand the device communication when <strong>HOBOware</strong> is opened. Highlight row in table when clicking on a sensor or data node in the map. This controls whether thecorresponding row in the device table is automatically highlighted when you select a device in theHOBOnode Manager map. This is enabled by default. Show informational popups in the device table when new nodes are added. This controls whether amessage is displayed every time a new device is added to the device table. This is enabled by default.Alarms PreferencesSee Setting Alarms Preferences.Real‐Time Plots PreferencesYou can customize the plots that appear in HOBOnode Manager by increasing the number of sensors you can plotat one time, adding the ability to view monthly data, displaying alarm thresholds, and more. These preferences arespecific to real‐time plots only. See Plotting Preferences for details on how to change general plot appearance,such as changing font type and size, adding gridlines, or modifying axis details. Maximum number of sensors to plot. Select how many data node sensors you want to be able to plotat one time within HOBOnode Manager. You can select from 1 sensor to 100, with a default of 20. Enable MONTH view in real‐time plots. Select this checkbox to add a Month button to the Plots tab inHOBOnode Manager. You can then plot data by hour (4 hours), day, week, or month. The Month viewis disabled by default.<strong>HOBOware</strong> User’s <strong>Guide</strong> 160
Maximum number of days of observations to plot. Select how many days worth of data you want toview in the plot, up to 31. The default is 7 days. Show alarm thresholds on real‐time sensor plots. Select this checkbox to add a visual indicator, orreference point, when a sensor alarm has tripped.• Select Show alarm threshold as line to display the alarm threshold on the real time plotsas a horizontal line. An example of this type of reference point is the red line in thefollowing plot where an alarm was configured to trip at above 95 degrees Fahrenheit.• Select Show alarm threshold as interval to display the alarm threshold as a shadedarea: red when the alarm is above the specified threshold and blue when it is below.Using the same example, there is a red shaded area from above 95 degrees on thefollowing plot instead of a single red line.Data StorageThis lists the current location of the HOBOnode Manager database. For more information, see Data StorageLocation.SharingThis provides options for sharing HOBOnode Manager data via HOBOnode Viewer or automatic data delivery. SeeEnabling HOBOnode Viewer and Setting up Data Delivery.Working with HOBOnode Manager DataThere are several ways you can analyze data gathered in HOBOnode Manager. In addition to the viewing the realtimeplots and information in the Device Table, you can: Plot or export data for use in <strong>HOBOware</strong> or external programs Set up groups to organize data<strong>HOBOware</strong> User’s <strong>Guide</strong> 161
Set up a HOBOnode Viewer web page for viewing on a local area network Automatically send data to others via email or FTP, or save it to a computer on a local area networkPlotting or Exporting Wireless DataWith HOBOnode Manager, you can view data and plots from your HOBO data node wireless network in real time,but you also have the ability to plot or export previously logged data. Using the Plot/Export Wireless Datacapability, you can plot data directly in <strong>HOBOware</strong> or you can export it to a text or .csv file to open in anotherprogram for further analysis. You can pinpoint the exact data you wish to plot or export, allowing you to view datafrom: Current and/or previous network deployments, Specific data nodes, A subset of certain sensors from selected data nodes, Groups of data nodes as configured in HOBOnode Manager, and A specific date range or timeframe.In addition, you can save frequently used settings for quick plotting and exporting in the future and for use withdata delivery, which allows you to share data automatically via email, FTP, or saved to a drive on a regularschedule.To open the Plot/Export Wireless Data tool, click the Plot/Export Data button in HOBOnode Manager (or from theFile menu in <strong>HOBOware</strong>, select Plot/Export Wireless Data).To use the Plot/Export Wireless Data tool:1. Select the deployment that contains the data you wish to plot or export.2. Select the data nodes with the sensors whose data you wish to plot or export.3. Each sensor for the data node that you selected in Step 2 will appear in a list as shown below. Click thedown arrow icon for each sensor you wish to plot or export, or click the Include All Sensors button ifyou want to plot or export data from all sensors in the list. Note: If you have set up groups inHOBOnode Manager, you can also sort and select sensors within those groups. See Using Groups inthe Plot/Export window.<strong>HOBOware</strong> User’s <strong>Guide</strong> 162
The sensors that you selected will move from the top half of the Step 3 pane to the bottom half asshown below. In this example, all sensors were included and are now shown in the "Sensors toplot/export" list. If you wish to make changes, you can either click the up arrow icon remove a specificsensor from the list, or click the Exclude all sensors button to move all the sensors back to the top(you'll then need to select the sensors you wish to plot or export again).4. Choose the time range for the data you wish to plot or export. Select Custom and specify your ownstart and end time, or select Preset and choose one of several pre‐defined ranges from the drop‐downlist.5. Once you have all the settings selected, click the Export or Plot button. Clicking the Export button willopen the Export Options dialog, where you can choose to save the data to a single file or to multiplefiles. Clicking the Plot button opens the Plot Setup dialog, where you can select the series that willappear in the graph in <strong>HOBOware</strong>.<strong>HOBOware</strong> User’s <strong>Guide</strong> 163
Notes: If you want the current settings to always appear in the Plot/Export Wireless Data window, then selectthe "Use these settings as window default" checkbox. You can save different combinations of settings to a configuration file in the Plot/Export Wireless Datawindow for future use, or for use by the data delivery feature. Click the Save Settings button, type aname, and press Enter. Then click the Load Settings button and choose the configuration file you wishto use for the current plot or export.Using Groups to Sort SensorsYou can assign sensors to groups in the Device Table and then use them to sort rows in the table, or to refine a listof sensors in the Plot/Export Wireless Data window.Creating Groups and Adding Sensors1. In the Device Table, select the sensor(s) you want to add to a group.2. Click Groups.3. In the box, enter a name for the group and press Enter.<strong>HOBOware</strong> User’s <strong>Guide</strong> 164
The Group Name appears in the table for each sensor selected.Adding Sensors to a GroupTo add a sensor to an existing group:1. Select the sensor(s).2. Click Groups.3. Check desired groups(s).4. Click Apply Selected Groups.Sorting by GroupClick the Group(s) column header to sort rows by groups.<strong>HOBOware</strong> User’s <strong>Guide</strong> 165
Deleting or Renaming a GroupSelect Manage Groups from the Groups drop‐down.The Manage Groups window appears. To change the name of the group click the Edit icon and enter the new name. To delete a group, click the X.Using Groups in the Plot/Export Wireless Data WindowOnce you have set up groups in the Device Table, you can use them to refine the list of available sensors in thePlot/Export Wireless Data window.To set up groups, see Using Groups to Sort Sensors.1. Check the "Use Groups to filter list" box.<strong>HOBOware</strong> User’s <strong>Guide</strong> 166
2. Click the Match any Group button.3. Select Groups. Select the groups you want to include in the list.4. Select the Match Criteria. Select "Match any selected Group" and any sensors that are a member ofany of the groups selected will appear. Select "Match all selected Groups" and only sensors that are amember of all of the groups selected will appear.5. Select OK.Only the sensors that match the group criteria will appear in the Node Sensors list.Viewing Current Sort CriteriaEnabling HOBOnode ViewerYou can view plots and data from your HOBO data node network on your local area network with HOBOnodeViewer. While HOBOnode Manager requires a direct connection on a dedicated PC to monitor your network,HOBOnode Viewer gives you the flexibility to see data node plots and network status anywhere. This allows you to: Look at real‐time data from your local area network with any browser Check on the data node network remotely to make sure it is running properly and that no devices aremissing or alarms have tripped Share data with others by sending them a link to HOBOnode ViewerHOBOnode Viewer is a locally hosted website easily configured within <strong>HOBOware</strong> preferences. Once HOBOnodeViewer is enabled, <strong>HOBOware</strong> will create a link for your own web page that displays the real‐time plots and datafor your data node network. The HOBOnode Viewer web page will always be available as long as HOBOnodeManager remains open on the computer with your HOBOnode database.To access HOBOnode Viewer, you must first enable that feature within <strong>HOBOware</strong> preferences on the computerrunning a data node network. This will create a link to a HOBOnode Viewer web page that you can use and sharewith others. If you have not already set up a data node network using HOBOnode Manager, you must do that firstand then you will be able to activate HOBOnode Viewer from the same computer.Windows note: If Windows Firewall is enabled on your computer, you may need to adjust the security settings toallow access to <strong>HOBOware</strong> before enabling HOBOnode Viewer. To check this, open Control Panel, go to Security,and select Allow a program through Windows Firewall (or click Windows Firewall and click the Exceptions tab on<strong>HOBOware</strong> User’s <strong>Guide</strong> 167
some versions of Windows). Make sure <strong>HOBOware</strong> is selected in the allowed access/exceptions list. Note that youmust be administrator to make these changes.To enable HOBOnode Viewer:1. Open the preferences for data nodes. From HOBOnode Manager, click the Actions button and selectEdit HOBO Data Node Preferences. Or, to access preferences within <strong>HOBOware</strong>, select File> Preferences on Windows or <strong>HOBOware</strong> > Preferences on Macintosh and click Data Nodes.2. Click Sharing within the Data Nodes preferences, and then click HOBOnode Viewer.3. Select the Enable HOBOnode Viewer checkbox.4. By default, the port number assigned for HOBOnode Viewer is 8080. You may use this one or change itto any other available port. In most cases, the default 8080 port number will be available. However, ifthis number is already in use by another web service application on the same computer, then you canchange it to any other available port. There are 0 to 65,535 ports. Port numbers 0 to 1023 arerestricted ports reserved for use by system services, such as FTP, Telnet, and HTTP. You may use anyother available port number from 1024 to 65,535 for HOBOnode Viewer.5. Click OK in preferences and then restart HOBOnode Manager (close HOBOnode Manager and thenfrom the Device menu in <strong>HOBOware</strong>, select Manage HOBO Data Node Network to reopen it).HOBOnode Viewer will not be fully enabled until you restart HOBOnode Manager.6. After HOBOnode Manager has restarted, return to the HOBOnode Viewer preferences. Click the link,or URL, to go to your HOBOnode Viewer web page.The URL has the following structure:htttp://:/HOBOnodeViewerwhere is the IP address for the computer where your data node network is running and is the port assigned for the HOBOnode Viewer in preferences.To share the URL with others, click the link and then copy the URL from your browser and paste it an emailmessage to send to others who would like to view your data node network.Note: HOBOnode Viewer is only available while HOBOnode Manager is running. If you close HOBOnode Managerand then attempt to access HOBOnode Viewer, the web page will not open. Also note that the HOBOnode Viewerwill not be available outside your local area network unless you expose that computer outside of the network.Contact your IT department if you would like to expose the HOBOnode Viewer.To disable HOBOnode Viewer:1. Open the preferences for data nodes. From HOBOnode Manager, click the Actions button and selectEdit HOBO Data Node Preferences. Or, to access preferences within <strong>HOBOware</strong>, select File> Preferences on Windows or <strong>HOBOware</strong> > Preferences on Macintosh and click Data Nodes.2. Click Sharing within the Data Nodes preferences, and then click HOBOnode Viewer.3. Deselect the Enable HOBOnode Viewer checkbox.4. Click OK in preferences and restart HOBOnode Manager.<strong>HOBOware</strong> User’s <strong>Guide</strong> 168
Using HOBOnode ViewerMany of the elements in HOBOnode Viewer are the same as HOBOnode Manager. Specifically, you can do thefollowing with HOBOnode Viewer just as you would with HOBOnode Manager: Organize plots by sensor or by measurement type View plot data hourly, by day, by week, or by month (the month view must be enabled in thepreferences for real‐time plots) Sort the plots several ways, including by serial number, current reading, and alarm state View a map of your network devices Check the device table for details on each device in your network Change the device table view by sorting the columnsThere are, however, some key differences between HOBOnode Manager and HOBOnode Viewer. HOBOnode Viewer, as its name implies, is a viewer only. Any changes you wish to make to yournetwork, including updates to alarms or modifications to the map, need to be done directly inHOBOnode Manager. With HOBOnode Manager, you can see all available sensor channels on all devices, including thosewithout a sensor type selected. HOBOnode Viewer displays enabled sensor channels only. If a devicein HOBOnode Manager has a channel listed as “OFF,” then that channel will not appear in HOBOnodeviewer. There may be some minor differences in plot appearance if you are comparing the plots in HOBOnodeViewer to HOBOnode Manager. In general, plots are nearly identical, but there could be slightdifferences in scaling.<strong>HOBOware</strong> User’s <strong>Guide</strong> 169
If you set up data delivery and chose to have files saved to your computer or a network drive, then aData tab will be visible in HOBOnode Viewer with a list of all files delivered through that service asshown below. Click a file name to open or save the file.Note: If you change the file directory location in the data delivery settings, then you must restart HOBOnodeManager before you can access the files from the Data tab in HOBOnode Viewer.Any changes you make to your network with HOBOnode Manager will be reflected in the HOBOnode Viewer uponthe next refresh, or update. HOBOnode Viewer refreshes every 30 seconds. You can also use your browser’srefresh feature if you want to see a change immediately.Important: HOBOnode Viewer is only available while HOBOnode Manager is running. If you close HOBOnodeManager and then attempt to access HOBOnode Viewer, the web page will not open. Always keep HOBOnodeManager running to ensure anyone accessing HOBOnode Viewer can see the real‐time plots and data.See also:Enabling & Disabling HOBOnode ViewerSetting up Data DeliveryWith data delivery, you can automatically save recorded sensor data from nodes in your network to a single .txt,.csv, or .xls file on a regular schedule. This allows you to: Store data from your current data node network deployment for future reference and analysis, Access data remotely when you are away from the network, and Share data with others in a file that is distributed automatically via FTP or email, or saved to acomputer or network drive.Before you can set up data delivery, you must first select which nodes and sensors you wish to include in the file bysaving the configuration settings. To do this:1. From HOBOnode Manager, click the Plot/Export Data button.2. Select the deployment name from the list.<strong>HOBOware</strong> User’s <strong>Guide</strong> 170
3. Select the individual nodes you would like to include in the file or click the All button to select allnodes.4. Select the sensors you would like to include in the file or click the Include all sensors button.5. Make sure all the sensors you wish to share in your datafile appear in the Sensors to plot/export list.6. Select Preset and choose a preset time range to determine how much data will be exported each timedata delivery runs. In this example, we chose "Past 12 hours," which means only data from the past 12hours will be exported via data delivery. The most recent 12 hours worth of data is shown for<strong>HOBOware</strong> User’s <strong>Guide</strong> 171
eference. Note: Do not choose a custom time range. This is for immediate exports only. If youchoose a custom time range for data delivery, then data from that custom time‐range only will beexported every time data delivery runs.7. Click the Save Settings button and type a name, which will also be used for the data delivery file name,and press Enter. Your configuration settings will be saved.After you have selected the sensors you wish to include in the shared data file, you can then set up data deliverywithin Preferences.To do this:1. Open HOBOnode Manager.2. Click the Actions button and select Edit HOBO Data Node Preferences.3. Select Sharing, and then select Data Delivery.Note: If you have not yet selected the sensors you wish to export, then you will see a messageindicating you need to create and save a settings file. You must select the sensors in Plot/ExportWireless Data before continuing.4. Select how often you want to save the data from your network, from 1 minute to 7 days. This willdetermine what schedule you use to share the data.<strong>HOBOware</strong> User’s <strong>Guide</strong> 172
Email:5. Select the name of the saved settings that you created in Plot/Export Wireless Data, such as"Warehouse Zone A" in the example above.6. Select how you would like to share the file: via email, FTP, or saved to a computer or networklocation. You may select more than one method of sharing the file.Type the email address where you want to send the file and select the checkbox if you want to compress the filebefore emailing it. Note: Data delivery uses the same email settings configured for alarm email notifications. If youhave never configured an alarm email, you must do that first, even if you don’t plan on setting any alarms.FTP:Enter the FTP server name, the directory name (remote folder), username, and password for the FTP locationwhere you want to place the file. Test the FTP Connection to make sure it successfully delivers the file to thespecified location. Select the checkbox if you want to compress the file before delivering it via FTP. Choosewhether you want to overwrite the existing file at that FTP location each time a new file is transferred, or if youwant to create a new time‐stamped file each time.Saving it to a hard drive or network:Select the directory where you want to save the files. Choose whether you want to overwrite the file each time afile is saved, or if you want to create a new file each time.<strong>HOBOware</strong> User’s <strong>Guide</strong> 173
When you are done configuring your data delivery settings, click OK in the main Preferences window.The sensor data from your data network will then be saved and shared on the schedule that you selected. The datawill be saved as a .txt, .csv, or .xls file that you can import into <strong>HOBOware</strong>, Microsoft Excel, and other programs foranalysis. The file type is determined by the export settings in Preferences.Notes: Data delivery will not run unless device communication is also running. This means if you opt to stopdevice communication when you close HOBOnode Manager, then data delivery will also stop. Onceyou restart the device communication, then data delivery will commence again on the previouslyconfigured schedule. The preferences for data delivery may include the names of settings files from old networkdeployments. If you enable data delivery and use the saved settings from an old deployment, you willsee a message indicating "No data found for selected sensors." Choose a settings file from the currentdeployment, or create a new one with Plot/Export Wireless Data.Important: Data Delivery will not work properly if the "Show export dialog" setting is selected in the exportpreferences. To disable this setting, select Preferences from the File menu in Windows or the <strong>HOBOware</strong> menu inMacintosh. In the General category, select Export Settings. Make sure "Show export dialog" is not selected. Even ifthe "Automatically export table data upon readout of logger" option is disabled, the "Show export dialog” mustnot be selected for Data Delivery to work properly. Your preferences must look like this:or this:but not like this:for Data Delivery to work correctly.Tip: You can also share data from your HOBO data node network by enabling a HOBOnode Viewer webpage. Whendata delivery is configured to save files to your computer or a network drive, the files will also be available on the<strong>HOBOware</strong> User’s <strong>Guide</strong> 174
Data tab in HOBOnode Viewer. Note that if you change the file directory used for data delivery when HOBOnodeViewer is enabled, you will need to restart HOBOnode Manager before you can access the files from the Data tab.Data Storage LocationThe HOBOnode Manager database is stored in the directory shown in the Data Storage Location field. Thisdatabase includes all data recorded by the data nodes, settings for all deployments, alarm information, and otherdetails related to your data node network.Onset recommends that you periodically back up the database to secure your data in case of a database orcomputer failure. You can back up the database to an external hard drive or network server using third‐partybackup software.The database is stored at the following location, as shown in the Data Storage Location field: Windows 7 and Windows 8C:\Users\\AppData\Local\OnsetComputerCorporation\cosmos\db Windows XPC:\Documents and Settings\\Application Data\Local\OnsetComputerCorporation\cosmos\db Macintosh OS 10.5 and 10.6/Users//Documents/OnsetComputerCorporation/cosmos/dbTo restore the database:1. Obtain the "db" directory from your backup source.2. Replace the "db" directory as shown in the Data Storage Location field with the backup copy.AlarmsThere are two types of alarms in HOBOnode Manager: sensor alarms and system alarms. With sensor alarms, youcan set an alarm to trip when a sensor reading is out of a range you specify. With system alarms, you can set analarm to trip when a node is missing from the network or has a low battery. You can also configure a heartbeatalarm, which periodically notifies you the receiver is active and communicating with the nodes in the network. Youcan also set alarm actions, or notifications, to alert you via email, text, and/or audible/visual cue on your computerwhen an alarm trips. NOTE: When an alarm trips, HOBOnode Manager is opened, if it is not already.Click the Alarms tab to access the following:<strong>HOBOware</strong> User’s <strong>Guide</strong> 175
1. Tabs. Click the Sensor tab to set or view sensor alarms. Click the System tab to set Missing Node,Heartbeat, and Low Battery alarms.2. Add Sensor Alarm button (Sensor tab only). Click this button to go to the Add Sensor Alarms window.3. Configured Alarms. Configured sensor alarms appear here. Use the filter to control what alarms shownin the sensor alarms pane. NOTE: If an alarm you configured is not appearing in the Alarms window,make sure the filter is set to show all.4. Controls (Sensor tab only). Use the controls to apply an action to multiple alarms, including delete,copy, enable/disable, and apply default actions.5. Tripped Alarms Log. All tripped alarms appear here. Click the Clear Log button to delete all trippedalarms.Alarms that have been configured, but not tripped, display as green alarm clock icons in both the Sensor andSystems tab as well as the Device Table (sensor alarms only). Once the alarm is tripped, the alarm clock iconchanges to red.<strong>HOBOware</strong> User’s <strong>Guide</strong> 176
Adding a Sensor AlarmA sensor alarm trips when a sensor reading is outside a threshold that you configure. You can set up actions so thatyou are notified by email, text message, or by an audio or visual alarm in HOBOnode Manager when a sensor alarmtrips. Once you create an alarm, you can copy it to multiple sensors of the same measurement type or the samemeasurement type and group.NOTE: Sensor data is sent to the receiver periodically (based on the Connection Interval) and not continuously.Therefore, there is a delay between the time the alarm condition occurs and is recorded by the sensor and whenyou are alerted by any notifications you have configured. The default Connection Interval is 10 minutes. For criticalapplications, you may want to decrease the Connection Interval so that you are alerted to alarm conditions morefrequently. See Changing the Logging Interval and Connection Interval.Opening the Add Sensor Alarm windowThe first time you add an alarm for a sensor, you can click the alarm icon for the sensor in the Device Table. Thiswill open the Add Sensor Alarm window with the sensor already selected.Otherwise, click the Alarms tab, then the Sensor tab, and then the Add Sensor Alarm button. With this methodyou will then need to select the sensor from a drop‐down list.1. Make sure the "Enable sensor alarm" checkbox is selected.2. Select the sensor (if not already selected). If you accessed the Add Sensor Alarm window by clicking onthe alarm icon in the Device Table, the sensor will automatically be populated. Otherwise, select thesensor you want to add the alarm to.<strong>HOBOware</strong> User’s <strong>Guide</strong> 177
3. Configure Alarm Parameters.a. Select the threshold: Above, Below, or Outside Range.a. Enter the value for the alarm.b. Enter the Number of Data points. This is the number of readings that must be outside of thelimits for the alarm to be tripped or cleared.4. Configure Alarm Actions (Notifications).5. Click Save.NOTE: Any time you edit an existing alarm, the alarm state is reset to untripped and the logged data points arereset to zero.Copying a Sensor Alarm to Other SensorsTo copy an alarm to other sensors:1. Select Alarm(s). Select the alarms you want to copy. You can select alarms for multiple measurementtypes and each alarm will only be copied for sensors of that type.2. Click the Copy to button.3. Select the copy option. You can copy the alarm to all sensors of the same Measurement Type, or toMeasurement Type and Group(s).The alarms are copied to the sensors, as shown below.Enabling a Missing Node AlarmA Missing Node alarm trips when a data node has not connected to the receiver within the specified timeframe.The default period to determine that a node is missing is 10 minutes. You can change this in the Preferences.To enable a missing node alarm:1. Click the Alarms tab.2. Click the System tab and select the checkbox in the Enable column for Missing Node. If alarm actionshave already been configured by a previous edit, then the Status icon for Missing Node will change toan active alarm icon (green) as shown below. This means the alarm is enabled. If an Edit Missing Node<strong>HOBOware</strong> User’s <strong>Guide</strong> 178
Alarm dialog box appears or you wish to make additional changes to this alarm, then proceed to nextstep.3. An Edit Missing Node Alarm dialog box may open automatically. If it does not and you wish to changethe settings, then click the Edit icon for Missing Node as shown above.4. Make sure the "Enable missing node alarm" checkbox is selected.5. By default, the alarm will trip after the node is missing for 10 minutes. Click the Preferences button ifyou wish to change the default time period.6. Add one or more alarm actions, which is how you will be notified when the alarm trips. You can benotified via email or text, or by a visual cue or audible sound on the computer where HOBOnodeManager is running.7. Click Save. The changes you made to the missing node alarm are displayed on the System tab.Note: Nodes may temporarily go missing after upgrading their firmware as described in Upgrading the Firmwarefor a Receiver or Single Data Node or Updating the Firmware for Multiple Data Nodes. In most instances, the nodewill not be reported as missing after upgrading its firmware. However, depending on how long the upgradeprocess takes and the length of the connection interval, the node may occasionally be reported as missing. If anode is reported as missing after updating its firmware, wait one or two connection intervals for the node toreappear. For example, if the connection interval is set to 20 minutes, wait for 40 minutes to make sure the nodereappears. If the node is then still reported as missing, add it back to the network by following these steps:1. Click the Form Network button in HOBOnode Manager.2. Press the reset button with a quick 1‐second push to reactivate the data node.3. Verify that the data node appears in the HOBOnode Manager table and is identified as a router ordata node as expected (see Determining Data Node Type). To change the type of data node, seeConverting an End‐Point Node to a Router Node or Converting a Router Node to an End‐Point Node.<strong>HOBOware</strong> User’s <strong>Guide</strong> 179
Enabling a Heartbeat AlarmIf you enable a Heartbeat alarm, a heartbeat is generated every 12 hours (configurable) to let you know that thesystem is up and running. If you do not receive a heartbeat notification, check the status of your receiver andrestart <strong>HOBOware</strong> if necessary.To configure a heartbeat alarm:1. Click the Alarms tab.2. Click the System tab and select the checkbox in the Enable column for Heartbeat. If alarm actions havealready been configured by a previous edit, then the Status icon for Heartbeat will change to an activealarm icon (green) as shown below. This means the alarm is enabled. If an Edit Heartbeat dialog boxappears or you wish to make additional changes to this alarm, then proceed to next step.3. An Edit Heartbeat dialog box may open automatically. If it does not and you wish to change thesettings, then click the Edit icon for Heartbeat as shown above.4. Make sure the "Enable heartbeat alarm" checkbox is enabled.5. Select how often you want to generate a heartbeat and what time you want to start.6. Add one or more alarm actions, which is how you will be notified when the alarm trips. You can benotified via email or text, or by a visual cue or audible sound on the computer where HOBOnodeManager is running.7. Click Save. The changes you made to the heartbeat alarm are displayed on the System tab.<strong>HOBOware</strong> User’s <strong>Guide</strong> 180
Enabling a Low Battery AlarmYou can set an alarm to trip when the battery level in a data node or a router drops below a specific threshold. Thiscan help you determine when it is time to change the batteries for devices in your network. The low battery alarmis a system‐wide alarm, which means it applies to all devices (either all nodes or all nodes and routers) in thenetwork. You cannot set a low battery alarm for some nodes and not others.To configure a low battery alarm:1. Click the Alarms tab.2. Click the System tab and select the checkbox in the Enable column for Low Battery. If alarm actionshave already been configured by a previous edit, then the Status icon for Low Battery will change toan active alarm icon as shown below. This means the alarm is enabled. If an Edit Low Battery dialogbox appears or you wish to make additional changes to this alarm, then proceed to next step.3. An Edit Low Battery dialog box may open automatically. If it does not and you wish to change thesettings, then click the Edit icon for Low Battery as shown above.4. Make sure the "Enable low battery alarm" checkbox is enabled.5. Select the battery level at which you want the alarm to trip, from 10 to 50%. For example, if youchoose 20%, then the alarm will trip once the device's remaining battery power drops below 20%.6. Select whether the battery alarm should trip for nodes only or for both nodes and routers. Notes: Youcannot set a low battery alarm for a receiver because it should always be powered by an AC adapter.In addition,you should not set a low battery alarm for routers that do not have batteries installed. Ifyour routers are powered by AC adapters only and do not have backup batteries installed, then youshould set the battery alarm for nodes only.<strong>HOBOware</strong> User’s <strong>Guide</strong> 181
7. Add one or more alarm actions, which is how you will be notified when the alarm trips. You can benotified via email or text, or by a visual cue or audible sound on the computer where HOBOnodeManager is running.8. Click Save. The changes you made to the low battery alarm are displayed on the System tab. Note: Ifthe low battery alarm was previously configured and had tripped, then clicking Save will clear thetripped state. If the newly saved settings result in an alarm condition, then the alarm will trip at thenext connection interval.Adding Alarm Actions (Notifications)An alarm action is a notification when an alarm trips or and/or clears. You can configure the alarm action to notifyyou in four ways: Via email Via text message With a visible message on your computer With a sound on your computerBefore you set up email or text notifications, you must configure your SMTP settings. See Setting AlarmPreferences.1. Click the Add New Action button. A new action is added. Tip: To save time, you can configure defaultalarm actions. See Setting Alarm Preferences for information.2. Select the type of notification: Email, Text Message, Visible, or Audible.3. Enter information or make a selection depending on the type of notification. NOTE: If you add anemail or text notification and you have not already set up your SMTP settings, you will be prompted todo so. Email: Enter the email address where you want the alarm notification sent. Text Message: Enter the email address where you want the alarm notification sent. Visible: No further configuration required. A pop‐up window will appear in HOBOnodeManager if the alarm trips.<strong>HOBOware</strong> User’s <strong>Guide</strong> 182
Audible: Select the sound that you want to play when an alarm trips. Click the Play icon to hearthe alarm.NOTE: If multiple audible alarms are set, only the most recent will play. Any other actions configured forthe alarm will be sent.4. Check the "Perform on clear" box if you want a notification when the alarm clears. If you only want anotification when the alarm clears and not when it is tripped, change the drop‐down selection to"only."5. Add Notes to be included in the alarm notification (optional).6. Click Save.To add another action, repeat the procedure.Setting Alarm PreferencesBefore you add sensor alarms, set up your Alarm Preferences for email notifications and create default actions(notifications). To open the Preferences window, click Actions at the bottom of the HOBOnode Manager windowand select Edit Data Node Preferences.1. Enter SMTP settings for email or text notifications. To receive email or text message alarmnotifications, enter the Server IP Address for your mail server, and enable SSL or authentication ifrequired by your network. See your Network Administrator or your Internet Service Provider forinformation; see also Alarm Email/Text Configuration for more information.2. Send a test email. Enter your email address and click the Send Test Email button to verify that yoursettings are correct. Make sure you check your Junk Mail or Spam folder for the email if it is not inyour email inbox.3. Add default alarm actions (optional). Entering default alarm actions simplifies alarm configuration. Forexample, instead of entering the same email address for every alarm, you can select an address froma list of drop‐down entries when you add the alarm action. For more details on alarm actions, seeAdding Alarm Actions.If you check "For new sensor alarms, automatically add all default actions" when you click the Add SensorAlarm button, the alarm actions you configured are automatically added, as shown below. This is helpful ifyou want the same actions for every alarm.<strong>HOBOware</strong> User’s <strong>Guide</strong> 183
Alarm Email/Text ConfigurationYou must configure the SMTP Settings to allow email from the data node network to get to your email recipients. Ifyour data node network is within a corporate network environment, you should contact your NetworkAdministrator (IT/MIS dept.) for this information. Also, they may need to add the receiver to a White List to allow itto relay email through the corporate email server.If you use a private mail account such as Yahoo or Google, or if you do not know your corporate information, youcan get the outgoing mail parameters from your mail provider. The following are links to this information for someproviders. For other providers, search the Internet for “SMTP Settings for ." Gmailhttp://mail.google.com/support/bin/answer.py?hl=en&answer=13287 Hotmailhttp://liveunplugged.spaces.live.com/blog/cns!F92775FC46A390CA!422.entrySending an Alarm to a Cell PhoneTo send an email to your cell phone when an alarm occurs, enter the email address for your cell phone. These arethe formats for some cell phone providers. For others, contact your provider.Alltel[10‐digit phone number]@message.alltel.comExample: 2125551212@message.alltel.comAT&T[10‐digit phone number]@txt.att.netExample: 2125551212@txt.att.netBoost Mobile[10‐digit phone number]@myboostmobile.comExample: 2125551212@myboostmobile.comNextel (now part of Sprint Nextel)[10‐digit telephone number]@messaging.nextel.comExample: 7035551234@messaging.nextel.comSprint PCS (now Sprint Nextel)[10‐digit phone number]@messaging.sprintpcs.comExample: 2125551234@messaging.sprintpcs.comT‐Mobile[10‐digit phone number]@tmomail.net<strong>HOBOware</strong> User’s <strong>Guide</strong> 184
Example: 4251234567@tmomail.netVerizon[10‐digit phone number]@vtext.comExample: 5552223333@vtext.comVirgin Mobile USA[10‐digit phone number]@vmobl.comExample: 5551234567@vmobl.comThe Network MapPlace icons on the Network Map to help you keep track of your devices. You can expand Information Balloons onthe device to view status information and sensor readings. You can also import a custom background image, suchas a floor plan.1. Map Tab. To view the Network Map, click the Map tab.2. Information Balloons. Click a device in the Network Map to open a pop‐up that shows current readingsand other device information. To have pop‐ups appear automatically, click the Configure Map iconand select "Show Information Balloon when adding new data nodes and on startup." You can alsoadjust how much information is included in the balloon. See Configuring the Network Map for moreinformation.3. Imported Map Image. To customize your map background image, see Customizing the Network MapBackground.4. Add Device to Map. To add a device to the map, check the Map box in the Device Table and then clickin the map where you want to place the icon.<strong>HOBOware</strong> User’s <strong>Guide</strong> 185
5. Connection Path. Lines on the map show the path each device takes to the receiver. You can monitorthe communication between a data node and the data receiver by checking the connection pathsbetween devices. If a device has missed a scheduled connection, the path will become a dotted line.To change the path color, see Configuring the Network Map.6. Tools. Use the Zoom tools to zoom in and out of the map. Click the Configure Map button to accessadditional map settings. Use the Refresh Network Paths button to see the latest path that the devicesare taking to get to the receiver. Paths can change if a data node is moved or because the originalpath was obstructed.Note that if an alarm has tripped on a node, the node icon on the network map will have a red ring around it likethis:Adding a Device to the Network MapTo add a device to Network Map.1. In the Device Table, check the Map box for the receiver to add it to the map.2. Move the icon to the location of the receiver and click the left mouse button.3. Check the Map box for a node to add it to the map.4. Move the icon to the location of the device and click the left mouse button.5. Repeat steps 3 and 4 for each node you want to add to the map.Configuring the Network MapYou can customize the paths and information balloons on the Network Map, and you can use your ownClick the Configure iconin the top left of the Network Map to open the Network Map Configuration window.<strong>HOBOware</strong> User’s <strong>Guide</strong> 186
In the Node Paths pane, select the Show Path to Receiver checkbox Paths to show or hide connection pathsbetween nodes. To change the path color, click the Choose button. Select a new color from the Swatches tab, orenter HSB or RGB values and click OK.In the Information Balloons pane, select the Information Balloon Type, as either: Simplified to show only label and readings, or Expanded to show all device information.<strong>HOBOware</strong> User’s <strong>Guide</strong> 187
To change the background color on the balloon, click the Information Balloon Color drop‐down arrow and select acolor.Select the "Show Information Balloon when adding new data nodes and on startup" checkbox to automaticallydisplay the balloons any time you open HOBOnode Manager or add a new icon to the map.To change the map image, see Customizing the Network Map Background.Customizing the Network Map BackgroundYou can upload a custom image to the Network Map to represent your floor plan.1. Click the Configure icon in the top left corner of the map .2. Click the Choose button in the Network Map Configuration window.3. Select the image file from the Open window.4. Click Open.5. Click OK to close the Network Map Configuration window and display the new image.To revert to the default image, click Restore.If you don't have an image to upload, you can create one using any drawing program following these guidelines: There are 3 scale levels available for an image in the Network Map, depending on the size of theimage you upload. The larger the size, the more zoom levels you will have.• 1,000 x 1,000 (minimum size) ‐ 1 zoom level<strong>HOBOware</strong> User’s <strong>Guide</strong> 188
• 2,000 x 2,000 ‐ 2 zoom levels• 3,000 x 3,000 (maximum size) ‐ 3 zoom levels All images are converted to squares in the Network Map, so for best results your overall image shouldbe a square. Inside the main square, add a smaller square or rectangle to roughly represent your building. Add squares or rectangles to represent rooms in your building where you will place nodes. Adddescriptive labels to each room such as "Office," "Cooler," or "Boiler Room." Some programs will alsohave other images you can add to the room such as desks and computers to help you narrow thelocation of the node. Set the properties of the image to your desired resolution. For best results enter 4,000 x 4,000 pixels.Maintenance & TroubleshootingOnce your ZW Wireless Data Node Network is running, refer to the following topics for maintenance andtroubleshooting tips: Changing External Sensor Type Moving or Removing a Data Node Converting a Router Node to an End‐Point Node (Switching from AC Power to Battery Power) Converting an End‐Point Node to a Router Node (Switching from Battery Power to AC Power) Database Backup and Restore HOBOnode Manager Database Upgrade Utility Creating a New Deployment Updating Firmware for a Receiver or Single Data Node Updating Firmware for Multiple Data Nodes TroubleshootingChanging External Sensor TypeMany types of HOBO data nodes can be configured with external sensors. One of the benefits of using externalsensors is that you can swap them out when necessary for different ones if you want to modify your wirelessnetwork. Or, you can disable the external sensor channel if you don't need it for your current network deployment.To change the type of external sensor associated with a data node:1. Double‐click the external sensor you wish to change in the HOBOnode Manager device table.2. Select the sensor from the Sensor Type drop‐down list.<strong>HOBOware</strong> User’s <strong>Guide</strong> 189
3. Make any other changes as necessary and click OK.Note: While the HOBOnode Manager device table will display the change to the sensor type immediately, data forthe new sensor will not display until the next connection interval .To deselect, or turn off, an external sensor:1. Double‐click the external sensor you wish to change in the HOBOnode Manager device table.2. Scroll to the end of the Sensor Type drop‐down list and select .3. Make any other changes as necessary and click OK.The HOBOnode Manager device table will then change the status for that external sensor to OFF as shown below.Any plots and alarms associated with that sensor will also be removed from HOBOnode Manager.<strong>HOBOware</strong> User’s <strong>Guide</strong> 190
Shortcut: In the device table, click the checkbox next to the external sensor, then click the Sensor Type button andselect the sensor from the list. This can be done for many sensors at once by selecting more than one sensor at atime in the device table.For details on setting up a HOBO data node with an external sensor for the first time, see Setting Up an ExternalSensor. For details on scaling sensor data, see Configuring Scaling on a Sensor.Moving or Removing a Data NodeIf you will not be using a data node for an extended period of time, you may want to deactivate it to stopmeasurements and save batteries. To deactivate a data node, use a paper clip to press the Activate button asshown in the photo below for 5 seconds until the red LED starts flashing.To later reactivate the data node, select Form Network from HOBOnode Manager and briefly depress the Activatebutton on the node.If you do not want a data node to appear in HOBOnode Manager, double‐click the device row in the Device Tableand then click Remove Node in the Configure Node window.If you move a data node to a new location, make sure the green LED is still blinking once per 10 seconds to indicatethat the node still has a connection to the receiver. If the red LED is blinking, the connection path is broken. Tryadjusting the orientation of the data node or moving it closer to the receiver to minimize obstructions. You mayneed to add a router to re‐establish a connection.If moving a data node changes the primary power source, see the following: Switching from AC Power to Battery Power Switching from Battery Power to AC PowerConverting a Router Node to an End‐Point Node (Switching from AC Power to Battery Power)If you initially power up a node using an AC adapter, it will operate as a router node. If you need to convert therouter node into an end‐point node that operates on battery power only, follow this procedure.1. Deactivate the data node by pressing the reset button on the data node with a paper clip until the redLED starts flashing repeatedly (about 5 seconds).2. Disconnect the data node from AC power.3. If batteries are installed, remove them.4. Wait at least 30 seconds to clear the memory.5. Reinstall the batteries. Do not plug in the AC adapter.6. Click Form Network in HOBOnode Manager.<strong>HOBOware</strong> User’s <strong>Guide</strong> 191
7. Press the reset button with a quick 1‐second push to reactivate the data node.8. Verify that the data node appears in the HOBOnode Manager table and is identified as a node (no routingcapabilities). See Determining Data Node Type.Converting an End‐Point Node to a Router Node (Switching from Battery Power to AC Power)If you initially power up a node using batteries, it will operate as an end‐point node with no routing capabilities. Ifyou need to convert the end‐point node into a router node that operates on AC power, follow this procedure sothat HOBOnode Manager recognizes the data node as having routing capabilities.1. Deactivate the data node by pressing the reset button on the data node with a paper clip until the redLED starts flashing repeatedly (about 5 seconds).2. Remove the batteries from the data node.3. Wait at least 30 seconds to clear the memory.4. Plug the data node into an AC power outlet.5. Click Form Network in HOBOnode Manager.6. Press the reset button with a quick 1‐second push to reactivate the data node.7. Verify that the data node appears in the HOBOnode Manager table and is identified as a router. SeeDetermining Data Node Type.8. Reinstall the batteries for backup purposes.Database Backup and RestoreIt is recommended that you periodically back up your database to secure your data in case of a database failure.You can back up your database to an external hard drive or network server using third‐party backup software.If you should ever need to restore your database, simply replace the primary database with the backup.The database is stored at the following location: Windows 7 and Windows 8c:\Users\\AppData\Local\OnsetComputerCorporation\cosmos\db Windows XPc:\Documents and Settings\\Application Data\OnsetComputerCorporation\cosmos\db Mac OS 10.5 and 10.6/Users//Documents/OnsetComputerCorporation/cosmos/dbTo rename the database, modify the name of the db folder by adding the deployment location or the date(example: "db‐11‐10"). Note: HOBOnode Manager will be empty after renaming the database. You will need toform a new network.HOBOnode Manager Database Upgrade UtilityHOBOnode Manager databases created in <strong>HOBOware</strong> 3.2.1 or earlier must be upgraded with the HOBOnodeManager Database Upgrade Utility to improve performance and response time. This utility is automatically openedthe first time you access the HOBOnode Manager database in <strong>HOBOware</strong> 3.2.2 or later.Before you can upgrade the database with the utility, you must first go to the data storage location to back up thedatabase. After the backup is complete, click Start in the utility to begin the upgrade process. Progress will bedisplayed while the upgrade takes place.Important: The larger your database, the longer it will take the upgrade to complete. Please be prepared for theutility to run for an hour or more. You will not be able to access any features in HOBOnode Manager or <strong>HOBOware</strong><strong>HOBOware</strong> User’s <strong>Guide</strong> 192
while the utility is running. Any data recorded while the upgrade is running will be saved and available inHOBOnode Manager once the upgrade is complete. In addition, this utility requires free disk space equivalent todouble the size of the current database. For example, if your database is 450 MB, then you will need at least 900MB free disk space on the computer for the utility to complete its process. Once the upgrade is complete, thedatabase will be close to its original size.Creating a New DeploymentThe first time you form a HOBO data node wireless network, the initial deployment, or network configuration, iscreated automatically for you. This first deployment can continue indefinitely. However, you also have the optionto create a new deployment if you need to move your current network to a new location or if you'd like toconfigure a different set of sensors in a new network, for example. This allows you to more easily distinguishbetween two separate networks or deployments of nodes when they are plotted or exported from <strong>HOBOware</strong>.You have the option of either creating a new deployment that is an exact copy of the previous one (all devices,alarms, and settings will be copied as currently configured) or consists of a new network (only system alarms andalarm logs are copied).Note: Creating a new deployment does not create a new database. All data recorded in the previous deployment issaved and can be accessed through Plot/Export Data.To create a new deployment:1. Click the Actions button in HOBOnode Manager and select Create New Deployment.2. Type a name for the new deployment. Select the Copy the current network to the new deploymentcheckbox if you want to use the current deployment as the basis for the new deployment (HOBOnodeManager will automatically be filled in with your current network devices, alarms, and settings). If youdo not copy the current network, then you will need to form a new network (only system alarms andalarm logs will appear in HOBOnode Manager). Click OK.3. A message appears indicating that the current network deployment will end and a new deploymentwill be started. Click Yes to continue, or click No to return to the Create New Deployment dialog.4. From the Device menu in <strong>HOBOware</strong>, select Manage HOBO Data Node Network to restart HOBOnodeManager.5. If you chose to copy the current network to the new deployment, then HOBOnode Manager openswith all devices listed. Plots will begin displaying the new network data at the next scheduledconnection interval. If you did not copy the old network, then you will be prompted to form a newnetwork.Both the newly created deployment and the previous deployment are listed in the Plot/Export Wireless Datawindow. Click the Plot/Export button in HOBOnode Manager to see the deployment list as shown in the examplebelow.<strong>HOBOware</strong> User’s <strong>Guide</strong> 193
Deployments are listed from newest to oldest. The initial deployment is labeled "First Deployment" by default. Anysubsequent deployments are listed with the name you entered in the Create New Deployment dialog.The start time for the current deployment (the deployment at the top of the list) is the time the new deploymentwas created, which is also the end time for the previous deployment on the list.The end time for the currentdeployment is the current time.Updating Firmware for a Receiver or Single Data NodeOccasional firmware updates may be necessary for the devices in your network. Follow these steps if you aredirected by Onset Computer to upgrade the firmware in the receiver or a single data node. To update several datanodes in the network at once, see Updating Firmware for Multiple Data Nodes.Important Notes Before you Begin:StepsUpdating the firmware generally takes two to three minutes for a receiver and four to six minutes for adata node. You cannot cancel the update process once it starts.If you need to update both the receiver and data nodes, update the receiver first to provide the bestnetwork performance. After the receiver update is complete, wait for HOBOnode Manager to display thelatest data from all the nodes. Once each node has communicated with the newly updated receiver andthe latest data appears in the device table, then you can continue with updating the firmware in thenodes.When updating the receiver firmware, the entire network will automatically shut down and restart.A data node should be powered the same way as it was when it was originally configured to ensure itremains a part of the network once the update is complete. This means a router node must be pluggedinto an AC adapter and an end‐point data node must have batteries installed and not be plugged into anAC adapter. See Determining Data Node Type for details on identifying routers and end‐point nodes inHOBOnode Manager.1. Place the firmware .hex file(s) in the appropriate directory. Do not rename the files.For Windows 7 and Windows 8: C:\Users\Public\Documents\<strong>HOBOware</strong> Public Files\FWUpdatesFor Windows XP: C:\Documents and Settings\All Users\Shared Documents\<strong>HOBOware</strong> PublicFiles\FWUpdatesFor Macintosh: /Users//Documents/<strong>HOBOware</strong>/FWUpdates2. <strong>HOBOware</strong>, HOBOnode Manager, and ZW Device Communication must be restarted to correctly identifythe firmware files. Close <strong>HOBOware</strong> and HOBOnode Manager if open. If prompted to leave the devicecommunication running in the background, click No. If <strong>HOBOware</strong> and HOBOnode Manager were alreadyclosed, but device communication was running, right‐click (or left‐click on a Mac) the <strong>HOBOware</strong> icon inthe system tray select Stop Device Communication.3. Open <strong>HOBOware</strong> and HOBOnode Manager again. Wait for new data to be updated in HOBOnodeManager.<strong>HOBOware</strong> User’s <strong>Guide</strong> 194
4. In HOBOnode Manager, double‐click the receiver (ZW‐RCVR) or node you want to update in the DeviceTable (or select the receiver or node and click Configure).5. Click the “Update device firmware” button in the Configure Receiver or Configure Node window(Configure Receiver is shown in the following example).Notes:If the “Update device firmware” button is disabled, HOBOnode Manager is still being updatedafter its restart. Keep the Configure window open and wait for a few more minutes for thebutton to become enabled.If the “Update device firmware” button does not appear, double‐check that the firmware .hexfile is in the correct directory as described in Step 1.A battery‐powered end‐point node with a current firmware version of 64 must be temporarilyconverted to an AC‐powered router node before you can update the firmware. If a messagedisplays indicating you cannot complete the update, follow the steps in Converting an End‐PointNode to a Router Node first and then repeat Steps 2 and 3 again.6. A message appears listing details about the device and any notes about the update process. Click Cancel ifyou do not want to update the device at this time. Otherwise, click Continue.7. The firmware is updated in the device; check the progress on the screen during the update as shown inthe following example of a node being updated.<strong>HOBOware</strong> User’s <strong>Guide</strong> 195
Notes:When the firmware is saved to the device, the LED will flash red on the receiver and green on a data node.A message appears at the end when the update is successfully completed.After a data node has been updated, it may to take one or two connection intervals before new data isdisplayed in HOBOnode Manager. For example, if the connection interval is set for 10 minutes, it may taketwo connection intervals, or about 20 minutes, for new data to appear. If new data still isn't appearingafter two connection intervals have passed, power cycle the data node (unplug the adapter and/orremove the batteries then plug the adapter back in and/or reinstall the batteries).If HOBOnode Manager still is not displaying data after power cycling the data node as described above orif the data node is listed as missing in HOBOnode Manager after updating the firmware, add it back to thenetwork by following these steps:1. Click the Form Network button in HOBOnode Manager.2. Press the reset button with a quick 1‐second push to reactivate the data node.3. Verify that the data node appears in the HOBOnode Manager table and is identified as a router ordata node as expected (see Determining Data Node Type). To change the type of data node, seeConverting an End‐Point Node to a Router Node or Converting a Router Node to an End‐Point Node.Updating Firmware for Multiple Data NodesOccasional firmware updates may be necessary for the data nodes in your network. If new versions of firmwarefiles are detected in the <strong>HOBOware</strong> FWUpdates directory (exact location described below), then an UpdateFirmware in Data Nodes option appears in the Actions drop‐down menu in HOBOnode Manager as shown below.<strong>HOBOware</strong> User’s <strong>Guide</strong> 196
Follow these steps if you are directed by Onset Computer to upgrade the firmware in multiple data nodes. Toupdate the firmware in the receiver or in a single data node at a time, see Updating Firmware for a Receiver orSingle Data Node.Important Notes Before you Begin:StepsFirmware .hex files must be present in the appropriate directory. (Do not rename the files.)For Windows 7 and Windows 8: C:\Users\Public\Documents\<strong>HOBOware</strong> Public Files\FWUpdatesFor Windows XP: C:\Documents and Settings\All Users\Shared Documents\<strong>HOBOware</strong> PublicFiles\FWUpdatesFor Macintosh: /Users/<user>/Documents/<strong>HOBOware</strong>/FWUpdatesIf you need to update the firmware in both the receiver and data nodes, update the receiver first for bestnetwork performance. Follow the steps in Updating Firmware for a Receiver or Single Data Node. Afterthe receiver update is complete, wait for HOBOnode Manager to display the latest data from all thenodes. Once each node has communicated with the newly updated receiver and the latest data appearsin the device table, then you can continue with updating the firmware in data nodes.A data node should be powered the same way as it was when it was originally configured to ensure itremains a part of the network once the update is complete. This means a router node must be pluggedinto an AC adapter and an end‐point data node must have batteries installed and not be plugged into anAC adapter.A battery‐powered end‐point node with a current firmware version of 64 must be temporarily convertedto an AC‐powered router node before you can update the firmware. These nodes will not be displayed inthe list of data nodes waiting for an update. Follow the steps in Converting an End‐Point Node to a RouterNode first, then update the firmware in each of these nodes one at time as described in UpdatingFirmware for a Receiver or Single Data Node.Although data will continue to be transmitted and stored in the receiver while this upgrade takes place, itwill not be available in HOBOnode Manager until after the upgrade is complete. Therefore, select a timeto perform the upgrade when you do not need real‐time access to your data.Nodes may be temporarily reported as missing after being upgraded. If you have enabled the MissingNode alarm for any nodes in your network, consider only upgrading a few nodes at a time to minimize thepotential for nodes to be reported as missing and the Missing Node alarm to trip.1. Once the firmware .hex files are in the correct location as described in the Important Notes Before youBegin, you must restart <strong>HOBOware</strong>, HOBOnode Manager, and Device Communication. Close <strong>HOBOware</strong>and HOBOnode Manager if open. If prompted to leave the device communication running in thebackground, click No. If <strong>HOBOware</strong> and HOBOnode Manager were already closed, but device<strong>HOBOware</strong> User’s <strong>Guide</strong> 197
communication was running, right‐click (or left‐click on a Mac) the <strong>HOBOware</strong> icon in the system trayselect Stop Device Communication.2. Open <strong>HOBOware</strong> and HOBOnode Manager again. Wait for new data to be updated in HOBOnodeManager.3. From the Actions menu in HOBOnode Manager, click Update Firmware in Data Nodes. If this option doesnot appear in the menu, wait for a few more minutes for HOBOnode Manager to finish updating in Step 2.If it still does not display, double‐check that the firmware .hex files are in the correct directory and repeatSteps 1 through 3 again.4. A list of all nodes waiting to be updated is displayed. Click the checkbox next to each node you want toupdate or click Select All to choose all the nodes in the list.5. Click the Updated Checked button to start the update process for all the nodes selected in the list. Eachnode will be updated one by one, with the progress displayed next to the node and a detailed progresslisted in the bottom pane of the window. Important: Clicking Cancel will not immediately stop allupdating. When you click Cancel, the node update in progress will continue until finished. The Cancelbutton will also change to read "Cancel requested." Once the update is complete for that node, theupdate for the remaining nodes will be canceled. Click the Update button to restart the update processfor the remaining nodes.Notes:6. Once the update is complete, click the Save button to save the log detailing the update procedure to atext file called "FirmwareUpdateLog.txt" (saved in C:\Users\\Documents on Windows and inthe folder on Mac). Click Close to return to HOBOnode Manager.After a data node has been updated, it may to take one or two connection intervals before new data isdisplayed in HOBOnode Manager. For example, if the connection interval is set for 10 minutes, it may taketwo connection intervals, or about 20 minutes, for new data to appear. If new data still isn't appearingafter two connection intervals have passed, power cycle the data node (unplug the adapter and/orremove the batteries then plug the adapter back in and/or reinstall the batteries).<strong>HOBOware</strong> User’s <strong>Guide</strong> 198
If HOBOnode Manager still is not displaying data after power cycling the data node as described above orif the data node is listed as missing in HOBOnode Manager after updating the firmware, add it back to thenetwork by following these steps:1. Click the Form Network button in HOBOnode Manager.2. Press the reset button with a quick 1‐second push to reactivate the data node.3. Verify that the data node appears in the HOBOnode Manager device table and is identified as arouter or data node as expected (see Determining Data Node Type). To change the type of data node,see Converting an End‐Point Node to a Router Node or Converting a Router Node to an End‐PointNode.TroubleshootingGeneral Network Connection IssuesIf you are having problems connecting data nodes to the receiver, or they are losing a connection after they havebeen joined to the network, you may be experiencing issues with a conflicting wireless device. To reset the radiochannel, double‐click the receiver row in the Device Table and in the Configure Receiver window click the Resetbutton. You will then need to form the network again.Receiver Will Not Connect to HOBOnode ManagerMake sure the USB plug is secure on both ends. Try unplugging and plugging the receiver back in.Data Node Cannot Join NetworkPositioning: If you are having trouble getting a data node to join the network, try repositioning the node within thespace. Move the data node away from any obstacles (such as metal walls, stairwells, elevator shafts) that may existbetween it and the receiver.Distance: The data node may be too far from the receiver to obtain a signal. Try moving the data node closer to thereceiver, or add a router or router/node between the data node and the receiver.Make sure the receiver is in Form Network mode (RED and GREEN LEDs alternating).Make sure you have pressed the button on the bottom of the node and that the RED and GREEN LEDs arealternating. Try pressing the button again.DebuggingThere are a number of debugging and logging options in HOBOnode Manager. If you are working with OnsetTechnical Support on an issue, you may be asked to enable debugging options and send a log file to Onset.No readings for a sensorFor external sensors, make sure the connection to the data node is secure and that you have assigned a SensorType (does not apply to the External Temp/RH Sensor).No Plot Appears for a SensorMake sure you have checked the Plot box in the Device Table for the sensor.Extreme Sensor ReadingsIf you are seeing extreme sensor readings, make sure the sensor cable is securely plugged into the node.AlarmsIf an alarm you configured is not appearing in the Alarms window, make sure the filter is set to Show all.<strong>HOBOware</strong> User’s <strong>Guide</strong> 199
Security Connection Messages on MacintoshIf the firewall setting is enabled in the security system preferences on a Macintosh, you may encounter a securitywarning message every time you open HOBOnode Manager. To turn off this message, go to System Preferences,select Security, and turn off the firewall. Note: Keeping the firewall turned on and adjusting the advanced settingsto allow all incoming connections for <strong>HOBOware</strong> does not resolve the problem.Firewall Messages on WindowsWindows Firewall must allow access to <strong>HOBOware</strong>.exe for HOBOnode Viewer to run properly. To allow <strong>HOBOware</strong>access, open Control Panel, go to Security, and select Allow a program through Windows Firewall (or clickWindows Firewall and click the Exceptions tab on some versions of Windows). Make sure <strong>HOBOware</strong> is selected inthe allowed access/exceptions list.Changing LocaleThe language in use at the time the original HOBO data node network database was created is the only languagethat can be used for that database. You cannot switch to another language. If you need to change the locale on thecomputer that contains your HOBO data node network database, you will need to:1. Back up and then move or rename the database.2. Change the locale on the computer.3. Form a new network to create a database that operates in the new locale.<strong>HOBOware</strong> User’s <strong>Guide</strong> 200
Chapter 6: ReferenceRefer to the following for details on the following: Windows Menus The Toolbar Setting Preferences Tips for Working with Multiple Loggers Setting the Language Format on Your Computer Alarm & Readout ToolWindowsRefer to the following for details on some of the windows in <strong>HOBOware</strong>: Plot Setup Merge Series Filter Series Select Channel to ConfigureThe Plot Setup WindowAfter you read out a logger or open a saved datafile, the Plot Setup window appears.1. Select Series to Plot: Select the series you want to plot and the units, if applicable.<strong>HOBOware</strong> User’s <strong>Guide</strong> 201
2. Select Internal Logger Events to Plot: Select internal logger events to plot (only available for someloggers).3. Offset from GMT: Set the Time Zone Offset from GMT if required.4. Plot Button: Click this button to plot the selected data on a graph.5. Help: Click to launch the Help for the Plot Setup window.6. Data Assistants (<strong>HOBOware</strong> Pro Only).<strong>HOBOware</strong> Pro Data Assistants let you create new data series by combining data recorded by thelogger with additional data. See Data Assistants for more information.NOTE: The following Data Assistant can also be run from the Launch window: Pulse Scaling, LinearScaling, kWh.Merge Series Setup WindowUse the Merge Series Setup window to combine multiple datafiles from a deployment into one file.To merge files:1. Select the series to plot. All series available in the selected datafiles are listed in the Select Series toPlot section. Click the checkbox to add or remove series as necessary, or select the All or Nonebuttons in that section to select all series or no series accordingly.All matching series available in the selected series will be populated with the corresponding serieslisted in the Merge With column. Each new series can only be merged with the series of the samemeasurement type and units. If no matching series is available in the plot, the Merge With column willdisplay No Series for that series. If a matching series is found, you can still append the series withoutmerging by choosing No Series from the corresponding drop‐down list in the Merge With column. Theseries will be appended to the plot without being merged with any series.2. Select any internal logger events to plot, if applicable. All events available to plot are listed in theSelect Internal Logger Events to Plot section. Click the checkbox to add or remove each event as<strong>HOBOware</strong> User’s <strong>Guide</strong> 202
necessary, or select the All or None buttons in that section to select all events or no eventsaccordingly.3. Click the Plot button to merge the selected series with their matching series. Save the new plot as aproject file if desired.The Filter Series WindowYou can create a new series based on statistical analysis of an existing series over specified periods of time.NOTE: When you apply a filter, the graph rescales to accommodate all of the displayed data.1. Statistic TypeChoose the type of statistic to use for the filter:For sensor series, you can create a series showing the minimum, maximum, or average over a periodof time.For external event series, you can create a series showing a cumulative sum, or a count over a periodof time.For internal event series, you can create a series showing a count over a period of time.For series created by Data Assistants, additional filters may be available (<strong>HOBOware</strong> Pro Only).2. IntervalSpecify the interval over which you want these values to be calculated.3. Resultant Series NameEnter a new Resultant Series Name, if desired.4. Click OK.The new series is added to the graph, the Details pane, and the Points pane.Select Channel to Configure Window1. Click the plus sign next to the module/sensor name to see available channels.2. Select the desired channel.3. Click on the button for the action you want to perform: Disable, Configure, Refresh.If you click Configure, the Configure Channel window appears.<strong>HOBOware</strong> User’s <strong>Guide</strong> 203
MenusThe following menus are available in <strong>HOBOware</strong>: <strong>HOBOware</strong> (on Macintosh) File Device Edit View Tools Window HelpThe <strong>HOBOware</strong> MenuThe <strong>HOBOware</strong> menu is available on Macintosh only. Some of the menu options available from the File menu inWindows are displayed here instead on Macintosh.The <strong>HOBOware</strong> menu options are: About <strong>HOBOware</strong>. Select this option to open a compatible datafile. See Opening Files for moreinformation. Preferences. Select this option to open the Preferences window where you can change the defaultsettings in <strong>HOBOware</strong>. See Setting Preferences for more information. Services. This is a Macintosh operating system menu option. Hide <strong>HOBOware</strong>. This option hides <strong>HOBOware</strong> from view. Hide Others. This option hides all currently open programs except for <strong>HOBOware</strong> from view.<strong>HOBOware</strong> User’s <strong>Guide</strong> 204
The File Menu Show All. This option displays all currently open programs. Quit. Select this option to close <strong>HOBOware</strong>.From the File Menu, you can open and close datafiles and projects, import and export data, and print plotelements.The File menu options are: Open Datafile(s). Select this option to open a compatible datafile. See Opening Files for moreinformation. Merge Datafile(s). Select this option to add a datafile to the end of another datafile. See MergingDatafiles for more information. Open Project. Select this option to open a <strong>HOBOware</strong> project. See Opening Files for moreinformation. Plot/Export Wireless Data. This applies to a ZW series wireless network and is only available in<strong>HOBOware</strong> Pro. See Plotting or Exporting Wireless Data for more information. Recent Files. Select this option to quickly access the last 10 files you opened. Close. Select this option to close the active file or project. Close All. Select this option to close all open files and projects. Save Datafile. Select this option to save the active datafile. Save Project. Select this option to save the active project. Import Text Data. Select this option to import and graph non‐<strong>HOBOware</strong> data in certain text files(available in <strong>HOBOware</strong> Pro only). See Importing Text Files for more information. Import Text File from HOBOlink. Select this option to open a text file generated by HOBOlink for aHOBO U30 Station.<strong>HOBOware</strong> User’s <strong>Guide</strong> 205
Export Details. Select this option to export the information in the Details Pane into a text file thatcan be opened in any text editor or imported into many other types of programs (word processors,spreadsheets, etc.). See Exporting Details for more information. Export Table Data. Select this option to export the points shown in the Points table to a text file(.csv or .txt) or Microsoft Excel (.xls) file. See Exporting Table Data for more information. Page Setup. Select this option to set up the paper size, margins, and orientation for printing a plot. Print Preview. Select this option to preview the page for printing a plot. Print. Select this option to print a prot. Print Details. Select this option to print the Details Pane. Print Points. Select this option to print the Points Table. Preferences. Select this option to open the Preferences window where you can change the defaultsettings in <strong>HOBOware</strong>. See Setting Preferences for more information. Note that Preferences isavailable from the <strong>HOBOware</strong> menu on Macintosh. Quit. Select this option to close <strong>HOBOware</strong>. Note that this is available from the <strong>HOBOware</strong> menu onMacintosh.The Device MenuUse the Device menu to launch, read out, and stop loggers as well as access HOBOnode Manager and work withother features for specific devices.The Device menu options are: Launch. Select this option to open the Launch Logger window where you can set launch settings andstart the logger. Readout. Select this option to offload, or read out, data from the logger to your computer, allowingyou to save the data in a datafile and view the plot in <strong>HOBOware</strong>. Status. Select this option to view the current status of the logger, including current readings (forsome sensors), remaining battery, and logger memory. Stop. Select this option to stop a device. Manage Shuttle. Select this option to manage a HOBO shuttle (available for <strong>HOBOware</strong> Pro only).See Working with a Shuttle for more information. Manage HOBO Data Node Network. Select this option to open the HOBOnode Manager whereyou can manage a ZW series wireless network (available for <strong>HOBOware</strong> Pro only).<strong>HOBOware</strong> User’s <strong>Guide</strong> 206
The Edit Menu Configure Modules/Ports. Select this option to configure analog sensor ports on the HOBO U30station logger or FlexSmart modules (available for <strong>HOBOware</strong> Pro only). Manage U30. Select this option to access features specific to the HOBO U30 Station. From this menuoption, select Control U30 Relay to configure the default state of a relay or to activate or deactivatethe relay for testing (available for <strong>HOBOware</strong> Pro only). See Controlling the Relay on the HOBO U30Station for more information. Or, select Configure U30 Alarms to set up alarms on the HOBO U30Station (available for <strong>HOBOware</strong> Pro only). Lab Calibration. Use this option to open the Lab Calibration tool used with the HOBO U26 DissolvedOxygen Logger. Select Device. Use this option to select a device currently connected to the computer. Default Action. Select this option to set up <strong>HOBOware</strong> to perform the same action (Launch, Readout,or get Status) every time a logger is connected (available for <strong>HOBOware</strong> Pro only). See Repeating anAction on Multiple U‐Series Devices for more information. Utilities. Use the Utilities submenus to select one of the three Force Offload options only if you arehaving problems reading out your device or as directed from Onset Technical Support. You can alsoselect the Reset UX Logger submenu option as directed by Onset Technical Support.Use the Edit menu to modify the plot, including filtering series, removing series, setting properties, and convertingunits.The Edit menu options are: Filter Series. Select this option to create a new series based on statistical analysis of an existing seriesover specified periods of time. See Filtering a Series for more information. Copy Series. Select this option to copy a series and then paste it into another plot. See Copying aSeries to another Plot for more information. Paste Series. Select this option to paste a series into another plot. See Copying a Series to anotherPlot for more information. Add Graph Label. Select this option to access the Graph Label Properties window to add labels to aplot that identify specific points or call attention to a region of the graph. See Adding Labels to aGraph for more information. Remove Series. Select this option to remove series from a plot after you have selected it in thegraph or the Details pane. If you remove a series, it can only be recovered by reopening the originaldatafile or a saved project file that contains the series. Graph Properties. Select this option to access the Series Properties window. See Setting SeriesProperties for more information.<strong>HOBOware</strong> User’s <strong>Guide</strong> 207
Convert Units. Select this option to access the Convert Plot window, which allows you to convertsome or all of the series on the currently focused plot to other units (for example, from degreesFahrenheit to degrees Celsius). Note that changing the units will result in the entire plot beingredrawn. See Converting Units for more information. Undo Action. Select this option to undo the last change made to the current plot. The most recentchange is listed after the Undo Action menu choice. In this example, the most recent change to theplot was to "Zoom Out." See Undo and Redoing Plot Changes for more information. Redo Action. Select this option to redo the last change that was previously undone. See Undo andRedoing Plot Changes for more information. Copy Graph to Clipboard. Select this option to copy the graph to the clipboard to paste it intoanother application.The View MenuUse the View menu to change the appearance of the plot, including zooming, showing or hiding components,marking points, and setting gridlines.The View menu options are: Zoom In. Select this option to zoom in on the plot. Zoom Out. Select this option to zoom out on the plot. View Full Scale. Select this option to view the plot in full scale. Details Pane. Select this option to show or hide the Details Pane. Points Table. Select this option to show or hide the Points Table. Show Title. Select this option to show or hide the title of the plot. Show Legend. Select this option to show or hide the plot legend. Mark All Points. Select this option to mark all points on the plot. Vertical Gridlines. Select this option to show or hide vertical gridlines on the plot. Horizontal Gridlines. Select this option to show or hide horizontal gridlines on the plot.<strong>HOBOware</strong> User’s <strong>Guide</strong> 208
Select None. Select this option to deselect all elements in the plot. Remove Crosshair. Select this option to remove crosshairs from the graph. Remove Subset Stats. Select this option to remove subset statistics from the plot. Bring Series To Front. Select this option to bring a series to the front on the plot on top of all otherseries. Send Series To Back. Select this option to send a series to the back of the plot behind all otherseries.The Tools MenuUse the Tools menu to access the Bulk File Export tool, which allows you to export numerous datafiles at one time.See the Bulk Export Tool for more information.Note: The Alarm & Readout Tool is also available from this menu if it was installed in older version of <strong>HOBOware</strong>Pro. This tool is no longer installed as of <strong>HOBOware</strong> version 3.4.The Window MenuUse the Window menu to organize several plots.The Window menu options are: Tabbed View. With this option, plots are layered as tabs so you can see the file name of each openplot (or "Untitled*" for an unsaved datafile). You can also get to this view by clicking the Tabs icon inthe lower left of the window. Tile Horizontally. Select this option to arrange up to five plots horizontally. If six or more plots areopen, they will be tiled as a grid. You can also get to this view by clicking the Horizontal Tile icon in thelower left of the window. Tile Vertically. Select this option to arrange up to five plots vertically. If six or more plots are open,they will be tiled as a grid. You can also get to this view by clicking the Vertical Tile icon in the lowerleft of the window.Tip: You can open the same datafile multiple times to create different views of the graph, then use the Tilecommands on the Window menu (or resize and move the windows manually) to see all of them at once. This ishelpful if you want to zoom in on several different areas and view them side‐by‐side, see the detail of a small areawhile the full graph is still in view, or view each series in a different window.The Help MenuUse the Help menu to get more information about <strong>HOBOware</strong>, upgrade the software and certain devices, andrequest help from Onset Technical Support.<strong>HOBOware</strong> User’s <strong>Guide</strong> 209
The Help menu options are:The Toolbar <strong>HOBOware</strong> Help. Select this option to open the help system, displaying the full table of contents. Check for Software Updates. Select this option to check if there are any <strong>HOBOware</strong> updatesavailable on the Onset website. You can also set the general startup settings in Preferences toautomatically check for software updates on a schedule that you select. Update Device Firmware. Select this option to check if there are firmware updates available forcertain devices. This option is only enabled when either a HOBO U‐Shuttle or HOBO UX series logger isconnected to the computer. Select the appropriate submenu for your device, either "Update U‐DT‐1/U‐DT‐2 Firmware" for a HOBO U‐Shuttle or "Update UX Series Logger Firmware" for UX90 series,UX100 series, and UX120‐017 loggers. You likely will only need to do this as directed by OnsetTechnical Support. Note that firmware updates for HOBO ZW series receivers and data nodes arecompleted within HOBOnode Manager. Manage License Key. Select this option if you need to enter a new license key. This is only necessaryif you are running a trial version of <strong>HOBOware</strong> and have a new license key to enter, or if you are using<strong>HOBOware</strong> Lite and have a license key to upgrade to <strong>HOBOware</strong> Pro. Enable/Disable Logging. Select this option to turn on or off logging within <strong>HOBOware</strong>. Whenlogging is enabled, a series of text files will be generated and saved every time you use <strong>HOBOware</strong>. Itis recommended that you only enable logging when requested to do so by Onset Technical Support,who may need additional files to troubleshoot any technical problems you may be having with thesoftware. Submit Technical Support Request. Select this option if you are having a problem with <strong>HOBOware</strong>and would like to request help from Onset Technical Support. Fill in all the requested information inthe form, including your name, email address, logger/device model name and serial number, and adetailed description of the problem you are encountering. About <strong>HOBOware</strong>. Select this option to see which version of <strong>HOBOware</strong> you are using in Windows.This option is available from the <strong>HOBOware</strong> menu on Macintosh.The toolbar, located at the top of the main <strong>HOBOware</strong> window, allows point‐and‐click access to the mostfrequently used functions. Pause the pointer over each icon on the toolbar for a description of each tool.Launch ‐ Opens the Launch window.Readout ‐ Opens the Readout window.Status ‐ Opens the Status window, which displays the logger's state and current readings.Stop ‐ Stops a logging logger.<strong>HOBOware</strong> User’s <strong>Guide</strong> 210
Select Device ‐ Opens the select Device window, which displays available devices. For <strong>HOBOware</strong> Pro, theaccompanying pulldown menu allows you to specify whether you want <strong>HOBOware</strong> to look for USB devices, serialdevices, or both.Set Default Units ‐ Change the default unit type between US and SI. Any changes you make will take effectwith the next plotted file.Undo Action ‐ Undoes the most recent change made to the plot.Redo Action ‐ Redoes the most recent change that was undone to the plot.Open ‐ Launches the Open window, from which you can open <strong>HOBOware</strong> files.Save ‐ Opens the Save window, from which you can save the plot as a project (.hproj) file.Close ‐ Closes the currently focused plot.Export ‐ Opens the Export Options window, from which you can configure settings for exporting a text file ofthe data (in .csv or .txt format) for use in spreadsheet and other applications.Print ‐ Prints the graph as it appears on your screen.Arrow ‐ Launches the Arrow Tool, which you can use to point to and select items on the graph to edit theirproperties.Crosshair ‐ Launches the Crosshair Tool, which you can use to display values for points on the graph and crossreferencesthem to cells in the Points pane.Hand ‐ Launches the Hand Tool, which you can use to scroll an axis or the entire graph.Zoom ‐ Launches the Zoom Tool, which you can use to adjust the scaling of an axis or the entire graph.Subset Statistics ‐ (<strong>HOBOware</strong> Pro Only) Launches the Subset Statistics Tool, which you can use to view statisticsfor a particular time span.In ‐ Launches the Zoom In Tool, which allows you to zoom in on a smaller area of the graph.Out ‐ Launches the Zoom Out Tool, which allows you to zoom out to a larger area of the graph.Show Graph at Full Scale ‐ Resets the scale of a graph to accommodate all of the displayed data.Graph Properties ‐ Opens the properties window for the element currently selected (such as series, legend,axis).Vertical Gridlines ‐ toggles vertical gridlines on or off.Horizontal Gridlines ‐ toggles horizontal gridlines on or off.Mark Points ‐ toggles point markers on or off.Units ‐ Opens the Convert Units window, which allows you to convert some or all of the series on the currentlyfocused plot to other units (for example, from degrees Fahrenheit to degrees Celsius).Filter Series ‐ You can create a new series based on statistical analysis of an existing series over specifiedperiods of time.<strong>HOBOware</strong> User’s <strong>Guide</strong> 211
Pie Chart ‐ Opens the Pie Chart window in which you can view, print, and save a pie chart for plotted stateseries.Add Graph Label ‐ Opens the Graph Labels Properties dialog, which allows you to add a label to the plot or toa specific series, and change the appearance of that label.‐ Help ‐ opens the Help.The Arrow ToolThere are two ways to select the arrow tool: Click the Arrow iconon the toolbar; or Press the A key on your keyboardTip: If you are currently using another tool and do not want to switch tools, you can press the N (next) key on yourkeyboard to select each graph item (including hidden items, such as value axes for states or events) in sequence.The selected item (if visible) is shaded or boxed. You can then right‐click the selected item, double‐click it, or pressthe Enter key on your keyboard to open the Properties window for that item.To deselect, click an area within the axes that does not have series data; click the View menu and choose SelectNone; or press D on your keyboard.Using the Crosshair ToolUse the crosshair tool to zero in on a specific date and time in the plot and any data points associated with thatdate and time.1. Select the crosshair tool:Click the Crosshair iconon the toolbar, or press the C key on your keyboard2. Click a point on the graph to mark it.3. Click another point to move the marker.NOTE: When you click on a graph, <strong>HOBOware</strong> selects the nearest data point. When series are very close together,and the location you click is between two points, it is possible that the nearest point is not on the series youclicked.You can also mark the point on the graph by clicking the corresponding cell in the Points table.ScrollingNormally, if you are zoomed in and click a point in the Points table that is outside the zoom area, <strong>HOBOware</strong> willscroll to the marked point's area of the graph. If you do not want <strong>HOBOware</strong> to scroll, change the setting underPoints Table & Details Pane on the Plotting preference pane.Changes to PlotThe plot changes in several ways when the crosshair is in use. The Points pane shifts to the row that contains thedata point. Where the crosshair intersects a data point, a square surrounds the data point. The intersection pointsare also marked by small color‐coded arrows on the left and right value axes.LegendIf the legend is displayed next to the graph, the point values for each series are updated to reflect the crosshairlocation. Values are listed in the legend differently depending on whether the data is a logged sample, state, orevent:<strong>HOBOware</strong> User’s <strong>Guide</strong> 212
Values that are not in parentheses are actual data points logged at the time selected by the crosshair. Values in parentheses are estimated because there were no exact values for the series at the timeselected by the crosshair. Zoom in or move the crosshair to see actual values. A value of "…" indicates that there is no series data during the time selected. This is seen mostfrequently for events. If the time selection falls within an event series, but does not contain an event,parentheses surround the "…" value. A value of "logged" indicates an internal logger event happened at the selected time.NOTE: The legend must expand in height to list the point values. If your application window is too small toaccommodate the expanded height, the values will not be added to the legend. You can still refer to the Pointstable to find the values of the selected points.Removing the CrosshairTo remove the crosshair from the graph, right‐click on the graph and select Remove Crosshair from the pop‐upmenu. Or, choose Remove Crosshair from the View menu.The Zoom ToolOverviewUse the zoom tool to focus on one area of the graph, allowing you to see more detail.NOTE: Zooming will not work on an axis that is locked. To unlock an axis, double‐click the axis with the arrow tooland clear the checkmark next to Lock Axis Scaling and Tick Marks.Using the Zoom ToolTo select the zoom tool: Click the Zoom iconon the toolbar; or Press the Z key on your keyboard.ToggleRight‐click to toggle between zoom in and zoom out.Zoom DirectionCheck the symbol inside the zoom tool to determine the direction you are zooming. A plus sign (+) or arrowspointing outward will zoom in, while a minus sign (‐) or arrows pointing in will zoom out.LevelClick an area on the graph inside the axes to zoom one level (a factor of two). Continue clicking to zoom multiplelevels.Zoom ContinuouslyHold down the left mouse button in one location to zoom continuously. Release the mouse button to stopzooming.Zoom in AreaHold down the left mouse button while drawing a rectangle around the area you wish to zoom in on, then clickinside the rectangle. The area inside the rectangle expands to fill the whole graph.Restrict MotionHold down the X key while zooming to restrict motion horizontally. Hold down the Y key while zooming to restrictmotion vertically.Tips:<strong>HOBOware</strong> User’s <strong>Guide</strong> 213
If you are currently working with the crosshair, arrow, or hand tool, you can click the Zoom In/Outicons and on the toolbar to quickly zoom into and out of the middle of the display withoutchanging tools. When you first display a graph, the numerical bounds of the axes are on tick marks. After you havepanned or zoomed, this may no longer be the case. Use smart scaling to correct that. With the hand,arrow, or crosshair tool, right‐click anywhere on the graph and select SmartScale Graph. This willautomatically adjust the axes to end on tick marks. You can always return to the original plot view by clicking the View at Full Scaleor the View menu.from the toolbarThe Hand ToolOverviewUse the hand tool to move different areas of the graph into view or adjust the position of one series so it can beviewed more easily. This is particularly useful when you are zoomed into the graph and want to see anothersection of the graph without zooming out and then zooming back in on the new location.NOTE: Panning will not work on an axis that is locked. To unlock an axis, double‐click the axis with the arrow tooland clear the checkmark next to Lock Axis Scaling and Tick Marks.Using the Hand ToolThere are two ways to select the hand tool: Click the Hand iconon the toolbar; or Press the H key on your keyboard.Pan Across GraphClick within the graph and hold down the left mouse button to pan a different section of the graph into view. Thegraph follows the movement of the mouse, and the axes are continuously updated in response to the movement.To stop dragging, release the left mouse button.Restrict MotionHold down the X key while dragging to restrict motion horizontally. Hold down the Y key while dragging to restrictmotion vertically.Pan One Series at a timeClick the axis associated with the series and hold down the left mouse button. Only the series connected with theaxis will follow the movement of the mouse.Tips: When you first display a graph, the numerical bounds of the axes are on tick marks. After you havepanned or zoomed, this may no longer be the case. Use smart scaling to correct that. With the hand,arrow, or crosshair tool, right‐click anywhere on the graph and select SmartScale Graph. This willautomatically adjust the axes to end on tick marks. You can always return to the original plot view by clicking the View at Full Scaleor the View menu.from the toolbarSetting PreferencesYou can change the default behavior of <strong>HOBOware</strong> in the categories listed below. Preference settings are uniquefor each user login on your computer. The following categories are available:<strong>HOBOware</strong> User’s <strong>Guide</strong> 214
General. Set preferences for Launch Time‐Savings Options, Readout Time‐Savings Options, Open FileTime‐Saving Options, Export Settings, Selecting Devices, File Associations, Startup, Data Verification,and Data Encoding. Communications. Set preferences for Device Types , Serial Ports, Device Speeds, and Other Options. Plotting. Set preferences for Fonts, Lines, Value Axis, Layout, Points Table and Details Pane, Gridlines,Plot Setup, Other Options, Undo & Redo. Data Assistants. Set show/hide preferences for <strong>HOBOware</strong> Pro Data Assistants. Display. Set preferences for Default Unit System, Date/Time, and Series. Warnings. Set preferences for various warning types. Data Nodes. Set preferences for HOBOnode Manager, including General, Alarms, Real‐Time Plots,Data Storage, and Sharing (<strong>HOBOware</strong> Pro only). Alarms. Set preferences for the Alarms & Readout Tool, including Alarm Conditions, Readouts,Notifications, Messages, and Warnings (<strong>HOBOware</strong> Pro only). IMPORTANT: The Alarm & Readout Toolis no longer installed with <strong>HOBOware</strong> as of version 3.4. Information in the help system is included forreference only for existing Alarm & Readout Tool users. Bulk Export. Set YAML preference for Bulk Export Tool (<strong>HOBOware</strong> Pro only).Some preferences have one of the following icons next to them, indicating a difference in behavior between<strong>HOBOware</strong> and HOBOnode Manager (<strong>HOBOware</strong> Pro only).You can save preference settings and reload them as needed (<strong>HOBOware</strong> Pro only). Click the Save Preferencesbutton at the top of the Preferences window and type a name in the pop‐up field to save all currently selectedpreferences. You can then click the Load Preferences button and select the name you typed in to load thosepreference settings back into the Preferences window.See also: Restoring Default PreferencesGeneral PreferencesUse the General category within Preferences to control a variety of <strong>HOBOware</strong> behavior, including launching,reading out, opening files, exporting, selecting devices, and more.To change these settings:1. From the File menu on Windows or the <strong>HOBOware</strong> menu on Macintosh, select Preferences.2. Select the General category on the left and then click the subcategory you wish to change.3. Adjust any of the settings described below and then click OK.Launch Time‐Saving Options (<strong>HOBOware</strong> Pro only) When launching. Select "Show launch screen" to display the Launch Logger window when you selectLaunch from the Device menu or click the Launch icon on the toolbar, or select "Automaticallylaunch" to bypass this window and launch the logger with the default settings. Selecting"Automatically launch" is particularly useful if you want to launch several loggers quickly withoutchanging any settings. The default settings are determined by the "Fill launch window with contentsof" preference.<strong>HOBOware</strong> User’s <strong>Guide</strong> 215
For <strong>HOBOware</strong> Pro only: If you select "Automatically launch" and also set the Default Action from theDevice menu to Launch, this feature allows you to launch several U‐Series loggers in a row simply byconnecting and disconnecting each logger to the computer. Fill launch window with contents of. Select "Current logger" to show the logger's most recentlaunch settings (as stored in the logger memory) in the Launch Logger window. Select "Previouslaunch" to show the same settings used in the most recent launch. This is helpful if you want to launchseveral loggers of the same type with similar settings or if you want to set up several loggers to startat the same time with the same logging interval. An indicator on the Launch Logger window willremind you when this preference is use. Note that "Previous launch" does not apply if you arelaunching different types of loggers; instead the settings in the logger's memory will be used. Default launch type. This preference controls what displays by default in the "Start logging" field inthe Launch Logger window"Previous launch type" is selected, then the "Start logging" field will displaythe same setting used for the logger's last launch. For example, if the logger was last configured tostart logging "Now" selected, then the "Start logging" field will default to "Now" for the next launch.Note that if the previous launch was set to start "At interval," the "Start logging" field will default tostart "On Date/Time." If "Launch now," "Launch at interval," "On specified date/time," or "Button orcoupler start" is selected, then that launch type will automatically be selected in the "Start logging"field in the Launch Logger window regardless of how the logger was previously launched. Note that ifyou choose "Button or coupler start" and the logger does not support that feature, then the "Startlogging" field will default to "Now." Important: If you set the "Fill launch window with contents of"preference to "Previous launch," then the "Default launch type" preference will be ignored in favor ofthe "Start logging" setting used in the last launch. Logger launch description. This preference controls what displays by default in the Description fieldin the Launch Logger window. If you select "Default launch description," then the Description field willdisplay the description used the last time the logger was launched. If you select "Logger S/N," then thelogger serial number will automatically be listed in the Description field. Selecting "Logger S/N" canhelp to easily differentiate files when launching and reading out several loggers of the same type.Note that whatever is listed in the Description field is also used as the default file name when readingout and saving the logger data.Readout Time‐Saving Options (<strong>HOBOware</strong> Pro only) When saving datafile. This preference controls whether the Save window displays automaticallywhen reading out a file. Select "Show save dialog" if you want the Save window to display every timeyou read out a logger and specify a location and name for the file, or accept the default file name.Select "Automatically save" if you do not want to display the Save window during the readout process.The file will automatically be saved with the default name (the description in the Launch Loggerwindow) and in the default location (as described in Reading Out the Logger). When plotting. This preference controls the default plot behavior when reading out a logger. Select"Show plot setup" to display the Plot Setup window after reading out and saving the file. Select"Automatically plot" if you want to bypass the Plot Setup window and instead automatically plot thedata after reading out and saving the file. This option is not recommended if you will be using DataAssistants, which are accessed through the Plot Setup window. Select "Do not plot" if you do not wantto plot the data at all. This is useful if you are reading out several loggers and prefer to look at theplots later. You can always open the saved datafile and plot it at that time.<strong>HOBOware</strong> User’s <strong>Guide</strong> 216
For <strong>HOBOware</strong> Pro only: You can adjust the Readout Time‐Saving Options and set the Default Action fromthe Device menu to Readout to quickly read out several U‐Series loggers in a row by connecting anddisconnecting each logger to the computer. To do this choose "Automatically save" for "When savingdatafile," choose "Do not plot" for "When plotting," and deselect the "Ask to stop logging before readingout a running logger" checkbox. Ask to stop logging before reading out a running logger. When this checkbox is selected, amessage appears every time you read out a logger that is still recording data. The message askswhether you want to stop the logger or let it continue logging data during the readout process. If youdeselect this checkbox, a logger that is still recording data will automatically continue logging duringreadout.Open File Time‐Saving Options (<strong>HOBOware</strong> Pro only)This preference controls whether the Plot Setup window is automatically displayed when opening a file. Select"Show plot setup" if you want the Plot Setup window to display every time you open a file. Select "Automaticallyplot" if you want to bypass the Plot Setup window and automatically generate the plot each time you open the file.This is not recommended if you will be using Data Assistants, which are accessed through the Plot Setup window.Export SettingsSee Export Settings for details on the preferences in this subcategory.Selecting DevicesThis preference controls when the Select Device window is displayed. If you select "Show Select Device window iftwo or more devices are found, even if one is already selected," then the Select Device window will display anytime more than one device is connected to the computer. This allows you to choose the device you want to workwith any time you select Launch, Readout, Status, or Stop from the Device menu. If you select "Only show SelectDevice window if a device has not been selected," then the Select Device window will only display the first timeyou select Launch, Readout, Status, or Stop. That device will then remain selected until you change it with theSelect Device iconon the toolbar.File Associations<strong>HOBOware</strong> User’s <strong>Guide</strong> 217
Use this preference to control the association of <strong>HOBOware</strong> file types on Windows. Note: You must haveadministrator privileges on the computer to change file type associations. To temporarily run <strong>HOBOware</strong> as anAdministrator, right‐click the <strong>HOBOware</strong> icon and select Run as Administrator. Enter the Administrator name andpassword as prompted.Be default, files with the extensions of .hobo, .hsec, and .hproj (HOBO files) and .dtf and .dsec (DTF files;<strong>HOBOware</strong> Pro only) are automatically associated with <strong>HOBOware</strong>. This means that these files are identified by a<strong>HOBOware</strong> icon and can be opened by double‐clicking them. Click the Map or UnMap buttons to change the filetype associations.Startup Show splash screen on startup. This preference controls whether the <strong>HOBOware</strong> graphic, or splashscreen, appears every time you open the software. Check for <strong>HOBOware</strong> updates. This setting controls how frequently, if it all, <strong>HOBOware</strong>automatically checks the Onset website for any software updates. The default setting is once perweek. When checking for <strong>HOBOware</strong> updates (<strong>HOBOware</strong> Pro only). These settings control whetheryou are notified about all new software updates or only those that affect the currently installedcomponents. The default is to check for any new updates.Data Verification (<strong>HOBOware</strong> Pro Only)Select this option to enable Secure Mode and have <strong>HOBOware</strong> Pro add a digital signature to new datafiles whenyou read out loggers (for environments where 21 CFR Part 11 is being employed). The digital signature is indicatedby a filename extension of .hsec for hobo files and .dsec for dtf files. The signature will be verified each time youopen the datafile to ensure its integrity. This option is disabled off by default.Data EncodingData encoding controls how special characters are displayed in files that are imported into and exported from<strong>HOBOware</strong>. The default is to use UTF‐8, a common character encoding protocol for software. Select "Windowsdefault" if characters are not displaying correctly in imported and exported files in Windows.<strong>HOBOware</strong> User’s <strong>Guide</strong> 218
Export SettingsUse the Export Settings preferences to customize how data is formatted when you export the table data from aplotted <strong>HOBOware</strong> file. To access these settings:1. From the File menu on Windows or the <strong>HOBOware</strong> menu on Macintosh, select Preferences.2. Select the General category and then click Export Settings.3. Adjust any of the settings described below and then click OK. Use classic export settings. Click this button to change the export settings to the default settingsused with BoxCar Pro software, which is Onset legacy software released before <strong>HOBOware</strong>. Export file type. Select how you want exported data to be saved: either to a text file (.csv or .txt) or aMicrosoft Excel file (.xls). Export table data column separator. This setting controls the column separator for exported textfiles. (If you selected Excel for the export file type, then this option is disabled.) Select Comma, Tab, orSemicolon. When Comma is selected as the column separator, the data will be saved to a .csv file thatcan be imported into Excel. When Tab or Semicolon is selected, the data will be saved to a .txt file.<strong>HOBOware</strong> User’s <strong>Guide</strong> 219
See also: Include line number column. By default, exported files include line numbers. Uncheck this box ifyou do not want line numbers in the file (for example, to export in BoxCar Pro software format). Include plot title in header. Uncheck this box if you do not want the plot title included in theheader of the exported file. This option is primarily for compatibility with the BoxCar Pro softwareformat. Always show fractional seconds. Check this box to show fractional seconds in the time‐stampeddata points. This is primarily for compatibility with the BoxCar Pro software format. Separate date and time into two columns. By default, the date and time of a logged data point isexported as a single column to facilitate graphing in spreadsheet programs. Check this box to split thedate and time into two columns. No quotes or commas in headings, properties in parenthesis. Check this box if you do not wantquotations marks and commas in the exported file's column headers. Sensor properties, or units,(such as °F or RH) will be listed in parenthesis instead of quotation marks when this setting is enabled.This option is primarily for compatibility with the BoxCar Pro software format. Include logger serial number. When this setting is enabled, the logger's serial number will be listedin each column header in the exported file. This is useful if you are exporting data series that werecopied and pasted from plots that originally came from different loggers. Include sensor serial number, or label (if available) (<strong>HOBOware</strong> Pro only). When this setting isenabled, each sensor's serial number or label (if available) will be listed in each column header in theexported file. This is especially useful when exporting data from multiple sensors recording the samemeasurement type (for example, three temperature sensors). Note: If "No quotes or commas inheadings, properties in parenthesis" is selected, the label (if available) will be added to the columnheader instead of the sensor serial number. Date format. Select the format in which you want the date to be shown (Month, Day, Year; Day,Month, Year; or Year, Month, Day). Date separator. Select either a slash ( / ) or a dash ( ‐ ) to separate the months, day, and year in thedate format. Time format. Select whether to show the time in a 12‐hour or 24‐hour format. Positive number format. Select the format in which positive numbers are displayed (for example:1,234.56; 1 234,56; 1.234,56; or 1.234 56). Negative number format. Select the format in which negative numbers are displayed (for example:‐123, 123‐, or (123). Automatically export table data upon reading out a logger. Select this option if you want<strong>HOBOware</strong> to automatically create an export file each time you read out a logger (note that you mustsave and plot the data before the exported file will be created). When this setting is enabled, thedefault option is to export the data to a single file (as controlled by "Bypass export dialog and save assingle file"). This will result in an exported file saved in the same directory as the datafile offloadedfrom the logger. Both files will also have the same prefix. If you want to break up the exported datainto multiple files, then select "Show export dialog" instead. It is only necessary to save multiple files ifyou are using a version of Excel earlier than 2007 or if the data file contains more than 1,000,000points. General Preferences: Data encoding settings<strong>HOBOware</strong> User’s <strong>Guide</strong> 220
Communications PreferencesUse the Communications category within Preferences to set the default device type, serial port, device speed, andstatus window operation.To change these settings:1. From the File menu on Windows or the <strong>HOBOware</strong> menu on Macintosh, select Preferences.2. Select the Communications category on the left and then click the subcategory you wish to change.3. Adjust any of the settings described below and then click OK.Device Types (<strong>HOBOware</strong> Pro Only)This preference controls the type of devices <strong>HOBOware</strong> recognizes when connected to the computer: USB, serial,or both. If you only use USB loggers or serial loggers, select the corresponding preference. This will save time as<strong>HOBOware</strong> will only check the USB or serial port(s) for a connected device when selecting Launch, Readout, Status,or Stop from the Device menu. If you use both USB and serial loggers regularly, select "USB and serial devices." Youcan also quickly change this preference by using the pull‐down menu next to the Select Device icontoolbar.on theSerial Ports (<strong>HOBOware</strong> Pro Only)This preference controls which serial ports you want <strong>HOBOware</strong> to check for a connected device. Click Select All tocheck all serial ports displayed in this list or choose specific serial ports. Note that if you want to use only one port,you can have only one serial logger connected at a time. Alternatively, checking multiple serial ports can causeslow performance even when no loggers are connected.Device Speeds Serial port speed. Select "Fast serial enabled" (<strong>HOBOware</strong> Pro only) to read out a serial logger at aspeed appropriate for most systems. Disable this option only if you are having communicationproblems with the logger, such as when the logger is connected via a slow serial‐to‐LAN bridge device.Communication between the computer and the logger is slower when this option is disabled. USB logger readout. Select "Fast readout enabled" to read out a USB logger quickly. Disable thisoption only if you are having communication problems with the logger. Communication between thecomputer and the logger is slower when this option is disabled.<strong>HOBOware</strong> User’s <strong>Guide</strong> 221
Other OptionsSelect "Close the status window on logger disconnect or communication error" if you want the Status window toclose automatically (on the next refresh) if it is open when you remove the interface cable, base station, or couplerfrom the logger, or if communication is interrupted for another reason. Deselect this option if you want to leave itopen. Note that if the Status window was opened from the Launch Logger window, it will close automatically evenif this option is not selected.Plotting PreferencesUse the Plotting Preferences to control fonts, series lines, Y‐axis, and several other plot elements.To change these settings:Notes:Fonts1. From the File menu on Windows or the <strong>HOBOware</strong> menu on Macintosh, select Preferences.2. Select the Plotting category on the left and then click the subcategory you wish to change.3. Adjust any of the settings described below and then click OK. To apply certain preferences to a single series, double‐click the series to open the Series Propertieswindow. To apply changes to real‐time plots in HOBOnode Manager, restart HOBOnode Manager or removethe plot for the sensor and then add it back (deselect the Plot checkbox for the sensor to remove itand then select the Plot checkbox again to add it back.Use the Fonts Preferences to control the font size, type, style, and color for most text on the graph (<strong>HOBOware</strong>Lite has font preferences for size only). Note that the plot title font will be two points larger than the selected fontsize.Lines (<strong>HOBOware</strong> Pro only)Use the lines preferences to define the appearance of lines in the plot for a specific series type. Rules added willappear in the panel at the bottom. Only one rule can be added per series type. To delete a rule, click the deletebutton on the row.<strong>HOBOware</strong> User’s <strong>Guide</strong> 222
When plotting multiple rules of the same type. If "Use the same color for each series" isselected, then multiple series of the same unit type (for example, multiple temperature series) areplotted with the same color, but with different line styles (solid, dashed, dotted, etc) to differentiatethem. If "Use a different color for each series" is selected, then multiple series of the same unit typewill be plotted in different colors. The series will still be attached to a single, common Y‐axis, but onlyone series will match the axis color. Use Rules. Select this box to set up rules for series lines on the plots. Then select the series type forthe rule you want to set up. Select the size and style of the series line. Click the Choose button toselect a line color. Click the Add Rule button to create the rule. Line size, style, and color will beapplied on series lines, the corresponding Y‐axis (value axis), and its corresponding representation inthe legend. This rule will be overridden by any changes you make in the Series or Axis Propertieswindow. To add another rule, select a different Series Type, choose the settings, and then click AddRule. To delete a rule, select it and click the Remove button.Value Axis (<strong>HOBOware</strong> Pro only)Select the Use Rules box to set up rules about the minimum and maximum values used on the Y‐axis (value axis)for a specific measurement type. Select the measurement type and then type in the minimum (Bound Min) andmaximum (Bound Max) you want to use. Select the Unit Type and then click Add Rule to create the rule. This rulecan be overridden by any changes you make in the Axis Properties window. To add another rule, select a differentmeasurement type, choose the settings, and then click Add Rule. To delete a rule, select it and click the Removebutton.Layout Show the details pane when plotting data. Select this preference to automatically display thedetails pane with the plot. Show the points table when plotting data. Select this preference to automatically display thepoints table with the plot.<strong>HOBOware</strong> User’s <strong>Guide</strong> 223
Points Table & Details Pane Use sensor Label (if available) in points table and details pane (<strong>HOBOware</strong> Pro Only). Selectthis preference to display the sensor label (if available) as added in the Launch Logger window withcorresponding column header in the points table and in the details pane. This is especially useful ifthere are multiple sensors of the same measurement type in the same file (for example, aHOBO Micro Station datafile with three temperature sensors). When selected value in table is out of plot range, drag series to that value. Normally, if theplot is zoomed in and you select a point in the Points table that is outside the zoom area, the plot willscroll so the marked point is in view, while retaining your zoom factor. Clear this box if you do notwant to scroll to points outside of the current view.Gridlines Enable horizontal gridlines when plotting data. By default, horizontal gridlines are not displayedwhen you open a plot. Enable this option if you always want a new plot to display gridlines for allvalue axes. Enable vertical gridlines when plotting data. By default, vertical gridlines are always displayedwhen you open a plot. Clear this checkbox if you never want a new plot to display gridlines for thetime axis.Plot SetupAutomatically select all data series for plotting. By default, some series (such as Dew Point) arenot selected for display in the Plot Setup window. Enable this option if you want every series to beselected automatically in the Plot Setup window. Automatically select internal events for plotting (e.g. Button Up/Down, Host Connected,EOF). By default, all internal events are selected for display in the Plot Setup window. Disable thisoption if you do not want these events to be selected automatically in the Plot Setup window. Automatically select pre‐defined Data Assistants or Filtered series for plotting instead ofthe source series. This option controls whether any series from Data Assistants and filters that youconfigured in the Launch Logger window are automatically selected in the Plot Setup window. Disablethis option if you do not want these series selected automatically in the Plot Setup window. When Light and Occupancy are enabled as State on the same logger, derive four possibleLight/Occupancy state channels. For UX90‐005 and ‐006 series loggers, this option controls<strong>HOBOware</strong> User’s <strong>Guide</strong> 224
whether four additional data series are automatically calculated and available for plotting. Theseseries are: Lights on & occupied (Light On & Occ) Lights on & unoccupied (Light On & Unocc) Lights off & occupied (Light Off & Occ) Lights off & unoccupied (Light Off & Unocc)Disable this option if you do not want these series to be generated when plotting data.Other Options Mark all points when plotting data. This preference controls whether each data point is markedon the series. Point markers are not displayed by default (except for events and for a series with onlyone data point) to avoid cluttering the plot. Enable this option if you want all points to be marked onevery series whenever you display a plot. Keep in mind, however, that marking all points on a largeplot takes longer and consumes more system memory. Label the time axis. Select this option if you want the default label "Time" to be displayed with thetime axis (X‐axis). Use sensor labels (if available) in legend. Select this option if you want any available sensor labelsas added in the Launch Logger window to appear in the legend with the series name.Undo & RedoThis preference controls whether you can undo and redo the changes you make to plots. When the Undo & Redopreference is enabled, you can specify how many changes to plots will be stored within <strong>HOBOware</strong>. If you select"Number of stored undoable actions," then there will be a limit to the number of changes to the plots that you canundo. For example, if you choose to store 25 undoable actions, then you will be able to undo the last 25 changesthat you made to the plots, but not the 26th. You can configure <strong>HOBOware</strong> to store from 1 to 50 undoable actions(changes to the plot) with this setting. If you select "Enable unlimited undoable actions," then there will be no limitto the number of changes to the plots that you can undo. Note that storing an unlimited number of actions canimpact <strong>HOBOware</strong> performance on slower computers.<strong>HOBOware</strong> User’s <strong>Guide</strong> 225
Data Assistant PreferencesUse the Data Assistant category within Preferences to control which Data Assistants are displayed in the Plot Setupwindow.To change these settings:1. From the File menu on Windows or the <strong>HOBOware</strong> menu on Macintosh, select Preferences.2. Select the Data Assistant category on the left and then click the Data Assistants subcategory.3. Adjust any of the settings described below and then click OK.When you read out a logger or open a datafile, all compatible Data Assistants are listed in the Plot Setup windowby default. Deselect the checkboxes for any assistants that you do not want to display in the Plot Setup window.Or, click Show All to display all compatible assistants in the Plot Setup window or Hide All to display none of them.Display PreferencesUse the Display category within Preferences to control the default units, date/time format, and series optionsdisplayed in plots.To change these settings:Default Units1. From the File menu on Windows or the <strong>HOBOware</strong> menu on Macintosh, select Preferences.2. Select the Display category on the left and then click the subcategory you wish to change.3. Adjust any of the settings described below and then click OK.This preference controls the units used throughout <strong>HOBOware</strong>: either US or SI (Metric). This will change the unitsshown on the axis, legend, points, and details the next time you display a plot. This will also change the currentreadings the next time you open the Status window.Date/TimeThese settings control how the date and time appears in <strong>HOBOware</strong>. Changes you make are shown in the date andtime sample. Any plots that may be open when you make changes to the date and time display will require the<strong>HOBOware</strong> User’s <strong>Guide</strong> 226
plots to be redrawn, which may take several seconds. As noted in the preferences, date and time formattingbeyond what is specified in these settings are determined by the computer operating system. Note: When youexport a file, the date and time are exported as determined by the Export Settings in Preferences (except for yearformat, which is only controlled by these Date/Time settings in the Display category. If you open the file in Excel,the dates and times may be automatically reformatted to Excel's default date and time format, which you maycustomize within Excel.Series Date format. This controls how the date is displayed: Month, Day, Year; Day, Month, Year; or Year,Month, Day. Date separator. This controls what character is displayed between the month, day, and year: a slash(/) or a dash (‐). Year format. This controls whether the year is listed as two of four digits. Time format. This controls whether the time is shown in 12‐ or 24‐hour format. Use locale for all. Click this button to use the default settings for the current locale as configured inthe operating system.Use the Series preferences to customize how data series are sorted in the Status and Plot Setup windows and toset battery series options. Select a sort order. Choose one of the following four ways to sort the series displayed in the Statusand Plot Setup windows:• Logger's default: Series are sorted the same way they were listed in the Launch Loggerwindow.• Enabled: All series selected, or enabled, for logging are displayed at the top of the list.• Label: Series are sorted by their label name, an optional feature only available for someloggers. Labels can be sorted in ascending or descending order (alphabetically ornumerically depending on the label entered).<strong>HOBOware</strong> User’s <strong>Guide</strong> 227
• Measurement: Series are sorted by measurement type alphabetically in ascending ordescending order. Display derived series below their source series. A derived series is one that is calculated ratherthan recorded by a sensor. Some loggers have the capability to create datafiles that not only havelogged sensor data, but also additional derived series automatically calculated in relevant units. Oneexample is a logger with a temperature/RH sensor. The logger records a data series for temperatureand another for humidity (two source series), which are used to calculate a dew point data series (thederived series). In addition, some loggers support filtering at launch time and using data assistantsbefore or after launch, which also results in derived series. Select this option if you want any derivedseries to be displayed immediately following its source series in the Status and Plot Setup windows. Bydefault, this option is disabled, which means all derived series are displayed at the bottom of the dataseries list. Note that status window support is limited for station loggers, such as the U30 Station. Show the option to log battery. This setting controls whether you have the option to enable ordisable the battery series in the Launch Logger window when applicable. You can configure someloggers to record the battery voltage at every logging interval. When this option is selected, you canchoose whether to record the battery voltage at launch time. If this setting is not selected, then youcannot record the battery voltage and it will not be shown in the Launch Logger window. This settingis enabled by default. Display logger's battery series in the last position. This setting controls whether the optionalbattery series is displayed at the bottom of the data series list in the Launch Logger, Status, and PlotSetup windows regardless of any other series settings. If this setting is not enabled, the position of thebattery series in the data series list will vary based on other preferences. This setting is enabled bydefault.Warnings PreferencesUse the Warnings Preferences to disable warning pop‐ups that you do not want to appear. Before you do so,however, keep in mind that the warnings are intended to help prevent mistakes and inadvertent data loss. Revieweach warning carefully before disabling it. To re‐enable a warning, re‐select the check box.To disable all of the warnings in a group, click the Select None button for that group.To enable all of the warnings in a group, click the Select All button for that group.You access the Warnings Preferences by going to File > Preferences > Warnings.To change these settings:1. From the File menu on Windows or the <strong>HOBOware</strong> menu on Macintosh, select Preferences.2. Select the Warnings category on the left and then click the subcategory you wish to change.3. Adjust any of the settings described below. To disable all the warnings in a group, click the SelectNone button for that group. To enable all the warnings in a group, click the Select All button for thatgroup. Click OK in the Preferences window to save changes.General There is any remaining unsaved data when closing a plot or application. This warning remindsyou when you made changes to a plot, but haven't saved the changes to a project file. The project file being opened was created with a different version of <strong>HOBOware</strong>. Thismessage warns you if you are opening a project file that was saved in different version of <strong>HOBOware</strong>than you are currently using. In some instances, there may be differences in software versions thatcould affect the project file.<strong>HOBOware</strong> User’s <strong>Guide</strong> 228
Warnings Before the Launch ScreenThese preferences control warnings that appear when the logger is connected to the computer and you selectLaunch from the Device menu or the Launch icon from the toolbar. If enabled, these warnings will display beforethe Launch Logger window is opened. The logger is waiting for a delayed start. This warning indicates that the logger has already beenconfigured to start logging on a specific date and time; logging has not begun. The logger is waiting for a triggered start. This warning indicates that the logger has already beenconfigured to launch with a push button or triggered start, but logging has not begun. The logger is currently logging (Station Loggers only). This warning indicates the a station‐typelogger (U30, HOBO Weather Station, HOBO Micro Station) is currently recording data. The logger needs to be readout (USB devices only). This warning indicates the data on the USBlogger (U‐Series) has not been offloaded, or read out, yet.Warning After the Launch ScreenThese preferences control warnings that appear after you click the Start button in the Launch Logger window. The Temperature channel is disabled but required to log Pressure. For some loggers thatrecord barometric pressure data, the temperature must also be logged. This message warns you if youselected the pressure sensor or channel in the Launch Logger window, but not temperature. The Temperature channel is disabled but required to log Relative Humidity. For some loggersthat record relative humidity data, the temperature must also be logged. This message warns you ifyou selected the relative humidity sensor or channel in the Launch Logger window, but nottemperature. The specified delay time is in the past. This warning indicates that you have selected a start dateor time for logging that is in the past instead of the future. The specified delay time is past the sensor cap expiration. This warning indicates that the dateor time you selected for the launch to begin is past the U26 Dissolved Oxygen logger sensor capexpiration date. The logging duration could extend past the sensor cap expiration. This warning indicates thatprojected logging duration (the amount of time it takes for the logger's memory to fill) lasts beyondthe U26 Dissolved Oxygen logger sensor cap expiration date.<strong>HOBOware</strong> User’s <strong>Guide</strong> 229
The logging interval specified is too small for the TRMS module (<strong>HOBOware</strong> Pro only). Thiswarning indicates that the logging interval (how often the logger records data) is not supported by theTRMS module in a U30 station logger. The Battery channel is disabled but recommended when using excitation power(<strong>HOBOware</strong> Pro only). This warning indicates that the battery channel in the Launch Logger windowhas not been selected on a U30 or FlexSmart logger configured to use excitation power. The logger's battery power is too low to provide excitation to external sensors (<strong>HOBOware</strong>Pro only). This warning indicates the battery is too low for a U30 or FlexSmart logger that has beenconfigured to power excitation to external sensors. The Battery channel is enabled but will not log data without other sensors attached(<strong>HOBOware</strong> Pro only). This warning indicates that you have only selected the battery channel in theLogger Launch window and no other sensors. The header size of an optic logger may cause problems with older shuttle firmware(<strong>HOBOware</strong> Pro only). This warning indicates that if you will be offloading an optic logger to aHOBO shuttle, the shuttle should have the latest firmware installed. Otherwise, the header size (partof the logger data file) could cause the offload to fail or result in a corrupted file.Restoring Default PreferencesTo return all preferences to their original settings in both the Preferences and custom‐defined Launch Loggerwindow settings (State Description, % or Time, Logging Interval), open the Preferences window (click the File menuin Windows or the <strong>HOBOware</strong> menu on Macintosh and select Preferences). Click the Restore Defaults button.A message appears asking if you are sure you want to restore all preferences to their default values. Click Yes torestore the default preferences. In addition to the options configured in the Preferences window, the followingsettings are also affected: Data File Folder Locations. When you restore the preference defaults, the default folder locationsfor datafiles, text files, and project files is reset to:<strong>HOBOware</strong> User’s <strong>Guide</strong> 230
• C:\Documents and Settings\\My Documents\<strong>HOBOware</strong>(for Windows XP)• C:\Users\\Documents\<strong>HOBOware</strong>(for Windows 7 or Windows 8)• Users//Library/Application Support/<strong>HOBOware</strong>(for Macintosh OS X) FlexSmart modules or Analog Sensor Ports channel names and units (<strong>HOBOware</strong> Pro Only).Any custom‐defined channel names and units for FlexSmart modules or Analog Sensor Ports areremoved from the pull‐down menus in the Configure Channel window. However, this will not affectcustomized channel names and units that you saved in configuration files (.hcfg). <strong>HOBOware</strong> software updates. The date and time of the most recent check for <strong>HOBOware</strong> softwareupdates will not be retained. A message will appear next time you reopen <strong>HOBOware</strong> asking if youwant to check for updates. Custom‐defined Launch Logger window menus. Any custom‐defined Launch Logger windowsettings, such as State Description, % or Time, Logging Interval, will be cleared.Tips for Working with Multiple Loggers<strong>HOBOware</strong> Pro has several built‐in features that allow you to bypass some of the repetitive work of launching andreading out multiple loggers. These features not only will save you time, but also will help ensure your loggers arelaunched with consistent settings. Follow these tips if you plan to launch or read out many numerous loggers ofthe same type with identical settings.General Settings Change the Device Types preference to one device type. Depending on the selections you madewhen installing <strong>HOBOware</strong>, it may be configured to search for both serial and USB devices. If you areonly using USB devices you can bypass the Select Device Type and save time. To bypass the SelectDevice Type window, select Preferences from the File menu. Under the Communications preferences,select Device Types. Choose either "USB devices only" or "Serial devices only."Launching Multiple Loggers Check the Description name. Use a logger serial number or your own unique identifier in theDescription field in the Launch Logger window as shown in the example below. The name of thelaunch description is important because it is also used as the default file name when you read out thelogger. Using unique names here will eliminate the need to individually name files during readout.<strong>HOBOware</strong> User’s <strong>Guide</strong> 231
If you plan on launching multiple loggers of the same type with the same settings (i.e. starttime, logging interval, etc.), set up and start one logger first. To do this, open the LaunchLogger window for one logger. Enter your settings for the launch. Double‐check that they are correctand then start the launch. Setting and starting this one logger will create a model for all the otherloggers of the same type to follow. The key to success is making sure the settings are exactly as youwant so be sure to double‐check or even triple‐check them. You want to be certain the first logger isright! Set the Launch Time‐Saving preferences to use the previous logger’s launch settings. Fromthe File menu, select Preferences. Select General and then click Launch Time‐Saving Options. Under"When launching," select "Show launch screen" and under "Launch with contents of," select "Previouslaunch" to use the same launch settings from the last logger that was launched (same logger modelonly). Change the Default Action option (USB devices only). Under the Device menu in <strong>HOBOware</strong>,change the Default Action from "Do Nothing" to "Launch." If you also set the launch time‐savingpreferences to "Automatically launch," then this allows you to launch numerous U‐Series loggers in arow simply by plugging and unplugging individual loggers. If you set the launch time‐savingpreferences to "Show launch screen," this will still save you the step of manually selecting Launchfrom the toolbar or the Device menu for each logger. Change this back to "Do Nothing" when you’redone. Note: If this is the first time you have used the logger on the computer, you may have to plugthe logger in, unplug it, and then plug it back in.<strong>HOBOware</strong> User’s <strong>Guide</strong> 232
Test that your changes have taken effect. Connect a different logger of the same type to thecomputer. The Launch Logger window for that logger should immediately open the settings shouldmatch what you set up in the first logger. Press Enter or click the Start button in the Launch Loggerwindow and the logger will start (note that the wording on the Start button may vary depending onwhen logging is scheduled to begin). You can do this repeatedly for loggers of the same type. Optional: Set the preferences to skip the launch window. If you are comfortable with theprevious steps, you can also set up <strong>HOBOware</strong> to bypass the Launch Logger window entirely. From theFile menu, select Preferences. Select General and then click Time‐Saving Options. Under "Whenlaunching," select "Automatically Launch" to skip the launch window. Note: If you need to change thelaunch description for each logger, then select "Show launch screen" instead.Reading Out Multiple Loggers Set the Readout Time‐Saving preferences. From the File menu, select Preferences. Select Generaland then click Readout Time‐Saving Options. Under "When Saving datafile," select "Automaticallysave" instead of "Show save dialog." Under "When plotting," select "Do not plot." This bypasses thesave dialog that normally appears during readout and automatically saves the data file to the defaultdirectory without plotting the data. Note: If you also want the logger to continue logging afterreadout, uncheck the "Ask to stop logging before reading out a running logger" checkbox. If you needto stop the logger, keep that option checked. You’ll then see a prompt to stop the logger during eachreadout. Change the Default Action option. Under the Device menu in <strong>HOBOware</strong>, change the DefaultAction to "Readout." This feature will automatically initialize the Readout sequence every time youconnect a logger to the computer (with <strong>HOBOware</strong> open). This will still save you the step of manuallyselecting Readout from the toolbar or the Device menu for each logger.<strong>HOBOware</strong> User’s <strong>Guide</strong> 233
Setting the Language/Format on Your ComputerThe <strong>HOBOware</strong> user interface has been translated from English into four languages, which are supported by fourspecific formats. These languages and formats are: French (France), Spanish (Spain), Portuguese (Portugal), andGerman (Germany). To change the language displayed in the <strong>HOBOware</strong> user interface, you must change thelanguage/format settings on your computer as described below.Notes: The supported languages only work with the specific format or country listed above. For example,Portuguese is supported in the Portugal format only and not with Brazil. The <strong>HOBOware</strong> Help and all related documentation are available in English only.On Windows 7 and Windows 8:1. Close <strong>HOBOware</strong>.2. Open the Control Panel and select "Region and Language."3. Under the Formats tab, select the desired language/format and click OK to save the changes.4. Reopen <strong>HOBOware</strong>.On Windows XP:1. Close <strong>HOBOware</strong>.2. Open the Control Panel and double‐click the "Regional and Language Options."3. Under the Regional Options tab, select the desired language/format and click OK to save the changes.4. Reopen <strong>HOBOware</strong>.On Macintosh OS X:1. Close <strong>HOBOware</strong>.2. Open System Preferences and access the "Language & Text" Preferences.3. Under the Language tab, drag the desired language to the top of the list. If the desired language doesnot appear in the list, click the "Edit List…" button to add it.<strong>HOBOware</strong> User’s <strong>Guide</strong> 234
4. Under the Formats tab, ensure the correct Region is selected in the drop‐down menu. Example: ForSpanish (Spain), Spanish must be first in the Language list, and Spain must be selected under theRegion drop‐down menu.5. Reopen <strong>HOBOware</strong>.Alarm & Readout ToolIMPORTANT: The Alarm & Readout Tool is no longer installed with <strong>HOBOware</strong> as of version 3.4. This helpsection is included for reference only for existing Alarm & Readout Tool users.The Alarm & Readout Tool is a plug‐in tool that works in conjunction with <strong>HOBOware</strong> Pro to monitor select HOBOdata loggers, read them out, and notify you when sensor and logger conditions fall outside the limits you specify.Notes:Alarm sensor conditions cannot be set on state or event channels. Only logger conditions, such ascommunication, memory, and battery level, can be monitored for state and event loggers (U9‐001 andU11‐001).To set up a scheduled readout for a state and event loggers (U9‐001 or U11‐001 models) with partialreadouts, the battery channel must be configured to log valid timestamps using any battery logginginterval.The HOBO 4‐Channel Pulse Input data logger (UX120‐017) and UX90 series loggers are not supported withthis tool.Data assistant and filtered series configured at launch time are not compatible with this tool. These serieswill cause the tool to read the data incorrectly.Alarm & Readout Tool email notifications do not support SSL or port configuration.Connecting loggersThe Alarm & Readout Tool can perform scheduled readouts and monitor sensor conditions, communication status,memory usage, and battery level on supported loggers. (It does not monitor states and events.)Tip: Loggers that require a base station to communicate will experience more rapid battery drain when left in thecoupler. Refer to your logger's manual for more information.For most reliable operation, it is recommended that you use direct USB or serial port connections for your loggersand base stations. If your computer does not have a serial port, you may use a USB port with a Keyspan USB SerialAdapter.In addition, remote connections to USB loggers are possible with a Keyspan or Tibbo USB Server connected to alocal Ethernet port. (It is recommended that you use the Tibbo USB Server with Windows only.) The Alarm &Readout Tool does not support connecting serial loggers to a USB server via a serial adapter.Using the Alarm & Readout Tool1. Connect a logger to the computer. The logger can be logging, waiting for a delayed or button start, orstopped. Important: A serial logger that is waiting for a delayed or button start cannot provide anupdated sensor reading until the logger begins logging. Once a serial logger begins logging, it can onlyprovide the last logged value.Tip: To avoid disrupting an active deployment, do not attach sensors to a serial logger if it is alreadylogging.2. If you want to include scheduled readouts in your configuration, launch the logger (if it is not alreadylaunched) before starting the monitor. The logger must be logging, or waiting for a delayed or triggerstart, in order to perform scheduled readouts. If you plan to use partial readouts with a wrap‐enabled<strong>HOBOware</strong> User’s <strong>Guide</strong> 235
logger, the logger must not have wrapped before you start the monitor. If the logger wraps after themonitor is started but before the first partial readout, partial readouts will be discontinued.3. From the Tools menu, choose Manage Alarms, then choose New Configuration.4. Create and save a configuration. You must create at least one alarm condition OR readout schedulefor each logger in the configuration.5. Click Start on the Configure Alarms and Readouts dialog to begin monitoring the logger.Software updatesIf you have an Internet connection, <strong>HOBOware</strong> Pro can periodically check the Onset website for software updates,including updates to the Alarm & Readout Tool. The default is to check once per week, but you can configure<strong>HOBOware</strong> Pro to check daily or monthly. In Preferences, go to the General pane. Click Startup and then select thehow often you want to Check for <strong>HOBOware</strong> Updates.You can also check for updates manually at any time. Choose Check for Updates from the Help menu.ConfigurationIMPORTANT: The Alarm & Readout Tool is no longer installed with <strong>HOBOware</strong> as of version 3.4. This helpsection is included for reference only for existing Alarm & Readout Tool users.The Alarm & Readout Tool uses configuration files to save definitions of groups of loggers, alarm conditions, andscheduled readouts. Create and save a configuration Open and edit a saved configuration Export a configurationCreating and Saving a ConfigurationTo begin, open <strong>HOBOware</strong> Pro and connect the loggers and sensors you want to include in the configuration. Theloggers can be logging, waiting for a delayed or button start, or stopped.Tip: You must create at least one alarm condition OR readout schedule for each logger in the configuration.If you want to include scheduled readouts in your configuration, launch the logger now (if it is not alreadylaunched). Once you start the monitor, the logger must be launched and either logging, or waiting for a delayed orbutton start in order to perform scheduled readouts. If you plan to use partial readouts with a wrap‐enabledlogger, the logger must not have wrapped before you start the monitor. If the logger wraps after the monitor isstarted, but before the first partial readout, partial readouts will be discontinued.Tip: To avoid disrupting an active deployment, do not connect sensors to a serial logger if it is already logging.Important: A serial logger that is waiting for a delayed or button start cannot provide an updated sensor readinguntil the logger begins logging. Once a serial logger begins logging, it can only provide the last logged value.Then take the following steps:1. Use the logger list and Logger pane to select and organize loggers.2. Use the Alarms pane to define alarm conditions.3. Use the Readouts pane to schedule readouts.4. Use the Notifications pane to set up notifications.5. Use the Messages pane to construct messages.6. Click Save to save the configuration. By default, configurations are saved in theDocuments\<strong>HOBOware</strong>\Alarms folder with an extension of .halrm.<strong>HOBOware</strong> User’s <strong>Guide</strong> 236
7. To start the monitor now, click Start. If the monitor is already running, you will be warned that themonitor will stop the previous configuration before running the new one.To close the Configure Alarms and Readouts dialog without saving changes or starting the monitor, clickCancel.Logger Pane1. From <strong>HOBOware</strong> Pro's Tools menu, choose Manage Alarms & Readouts, then choose NewConfiguration. The Configure Alarms and Readouts dialog is displayed with the Logger pane selected.2. Click Add Logger to select the loggers for this configuration. From the resulting Add Loggers dialog,select the loggers you want to include, then click OK.3. The loggers you chose will appear in the logger list on the left side of the Configure Alarms andReadouts dialog. Click the folder icon to create "groups" to organize your loggers. Logger groups can helpyou set up alarms or readout schedules for similar types of loggers. To add a logger to a group,click the logger's name to select it, then drag it to the group's folder. To delete a logger from the configuration, click the logger's name, then click the trash icon . To delete a group and all the loggers in it, click the group's name, then click the trash icon .(If you do not want to delete all of the loggers that are in the group, drag them out of thegroup before deleting it.)4. In the Logger pane, enter a Name (up to 25 characters) that will be used to identify the currentlyselected logger in the monitor, scheduled readouts, and notifications. The first 25 characters of thelogger's most recent Launch Description will be used as the default; if you change the text here, thelogger's Launch Description will not be affected.5. Enter the number of retry attempt(s) (if any) the Alarm & Readout Tool should make if the selectedlogger fails to respond for an alarm check or readout attempt. For most applications, one retry shouldbe enough; there is a 60‐second delay between retries. If the Alarm & Readout Tool encountersfrequent logger communication failures during a deployment, you may wish to increase the numberof retries.Tip: If the Interval for alarm conditions or readouts is too short to accommodate all retries, the remainingretries will be skipped so as not to delay the start of the next interval.Alarms Pane1. To define alarm conditions, click the Alarms icon near the bottom of the Configure Alarms andReadouts dialog.2. Click a logger's name in the logger list to set the interval at which alarm conditions will be checked,and define alarm conditions for that logger.3. To copy this logger's alarm settings to other loggers in this configuration, select the setting you wantto copy (interval, sensor condition(s), logger condition(s), or all Alarm settings) from the first dropdownnext to the Copy button. Then select the destination loggers from the second drop‐down. Youmay choose a logger group, an individual logger, or Group: Loggers for all loggers. Click Copy tocomplete this step.<strong>HOBOware</strong> User’s <strong>Guide</strong> 237
Copied intervals and logger conditions replace the destination loggers' alarm settings withthose of the current logger. Copied sensor conditions are added to the destination loggers' existing conditions, if any. Theydo not replace any sensor conditions that have already been defined for those loggers. Whencopying a sensor condition to a destination logger that is a different model than the sourcelogger, the software tries to identify a similar sensor on the destination logger. If it does notfind one, or if the sensor on the destination logger has a different measurement range thanthe sensor on the source logger, you will receive a warning message. You should then reviewthe alarm conditions for each logger to make sure that they are what you expect.Alarms FieldsLogger SelectedLogger whose alarm settings are displayed. To work with alarm conditions for a different logger, select the loggerfrom the logger list to the left.IntervalHow often the Alarm & Readout Tool should check this logger for alarm conditions. The minimum alarm interval isone second for USB loggers and five seconds for serial loggers. The maximum is 23 hours, 59 minutes, and 59seconds.This interval is directly related to the sensor condition durations. If you change the interval after you have set upsensor conditions, be sure to adjust the sensor condition durations accordingly.Tip: If the logger requires a base station/coupler to communicate, refer to your logger's manual to determinewhether it will go to "sleep" if the computer does not communicate with it more often than every 30 minutes.When loggers are added to a configuration and set to similar alarm intervals, the amount of time needed for themonitor to complete a polling cycle increases. (Adding sensor alarm conditions also slightly increases the amountof time needed.) This is particularly true of serial loggers. If a polling cycle takes longer than the interval, you willsee unpredictable behavior in the monitor window and a delay in notifications.You may need to experiment to determine the best interval for your needs. If you encounter problems, a longerinterval is recommended. Longer intervals also put less demand on the logger's battery.(Refresh)If you have added sensors to a serial logger (or removed them), click this button to update the sensor list.Important: If you have removed a sensor for which a sensor condition has already been defined, the sensorcondition will be deleted when you click Refresh. Also, if the logger is logging, clicking Refresh will cause the list torevert to the sensors that were connected at launch.Conditions to trip alarms (Sensors tab)Sensor conditions that have been added to this configuration. When any of these conditions are met, the monitorsends a notification. Note that a sensor can have more than one condition.Important: State and event channel activity cannot trigger alarms.To add a condition to this list, click Add Condition and use the dropdown lists to describe the condition. Choose asensor, comparison type, value, units (if applicable), and duration needed to generate an alarm.Tip: The units you choose for a sensor condition will always be the units displayed for that condition in the monitorwindow and details, even if you switch units (US/SI) in <strong>HOBOware</strong> Pro preferences.The For Duration is directly related to the Interval. For example, if your Interval is 15 minutes, you can choose aDuration of 0, 15 minutes, 30 minutes, etc. With a Duration of 0, the alarm will trip on the first reading that meetsthe sensor condition. If the Duration is equal to the Interval (in this example, 15 minutes), the alarm will trip only ifthe condition is met for two consecutive readings; if the Duration is equal to two intervals (in this example, 30minutes), the alarm will trip only if the condition is met for three consecutive readings; and so forth.<strong>HOBOware</strong> User’s <strong>Guide</strong> 238
To remove a sensor condition from this list, click the trash iconnext to the condition.Conditions to trip alarms (Loggers tab)Click the Logger tab to select logger conditions (communication, memory, or battery) that can trip the alarm. Theseconditions are also subject to the Interval for alarms. When any of these conditions are met during an alarminterval, the monitor sends a notification. When unable to communicate with logger: This condition occurs only after all loggercommunication attempts, including retries, for a given alarm interval have failed. (It does not apply tocommunication failures that occur during scheduled readouts; this condition can be enabled on theReadouts pane.) When memory used is at or above n%: This condition occurs when logger memory reaches athreshold you specify. (Note that a serial logger that has been launched with wrapping enabled willalways be at 100% once it has wrapped.)Tip: If you choose the memory and/or battery conditions, be sure to specify limits for these conditions. When battery level/voltage is at or below n: This condition occurs when battery power reaches athreshold you specify.Readouts PaneImportant: To perform a scheduled readout, the logger must be logging, or waiting for a delayed or trigger startwhen you start the monitor.Tip: There are many preferences related to the formatting of text files and datafiles.1. To schedule readouts, click the Readouts icon near the bottom of the Configure Alarms andReadouts dialog.2. Click a logger's name in the logger list to schedule readouts for that logger.3. Complete the Readouts pane. Readout options are described below.Logger SelectedLogger whose readout schedule is displayed. To work with the readout schedule for a different logger, select thelogger from the logger list to the left.ModeType of readout, if any, for this logger.Tips for partial readouts: Select Disabled if you do not want to schedule readouts for this logger. Full reads out the full contents of the logger. (Refer to Preferences for options.) Performing afull readout each time puts more strain on the logger's battery. Partial starts reading out where the last scheduled readout ended. (Refer to Preferences foroptions.) The initial partial readout reads out the full contents of the logger. Partial readouts cannot be performed on loggers that have multiple logging intervals defined. If the logger was launched with wrap enabled, you will not be able to create data (.dtf) fileswith partial readouts. However, you will still be able to create text (.txt) files. The logger must have the same deployment number at readout time as it did when you startedthe monitor. If you relaunch the logger while the monitor is running, the deployment numberwill increase, and partial readouts will fail.<strong>HOBOware</strong> User’s <strong>Guide</strong> 239
If you plan to use partial readouts with a wrap‐enabled logger, the logger must not havewrapped before you start the monitor. If the logger wraps after the monitor is started, butbefore the first partial readout, partial readouts will be discontinued.IntervalHow often the Alarm & Readout Tool should read out the logger. Select a readout frequency from one minute to364 days, 23 hours, and 59 minutes.Tip: If the logger requires a base station/coupler to communicate, refer to your logger's manual to determinewhether it will go to "sleep" if the computer does not communicate with it more often than every 30 minutes.When loggers are added to a configuration and set to similar readout intervals, the amount of time needed for themonitor to complete a readout cycle increases. This is particularly true of serial loggers. If a readout cycle takeslonger than the interval, you will see unpredictable behavior in the monitor window, and a delay in readouts andnotifications.You may need to experiment to determine the best interval for your needs. If you encounter problems, a longerinterval is recommended. Longer intervals also put less demand on the logger's battery.Tip: If you launch a serial logger with wrapping enabled, make a note of the logging duration on the Launchwindow in <strong>HOBOware</strong> Pro to determine how often you need to read out the logger to avoid missing data. Forexample, if the logger will fill and wrap within six days with the connected sensors and you configure the Alarm &Readout Tool to read it out every seven days, you will miss a day's worth of data each week. If data loss isdetected, scheduled readouts will fail, and no further readout attempts will be made.File nameKeep the default File name (the logger name), or enter a new one.Tip: Be sure to use a unique file name for each of the loggers in a configuration.Local DiskEnable Local Disk to store the files on the machine that is running the Alarm & Readout Tool. It is a good idea tosave files locally, even if you also plan to send them via email or upload them to an FTP site. This will provide youwith a backup of the data if your network connection is lost.When you enable Local Disk, the words "Local Disk" will turn red to remind you to configure local disk settings.Click the Edit button and complete the Manage Data Storage dialog. Click Choose to select a file location. The default location for saved files is theDocuments\<strong>HOBOware</strong>\Readouts folder. Specify a File format (data or text) for the resulting file. (You may select both data and text; this willresult in the creation of two files.) Datafiles (.hobo and .dtf) can be opened directly in <strong>HOBOware</strong> Pro.Text files can easily be imported into <strong>HOBOware</strong> Pro, or used in spreadsheets and many otherprograms.Tip: If you selected partial readouts and the logger has wrap enabled, data (.dtf) will not be available.Email AttachmentEnable Email Attachment to have the files sent as an email attachment. When you enable Email Attachment, thewords "Email Attachment" will turn red to remind you to configure email attachment settings. Click the Edit buttonand complete the Manage Data Storage dialog. In the To field, enter the full email addresses (up to 120 characters), separated by semicolons, whereyou want the email to be delivered. In the From field, enter the full email address where you want the email to originate. In the Subj field, enter up to 30 characters for the subject line of the message.<strong>HOBOware</strong> User’s <strong>Guide</strong> 240
In the remaining fields, enter the information required by your SMTP server. You may be able to findthis information in your email software. If you do not know which settings to use, contact your systemadministrator or Internet service provider. Click Test to verify that the settings are correct. The Alarm & Readout Tool should confirm that thetest message was sent, and you should receive a message at the To address. Finally, specify a File format (data or text) for the resulting file. (You may select both data and text;this will result in the creation of two files.) Datafiles (.hobo and .dtf) can be opened directly in<strong>HOBOware</strong> Pro. Text files can easily be imported into <strong>HOBOware</strong> Pro, or used in spreadsheets andmany other programs.Tip: If you selected partial readouts and the logger has wrap enabled, data (.dtf) will not be available.FTPEnable FTP to upload the file to an FTP site. When you enable FTP, the word "FTP" will turn red to remind you toconfigure FTP settings. Click the Edit button and complete the Manage Data Storage dialog. Enter the information required by the FTP host. (Do not include "ftp://" in the FTP host field.) If you donot know which settings to use, contact your system administrator or Internet service provider. Click Test to verify that the settings are correct. The Alarm & Readout Tool should confirm that a testfile was uploaded, and you should find a test file named "test.txt" at the FTP site. Specify a File format (data or text) for the resulting file. (You may select both data and text; this willresult in the creation of two files.) Datafiles (.hobo and .dtf) can be opened directly in <strong>HOBOware</strong> Pro.Text files can easily be imported into <strong>HOBOware</strong> Pro, or used in spreadsheets and many otherprograms.Tip: If you selected partial readouts and the logger has wrap enabled, data (.dtf) will not be available.Notify meSelect the conditions for which you want to be notified. When any selected condition is met, the monitor sends anotification immediately. When readout is successful: This condition occurs when a scheduled readout has completed, andthe resulting file has been saved, emailed, or uploaded to an FTP site.Tip: It is possible to be notified of a successful readout, but not receive the expected email with theattached datafile or text file. The Alarm & Readout Tool cannot tell if something goes wrong after theemail was sent. When readout fails: This condition occurs when a scheduled readout (and all retry attempts) faileddue to a communication error; or if there was an error saving the file, emailing it, or uploading it to anFTP server.CopyTo copy this logger's readout settings to other loggers in this configuration, select the setting you want to copy(mode, interval, Local Disk settings, Email Attachment settings, FTP settings, or notifications) from the first dropdownnext to the Copy button. Then select the name of a logger group, the name of an individual logger, or Group:Loggers (to select all loggers) from the second drop‐down. Click Copy to complete this step.Notifications PaneTip: There are many preferences for notifications.1. To define notifications, click the Notifications icon near the bottom of the Configure Alarms andReadouts dialog. Notification settings apply to all loggers.<strong>HOBOware</strong> User’s <strong>Guide</strong> 241
2. Choose one or more notification methods and options. Readout options are described below.Tip: In general, the reliability of email and mobile text messaging depends on many factors, including but notlimited to SMTP servers, wireless service provider, routers, receiving devices, and even environmental forces suchas solar flares. This variability means that messages may not be delivered in a timely manner, and could even bedelivered out of order. If you often get messages late or out of order, you may be able to improve your odds byusing multiple notification methods, and/or multiple addresses (in different domains) in the To: field, separated bysemicolons. For example:john@onsetcomp.com; mary@onsetcomp.comEmailEnable Email to send email notifications. When you enable Email, the word "Email" will turn red to remind you toconfigure email settings. Click the Edit button and complete the Manage Notification Methods dialog. In the To field, enter the full email addresses (up to 120 characters), separated by semicolons, whereyou want the email message to be delivered. In the From field, enter the full email address where you want the email message to originate. In the Subj field, enter up to 30 characters for the subject line of the email message. In the remaining fields, enter the information required by your SMTP server. You may be able to findthis information in your email software. If you do not know which settings to use, contact your systemadministrator or Internet service provider. Click Test to verify that the settings are correct. The Alarm & Readout Tool should confirm that thetest message was sent, and you should receive a message at the To address.Text Message to Mobile DeviceEnable Text Message to Mobile Device to send a text message to an SMS‐enabled mobile device, such as a cellulartelephone or a pager. When you enable this notification method, the words "Text Message to Mobile Device" willturn red to remind you to configure text message settings. Click the Edit button and complete the ManageNotification Methods dialog.This setup dialog is similar to the dialog for Email, but there is a 15‐character limit for the Subj field.Tip: There is a maximum length preference for mobile text messages.Launch ProgramEnable Launch Program to have the Alarm & Readout Tool launch a program on the host computer. When youenable this notification method, the words "Launch Program" will turn red to remind you to configure programsettings. Click the Edit button and complete the Manage Notification Methods dialog.Click Choose and browse to the program you would like to run. If you want the program to use a file as input,enable Pass file into program as argument and enter the file location and name in the File field.Host ComputerEnable this option if you want to the monitor to play a sound and attempt to grab the focus on the host computer.You may change the sound in Preferences.Notify meSpecify how often you want to be notified of alarm conditions. You can be notified at the start of each alarmcondition (once for continuous alarm condition); you can be notified at every duration of a continuous alarmcondition (every duration for continuous alarm condition); or you can have the monitor notify you just once, at thestart of the first alarm, and then stop the monitor (at first alarm condition, then stop monitor).Tip: These options apply to alarm condition notifications only. Notifications of readout success or readout failureare sent once per readout.<strong>HOBOware</strong> User’s <strong>Guide</strong> 242
Notify me when an alarm condition clearsEnable this option if you want to receive a notification when the alarm condition has returned to a non‐alarmstate.Send heartbeat every ___You can have the host machine send you regularly scheduled notifications to let you know that the monitor is stillrunning and able to communicate while you are away. Enable this option and specify how often you want to benotified.Messages Pane1. To construct the message that will be sent by certain notification methods, click the Messages iconnear the bottom of the Configure Alarms and Readouts dialog. Message settings apply to allloggers.2. The top portion of this dialog lists the items you can include in a notification message. Select all of theitems you would like to include. A sample message, based on your choices, appears below this area.3. To include additional, customized text in the message, enable Add text to notification messageand type the text in the area below this option.Opening and Editing a Saved ConfigurationOnce you have created and saved a configuration, you can open it to review settings, change the settings, and startthe monitor.Tip: When the monitor is running, you can access the Configure Alarms and Readouts dialog for the currentconfiguration by clicking Configure on the Alarm and Readout Monitor dialog. Changes that you make to theconfiguration will not take effect until the next time you start the monitor.1. From the Tools menu, choose Manage Alarms & Readouts, then choose Open Configuration. Selectthe configuration and click Open. The Configure Alarms and Readouts dialog is displayed.2. Review the settings and make changes, if desired.3. To save changes to the existing configuration file, click Save. To save the changes to a newconfiguration file with a different name, click Save As.4. To start the monitor now, connect the loggers and sensors (if applicable) that are defined in theconfiguration. If any loggers in the configuration have scheduled readouts enabled, be sure thoseloggers are launched, and either actively logging, or awaiting a delayed or triggered start. Click Start.If the monitor is already running, you will be warned that the monitor will stop the previousconfiguration before running the new one.Important: A serial logger that is waiting for a delayed or button start cannot provide an updated sensorreading until the logger begins logging. Once a serial logger begins logging, it can only provide the lastlogged value.Tip: To avoid disrupting an active deployment, do not connect sensors to a serial logger if it is alreadylogging.5. To close the Configure Alarms and Readouts dialog without starting the monitor, click Cancel.Exporting a ConfigurationTo export a configuration to a text file, open the configuration and click Export. By default, exported configurationsare saved in the Documents\<strong>HOBOware</strong>\Alarms folder with an extension of .txt.<strong>HOBOware</strong> User’s <strong>Guide</strong> 243
MonitoringIMPORTANT: The Alarm & Readout Tool is no longer installed with <strong>HOBOware</strong> as of version 3.4. This helpsection is included for reference only for existing Alarm & Readout Tool users.The alarm and readout monitor polls the loggers and sensors at the intervals specified by the configuration,compares the values to the alarm conditions, and notifies you if an alarm is triggered. It also performs scheduledreadouts and stores and/or sends the resulting files, as applicable. Start the monitor View the monitor details Hide the monitor Stop the monitorTip: The alarm and readout monitor uses your computer's system clock to determine when to poll loggers and readthem out. If you (or an automated program) adjust the time backwards while the monitor is running, the nextpolling and/or readout time will be delayed until the clock reaches that time. Automatic time changes caused bythe start and end of Daylight Saving Time, and manual changes to your time zone setting, do not cause a delay inthe monitor.Starting the MonitorTip: The alarm and readout monitor uses your computer's system clock to determine when to poll loggers and readthem out. If you (or an automated program) adjust the time backwards while the monitor is running, the nextpolling and/or readout time will be delayed until the clock reaches that time. Automatic time changes caused bythe start and end of Daylight Saving Time, and manual changes to your time zone setting, do not cause a delay inthe monitor.1. From the Tools menu, choose Manage Alarms & Readouts, then choose Open Configuration. Selectthe configuration you want and click Open. The Configure Alarms and Readouts dialog is displayed.2. Connect the loggers and sensors (if applicable) that are defined in the configuration. The loggers canbe logging, waiting for a delayed or button start, or stopped. Any loggers that have scheduledreadouts must be either logging, or awaiting a delayed or triggered start when you start the monitor.The loggers should be logging by the time of the first scheduled readout. Serial loggers that arescheduled for partial readouts and have wrap enabled must not wrap before the first scheduledreadout; if they are wrapped, the readout will fail.Important: A serial logger that is waiting for a delayed or button start cannot provide an updated sensorreading until the logger begins logging. Once a serial logger begins logging, it can only provide the lastlogged value.Tip: To avoid disrupting an active deployment, do not attach sensors to a serial logger if it is alreadylogging.3. Click Start. If the monitor is already running, you will be warned that the monitor will stop theprevious configuration before running the new one. The Alarm and Readout Monitor dialog isdisplayed, and an alarm icon appears in the lower right corner of the main <strong>HOBOware</strong> Pro window.4. Each logger has its own panel in the monitor window, which lists the logger name, monitoredconditions, and a countdown to the next reading. To view details about the logger's status, click thelogger's panel. Once the monitor is running, if there is a communication failure, any sensor readings areitalicized and in purple text to indicate that they are not current. If the logger is in an alarm condition, the logger name is displayed in red text.<strong>HOBOware</strong> User’s <strong>Guide</strong> 244
If a sensor is in an "above" alarm condition, its text is displayed in red. If it is in a "below" alarmcondition, its text is displayed in blue. If it is "okay," its text is black. If a monitored logger condition (communication , memory , battery status , orreadout ) is in an alarm condition, its icon is displayed in red. Otherwise, the icon is green. Aicon indicates a notification failure. Because different loggers may be read at different intervals, the Next Readout and Next AlarmCheck at the top of the monitor window lets you know when the next readout and alarm checkwill be taken for the configuration. To access the configuration dialog for the current configuration, click Configure. Changes thatyou make to the configuration will not take effect until the next time you start the monitor.5. You can continue to use <strong>HOBOware</strong> Pro to work with other loggers and datafiles. In addition, you canwork with the monitored loggers in <strong>HOBOware</strong> Pro when the monitor is not taking a reading.Tip: A logger cannot communicate with <strong>HOBOware</strong> Pro and the monitor at the same time. If bothapplications attempt to access the logger at the same time, you will receive communication errors.Viewing the Monitor DetailsTo view the details of a logger's condition while the monitor is running, click the logger's panel in the Alarm andReadout Monitor dialog. The following explains the fields on the Alarm and Readout Monitor ‐ Details window. Monitor started: Time when the monitor was started. Monitor number: Number of times the monitor has been started. Each time you start the monitor,the Alarm & Readout Tool's internal counter (the monitor number) increases by one. If the monitorperforms readouts, the monitor number is added after the file name, before the sequence number (ifany). Notification method(s): Notification methods in use. This can be any combination of email, mobiletext message, launch program, or host computer. Last notification at: Time when the most recent notification was sent. If this is "None Sent," nonotifications have been sent yet. Click View to see the text of the last notification that was sent. Select logger: This box lists the loggers that are being monitored. The information in this dialogrefers to the logger that is currently highlighted in the logger list. To view details for a different logger,click that logger's name. Name: Description that was entered for the logger on the Configure Alarms and Readouts dialog. Device: Model and serial number of the logger. Communication: Communication protocol for this logger (USB or serial). Readout Mode: Readout mode selected for this logger (full, partial, or disabled). Interval (readouts): Frequency with which the monitor is reading out the logger. Readout Storage: Storage method(s) for the resulting datafile or text file (local disk, emailattachment, or FTP). Last Readout: Time when the last readout was performed. If a scheduled readout has not beenperformed yet, this is "None." Next Readout: Time of the next scheduled readout attempt, if applicable, and a countdown timer.<strong>HOBOware</strong> User’s <strong>Guide</strong> 245
If readouts can no longer be performed on the logger (because the logger was relaunched, or hasstopped, filled up, wrapped more than once between readouts so that data was lost, or wrappedbefore the first partial readout), the countdown timer will read 00:00:00. If you are not sure whyreadouts were cancelled, pause the mouse pointer over the countdown timer for an explanation. Interval (alarms): The frequency with which the monitor is polling the logger for alarm conditions. Last Alarm Check: Time when the last alarm check was performed. Next Alarm Check: Time of the next scheduled alarm check, if applicable, and a countdown timer. Monitored sensor conditions (not labeled): This box lists the sensor conditions, if any, that weredefined for this logger, along with their current values as of the last reading.If a sensor is in an "above" alarm condition, its text is red. If it is in a "below” alarm condition, its text isblue. If it is "okay," its text is black. If there is a communication failure, the current reading is italicizedand in purple text to indicate that it is outdated. Monitored logger conditions (not labeled): The area at the bottom of the window lists the loggerconditions (communication , memory , battery status , and readout ), if any, that weredefined for this logger. The memory icon also displays the amount of memory that has been used.If one of these items is in an alarm condition, its icon is red. Otherwise, it is green.Hiding the MonitorTo hide the monitor without stopping it, click the Hide button on the Alarm and Readout Monitor dialog, or chooseHide Monitor from the Manage Alarms & Readouts submenu on <strong>HOBOware</strong> Pro's Tools menu. The alarm clock iconwill remain in the lower right corner of the main <strong>HOBOware</strong> Pro window to remind you that the monitor isactive, and the icon will turn red and "jump" when an alarm is triggered. In addition, if the configuration is set tonotify on the host machine when an alarm is triggered, the monitor window will open automatically at that time.To restore the monitor window at any time, click the alarm clock iconManage Alarms & Readouts submenu on <strong>HOBOware</strong> Pro's Tools menu., or choose Show Monitor from theStopping the MonitorTo stop the monitor, click the Stop button on the Alarm and Readout Monitor dialog, or choose Stop Monitor fromthe Manage Alarms & Readouts submenu on <strong>HOBOware</strong> Pro's Tools menu. This ends all readouts and notificationsuntil you start the monitor again.After all alarm checks and readouts in progress have finished, the Stop button becomes a Start button, and theHide button becomes a Close button. You can restart the monitor by clicking the Start button, or close it by clickingthe Close button.You can define a configuration to stop the monitor immediately after sending the first alarm notification. Enablethe at first alarm condition, then stop monitor option on the Notifications pane.There are also preference settings that cause the monitor to stop automatically. In Alarm Preferences, in theNotification category, enable Stop monitor after N notifications sent if you want the monitor to stop after sendinga specific number of notifications. Enable Stop the monitor if sending a notification fails if you want the monitorto stop when it is unable to send a notification.Readout FilesIMPORTANT: The Alarm & Readout Tool is no longer installed with <strong>HOBOware</strong> as of version 3.4. This helpsection is included for reference only for existing Alarm & Readout Tool users.When you use the Alarm & Readout Tool to perform scheduled readouts, you have a choice of creating datafiles(.hobo and .dtf) and/or text (.txt) files. Only <strong>HOBOware</strong> can open datafiles, but text files can be imported easilyinto <strong>HOBOware</strong> Pro, and be viewed in text editors, spreadsheets, and other kinds of software.<strong>HOBOware</strong> User’s <strong>Guide</strong> 246
Note: When reading out files to text file format, the data is in SI units. Preferences set to US in <strong>HOBOware</strong> are notfollowed.Readout file numbering schemeThe Alarm & Readout Tool employs a simple numbering scheme to avoid overwriting files that have been createdas a result of scheduled readouts. Each time you start the monitor, the Alarm & Readout Tool's internal counter(the monitor number) increases by one. If the monitor performs readouts, the monitor number is added after thefile name, before the sequence number (if any).For example, consider a configuration with two loggers – LoggerA and LoggerB. Each logger will be read out onceper day, over a period of seven days. LoggerA is configured for partial readouts, which (with default Preferencesettings) results in one file. LoggerB is configured for full readouts, which (again, with default Preference settings)results in seven files.The first time you start the monitor, the monitor number is 1. When you stop the monitor, you should have eightfiles: LoggerA_1.hobo, and LoggerB_1_0000.hobo, LoggerB_1_0001.hobo, LoggerB_1_0002.hobo, etc.The next time you start the monitor, the monitor number is 2. When you stop the monitor, you should again haveeight files: LoggerA_2.hobo, and LoggerB_2_0000.hobo, LoggerB_2_0001.hobo, LoggerB_2_0002.hobo, etc.The monitor number advances every time you start the monitor, even if no readouts are performed. If the monitornumber reaches 99,999, it will roll over to 1.Tip: Be careful when renaming files while they are still in their original location. If, for some reason, you rename"MyLogger_1.txt" to "MyLogger_2.txt," the file could be overwritten the second time you run the monitor.Text File FormatThe first section of the text file contains the header. This header conforms to YAML standards, allowing maximumcompatibility with other software. The remainder of the file contains the data.There are three sections in the text file header: Data Format Logger Info Series InfoThe second section of the text file contains the data.Header Section: Data FormatThis section of the header includes detailed information about the way your text file is formatted. dateTimeDelimiter, dataDelimiter, and decimalSeparator identify (between double‐quotes) thecharacter used to separate date and time; the character used to separate data values from oneanother; and the character that is used as a decimal. dateFormat and timeFormat describe the way dates and times are formatted within the file. Theseformats are determined by the preference settings in <strong>HOBOware</strong> Pro and the regional format settingsof your operating system. For example, 07/31/06 would be represented as MM/dd/yy. (Single‐digitvalues have leading zeros.)• Uppercase HH refers to 24‐hour time (e.g., 15:00:00).• Lowercase hh refers to 12‐hour time (e.g., 3:00:00 PM). This time format should be followedwith "a" to denote an AM/PM indicator (hh:mm:ss a).• Lowercase ss refers to whole seconds. Uppercase SSS refers to milliseconds.• Lowercase mm refers to minutes. Uppercase MM refers to months.<strong>HOBOware</strong> User’s <strong>Guide</strong> 247
gmtOffset and daylightSavings indicate the offset, in hours, from GMT on the computer that launchedthe logger, and whether the computer was in Daylight Saving Time when the logger was launched(true or false).Header Section: Logger InfoThis section of the header contains information about each logger that has data in this file. There is one subsectionfor each logger. (For scheduled readouts, there is only one logger per file.) The first line of each subsection is:‐ &#where "#" is an integer that counts the loggers in this file, beginning with 1. (For scheduled readouts, &1 isthe only subsection.) The remaining fields in each subsection list the logger's launch description, model, vendor, etc., similarto the fields on the Status window in <strong>HOBOware</strong> Pro.Header Info: Series InfoThis section of the header lists each column in the file, excluding the first column ("#") and date/time column.There is one subsection for each series. Series are listed in the same order as their columns within the data. The first field of each subsection is name, followed by the series name. The next field is type, which can be value, state, event, or internalEvent. For value, external event, and state series, type is followed by unitName. Values and external eventshave only one unitName. For state series, the two states are listed on two separate lines, with thehigh state listed first. For value series only, OMClassName, OMPartNumber, OMUnitIndex, OMChannelType, andOMValuePattern provide additional series information to Onset's software. The location, if any, is the location string for a serial logger sensor. The last field of each subsection is logger. This identifies the logger that logged this series or providedthe data from which this series was derived (such as dew point). The logger is identified as *# where"#" corresponds to the logger number in the Logger Info section. (For scheduled readouts, *1 is theonly logger.)Data Section Data is separated from the file header by a row of hyphens. The first row of data consists of the column headings. Each column heading is enclosed in doublequotation marks (" ") and separated by the dataDelimiter character. The first column header is "#";the second column header is "Time, GMT‐04.00" (or whatever offset is appropriate). The remaining columns identify each series name and unit type, if applicable, in the format "SeriesName, Unit" (enclosed in double quotation marks). Each series, including states, external events, andinternal logger events, has its own column. (There are preferences that allow you to include moreinformation in the series column headers.) The first column is the point number, as shown in a <strong>HOBOware</strong> datafile. The date and time are separated by the dateTimeDelimiter character. (There is a preference thatallows you to split date and time into two columns.) For internal logger events, the field value is Logged; otherwise, there is no field value. No zeros or spaces are used for fields that do not contain values.<strong>HOBOware</strong> User’s <strong>Guide</strong> 248
Preferences Rows of data are separated with a paragraph return. Thousands separators are not used. Two thousand (2,000) is expressed as 2000.IMPORTANT: The Alarm & Readout Tool is no longer installed with <strong>HOBOware</strong> as of version 3.4. This helpsection is included for reference only for existing Alarm & Readout Tool users.When you install the Alarm & Readout Tool, an Alarms pane is added to the <strong>HOBOware</strong> Pro preferences dialog. Tochange preferences:1. From the <strong>HOBOware</strong> Pro (Macintosh) or File (Windows) menu, choose Preferences.2. Click the Alarms icon to open the Alarms pane.3. Make changes as needed in the Alarm Conditions, Readouts, Notification, Messages, and Warningspreference groups and click OK.Clicking the Restore Defaults button on the Preferences dialog will restore all preferences, including <strong>HOBOware</strong>Pro and Alarm & Readout Tool preferences.Readout PreferencesThe following preferences are available in the Readouts group: For full readouts: If you have configured loggers for full readouts, a new file is normally created atevery readout, with the file name you entered in the configuration, followed by the monitor number,followed by a numeric suffix to identify the sequence (the sequence number). For example,LoggerA_X_0000.hobo, LoggerA_X_0001.hobo, etc. where X is the monitor number.If you prefer to keep only one file, select overwrite existing file at each readout. This setting is notrecommended when performing full readouts to text files for serial loggers that have wrapping enabled;once the logger has wrapped, the data from the beginning of the deployment will be lost when theoriginal file is overwritten. For partial readouts: If you have configured loggers for partial readouts, a new text file or datafile iscreated with the first readout, and subsequent partial readouts are normally appended to this file.To control the size of text files only, enable for text files, create new file when appended file exceeds andenter the number of rows. This will not split a readout into multiple files; rather, it will create a new fileonly when the existing file has already exceeded this limit. Each file name will have a monitor number,followed by a numeric suffix to identify the sequence (the sequence number). For example,LoggerB_X_0000.txt, LoggerB_X_0001.txt, etc. where X is the monitor number.You can also have the Alarm & Readout Tool create a new text file for every partial readout. Select createnew file at each readout. Each file name will have a monitor number, followed by a numeric suffix toidentify the sequence (the sequence number). For example, LoggerA_X_0000.txt, LoggerA_X_0001.txt,etc. where X is the monitor number.Tip: When performing scheduled readouts, the Alarm & Readout Tool will use the preference settings that were ineffect when you started the monitor. If you change any of the following Readouts preferences while the monitor isrunning, the new settings will not take effect until the next time you start the monitor. Text file data column separator: This setting controls how the columns are separated in the textfile. Choose comma, semicolon, or tab. Text file date and time format: Separate into two columns. By default, date and time are kept in asingle column in the text file to facilitate graphing in spreadsheet programs. If enabled, this settingsplits the date and time into two columns.<strong>HOBOware</strong> User’s <strong>Guide</strong> 249
Include logger serial number in column header: This setting adds the logger’s serial number toeach column header when a text file is saved. This is especially useful if you plan to analyze data fromdifferent loggers. Include sensor serial number (if available) in column header: This setting adds the sensor’sserial number, if it has a serial number, to each column header when a text file is saved. This isespecially useful if your data includes similar series that were recorded on different sensors; forexample, three different temperature series. Include sensor location (if available) in column header: This setting adds the sensor’s locationstring, if it had a location defined at the last launch, to each column header when a text file is saved.This is especially useful if your data includes similar series that were recorded on different sensors; forexample, three different voltage sensors.Alarm Condition PreferencesThe following preferences are available in the Alarm Conditions group: Include channel number in sensor description: For USB loggers, you may include the channelnumber in the sensor description. This is especially helpful if you are using external sensors. Include location in sensor description: For serial loggers, you may include the location that wasdefined for the sensor the last time the logger was launched.Notification PreferencesThe following preferences are available in the Notifications group: Enable notification logging: Enable this option if you would like the Alarm & Readout Tool to keepa log of all notifications that have been created. You may find this helpful if you suspect that you arenot receiving all of your notifications due to problems with your email or text messaging service. Thelog file will be named NotificationLog.txt, and it will be overwritten each time you start the monitor.For Windows users, the notification log will be located in:C:\Documents and Settings\usernameFor Macintosh users, the notification log will be located in:~\Library\Logs For new configurations, remember notification settings from the last started configuration:If you generally use the same notification settings for each configuration, enabling this option will saveyou some time when creating new configurations. For text messages...: Some mobile text messaging services have maximum message length limits. Toensure that you do not miss any text notifications, enable this option and enter the limit in the TextMessage Limit box. If a notification exceeds this number of characters, it will be sent in a series ofshorter messages. Stop the monitor if sending a notification fails: Enable this option if you want the monitor tostop if it is not able to send a notification. Stop monitor after N notifications sent: To stop the monitor after a certain number ofnotifications are sent, enable this option and specify the number of notifications. This helps you limitunnecessary battery drain on the logger and the expense of frequent text messaging if you will not beable to stop the monitor directly at the host system. Enable sound for host notification: By default, notifications on the host machine are accompaniedby a sound. You can select a different sound file, or disable the sound by unchecking the box.<strong>HOBOware</strong> User’s <strong>Guide</strong> 250
To change the sound played with the notification, select a sound from the dropdown list, or click Chooseto browse to the .wav file you want to use. To preview the sound, click the icon.Message PreferencesThe following preference is available in the Messages group: Select the following Message items by default: If you want to include or exclude certain itemsfrom most notification messages, select the items you want to include here. These will become thedefault message items when you create a new configuration.Warning PreferencesSome warning dialogs offer you a checkbox to disable the warning so that you do not see it again. You can alsodisable (and re‐enable) these warning preferences here. There are unsaved file changes: If you try to start the monitor or cancel the configuration dialogwhen the displayed configuration contains settings that have not been saved, this warning gives you achance to save the changes before the configuration dialog closes. The configuration file being opened was created with a different version of the Alarm &Readout Tool: Configuration files from the previous version of this software ("Real Time AlarmSoftware") are fully compatible with the current version. If you save the configuration file after youopen it, it will be updated to the current version. If the configuration includes references to serialloggers, you should click Refresh on the Sensors tab of the Alarms pane before saving the file. Thiswill add more information about the sensors to the configuration file. The monitor is running when closing the application: If you try to quit <strong>HOBOware</strong> Pro while themonitor is running, this warning reminds you that quitting <strong>HOBOware</strong> Pro will stop the monitor, andgives you a chance to cancel. There may be concurrent logger access: This warning appears if you try to communicate with (addor refresh) a logger in the Configure Alarms and Readouts dialog while the logger is included in thecurrently running alarm and readout monitor.<strong>HOBOware</strong> User’s <strong>Guide</strong> 251