Tramore Local Area Plan - Waterford County Council
Tramore Local Area Plan - Waterford County Council
Tramore Local Area Plan - Waterford County Council
- No tags were found...

Create successful ePaper yourself
Turn your PDF publications into a flip-book with our unique Google optimized e-Paper software.
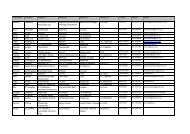
Chapter 2: Demographics2.1 POPULATION2.1.1 1996/2002 Census Population Statistics for <strong>Tramore</strong> TownThe change in population for <strong>Tramore</strong> Town and <strong>Tramore</strong> ED between 1996 and2002 is shown in Table 1 below. It illustrates an increase of population within<strong>Tramore</strong> town of 1769 persons between 1996 and 2002 representing a significantpopulation increase of 27%.Table 1:PopulationFigures …ActualChange%ChangeYearPopulation1996 <strong>Tramore</strong> Town:6536<strong>Tramore</strong> ED:61232002 <strong>Tramore</strong> Town8305 1769 +27%<strong>Tramore</strong> ED76841561 +25.4%The 2002 census illustrates a population profile as per Table 2 below. It is thatthe largest portion of the population is in the 25-44 year old bracket with thenext highest section being the 0-14 year olds. This demographic profileillustrates that the population of <strong>Tramore</strong> is relatively young and that the needfor education and youth facilities is most important. Given that the 25-44 yearold bracket accounts for the greatest proportion of the population it is clear thatthere is a considerable amount of young families in <strong>Tramore</strong>. This may be as aresult of being priced out of the property market in <strong>Waterford</strong> City and otherurban areas and having to move to <strong>Tramore</strong> for more affordable housing.Table 2:AgeProfile asper the2002PopulationCensus…9000800070006000500040003000200010000Age breakdown0-14 15-24 25-44 45-64 65+ total16