PDF, 10.2 MB
PDF, 10.2 MB
PDF, 10.2 MB

You also want an ePaper? Increase the reach of your titles
YUMPU automatically turns print PDFs into web optimized ePapers that Google loves.
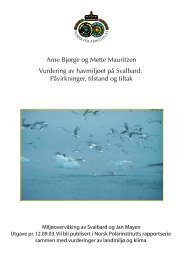
Co-workers:Bert Rudels 2Michael Karcher 1Ingo Harms 6Sergey Pisarev 7Ilker Fer 3Ragnheid Skogseth 4Göran Björk 5Peter Winsor 5Peter Haugan 31 Alfred Wegener Institute for Polar and Marine Research, Bremerhaven, Germany2 Finnish Institute for Marine Research, Helsinki, Finland3 Geophysical Institute, University of Bergen, Bergen, Norway4 The University Centre on Svalbard, Longyearbyen, Norway5 Earth Science Centre, Göteborg University, Göteborg, Sweden6 Institute for Marine Research, Hamburg, Germany7 Shirshov Institute of Oceanology, Moscow, Russiacoworkersl
• Shelf/slope convection is the mechanismby which the Arctic Ocean can directlycontribute to thermohaline circulationRudels et al., 1994Aagaard et al., 1985Aagaard85 Rudels 94
NansenT34.9Nansen, 1906:… properties of Arctic Basindeep water
4Fram Strait32Temperature (°C)10-1IntermediateDeep-234.8 34.85 34.9 34.95 35Salinityca. 1000 mTS Fram Strait in out
MauritzenAndersonMauritzen, 1996:• Source of Greenland Scotland Overflowin the Arctic Ocean1.9 +-0.7 Sv of DSOWAnderson et al., 1999:• 1.7+-0.6 Sv shelf/slope convection & entrainmentbelow 500 mcorresponds to 30% of GSO
NAO+NAO-Arktis convsites
4 processesNeed to know (and model):•Preconditioning -> initial salinity•Ice production and brine release-> amount of salt added to water•Distribution of released salt in the water column•Outflow strength, pathway and entrainment
4 processesNeed to know (and model):•Preconditioning -> initial salinity•Ice production and brine release-> amount of salt added to water•Distribution of released salt in the water column•Outflow strength, pathway and entrainment
Caval&Martin94Cavalieri & Martin, 1994SSM/I & meteorological dataWestern Arctic coastalregions produce0.5 Sv halocline waterAll Arctic shelves togetherproduce 0.7 – 1.2 Sv
Winsor 39 yearsTotal ice production in 28 coastal polynyas over 39 yearsWinsor & Björk, 2000Pease (1987) model &NCEP data•Strong interannualvariation between 240and 380 km 3 /y•Only 40% of estimateby Cavalieri and Martin(1994)
Winsor overallsalinity increase•Barents, Kara,Chukchi and Beringseas contribute tohalocline waterWinsor & Björk,2000•Only Barents andChukchi seas cancontribute to deepwater
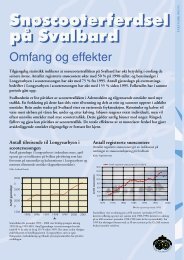
Skogseth StorfjordSkogseth & Haugan, subm.StorfjordERS-2 SAR images& Pease (1987) modelsill⇒ ice production38 km 3 /yr40% belowthin or thick iceTopography important!
4 processes saltdistribNeed to know (and model):•Preconditioning -> initial salinity•Ice production and brine release-> amount of salt added to water•Distribution of released salt in the water column•Outflow strength, pathway and entrainment
StLawrencePolynyaSt. Lawrence Island polynya(Bering Sea)Drucker et al., 2003
Warps NE stationTempJohan HjortAug, Oct2002PolarsternMarch 2003SalDensity
Sal 20m StorfjPolarsternMarch 2003Salinityin 20 m depth
Johan HjortAug, Oct200141427011109ABOVE 35.00 - 35.1034.90 - 35.0034.80 - 34.9034.70 - 34.8034.60 - 34.7034.50 - 34.6034.40 - 34.5034.30 - 34.4034.20 - 34.3034.10 - 34.2034.00 - 34.1035.10BELOW 34.00-05001-04901-04801-04701-04601-04501-04401-04301-04201-0410134.4034.6034.5034.8034.7034.900501001500 10 20 30 40 50Distance (km)PolarsternMarch 2003Pressure (dbar)68 696720ÊESalsecSummer/winter3938 3746 45 44351 52 53545556575832313334646362605961302122242526272965661514 1420 19 18 171613544847649508710ÊE79ÊN78ÊN77ÊN
Skogseth 4 yearsSkogseth & Haugan, subm.StorfjordTotal ice productionIce productionOpen Sal SBWwater/thin (late winter) ice areaSal => SBW Volume (late SBWewinter)=> Volume SBW
4 processes PrecondNeed to know (and model):•Preconditioning -> initial salinity•Ice production and brine release-> amount of salt added to water•Distribution of released salt in the water column•Outflow strength, pathway and entrainment
OdenApril 2002Warps NorthernTemptroughSalJohan HjortAug, Oct2002PolarsternMarch 2003Maybe record lowest salinityrecord highest salinityDensity
NAOSIM (AWI):Salinity in Storfjord 1980 – 2002 High salinity in winter/spring 2002Karcher salinity StorfjordtemperatureVery low salinity inDecember 2002
Salinity in 30 m depth east of Svalbard 1980 – 2002 (NAOSIM)Karcher salinity east of Svalbardsalinity east of Svalbardrecord low in autumn 2002/3Christian Haas, Ron Kwok:Strong ice import in 2002/3
Ice growth anomaly in July(NAOSIM, Michael Karcher)19992000Karcher ice melt20012002-2 m/mon 02
4 processesEntrainmNeed to know (and model):•Preconditioning -> initial salinity•Ice production and brine release-> amount of salt added to water•Distribution of released salt in the water column•Outflow strength, pathway and entrainment
Anderson99plume… entrainment on the slopeAssumption: boundary flow 0.5 Sv0.03 Sv0.01 Sv0.005 Sv0.004 Sv0.003 SvRudels et al., 1994Jones et al., 1995Anderson et al., 1999=> Entrainment whileplume is sinking:100% per 150 m0.01 SvΣ= 0.05 Sv
5 years profiles FSProfiles at 6°30‘E80Ê1600TempSa l75Ê0Ê10Ê20Ê20001997-2001Light transm
Profiles at 6°30‘E80Ê0.25°C0.03 psu75Ê20Ê10Ê0Ê60 m20026 years1997-2001
0Ê30ELocation of theStorfjord outflow plumein Fram Straitin summer 200280N• max depth 2400 m• O(20 km) wide• O(100 km) long78N35.8 psu3000 mMap plumein FramStrait1000 m2000 m76N200 m10E0E
-0.200.00Passage of warm bottom water plume(warm due to entrainment)at 1470 m depth (10 m above bottom)in eastern Fram Strait over 4 months-0.60-0.50-227-226-225-224-223-222-221-220-219-218-217-216-215-214-213-212-211-209-208-207-203-206-205-204-201-200-199-198-195-197-196-186-186-187-188-174-168-167-166-148-147-160-146-145-143-144-153-142-154-141-1552.000-1.403.00-0.950.800.400.400.600.200.20-0.20-0.20-0.50-0.40-0.801.003.002.505001000-0.60-0.70-0.75-0.75-0.701500-0.80-0.85-0.85-0.902000-0.95-0.90-0.902500-0.95velocity-0.95-0.953000Temp-8 -6 -4 -2 0 2 4 6 8LongitudeX⇒ at least0.03 SvTemperatureSep 00 Jan 01 Jan 02 Jul 02temp vel 2000 2002Pressure (dbar)
Quadfaseletal88Quadfasel et al., 19881986Storfjord water sinkingto between 1000 and2100 m depthapprox 0.08 Sv« … Outflow from Storfjordmakes up 20% of Arctic Oceandeep water formation »
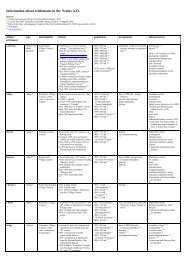
Year - monthMax. SalinityReference or cruise1981 - Aug1985 -Jul1986 - Aug19911993-19941995 - Oct1997 - Jun1998 - Apr1999 - Apr1999 - Jul200020012002 - Apr2003 - March35.335.235.435.0< 35.034.8< 35.03535.135.235.4535.235.83< 35.0Midttun (1985)LanceQuadfasel et al. (1988)Schauer (1995)mooring in southern Storfjord (Schauerand Fahrbach, 1999)Haarpaintner et al. (2001)Valdivia #166, Quadfasel pers. comm.Haarpaintner et al. (2001)Haarpaintner et al. (2001)Haarpaintner et al. (2001)Skogseth and Haugan (2003)Hakon MosbyOden 2002, Polarstern XVIII-2Polarstern WARPSTabelle sal
StorfjordEntrainmentStorfjord… entrainment on the shelftemperature (°C)6420-2the bottom plumeat the shelf edge80Ê75Ê0ÊAtl W34.4 34.8 35.2salinitySchauer and Fahrbach, 199510Êxx1:120Êtemperature (°C)one year TSin the bottom water plume6420-2Atl W34.4 34.8 35.2salinity100% entrainment of ambient waterupon reaching the shelf edge
-1.5HAMSOM1991 northeastern Barents Sea 1996 St. Anna Trough1.0-1.00.5-----------------------00.51.50.0BSSAT sec-1.0-0.5-1.00.51001.01.5-0.5200-0.5Pressure (dbar)0.030040079 35N56 20EM4M3M2-0.576 40N64 30ETemp0 50 100 150 200 250 300 350Distance (km)1.5M181 23N64 52E81 25N75 45E-----------------------034.0034.5034.6034.7010034.8534.8034.80200Pressure (dbar)----------01002.51.52002.0-1.03001.00.5400-0.55006007003.0Pressure (dbar)0 50 100 150Distance (km)-1.0TempT ca. -0.5 °CSal ca. 34.8----------34.0034.7034.6034.9534.8530034.8540034.8033.534.9034.850 50 100 150 200 250 300 350Distance (km)Sa l0100200300400Pressure (dbar)500600700.8534.80.80.85.8534.90.800 50 100 150Distance (km)0 50 100 150Sa l•constantthroughout the year•bottom-intensified flowSchauer et al.. 2002
Barents Topod-O18: 80% of fresh wateris continental runoffAWNCC?Schauer et al., 2002
Dickson DSOWDeep Denmark Strait Salinity[Dickson et al.,2002]Black: NAOSIM model resultsBlue: Observations (Dickson et al., 2002)shifted -0.035ObsNAOSIM?
Michael Karchertuning real thermohalineconvectionto make it fit to his modelWarning!Nevertakemodelersout forfieldwork!warning
leer
HAMSOMSalt release7 km25 levels(HAMSOM, Kerstin Hatten pers. comm.)
Accumulation of salt in StorfjordenSkogseth, subm.Accumulated total salt release ( 10 11 kg)1614121086420200220001998 19992001Nov Dec Jan Feb Mar Apr MayMonth of the year
Maslowski freshwaterFresh water circulation1979 1990-1994Maslowski et al.. 2000
Bottom salinity Novaya ZemlyaBottom salinity StorfjordHigheradvection ofAtl.WaterM 2 -Tide
Dickson DSOWDeep Denmark Strait Salinity[Dickson et al.,2002]Black: NAOSIM model resultsBlue: Observations (Dickson et al., 2002)shifted -0.035ObsNAOSIM
Bottom salinity Novaya SemlyaHAMSO<strong>MB</strong>ottom salinity StorfjordAdvectionAtl.WatersM 2 -Tide
OdenApril 2002Warps CentralTemptroughSalJohan HjortAug, Oct2002PolarsternMarch 2003Density
leer
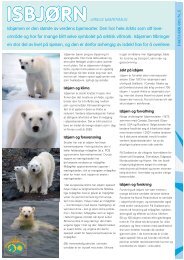
Melling polynya807978PolynyasCanadianArchipelago(courtesy ofHumphrey Melling78 N 79 N 80 N 81 N 82 N 83 N 84 N 85 N85 W 80 W 75 W 70 W 65 W 60 W 55 W 50 W 45 W 40 W 35 W77767574
Karcher BSMaximum densities in deep Barents Sea outflowObserved highNovaya ZemlyaPolynya IcegrowthObserved lowObserved medium valuesObservations: Schauer et al, 2002
NAOSIM