Data Collection Report - Flood Control District of Maricopa County
Data Collection Report - Flood Control District of Maricopa County
Data Collection Report - Flood Control District of Maricopa County

You also want an ePaper? Increase the reach of your titles
YUMPU automatically turns print PDFs into web optimized ePapers that Google loves.
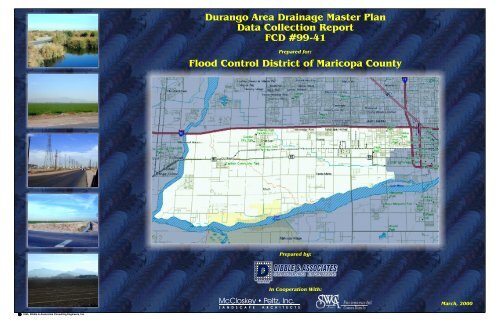
Durango Area Drainage Master Plan<strong>Data</strong> <strong>Collection</strong> <strong>Report</strong>FCD #99-41Prepared for:<strong>Flood</strong> <strong>Control</strong> <strong>District</strong> <strong>of</strong> <strong>Maricopa</strong> <strong>County</strong>Prepared by:In Cooperation With:McCloskey ! Peltz, Inc.L A N D S C A P E A R C H I T E C T SandMarch 2000
Durango Area Drainage Master Plan<strong>Data</strong> <strong>Collection</strong> <strong>Report</strong>Table <strong>of</strong> ContentsList <strong>of</strong> FiguresList <strong>of</strong> TablesI. INTRODUCTION ................................. 1A. Purpose .................................... 1B. Scope <strong>of</strong> Project ............................. 1C. Study Area ................................. 2II. DATA COLLECTION RESULTS .................... 4A. Existing and Planned Drainage Facilities ........ 4B. Areas <strong>of</strong> <strong>Flood</strong>ing ............................ 4C. Existing Studies ............................. 5D. Planned Developments ........................ 5E. Existing and Planned Major Utilities ............ 5F. Agency Contacts ............................. 5G. Survey and Mapping ......................... 7III. INITIAL HYDROLOGY REPORT ................. 15A. Introduction ............................... 15B. Hydrology Model Update .................... 15C. Modeling Results, Discrepancies, & Concerns ... 15IV. LANDSCAPE AESTHETICS & MULTI-USEOPPORTUNITIES ............................... 18A. Introduction ............................... 18B. Purpose ................................... 18C. Methodology ............................... 18D. <strong>Data</strong> <strong>Collection</strong> and Existing Conditions Analysis.......................................... 19E. Visual Resources Assessment ................. 22F. Multi-Use Opportunities Assessment ........... 32V. ENVIRONMENTAL OVERVIEW .................. 35A. Ecological Assessment ....................... 35B. Historical and Pre-Historical Themes Evaluation.......................................... 44C. Archaeological Assessment ................... 48D. Social and Economic Assessment .............. 55E. Hazardous Waste Inventory .................. 61VI. PLAN SET BIBLIOGRAPHY ...................... 67VII. REPORT BIBLIOGRAPHY & REFERENCES ....... 69Figure I-1. Study Location ................................ 1Figure I-2. Jurisdictional Boundaries ....................... 3Figure II-1. Existing FEMA <strong>Flood</strong>plains .................... 8Figure II-2. Planned Developments (1 <strong>of</strong> 2) .................. 9Figure II-3. Planned Developments (2 <strong>of</strong> 2) ................. 10Figure II-4. Existing and Planned Utilities (1 <strong>of</strong> 2) ........... 11Figure II-5. Existing and Planned Utilities (2 <strong>of</strong> 2) ........... 12Figure II-6. Existing Drainage Facilities .................... 13Figure II-7. Irrigation Map .............................. 14Figure III-1. Existing Land Use ........................... 17Figure IV-1. Regional Context Map ....................... 20Figure IV-2. Existing Landscape Character ................ 28Figure IV-3. Scenic Quality .............................. 29Figure IV-4. Visual Resource Inventory .................... 31Figure IV-5. Future Desired Landscape Character ........... 33Figure IV-6. Multiple Use Opportunities ................... 34Figure V-1. Vegetation Communities ...................... 36Figure V-2. Prehistoric Archaeological Sites ................ 46Figure V-3. Historical Features ........................... 49Figure V-4. Block Group Numbers / Significant Block Groups . 58Figure V-5. Hazardous Materials Sites (1 <strong>of</strong> 2) .............. 65Figure V-6. Hazardous Materials Sites (2 <strong>of</strong> 2) .............. 66Table V-1. Project Area Population And Land Area ......... 56Table V-2. Median Household Income And Ethnic Diversity .. 56Table V-3. Block Groups Significant For Low Median HouseholdIncome .......................................... 57Table V-4. Block Groups With Significant* Percentage <strong>of</strong> EthnicMinorities ....................................... 59Table V-5. Significant Block Groups, Significant Proportion <strong>of</strong>Minors And Elderly* .............................. 60Table V-6. Summary Results Of Hazardous Materials <strong>Data</strong>baseSearch .......................................... 64List <strong>of</strong> AppendicesDeveloper Contact InformationHydrology Exhibits 1 and 2Storm Comparison TableResponse Letters from Arizona Game & Fish Dept. and U.S. Fish &Wildlife ServiceWildlife Observed in the Durango Drainage Area
Durango Area Drainage Master Plan<strong>Data</strong> <strong>Collection</strong> <strong>Report</strong>I. INTRODUCTIONThis <strong>Data</strong> <strong>Collection</strong> <strong>Report</strong> has been prepared for the <strong>Flood</strong> <strong>Control</strong><strong>District</strong> <strong>of</strong> <strong>Maricopa</strong> <strong>County</strong> (FCDMC) as part <strong>of</strong> the Durango AreaDrainage Master Plan (ADMP). The study location is shown on FigureI-1.A. PurposeThe purpose <strong>of</strong> the Durango ADMP is to evaluate the existing drainagestudies conducted in the <strong>Flood</strong>plain Delineation <strong>of</strong> the Tolleson Area -Hydrology <strong>Report</strong>, dated March 24, 1999 which defined the Durangowatershed by quantifying the extent <strong>of</strong> flooding problems. There aretwo major objectives <strong>of</strong> the study. The first is to develop a plan tocontrol run<strong>of</strong>f to prevent flood damage in the watershed. The second isto develop an implementation plan to manage the interim conditions dueto discontinuous development in order to preserve the ability to provideprotection to lands downstream from 100-year flood events. The planwill develop and identify preliminary costs, alignments, typical sections,right-<strong>of</strong>-way requirements, utility conflicts, and potential projectparticipants for the preferred alternatives. The study area encompassesapproximately 68 square miles which includes the cities <strong>of</strong> Avondale,Tolleson, and Phoenix, as well as unincorporated <strong>Maricopa</strong> <strong>County</strong> asshown on Figure I-2. The study area is bounded by the Salt, Gila, andAgua Fria rivers and extends northward to I-10 and eastward to I-17.The <strong>Data</strong> <strong>Collection</strong> Phase <strong>of</strong> the ADMP includes identifying knownflooding locations and collecting data regarding existing and proposeddrainage facilities, major natural washes, and existing utilities. The datacollection effort also includes identification <strong>of</strong> planned residentialdevelopments, recreational facilities, and environmental issues andopportunities within the study area. The purpose <strong>of</strong> this <strong>Data</strong> <strong>Collection</strong><strong>Report</strong> is to describe the data gathering process and to present thefindings. Results from this report will be used in later phases <strong>of</strong> thestudy.B. Scope <strong>of</strong> ProjectThe scope <strong>of</strong> work includes pr<strong>of</strong>essional engineering services necessaryfor developing an area drainage master plan (ADMP) to identify drainageproblems and develop cost effective solutions for a storm watercollection and disposal system. The scope <strong>of</strong> work includes publiccoordination, document/data review and research, survey and mapping,hydrology, hydraulics, floodplain delineation, identification <strong>of</strong> drainageproblems, development <strong>of</strong> alternative solutions, cost estimates, andpreparation <strong>of</strong> preliminary design plans based on a preferred alternative.The project consists <strong>of</strong> five phases resulting in an implementation planwith estimated costs for a recommended plan to address the drainageissues within the study area. The five project phases are summarized asfollows:PhaseProducts1. <strong>Data</strong> <strong>Collection</strong> <strong>Data</strong> <strong>Collection</strong> <strong>Report</strong>Survey & Mapping2. Level I Analysis Potential Alternatives SubmittalFigure I-1. Study Location3. Level II Analysis Alternatives Analysis <strong>Report</strong>4. Level III Analysis Recommended Design <strong>Report</strong>Preliminary Design Plans5. Implementation Final SubmittalMaintenance PlanThis <strong>Data</strong> <strong>Collection</strong> <strong>Report</strong> is the final product for Phase I <strong>of</strong> theproject.DIBBLE & ASSOCIATES 1 DURANGO ADMPDATA COLLECTION REPORT
C. Study AreaThe study area encompasses approximately 68 square miles bounded byI-10 on the north, I-17 on the east, the Salt and Gila Rivers on the south,and the Agua Fria River on the west. The project area can be generallyanalyzed in three geographic areas. The study areas are shown onFigure I-2.The Northern Study Area extends the full width <strong>of</strong> the study area fromthe Agua Fria River eastward to I-17 and from I-10 southward to theSouthern Pacific Railroad at approximately Buckeye Road. TheSouthwest Study Area extends from the Agua Fria River eastweard toapproximately 83 rd Avenue and from the Southern Pacific Railroadsouthward to the Gila River. The Southeast Study Area extends fromapproximately 83 rd Avenue eastward to I-17 and from the SouthernPacific Railroad southward to the Salt River.DIBBLE & ASSOCIATES 2 DURANGO ADMPDATA COLLECTION REPORT
II. DATA COLLECTION RESULTSA. Existing and Planned Drainage FacilitiesFew drainage facilities exist within the study area. The drainage patternis predominantly overland in a northeast to southwest directionaccumulating along the Roosevelt Irrigation <strong>District</strong> (RID) Canal andalong the Southern Pacific Railroad and eventually reaching the Salt andGila Rivers on the south and the Agua Fria River on the west.Papago Diversion ChannelThe ADOT Papago Diversion Channel runs to the west along the northside <strong>of</strong> Interstate 10 and defines the north limit <strong>of</strong> the study area. Thischannel captures flow from the north and diverts it west to the Agua FriaRiver. Most <strong>of</strong> the storm drains from the north tie into the channel,although some pass to the south unintercepted.Other facilities receive and convey run<strong>of</strong>f by virtue <strong>of</strong> the fact that theyare within the path <strong>of</strong> the run<strong>of</strong>f even though they are not designed fordrainage. Existing features that receive run<strong>of</strong>f are the Buckeye FeederCanal, and several small Salt River Project (SRP) irrigation ditches alongagricultural properties. All <strong>of</strong> the canals in the project area are designedfor irrigation delivery rather than storm drainage. This results in floodingwhen run<strong>of</strong>f exceeds the capacity <strong>of</strong> the canals. Run<strong>of</strong>f that isintercepted by the railroad embankment makes its way westerly along theface <strong>of</strong> the embankment. Run<strong>of</strong>f flowing west along the embankmentponds behind section line roads that have raised pr<strong>of</strong>iles to pass over therailroad. The flow breaks out to the south when the ponding elevationexceeds the height <strong>of</strong> the embankment. None <strong>of</strong> the cross-roads haveculverts <strong>of</strong> a significant enough size to drain nuisance flows through theroadway embankment.Agua Fria LeveeThe Agua Fria Levee extends from north <strong>of</strong> Interstate 10 south toBuckeye Road near the Southern Pacific Railroad. The levee is designedto convey the 100 year storm flow in the river without overtopping thebanks. Consideration will be given to new outlets for any new drainageimprovements planned to discharge into the Agua Fria river.Holly Acres LeveeThe Holly Acres Levee is an existing bank protection project on the GilaRiver, extending from 113 th Avenue downstream to El Mirage Road.The levee was designed to accommodate a flow <strong>of</strong> 115,000 cubic feetper second (cfs) with three feet <strong>of</strong> freeboard, however at approximately100,000 cfs, the river flows over the north bank at 99 th Ave and aroundthe Holly Acres Levee. The levee is not in danger <strong>of</strong> being overtoppedsince it is outflanked before the river level rises high enough. Theoutflanking is not likely to cause damage to the levee, as it is armoredwith stones on both sides.Tres Rios projectThe Tres Rios project is an ongoing project in the Salt/Gila River withan effort to restore critical riparian and wetland habitats that have beenlost in the region as a result <strong>of</strong> water resources development in thePhoenix metropolitan area. The project extends from the 91 st Avewastewater treatment plant to just downstream <strong>of</strong> the confluence withthe Agua Fria River. The project is currently in a feasibility study phaseand will identify potential benefits for flood control, including bankprotection levees.All <strong>of</strong> the existing culverts in the study area are considered insignificantdue to their small size and incapacity to convey storm flows during thedesign event. Therefore the capacities <strong>of</strong> the existing culverts are notanalyzed.South Mountain Freeway (Loop 202)The possibility exists for a future Loop 202 Freeway extension to thesouth, approximately along the 59 th Ave alignment, which may blockwesterly drainage within the study area. It is anticipated that the designfor the freeway will include collector channels and basins to intercept therun<strong>of</strong>f, retain the flows, and drain south to the Salt River. The potentialmay exist to cooperate with ADOT in developing a new drainage outfallfor the area.B. Areas <strong>of</strong> <strong>Flood</strong>ingAreas <strong>of</strong> flooding within the study area have been delineated as FEMAfloodplains along the Salt, Gila, and Agua Fria Rivers, along theupstream embankment <strong>of</strong> the RID Canal and along the SPRR. ExistingFEMA floodplains are shown on Figure II-1. Additionally localflooding problems have been reported and are known to exist along theBuckeye Feeder Canal, along 91 st Avenue between Interstate 10 and theSPRR, and along Van Buren Street in the vicinity <strong>of</strong> 95 th and 96 thAvenues.DIBBLE & ASSOCIATES 4 DURANGO ADMPDATA COLLECTION REPORT
Buckeye Feeder CanalThe Buckeye Feeder Canal along 115 th Ave is a known flooding area dueto the limited capacity <strong>of</strong> the canal to convey storm water and featureswithin the canal such as culverts which restrict the flow. The BuckeyeFeeder Canal floodplain is being delineated as part <strong>of</strong> this project fromthe Gila River to 91 st Avenue.91 st AvenueThe intersection <strong>of</strong> 91 st Avenue and Van Buren is a known floodingproblem due to the inadequate conveyance capacity <strong>of</strong> 91 st Avenuebetween Van Buren Street and the SPRR. There is an existing SRPirrigation ditch along the east side <strong>of</strong> 91 st Avenue which historicallyintercepts storm water flows generated east <strong>of</strong> 91 st Avenue. This ditchis not designed for storm flows and the culvert and pipe downstream <strong>of</strong>Van Buren Street restrict the flow, resulting in ponding and flooding inthe direct vicinity <strong>of</strong> the intersection.Van Buren StreetIn the vicinity <strong>of</strong> 95 th and 96 th Avenues, Van Buren Street is a knownflooding problem due to ponding in the area. Run<strong>of</strong>f that accumulatesin this area comes from the east on Van Buren Street, from 91 st Avenue,and from the subdivisions north <strong>of</strong> the street. A lack <strong>of</strong> an existing stormdrain system in the street and inadequate roadway slope result in thepoor conveyance <strong>of</strong> storm flows through the area.C. Existing StudiesSeveral other studies <strong>of</strong> this area have been conducted. They include:1) <strong>Flood</strong>plain Delineation <strong>of</strong> the Tolleson Area,2) Tolleson - SPRR and Van Buren Street at 91 st Ave, CandidateAssessment <strong>Report</strong>,3) Drainage Concept <strong>Report</strong>, 115 th Ave - Gila River Bridge to MC 854) City <strong>of</strong> Phoenix - Estrella Village Plan,5) Salt-Gila River <strong>Flood</strong>plain Delineation Restudy6) Agua Fria River <strong>Flood</strong>plain Delineation RestudyD. Planned DevelopmentsStaff from the various cities have provided information regardingdevelopments, within their respective boundaries, which are currently inthe site planning, engineering, or review stages. Planned majordevelopments are illustrated on Figure II-2 and Figure II-3. The sizeand number <strong>of</strong> these developments are indicators <strong>of</strong> the pace at whichthis area is developing.E. Existing and Planned Major UtilitiesThe locations <strong>of</strong> existing and proposed utilities are indicated on theUtility Constraints Map, Figure II-4 and Figure II-5. The existing andproposed water and sewer lines information was collected from theCities <strong>of</strong> Phoenix, Tolleson, and Avondale. The map also shows thelocations <strong>of</strong> overhead high-voltage transmission lines (115 kV, 230kV,and 500kV), and high-pressure petroleum pipe-line. Additionally a 114"Effluent Line is shown, which delivers treated wastewater from the 91 stAvenue wastewater treatment plant to the Palo Verde NuclearGenerating Station to the west <strong>of</strong> the study area. Fiber Optic facilitiesare not shown on the utility maps due to the inability to obtaininformation from sources such as US West Communications, who areunwilling to release the information until the final design stage <strong>of</strong> aproject.The abundance <strong>of</strong> wastewater treatment plants and large diameter sewerand water lines in the study area is <strong>of</strong> particular importance and will becarefully considered along with the other existing and proposed utilitiesduring the design and development <strong>of</strong> the final alternative drainagesolution.The locations <strong>of</strong> existing drainage facilities, including major storm drainpipes are indicated on the Existing Drainage Facilities Map, Figure II-6.The locations <strong>of</strong> the major irrigation ditches and canals are indicated onthe Existing Irrigation Map, Figure II-7.F. Agency ContactsThe following agencies have jurisdiction within the project limits andhave been invited to participate in the study process as part <strong>of</strong> a ReviewCommittee:- City <strong>of</strong> Phoenix (COP)- City <strong>of</strong> Tolleson- City <strong>of</strong> Avondale- <strong>Maricopa</strong> <strong>County</strong> Department <strong>of</strong> Transportation (MCDOT)- <strong>Maricopa</strong> <strong>County</strong> Recreation Services Department- <strong>Maricopa</strong> <strong>County</strong> Planning and Development Department- Salt River Project (SRP)- Roosevelt Irrigation <strong>District</strong> (RID)Each <strong>of</strong> the agencies was contacted during the data collection phase <strong>of</strong>the project to inform them <strong>of</strong> the project and obtain pertinent informationregarding flooding problems, existing and planned projects, planningconstraints, and recreational and environmental opportunities within theproject limits. One <strong>of</strong> the project goals is to identify project participantsfor cost sharing and environmental enhancement to provide an“environmentally friendly” approach to flood control that providesDIBBLE & ASSOCIATES 5 DURANGO ADMPDATA COLLECTION REPORT
multiple use benefits to the community. The results <strong>of</strong> the agencymeetings are summarized in the following sections.City <strong>of</strong> Phoenix (COP)The City <strong>of</strong> Phoenix occupies the east half <strong>of</strong> the study area. There ismore existing development in this part <strong>of</strong> the study area than in any otherportion. Due to the extent <strong>of</strong> the development near the Interstate 17 andInterstate 10 freeway interchange, there is little opportunity for drainageimprovements in this urbanized area. There are many new subdivisionsin the planning and/or construction phase throughout the rest <strong>of</strong> the City<strong>of</strong> Phoenix portion <strong>of</strong> the study area, which are replacing existingagricultural lands, however the major portion <strong>of</strong> the City <strong>of</strong> Phoenix inthe study area remains agricultural.The Tres Rios wetlands project resides at the City <strong>of</strong> Phoenix 91 st Avewastewater treatment plant and may affect the outfall locations <strong>of</strong>drainage improvements in the vicinity. The City is receptive torecreational projects such as trails and parks in conjunction with a floodcontrol project.City <strong>of</strong> TollesonThe City <strong>of</strong> Tolleson is familiar with the objectives <strong>of</strong> the study, basedon the outcome <strong>of</strong> the previous study <strong>Flood</strong>plain Delineation <strong>of</strong> theTolleson Area and the Candidate Assessment <strong>Report</strong> for Tolleson -SPRR, Van Buren Street at 91 st Ave, which identified local drainageproblems and potential solutions. The City does not have an existingstorm drainage system although there are some catch basins which havedrain connections into the Salt River Project irrigation system. Newdevelopments in the City <strong>of</strong> Tolleson are required to retain the 100 year,6 hour storm run<strong>of</strong>f, and are also required to accept the run<strong>of</strong>f fromexisting adjacent properties. There is currently no city wide drainagemaster plan. The city is receptive to drainage improvements andcombined recreation opportunities, although funding for projects hasbeen an issue with residents in the past.There are several known flooding problems in the downtown area <strong>of</strong>Tolleson, along the railroad, along the Roosevelt Irrigation <strong>District</strong> canaland northwest <strong>of</strong> 91 st Ave and the railroad in a vegetable processing area.There are only a few public works projects currently planned in the City<strong>of</strong> Tolleson. The widening <strong>of</strong> 91 st Ave is a street improvement projectwhich also includes putting one <strong>of</strong> the main SRP irrigation ditches intoa pipe, and possibly building a regional retention basin to handle stormrun<strong>of</strong>f.City <strong>of</strong> AvondaleThe City <strong>of</strong> Avondale occupies or will soon be annexing the west third<strong>of</strong> the study area, and is quickly developing with new residential andcommercial projects. More than 37 projects are currently in theplanning, permit, or construction phase. The only major drainagestructures in the City <strong>of</strong> Avondale are the levee pipes into the Agua FriaRiver. Some <strong>of</strong> the known flooding problems in the City are along 115 thAve north <strong>of</strong> the railroad, 115 th Ave between Broadway and Southern,and the Rio Vista and Las Ligas neighborhoods which are at low pointsbehind the levee, and along Van Buren Street. The City indicated thatapproximately 200 cfs flows in the vicinity <strong>of</strong> the east bridge approach<strong>of</strong> Van Buren Street out to the Agua Fria River.The City <strong>of</strong> Avondale is actively participating in the Tres Rios Greenwayand desires to have a blanket agreement to improve and landscape theareas behind the levee on the Agua Fria River. The City is receptive tocooperating on opportunities to provide recreation facilities inconjunction with flood control projects. There are some large existingeasements in the City for the major overhead power transmission lineswhich cross through the study area. Some <strong>of</strong> the easements are not usedand will be considered for trails and recreation opportunities as part <strong>of</strong>a flood control project.<strong>Maricopa</strong> <strong>County</strong> Department <strong>of</strong> Transportation (MCDOT)The <strong>Maricopa</strong> <strong>County</strong> Department <strong>of</strong> Transportation is mainly involvedin the study area as far as transportation improvements are concernedand how they relate to or affect any drainage improvements. Currentlythere are five projects in the planning or construction phase, none <strong>of</strong>which will have any major impacts on drainage in the study area. Two<strong>of</strong> these projects include the 59 th Ave crossing <strong>of</strong> the Salt River and theimprovements <strong>of</strong> 115 th Ave. The 115 th Ave improvements include aculvert under the roadway at the Southern Pacific Railroad crossing.The <strong>County</strong> is also preparing to construct two small bridges over theBuckeye Feeder Canal on Chamber and Rosier Streets <strong>of</strong>f <strong>of</strong> 115 th Ave.These bridges will be considered in selecting the preferred alternative forthe Buckeye Feeder Canal.<strong>Maricopa</strong> <strong>County</strong> Recreation Services DepartmentThe <strong>Maricopa</strong> <strong>County</strong> Recreation Services Department is responsible forpreserving and maintaining parks on <strong>Maricopa</strong> <strong>County</strong> lands. Most <strong>of</strong>the <strong>County</strong> parks are several thousand acres in size, as they do notparticipate much in the development <strong>of</strong> local and regional parks. The<strong>County</strong> is receptive to participating in the “El Rio” project, which is adownstream continuation <strong>of</strong> the Tres Rios project, and includes riverrestoration, flood control, and recreational opportunities. A <strong>County</strong> trailDIBBLE & ASSOCIATES 6 DURANGO ADMPDATA COLLECTION REPORT
system, called the Sun Circle Trail, has been under development forseveral years along with a more recent proposal for a larger trailpreliminarily called the <strong>Maricopa</strong> <strong>County</strong> Trail. Consideration will begiven to combining parts <strong>of</strong> the proposed trail systems to new floodcontrol projects as much as is feasible.<strong>Maricopa</strong> <strong>County</strong> Planning and Development DepartmentThe <strong>Maricopa</strong> <strong>County</strong> Planning and Development Department isassociated with lands not yet annexed by one <strong>of</strong> the three cities in thestudy area. All development, rezoning, industrial expansion, and specialuse permits in these non-annexed areas, are reviewed by the <strong>County</strong>.The <strong>County</strong> Planning and Development Department is not active inpursuing a partnership for future drainage improvements and recreationalopportunities or cost-sharing opportunities for a flood control project.Salt River Project (SRP)Salt River Project owns and operates the majority <strong>of</strong> the canals andirrigation ditches in the study area. The Buckeye Feeder Canal is atailwater ditch that delivers a minimum <strong>of</strong> 40 cubic feet per second (cfs)<strong>of</strong> flow to the Buckeye Irrigation district west <strong>of</strong> the Agua Fria River.The Buckeye Feeder Canal is highly susceptible to overtopping andflooding the surrounding area during storm conditions, especially along115 th Ave, due to it’s alignment in a natural drainage flow path, and theconstrictions in the canal such as culverts and bends in alignment.Transferring the irrigation water in the Buckeye Feeder Canal to a pipeddelivery system is one possible solution according to SRP, however siltand mud entering the pipe from agricultural fields will have to beconsidered.Other known flooding problems that SRP has encountered include 91 stAve between Interstate 10 and the SPRR and the areas <strong>of</strong> 99 th Ave andSouthern Ave, 107 th Ave and Lower Buckeye Road, and the overtopping<strong>of</strong> irrigation laterals at 67 th Ave and the Salt River.SRP generally prefers not to share their maintenance access roads for useas a public trail due to liability and daily maintenance access concerns.Another study area issue for SRP is that local on-site retention doesn’talways work, and storm water ends up in the irrigation ditches whichovertop and cause downstream flooding.Roosevelt Irrigation <strong>District</strong> (RID)The Roosevelt Irrigation <strong>District</strong> owns and operates the main RooseveltIrrigation <strong>District</strong> canal which is an open cut canal, and several smallerlateral canals such as the Salt Canal which are mostly piped undergroundand deliver groundwater from well-pump fields within the study area.The main concern and emphasis <strong>of</strong> the RID for the study, will becoordination so as not to conflict with existing pipes and canals. TheRID generally does not favor multi-use opportunities such as trails ontheir maintenance access roads, due to liability and operationalmaintenance concerns. All <strong>of</strong> the RID access roads are marked as “NoTrespassing” because the canals are stocked with fish for weed and algaecontrol and fishing in the canals is not permitted. Specific concerns andagreements with the RID will need to be addressed during thealternatives analysis.The RID also does not favor using their canals to dispose <strong>of</strong> excessstorm water, as they receive no benefit from it and there may bepollutants in the storm water causing issues further downstream.The only flooding problems known to the RID are the areas <strong>of</strong> 67 th Aveand 75 th Ave at the main canal, which is due to the elevated embankment<strong>of</strong> the canal.G. Survey and MappingThe <strong>Flood</strong> <strong>Control</strong> <strong>District</strong> has had aerial photography flown for thisproject in January 1999. The study area has been reflown in January2000 for the purpose <strong>of</strong> developing a new color aerial photograph.Previous aerial mapping was performed in the study area as part <strong>of</strong> theMaryvale Area Drainage Master Study, flown April 21, 1994. There isexisting ground survey <strong>of</strong> certain features <strong>of</strong> the study area, such as theBuckeye Feeder Canal, which was prepared by SRP. The existingsurvey data will be correlated to the project datum and used as part <strong>of</strong>this study. Additionally, new survey has been performed for this projecton the Buckeye Feeder Canal and the Southern Pacific Railroad.DIBBLE & ASSOCIATES 7 DURANGO ADMPDATA COLLECTION REPORT
III. INITIAL HYDROLOGY REPORTA. IntroductionThe hydrology for this study was developed based on hydrology fromthe <strong>Flood</strong>plain Delineation <strong>of</strong> the Tolleson Area (Project FCD 95-26)and modified to reflect changes in land-use and routing which haveoccurred since the original study. The reader is encouraged to read theabove mentioned Hydrology <strong>Report</strong> to become familiar with thedevelopment <strong>of</strong> the model.The watershed limits have remained unchanged since the original study.The approximate watershed limits are Interstate 10 on the north, the Salt& Gila Rivers on the south, Interstate 17 on the east and the Agua FriaRiver on the west. The direction <strong>of</strong> run<strong>of</strong>f is generally from thenortheast to the southwest. The watershed is characterized by a largeamount <strong>of</strong> agricultural land with increasing amounts <strong>of</strong> residential andindustrial development continuing to take place. As a result, overlandflow is the predominant flow condition.B. Hydrology Model UpdateThe U.S. Army Corps <strong>of</strong> Engineers, HEC-1 <strong>Flood</strong> Hydrograph Package(HEC-1) computer program was used to develop this model. Guidanceis given in the Drainage Design Manual for <strong>Maricopa</strong> <strong>County</strong>, Arizona,Volume I, Hydrology (DDM1) for application <strong>of</strong> the HEC-1 programwithin <strong>Maricopa</strong> <strong>County</strong>. Additionally, the computer program DrainageDesign Menu System (DDMS), developed by the <strong>District</strong>, was used tomodify land use parameters which have changed due to development.Features within the DDMS used for this study include Computation <strong>of</strong>Precipitation Frequency-Duration Values in the Western United States(PREFRE) and <strong>Maricopa</strong> <strong>County</strong> Unit Hydrograph Procedure 2(MCUHP2).Point precipitation rainfall values are taken from NOAA Atlas II,Volume VIII. The PREFRE program included with the DDMS wasused in conjunction with the precipitation isopluvial maps contained inthe DDM1. Four storm events were evaluated for this study. Theyinclude the 10 and 100-year events each having a 6- and 24-hourduration. The rainfall values for each is given as:10-yr, 6-hr 10-yr, 24-hr 100-yr, 6-hr 100-yr, 24-hr2.06" 2.47" 3.23" 3.99"Rainfall losses due to soil types have remained unchanged since theoriginal study. However, because <strong>of</strong> rapid development, losses due toland use must be revised. For the purpose <strong>of</strong> this study, the land use wasmodified based on aerial photographs and field reconnaissance. Thecurrent land use is shown on Figure III-1. Any revisions noted for agiven subbasin were coded into the DDMS and new loss parametersgenerated. Printouts <strong>of</strong> these revised subbasins can be found in theAppendix.C. Modeling Results, Discrepancies, & ConcernsResults from the modeling effort are summarized in the Appendix as aStorm Comparison Table which shows peak flows and the time <strong>of</strong> peak,at each HEC-1 step, for the four storm events. The sub-basin boundariesand schematic routing diagram are shown on Exhibit 1 and 2 in anenvelope also in the Appendix.Two <strong>of</strong> the revised sub-basins had significant changes in peak dischargeas a result <strong>of</strong> the update. Sub-basins VB and JC produced peakdischarges that are approximately one-half the previous values. Thechange is due to a large percentage <strong>of</strong> the drainage area changing froma “Crops” land use designation with a “wet” moisture condition to“Light Industrial” and “Low Density Residential” with a “Normal”moisture condition. The remaining 26 revised sub-basins had changesin peak discharge within 10% <strong>of</strong> the original peak discharge. The cause<strong>of</strong> the significant change in peak discharge resulting from changing“Crops” to other land uses should be investigated. The change couldhave a significant impact on fully developed condition peak dischargeswithin the study area.Proposed South Mountain FreewayAt this time the effects on drainage <strong>of</strong> the South Mountain Freeway arenot considered in the hydrology model. According to the DrainageDesign Concept <strong>Report</strong> for the Southwest Loop Highway (September,1988), construction <strong>of</strong> this Freeway will require several modificationsand improvements to the drainage features in the area. Theseimprovements include channels, storm drains and detention basins – none<strong>of</strong> which are included in the model.Stage Storage routing at Holly AcresCurrently, the hydrology model ignores the effects <strong>of</strong> the Holly AcresLevee. Run<strong>of</strong>f generated from subbasins AB, AC, and AD is routedDIBBLE & ASSOCIATES 15 DURANGO ADMPDATA COLLECTION REPORT
directly into the Gila River without any concern for ponding behind theLevee. Additionally, ponded water is likely to reach a point where itwould overtop El Mirage Road, 107 th and, 115 th Avenues and continuetoward the west.RetentionWhile the landuse parameters have been changed to account for rainfalllosses, the question arises as to the issue <strong>of</strong> on-site retention. Hasretention been adequately addressed for these new developments, bothcommercial and residential? While DDMS does adjust parameters forpercent impervious area (RTIMP), no consideration is provided forlosses due to retention.3. The hydrologic routing parameters will be revised along theBuckeye Feeder Canal to more accurately depict the channelized flowconditions within the Canal.4. Large area retention basins constructed with recentdevelopment will be incorporated into the model to the extent that theirexistence and volume can be verified.5. Ponding <strong>of</strong> run<strong>of</strong>f behind the Holly Acres levee will be addedto the model by preparing a stage-storage relationship from the projectmapping.Planned Model RevisionsThis Initial Drainage <strong>Report</strong> is the starting point for a “living” documentthat will evolve over the course <strong>of</strong> the project resulting in a FinalDrainage <strong>Report</strong> at the end <strong>of</strong> the project. The issues just presentedwere reviewed in a meeting with the FCDMC on March 15, 2000. Thefollowing modifications will be made to the model during the nextproject phase:1. The existing conditions land use will be reviewed in moredetail using color aerial photography taken February 15, 2000. Forpurposes <strong>of</strong> this study, the February 15 photography will be the basis <strong>of</strong>“existing conditions.”2. Based on the land use review, sub-basin boundaries may berevised to accurately model differences in land use and to moreaccurately model certain areas within the watershed for master planpurposes.DIBBLE & ASSOCIATES 16 DURANGO ADMPDATA COLLECTION REPORT
IV. LANDSCAPE AESTHETICS & MULTI-USE OPPORTUNITIESA. IntroductionAs an integral part <strong>of</strong> the <strong>Data</strong> <strong>Collection</strong> phase for the Durango AreaDrainage Master Plan, the Landscape Aesthetic and Multi-Use Analysiswill form the basis for the development <strong>of</strong> flood control alternativeswhich will best integrate, enhance, and preserve the community character<strong>of</strong> the Durango Study Area as well as maximize multiple useopportunities.B. PurposeThe purpose <strong>of</strong> the Landscape Aesthetics and Multi-Use OpportunitiesAssessment is to:- Research, identify, describe, document, and evaluate the existingand desired future features and characteristics <strong>of</strong> the study area.- Identify potential opportunities for flood control facility layoutsand design themes which may either preserve, enhance, or createa desired community character.- Identify potential opportunities to maximize multi-useopportunities.- Develop specific rating criteria by which proposed flood controlfacility alternatives for this area can be evaluated and compared.Alternatives will be evaluated and rated with regards toconsistency with desired future character, and the extent towhich opportunities to improve landscape aesthetics arecaptured, and valued aesthetic features are protected and orenhanced.C. MethodologyThe methodology used to compile data pertinent to the landscapeaesthetics and multi-use opportunities assessment has involved acombination <strong>of</strong> collecting and review <strong>of</strong> existing plans, reports, aerialphotographs, and mapping; meetings with agencies and stakeholders, andfield reconnaissance <strong>of</strong> the study area.The data collection effort has consisted <strong>of</strong> the following tasks to date:1. Review and analysis <strong>of</strong> the existing black and white aerialphotography <strong>of</strong> the study area provided by the <strong>Flood</strong> <strong>Control</strong><strong>District</strong>2. Review <strong>of</strong> G.I.S. land use information provided by the <strong>Flood</strong><strong>Control</strong> <strong>District</strong>3. Review <strong>of</strong> topographic information <strong>of</strong> the study area provided bythe <strong>Flood</strong> <strong>Control</strong> <strong>District</strong>4. Review <strong>of</strong> existing plans, maps, and reports provided byagencies and the <strong>Flood</strong> <strong>Control</strong> <strong>District</strong>- The Estrella Village Plan- The Estrella Village Multi-Purpose Trail Plan- The Estrella Village Arterial Street Landscaping Program- Site plans for proposed developments within the City <strong>of</strong>Phoenix- Draft South Mountain Parkway Specific Plan - June1999- <strong>Maricopa</strong> <strong>County</strong> <strong>Flood</strong> <strong>Control</strong> Structures Map -November 1998- Tolleson General Plan - 1996- Candidate Assessment <strong>Report</strong> - Tolleson - SPRR andVan Buren Street at 91st Avenue - August 1999- West Valley Recreation Corridor Design Concept <strong>Report</strong>- June 1999- Sun Circle Trail Map- Tres Rios River Management Plan - Steering CommitteeSummary <strong>Report</strong> and Consensus Plan - September 1998- City <strong>of</strong> Avondale Proposed/Planned DevelopmentsExhibit- City <strong>of</strong> Avondale Tres Rios Greenway Specific Plan -November 1996, June 1997- City <strong>of</strong> Avondale General Plan - Gruen Associates5. Meetings and consultation with agencies including <strong>Maricopa</strong><strong>County</strong> Recreation Services(James Host), <strong>Maricopa</strong> <strong>County</strong>Department <strong>of</strong> Planning and Development Department (NeilUrban), City <strong>of</strong> Phoenix (Cindy White and Christine Hood), 91stAvenue WWTP / Tres Rios (Roland Wass), City <strong>of</strong> Avondale(Scott Ziprich), City <strong>of</strong> Tolleson (Woodrow Scoutten), SaltRiver Project (Steven Tanis), Roosevelt Irrigation <strong>District</strong> (StanAshby), and <strong>Maricopa</strong> <strong>County</strong> Department <strong>of</strong> Transportation(Mike Smith)6. Site visits. Our field inventory was conducted by means <strong>of</strong> a“windshield survey” <strong>of</strong> the study area as viewed from majorstreets. The information presented herein represents areconnaissance level inventory and general assessment <strong>of</strong> theDIBBLE & ASSOCIATES 18 DURANGO ADMPDATA COLLECTION REPORT
study area. More detailed information for specific areas will becollected as alternatives are developed and refined.In addition to the <strong>Data</strong> <strong>Collection</strong> which has already taken place, publicsensing via Public (Neighborhood), Committee and Agency (ProjectStakeholders and Special Interest Groups) meetings will be an ongoingprocess through the course <strong>of</strong> the study. There are two PublicNeighborhood Meetings each at two different locations within the studyarea and three Review Committee Meetings scheduled over the course<strong>of</strong> the study. An Aesthetic Advisory Committee consisting <strong>of</strong> landscapearchitects, a developer, engineers, and other planning and designpr<strong>of</strong>essionals has also been assembled to <strong>of</strong>fer ideas and provideaesthetic input at each phase <strong>of</strong> the project. The Aesthetic AdvisoryCommittee is scheduled to meet just prior to each <strong>of</strong> the ReviewCommittee meetings. Questionaires will be developed for PublicMeetings and meeting notes prepared from Committee and AgencyWorkshops and Meetings to document input. Input received will beused to generate ideas, designate and refine desired future communitygoals and character as well as to document feedback and responseregarding proposed alternatives and themes.Information derived from the above tasks has formed the basis for thenarrative and graphic depictions included herein.D. <strong>Data</strong> <strong>Collection</strong> and Existing Conditions AnalysisRegional ContextThe Durango Study Area is located in the southwest portion <strong>of</strong> thePhoenix metropolitan area. (Figure IV-1). The area is physicallybounded by the I-10 Papago Freeway to the north, the I-17 BlackCanyon Freeway to the east, the Salt and Gila Rivers to the south, andthe Agua Fria River to the west. The study area encompasses portions<strong>of</strong> unincorporated <strong>Maricopa</strong> <strong>County</strong> as well as the Cities <strong>of</strong> Phoenix,Tolleson, and Avondale. All three cities extend beyond the boundaries<strong>of</strong> the study area - Tolleson to the north, Avondale to the west andnorthwest and Phoenix to the north, east, and southeast. Other adjacentcommunities include the Gila River Indian Community and Town <strong>of</strong>Laveen immediately to the south <strong>of</strong> the Salt River and somewhat moredistant is Goodyear to the west and Litchfield Park to the northwest.Within the region, views <strong>of</strong> three mountain ranges strongly influence thecharacter <strong>of</strong> the Durango Area. They include the White Tank Mountainsto the northwest, the Estrella Mountains to the south and southwest, andSouth Mountain to the southeast. Views <strong>of</strong> the White Tank Mountainsand South Mountain are more distant while the views <strong>of</strong> the Estrellaswhich span the south side <strong>of</strong> the study area are relatively close up andform a dominant presence in the Durango Study Area.Study Area OverviewLand UseThe north and east portions <strong>of</strong> the Durango Study Area represent themajority <strong>of</strong> existing development with primary land uses consisting <strong>of</strong>industrial, residential, and some commercial uses, schools, and parks.The southwest two thirds <strong>of</strong> the area is currently agriculture and includesboth cultivated crops and livestock areas. The area is rapidly beingdeveloped with industrial development filling in open areas to the northand along the railroad corridor and residential development presentlyoccurring and planned for the agricultural areas in the southwest area.One unique feature <strong>of</strong> the study area relating to land use is the existence<strong>of</strong> major municipal public works facilities within and adjacent to theStudy Area. There are three waste water treatment plants witin thebounds <strong>of</strong> the study area including the Avondale Water Treatment Plant,the Tolleson Water Treatment Plant, and the City <strong>of</strong> Phoenix’s 91stAvenue Water Treatment Plant. Just outside the bounds <strong>of</strong> the studyarea but certainly a visible presence along the southeast boundary is the27th Avenue Landfill. Also nearby to the east <strong>of</strong> the study area limitsis Phoenix’s 23rd Avenue Wastewater Treatment Facility, and Maricpa<strong>County</strong>’s Durango Complex.DIBBLE & ASSOCIATES 19 DURANGO ADMPDATA COLLECTION REPORT
TransportationThe I-10 Papago Freeway and the I-17 Black Canyon Freeway are bothlimited access highways which form the boundaries <strong>of</strong> the study area.The I-17 Black Canyon Freeway, the east boundary is a depressedfreeway section with interchanges in the vicinity <strong>of</strong> Grant Street andAdams Street. The I-10 transitions from an elevated freeway section atthe east side <strong>of</strong> the study area at 27th Avenue to a depressed sectionfrom 35th Avenue to 91st Avenue and then west <strong>of</strong> 91st Avenue thefreeway transitions back to an elevated section. Exits to the study areaoccur at 35th, 43rd, 51st, 59th, 67th, 75th, 83rd, 91st, 99th, and 115thAvenues. In addition there is a Park’n’Ride Lot located at the 79thAvenue <strong>of</strong>f ramp.<strong>of</strong> the Buckeye Road alignment to a bridge over the Agua Fria on thewest boundary <strong>of</strong> the study area. The existence <strong>of</strong> the railroad line andits spurs has been a major factor in the development and growth <strong>of</strong>industrial land use in this area.Topography / Land FormThe Durango Study Area is relatively flat with a general slope towardsthe south and west. There is no significant land form within the studyarea itself however subtle changes <strong>of</strong> grade are evident in somelocations. A low area exists in the southwest corner <strong>of</strong> the study area.The flat terrain <strong>of</strong> the Durango area itself provides a sharp contrast tothe dramatic topography <strong>of</strong> the adjacent Estrella Mountains.varieties are typically found only at the homestead locations. There arehowever a few instances such as the area around 91st Avenue and LowerBuckeye where formal continuous wind rows <strong>of</strong> Pecan Trees edge thecrop areas. These large mature canopy trees form a very distinctivelandcape treatment for this area.Pecan Trees - 91stAvenue and LowerBuckeyeOther major roadways within the study area tie into the regional andmetropolitan roadway system with their general layout being on a onemile grid. Major east-west routes are Southern, Broadway, LowerBuckeye, Buckeye (State Route 85 - regional connector to California)and Van Buren. Major north south routes are 27th, 35th, 43rd, 51st,59th, 67th, 75th, 83rd, 91st, 99th, 107th, 115th, and El Mirage Roads.There is also a proposed South Mountain Freeway alignment whichtraverses the Durango Study Area in the vicinity <strong>of</strong> 59th and 51stAvenues. This planned Freeway section incorporates parkwayenhancement, landscape enhancement, and multi-use recreational trailsinto the design. This freeway section is currently unfunded.The Southern Pacific Railroad forms an east west corridor. The railroadline is located between Buckeye Road and Van Buren Street from theeast boundary <strong>of</strong> the study area to approximately one half mile west <strong>of</strong>99th Avenue where the line turns to the south and follows the north sideSome specific features within the study area display a grade differentialfrom surrounding lands. The Southern Pacific Railroad and BuckeyeFeeder Canal are both elevated linear features and are typicallyapproximately three to four feet above adjacent areas.VegetationThe majority <strong>of</strong> the Durango Study Area represents a landscape whichhas been heavily modified by man. Very little <strong>of</strong> the natural vegetationis in evidence. In many areas such as along the Salt and Gila Rivers theSalt Cedar has become established and is dominant. Some pockets <strong>of</strong> thenative Cottonwood Willow plant association can be seen in the floodplain and low areas <strong>of</strong> the Salt and Gila Rivers and adjacent areas.Similarly, there are only a few remote upland areas with characteristicDesert Scrub landscapes - Mesquite, Palo Verde, Saltbush, and Bursage.The agricultural areas are sparsely vegetated if at all other than thevarious crops themselves. Concentrations <strong>of</strong> larger trees <strong>of</strong> mixedLandscapes in the developed areas are mixed and varied. There is nosingle dominant theme. Plant palettes include both a “Sonoran DesertTheme” which utilizes more indigenous and arid region, desert varietyplant materials such as Mesquite, Palo Verde, and Acacia and a“Mediterranean Theme” which features species such as Bougainvillea,Palms, Oleander, and Ash. Many <strong>of</strong> the older areas within the study areaappear to represent the “Mediterranean theme” while the newerdevelopments typically feature more <strong>of</strong> a “Sonoran Desert Theme”HistoryThe prehistory and history <strong>of</strong> the Durango Study area is rich and varied.With its proximity to the rivers and relatively flat topography, the areahas proven to be conducive to the development <strong>of</strong> early townships whicheventually has led to a number <strong>of</strong> significant historical innovations. Thearea has featured Hohokam civilizations, early agriculture, early canals,irrigation and water companies, homesteaders, early surveyors,DIBBLE & ASSOCIATES 21 DURANGO ADMPDATA COLLECTION REPORT
construction <strong>of</strong> early railways and highways, WWI era cotton productionand WWII era defense plants. See Section V <strong>of</strong> this report for a moredetailed prehistorical and historical overview <strong>of</strong> the Study area. Thehistory <strong>of</strong> the area has the potential to influence the design in a number<strong>of</strong> ways including the layout <strong>of</strong> the facilities; the type, design, and theme<strong>of</strong> proposed amenities; design details and materials; and by <strong>of</strong>feringnumerous subject material for potential public education opportunities.E. Visual Resources AssessmentThe Visual Resources Assessment is based on the evaluation <strong>of</strong> existinglandscape character, scenic quality, visual integrity, and future desiredlandscape character for the study area.DefinitionsLandscape Character is expressed in terms <strong>of</strong> Landscape CharacterUnits. A Landscape Character Unit is an area <strong>of</strong> land that has commondistinguishing visual characteristics. Distinguishing visual characteristicsmay be natural features such as landform, rock formations, water forms,vegetative patterns or man made / cultural features such as land use,building or structure types, scale and / or density. (Figure IV-2)Scenic quality is defined as the distinctiveness, visual dominance (scale,color, form), or variety <strong>of</strong> features within an area. Features <strong>of</strong> highscenic quality are distinctive or unique and should be protected.Opportunities to improve scenic quality represents opportunities toincrease variety or enhance landscapes low in diversity. Scenic qualityfor the project areas is evaluated in relative terms. In analyzing thescenic quality, natural and cultural features are studied taking intoconsideration the degree <strong>of</strong> variety or uniqueness <strong>of</strong> landscape features.( Figure IV-3).General AssessmentGenerally older developed areas within the study area are low in scenicquality and visual integrity. There is low visual interest, little continuityor harmony <strong>of</strong> elements and no strong unifying elements. These areasare characterized by sparse or no landscaping, large amounts <strong>of</strong>hardscape, chain link fencing, and lack <strong>of</strong> screening <strong>of</strong> objectionableviews.Newer developments with more restrictive landscape requirements havemuch improved scenic quality and visual integrity, however are notparticularly distinctive. Newer developments incorporate a largerpercentage <strong>of</strong> landscape area and typically feature perimeter landscapebuffers, screen walls, a unified palette <strong>of</strong> materials.Overall agricultural areas are generally medium to high in scenic quality.The open feel <strong>of</strong> this area is unique and views <strong>of</strong> the adjacent EstrellaMountains and South Mountains to the south and White TankMountains to the north are distinctive and impressive.River areas have the highest potential for scenic quality as they featurean environment relatively unique to the Sonoran Desert.Visual integrity is defined as the degree <strong>of</strong> harmony among the features<strong>of</strong> an area with regards to line, color, form, texture, landform,vegetation, architectural features, and streetscape. Opportunities toincrease visual integrity represents opportunities to harmonize discordantfeatures.DIBBLE & ASSOCIATES 22 DURANGO ADMPDATA COLLECTION REPORT
Existing Landscape Character UnitsApproximately 90-95% <strong>of</strong> the Durango area represents a landscapewhich has been modified by operations <strong>of</strong> man. Other than the rivers,there are generally no distinguishing existing natural features, landforms,or vegetation. Distinguishing characteristics which differentiate onecharacter unit from another in this study area are therefore typicallyrelated to the various land uses and related man made elements such asthe type, size, density, layout, and scale <strong>of</strong> buildings and other pavementsand structures. The Existing Landscape Character map (Figure IV-2)generally delineates the Landscape Character Units within the DurangoStudy area.Approximately two thirds <strong>of</strong> the existing study area is agricultural. Theother primary land uses are residential, and industrial. There is also asmall amount <strong>of</strong> commercial, schools, and parks.Agricultural Character UnitDescriptionThe Agricultural Character Unit is characterized by large scale wideopen spaces, with generally flat topography and a very low density <strong>of</strong>buildings and structures. Few vertical obstructions allow for verydramatic relatively close up views <strong>of</strong> the Estrella Mountains and SouthMountains to the south and White Tank Mountains to the northwest.The land is geometrically patterned and plots are defined by a gridsystem <strong>of</strong> roadways and irrigation canals. Trees are sparse and aretypically concentrated around the existing homesteads. The Agriculturalcharacter unit includes both areas with cultivated crops and areas withfarms which specialize in raising livestock (Dairy farms, horse farms andchicken ranches). The areas are similar however the farms whichspecialize in raising livestock typically include hay/feed storage and arecharacterized by more structures, fencing, and railings.Scenic QualityThe existing scenic quality <strong>of</strong> the Agricultural Character Unit is mediumto high due primarily to the relatively open feeling <strong>of</strong> these lands and theopportunities it presents to observe the dramatic mountain views. Asdevelopment rapidly encroaches and more physical obstructions areintroduced, viewing opportunities will decrease. Open space is a valuablecommunity resource which contributes to the quality <strong>of</strong> life. The openfeel <strong>of</strong> these lands is unique and should be preserved. There are howeveropportunities to improve the scenic quality. Visual elements/featureswithin this character unit reflect a minimal amount <strong>of</strong> variety or visualinterest and may be perceived as monotonous. Preservation <strong>of</strong> largesetbacks and open areas as well as the selective placement <strong>of</strong> features orlandscaping which increases variety will improve the scenic quality.Visual IntegrityVisual integrity <strong>of</strong> the Agricultural Character Unit is medium. Generallythe character unit is composed <strong>of</strong> elements which are consistent andharmonious however there are major discordant features consisting <strong>of</strong>the various overhead power lines which are quite abundant throughoutthe area as well as some deteriorated irrigation ditches.AgriculturalCharacter UnitDIBBLE & ASSOCIATES 23 DURANGO ADMPDATA COLLECTION REPORT
Residential Character UnitThe Residential Character Unit consists <strong>of</strong> three subunits designated asRural Residential, Residential, and Residential Planned AreaDevelopment (P.A.D.).Rural Residential Character UnitDescriptionThe Rural Residential Character Unit is indicative <strong>of</strong> low densityresidential developments within the agricultural lands <strong>of</strong> the study area.These residences are typically positioned on large relatively spaciousflood irrigated lots with adjacent fenced areas containing shadestructures or shelters and a variety <strong>of</strong> livestock and small farm animals.The streetscapes are defined by various styles <strong>of</strong> fencing and rails, someclusters <strong>of</strong> vegetation, irrigation ditches and mailboxes. Existingenclosures consist <strong>of</strong> medium height wood or metal rails or fences. Thehomes are primarily single story ranch style dwellings <strong>of</strong> various sizes,styles, and materials - wood frame, block, brick, and stucco. Lotlandscaping is also varied and mixed and but <strong>of</strong>ten includes turfed areasand trees.Rural ResidentialScenic QualityScenic quality for the Rural Residential Character Unit is rated asmedium. In general, form, line, color, texture, and scale <strong>of</strong> elementsrepresent an average level <strong>of</strong> variety however the characteristics <strong>of</strong> thisunit are not particularly unique.Visual IntegrityVisual integrity for the Rural Residential Character Unit is rated asmedium. The visual elements/features represent an average level <strong>of</strong>harmony amongst the parts. Some discordant elements include overheadpower lines, chain link fencing in some locations, outdoor unenclosedstorage <strong>of</strong> equipment, materials, and other debris, and other elementsresulting from lack <strong>of</strong> property maintenance.Residential Character UnitDescriptionThe Residential Character Unit describes the older residentialneighborhoods within the study area. Oldest neighborhoods occur east<strong>of</strong> 43rd Avenue and north <strong>of</strong> Buckeye. There are also concentrationsaround 67th Avenue and at 91st Avenue in Tolleson. In many areas,adjacent noncompatible commercial and industrial land uses haveintruded upon and negatively impacted these older residentialdevelopments. Neighborhoods are typically characterized by a relativelyhigh density <strong>of</strong> small single family detached WWII era block and woodframe tract homes. There are also trailer parks and manufactured homesin some areas as well. Tract homes and other visual elements withinthese neighborhoods feature a very plain, simple functional design withlittle or no architectural detail. The fact that yards are small and thereis very little community recreational open space within theseneighborhoods has resulted in much <strong>of</strong> the regular outdoor activityappearing oriented to the street. In an effort to create a sense <strong>of</strong> securityand separation from the street, many lots feature low wall enclosures orchain link fences. Lack <strong>of</strong> property maintenance has also detracted fromthe neighborhood image. Landscaping is sparse to medium. There is noconsistent streetscape or landscape theme. Visual elements are mixed.There is no consistency in materials or colors.ResidentialScenic QualityScenic quality for the Residential Character Unit is rated as low tomedium. The combination <strong>of</strong> form, line, color and scale <strong>of</strong> visualelements represents a low level <strong>of</strong> visual interest. Architectural elements,landscape elements, and streetscape elements do not create a strongneighborhood character.Visual IntegrityVisual integrity for the Residential Character Unit is also rated as low tomedium. Neighborhoods lack a strong unifying element. Features suchas chain link fencing lend an institutional feel. Other discordant visualelements have resulted from lack <strong>of</strong> property maintenance and lack <strong>of</strong>enclosed storage areas for vehicles and other equipment.DIBBLE & ASSOCIATES 24 DURANGO ADMPDATA COLLECTION REPORT
Residential P.A.D. UnitDescriptionThe Residential P.A.D. Character Unit represents the newer residentialdevelopments which reflect more restrictive municipal landscaperequirements. These developments are typically walled communitieswith small to medium sized lots and detached single family dwellings.Plans also feature landscaped frontages and common open space areasmany <strong>of</strong> which also include recreational amenities. Colors and materialsconsist <strong>of</strong> variations <strong>of</strong> earth tone colored/textured block, stucco, andtile. Colors, materials and design details are generally consistentthroughout a development and support a particular architectural andlandscape theme.Residential P.A.D.Scenic QualityScenic quality for the Residential P.A.D. Character Unit is rated asmedium. This unit represents an average level <strong>of</strong> visual element varietyhowever there is nothing that is especially distinctive or unique.Visual IntegrityVisual Integrity <strong>of</strong> the Residential P.A.D. Character Unit is inherentlymedium to high. These areas are typically designed to incorporatecolors, textures, materials, and forms which are generally consistent andsupport a theme. In the new developments commonly overhead powerlines have been placed underground to remove them from view.Industrial Character UnitThe Industrial Character Unit is generally located in the east portion <strong>of</strong>the Durango study area and along the railroad corridor. This characterunit is characterized in general by industrial land uses with relativelylarge scale building and development. The Industrial Character Unit iscomprised <strong>of</strong> two sub-units designated as Heavy Industrial and IndustrialCommerce Park. Although the sub-units may feature a similar land use,character is very different.vehicles, or large areas for storage <strong>of</strong> materials leaving minimal areas forlandscape buffering or open spaces. Existing open space, landscapebuffering and streetscape treatments are minimal or non existant. Thereis little or no screening <strong>of</strong> objectionable views such as parking areas,loading docks, or outdoor unenclosed materials. Visually, areas aredominated by overhead power and utility lines, poles, chain link fencingwith razor wire, dirt, asphalt and other pavements. There is little or noconsistency <strong>of</strong> colors or materials. These areas typically take on quite agray, drab, appearance with little visual interest.Heavy IndustrialResidential P.A.D.Common area open spaceHeavy Industrial UnitDescriptionThe Heavy Industrial Character Unit tends to be associated with theolder developed industrial areas east <strong>of</strong> 51st Avenue. Types <strong>of</strong> facilitiesinclude recycling, manufacturing, sand and gravel operations, apetroleum tank farm, and a power facility. The older heavy industrialdevelopments typically feature extensive outdoor activities and storage.Many <strong>of</strong> these older facilities have occurred on relatively small parcelsand require either large buildings, large areas for maneuvering <strong>of</strong>Scenic QualityScenic quality in Heavy Industrial areas is low. There is little variety orvisual interest.DIBBLE & ASSOCIATES 25 DURANGO ADMPDATA COLLECTION REPORT
Visual IntegrityVisual integrity <strong>of</strong> Heavy Industrial areas is low. These areas are acollection <strong>of</strong> discordant elements.Industrial / Commerce Park UnitDescriptionThe Industrial / Commerce Park Unit is typified by the newer industrialdevelopments west <strong>of</strong> 51st Avenue. Like the newer residentialdevelopments, the Industrial / Commerce Park Character Unit isreflective <strong>of</strong> newer more restrictive municipal landscape requirements.Zoning ordinances and municipal landscape and design guidelines placerequirements on percentage <strong>of</strong> landscape area, quantity <strong>of</strong> plantings,density <strong>of</strong> vegetative cover, buffering, screening, and architecturalfeatures. The new warehouse / distribution center is typical <strong>of</strong> thesedevelopments with large box buildings, landscaped buffers and siteperimeter areas, and block wall screening <strong>of</strong> outdoor activities orstorage. Buildings are typically feature light pastel colored bodies withcolor, texture or architectural feature accents. Colors and materials aregenerally consistent throughout a development and support a particulartheme.Industrial / Commerce ParkScenic QualityScenic Quality in the Industrial / Commerce Park Unit is rated medium.This unit represents an average level <strong>of</strong> visual element variety howeverthere is nothing that is especially distinctive or unique.Visual IntegrityVisual integrity <strong>of</strong> the Industrial / Commerce Park Character Unit isinherently medium to high. These areas are typically designed toincorporate colors, textures, materials, and forms which are generallyconsistent and support a theme. In the new developments it is morecommon for overhead power lines have been placed underground toremove them from view.Commercial Character UnitDescriptionThe Commercial Character Unit comprises a relatively small portion <strong>of</strong>the study area. Individual commercial sites and strip commercial areasare found primarily in Phoenix along Van Buren between 27th Avenueand 43rd Avenue and in Tolleson from 91st to 99th Avenue. This unitis a mixture <strong>of</strong> <strong>of</strong>fice, retail, service, , and restaurant / fast foodestablishments. The degree <strong>of</strong> streetscape elements and landscapebuffering varies. In most cases landscape buffers and vegetation isminimal. There is no consistency to design, materials, or colors. Areasrepresent a collage <strong>of</strong> unrelated, non unified visual elements.Visual IntegrityVisual integrity <strong>of</strong> the Commercial Character Unit is low to medium.These areas represent a collection <strong>of</strong> non unified, non harmoniousbuilding and hardscape elements, signage and billboards.CommercialDesert Scrub Character UnitDescriptionDesert scrub is descriptive <strong>of</strong> the few existing areas within the projectupland area which are relatively natural. The largest area which fits thisdescription is in the area referred to as Cashion. It is located in the areaadjacent to the Agua Fria River south <strong>of</strong> the Southern Pacific Railroad.An overview indicates there are scattered Mesquite trees with saltbushas the predominant shrub. Refer to the ecological assessment for adetailed description <strong>of</strong> plants found in this vegetation type.Desert ScrubScenic QualityScenic quality in the Commercial Character Unit is low to medium.There are few elements which create desirable visual interest.DIBBLE & ASSOCIATES 26 DURANGO ADMPDATA COLLECTION REPORT
Scenic QualityScenic quality <strong>of</strong> the Desert Scrub Character Unit is rated as medium tolow. Natural landform and indigenous materials do not reflect a highdegree <strong>of</strong> variety, color, or texture interest.Visual IntegrityVisual integrity <strong>of</strong> the Desert Scrub Character Unit is rated as medium.Visual elements are relatively harmonious and consistent.River Landscape Character UnitThe major natural features which influence the Durango Study Area arethe rivers. The river areas <strong>of</strong>fer the greatest opportunities to restore /create distinctive natural environments and desirable animal habitat ashas been done in the Tres Rios Constructed Wetland DemonstrationArea. Because <strong>of</strong> modifications made by man such as channelization,levees, introduction <strong>of</strong> water sources, constructed wetlands, etc. visualconditions and the character <strong>of</strong> the river areas varies. The RiverCharacter Unit is therefore divided into two sub-units - the Salt/GilaRiver Character Unit and the Agua Fria Character Unit.Salt / Gila River Character UnitDescriptionWith the regular source <strong>of</strong> water from the 91st Avenue WWTP, the Salt/ Gila River area is heavily vegetated. Salt cedar has become establishedand has become dominant in most areas. The native Cottonwood andWillow plant association can be seen in pockets primarily at theconfluence <strong>of</strong> the rivers. As evidenced by the Tres Rios ConstructedWetland Demonstration Area, a desire for this corridor is to clear theSalt Cedar and reestablish the native plant varieties associated with theWillow and Cottonwood association.Scenic QualitySalt RiverTres Rios ConstructedWetland Demonstration AreaScenic quality for the Salt / Gila River Character Unit is rated mediumto high. With the presence <strong>of</strong> water and opportunity to feature river /riparian habitat this represents a natural feature unique to the SonoranDesert environment. These areas have the greatest potential for highvisual quality if modified to open up views and restore natural vegetationand animal habitat.Visual IntegrityVisual integrity for the Salt / Gila River Character Unit is rated medium.Existing debris, the Holly Acres levee, and the dominance <strong>of</strong> the singlespecies <strong>of</strong> vegetation (Salt Cedar) represent discordant visual elements.Agua Fria Character UnitDescriptionWith no regular source <strong>of</strong> water, and the effects and form <strong>of</strong> the FCDriver channelization and levee, the existing vegetation along the AguaFria is sparse and consists <strong>of</strong> Desert Scrub plant varieties and grasses.The engineered rip rap levee, maintenance access road, and concretebank stabilization although functional have significantly altered thenatural appearance <strong>of</strong> the river. There does not appear to have been anylandscape mitigation done in conjuction with these manmade facilities.As a planned regional trail corridor, visual enhancement <strong>of</strong> the Agua Friacorridor should be a priority.(Note: See photo <strong>of</strong> typical Agua Fria character unit in evaluation <strong>of</strong>existing <strong>Flood</strong> <strong>Control</strong> Facilities)Scenic QualityScenic quality <strong>of</strong> the Agua Fria Character Unit is rated low to medium.Existing visual conditions do not reflect a high degree <strong>of</strong> variety, color,or texture interest.Visual IntegrityVisual integrity <strong>of</strong> the Agua Fria Character Unit is rated low to medium.The river channelization and levee are discordant visual elements.DIBBLE & ASSOCIATES 27 DURANGO ADMPDATA COLLECTION REPORT
Assessment <strong>of</strong> Existing <strong>Flood</strong> <strong>Control</strong> <strong>District</strong> FacilitiesExisting <strong>Flood</strong> <strong>Control</strong> facilities within the study area include the AguaFria River Channelization and Levee, the Holly Acres Bank Stabilizationand Levee, and the “Chicken Ranch” New River Mitigation Area. Notrespassing signs, locked gates, and fencing prohibit public access to theFCD facilities. All three <strong>of</strong>fer potential opportunities for both visualenhancement and multiple uses. As they are all located along or adjacentto the river areas, all are extremely valuable lands and present multi useopportunities for trails and public information / educational displays.Restricted Public AccessAgua Fria Channelization and Levee -opportunity for needed visual enhancement and multiple usesViewing AnalysisHolly Acres BankStabilization and Levee -opportunity for needed visualenhancement and multipleuses“Chicken Ranch”New River Migitation Area -Lack <strong>of</strong> variety <strong>of</strong> understoryvegetationThere are opportunities for views both into and out <strong>of</strong> the study area.Mountain views are a dominant visual element in the Durango area. Acombination <strong>of</strong> the Estrella Mountains and South Mountain spans theentire south boundary <strong>of</strong> the Durango area. The relatively close up view<strong>of</strong> these mountains can be described as a panoramic view <strong>of</strong> the entiremountain range as opposed to being directed or focused on a specificobject or form. The more distant views <strong>of</strong> the White Tank Mountainsare directed to the northwest. With its flat topography, few verticalobstructions and open character <strong>of</strong> the agricultural lands in the southwestportion <strong>of</strong> the study area present the greatest opportunities forunobstructed mountain views. In developed areas, there are verticalobstructions which direct and impact views. Mountain views are eitherchanneled along the north-south roadway corridors or occur overbuilding ro<strong>of</strong>tops.Estrella Mountain ViewsOther viewing opportunities are afforded by elevated structures includingthe elevated freeway, elevated bridges across the rivers, and elevatedcanals and river levee areas. There is also one small hill immediatelysouth <strong>of</strong> the Salt River east <strong>of</strong> the 115th Avenue Bridge which presentsopportunities for views <strong>of</strong> the Tres Rios area in the foreground with theentire Durango Study area as background.. Selective clearing <strong>of</strong> heavilyvegetated areas along the Salt and Gila Rivers will open up additionalviewing opportunities.DIBBLE & ASSOCIATES 30 DURANGO ADMPDATA COLLECTION REPORT
Future Desired Landscape CharacterA large portion <strong>of</strong> this study area is designated by the City <strong>of</strong> Phoenix asthe Estrella Village Planning Area. As such, the City has presented avision for it’s development. Primary goals include orderly growth,identifiable community character, strong residential neighborhoods, avariety <strong>of</strong> homes and employment opportunities, and consistentstreetscape and trail linkages. The Estrella Village Plan also features aVillage Core which is proposed along the proposed South MountainParkway in the vicinity <strong>of</strong> 59th Avenue. The Village Core is intended tobe a “unifying, identifiable” place representative <strong>of</strong> the Estrella Villagecharacter and which features a concentration <strong>of</strong> services, business, andcommunity facilities. Also associated with the Estrella Village planningarea is an arterial street landscaping program which includes arecommended plant list for major streets, designated landscaped villagegateways, and a suggested multi use trail plan. This information hasbeen incorporated into Figures IV-5 and IV-6F. Multi-Use Opportunities AssessmentNumerous multi use opportunities exist within this study area andinclude potential park sites, designated multi use trail corridors, rivercorridor, the FCD facilities, canals, and transmission corridors. SeeFigure IV-6. Most previous efforts and regional trail systems focusingon this general area have concentrated on developing concepts for theriver corridors. This project presents great opportunities to provide notonly for the river corridors but to also designate local links to theseregional systems as well an opportunity to designate areas forneighborhood, community, and district recreational open spaces / parksto serve existing and future development.The Future Desired Landscape Character figure depicts the expansionand infill <strong>of</strong> the two primary land uses - industrial and residential. Theindustrial character generally expanding and infilling in a corridor alongthe north side <strong>of</strong> the study area. The new industrial facilities shouldexhibit the characteristics <strong>of</strong> the Industrial / Commerce Park characterunit. New residential areas have started to move into agricultural areasand will likely continue to do so. The residential areas will consist <strong>of</strong>rural residential and P.A. D. Residential. New residential areas willinclude supporting uses such as schools, parks / open space areas andneighborhood commercial centers. Older residential areas in thenorthrern portions <strong>of</strong> the study area are designated for neighborhoodrevitalization and preservation.DIBBLE & ASSOCIATES 32 DURANGO ADMPDATA COLLECTION REPORT
V. ENVIRONMENTAL OVERVIEWA. Ecological AssessmentIntroductionThe objectives <strong>of</strong> this ecological assessment are to identify, evaluate, andmap vegetation communities in the Durango drainage area, to determinewhether such vegetation communities may support special interestspecies, and to identify sensitive biological resources. A special interestspecies is any species <strong>of</strong> interest to any regulatory or managementagency <strong>of</strong> the federal, state or local government. The list <strong>of</strong> specialinterest species considered in this assessment was developed from listsprovided by the U.S. Fish and Wildlife Service (FWS) and the ArizonaGame and Fish Department (AGFD), included in the Appendix.A reconnaissance survey <strong>of</strong> vegetation communities in the project area,except for extremely disturbed, industrial, and urbanized portions, wasconducted between 20 and 23 December, 1999. The survey wasconducted from a vehicle along major roads in the project area, and onfoot in and adjacent to the Agua Fria, Gila, and Salt rivers. Thisecological assessment is general and does not include comprehensivelists <strong>of</strong> plant and animal species that may occur in or near, or be affectedby the proposed project.Historical Ecological ConditionsPrehistoric Hohokam inhabited and farmed central Arizona until the1400s. The Hohokam built an extensive network <strong>of</strong> hundreds <strong>of</strong> miles<strong>of</strong> canals to convey water from the Salt and Gila rivers and delivered itto fields up to 20 miles into the surrounding desert for crop irrigation.The canals measured up to 30 feet wide and 10 feet deep, and wereabandoned by the time Father Kino arrived in the late 1600s. Littlelarge-scale irrigation was built until Camp McDowell was establishednortheast <strong>of</strong> Phoenix in 1865.Soon after, the potential for reconstructing the Hohokam irrigationsystem was recognized and prompted the settlement <strong>of</strong> Phoenix (Rogge,Keane and McWatters 1994). Rainfall in the Sonoran Desert isunpredictable, and the reliable water source from reservoirs anddiversions attracted farmers and ranchers to the area. During the periodfrom 1867 to 1877, eleven or more irrigation canal companies operatedwhile some twenty-one new companies formed (Rogge et al. 1994).By 1885, the Arizona Diversion Dam was built on the Salt River, and theArizona Canal was under construction some 25 miles east <strong>of</strong> Phoenix -representing the first extension <strong>of</strong> the Hohokam canal network. TheArizona Diversion Dam was replaced with the Granite Reef Diversion,constructed from 1906 to 1908 in conjunction with the Roosevelt Dam.The Lake Pleasant Dam on the Agua Fria River was complete by 1920,and the reservoir was full by 1941. By 1950, 14 dams and diversionswere built upstream <strong>of</strong> the Durango drainage area on the Gila, AguaFria, Salt, and Verde rivers to reclaim the arid lands <strong>of</strong> Arizona (Roggeet al. 1994). Such a magnitude <strong>of</strong> water diversion reduces the naturalwater table and subsequently changes the composition <strong>of</strong> vegetation andanimal communities.Local channeling <strong>of</strong> the Gila, Salt, and Agua Fria rivers predominantlyfor agricultural purposes likely represents the first major fragmentation<strong>of</strong> the cottonwood-willow gallery forests along these floodplains.Construction <strong>of</strong> fences to contain livestock obstructed travel by nativewildlife, and diversion <strong>of</strong> water for mining, livestock, and crops impactednative fish populations (Minckley1991).Existing Ecological ConditionsVegetation CommunitiesApproximately ninety to ninety-five percent <strong>of</strong> the Durango drainagearea has been disturbed as a result <strong>of</strong> past and current activities relatedto industrial, urban, and agricultural development. The project areacontains three types <strong>of</strong> communities: highly disturbed, agriculture fields,and Sonoran Desert (Figure V-1). The highly disturbed areas in the eastportion <strong>of</strong> the project area have been industrially, commercially, orresidentially developed. Agricultural areas are fairly contiguousthroughout the central and west portions (Photo V-1), while relativelyundisturbed areas are chiefly in and adjacent to riverine floodplains(Photo V-2). Vegetation in highly disturbed areas, and areas adjacentto agricultural fields, is <strong>of</strong>ten dominated by invading species such asRussian thistle (Salsola kali) and desert broom (Baccharis sarothroides).Urban and industrial areas have relatively little biological resource valuefor species other than pigeons (Columba livia), pests, and vermin, whileagricultural areas provide more resources for rodents, granivorous birds,and raptors.DIBBLE & ASSOCIATES 35 DURANGO ADMPDATA COLLECTION REPORT
R1WR1ER1ER2E040302#0106050403 0201060504030201#091011#D1207080910111207080910111216151413181716151413181716151413T1N#2122C2324192021222324192021 222324A28 27272625 3026 253029282928272625#BPROJECT DETAIL33343536313233343536 313233343536$HInitial MonumentUS-60KEYI-17PROJECT LOCATIONDetention BasinOpen Channel/PipeProject Boundary<strong>Flood</strong>way/Sonoran DesertAgricultureDPotentialJurisdictionalAreaDeveloped (Residential and Industrial)# Survey LocationsAvondalePhoenixArizonaNI-10##Salt RiverProject Boundary0 1 2MilesSalt RiverGoodyearTollesonGila RiverI-10US-60T1N-R1WT1N-R1ET1N-R2ET1N-R1WT1N-R1ET1N-R2EGila and Salt River Meridian<strong>Maricopa</strong><strong>County</strong>AZ State Plane Central NAD83Source: Marciopa <strong>County</strong> FCD PhotographyPROJECT TITLE:DURANGO AREA DRAINAGE MASTER PLANPROJECT NO. FCD 99-41CONSULTANT:<strong>Maricopa</strong> <strong>County</strong>Pinal <strong>County</strong>FIGURE V-1EXHIBIT TITLE:VEGETATION COMMUNITIES
Existing, natural vegetation in the Durango drainage area is characteristic<strong>of</strong> the Lower Colorado River Valley subdivision <strong>of</strong> the SonoranDesertscrub biome (Brown 1994), with various subdivisions and plantassociations described below.Photo V-1. Wetland vegetation and riparian woodland at 115 thAvenue and the confluence <strong>of</strong> the Gila and Salt rivers. Suchareas may provide breeding or foraging habitat for specialinterest species such as Yuma clapper rail, southwester willowflycatcher, western yellow-billed cuckoo, and western leastbittern.Photo V-2. North-northeast view from Van Buren Street andthe Agua Fria River. The banks are channelized, and utilitystructures are located in the riverbed.Photo V-3. Stabilized banks <strong>of</strong> the Agua Fria River near VanBuren Street.The Durango drainage area includes portions <strong>of</strong> the Agua Fria, Gila, andSalt rivers, as well as the confluences <strong>of</strong> the Salt and Gila rivers, and theGila and Agua Fria rivers. Much <strong>of</strong> the Agua Fria River has beenchannelized for flood control (Photo V-3). Permanent surface waterexists along portions <strong>of</strong> the Gila and Salt rivers. Late succession ripariangallery forest exists in the project area near the confluence <strong>of</strong> the Gilaand Salt rivers and provides potential habitat for several special interestspecies, and attracts many birds <strong>of</strong> prey. The Tres Rios constructedwetlands exist along the Salt River beginning at the City <strong>of</strong> Phoenix 91 stAve Wastewater Treatment Plant, and contain a variety <strong>of</strong> native andintroduced plant and animal species. The effluent is conveyed andrecharged to the Salt River. The Tres Rios project supports a diversearray <strong>of</strong> shore birds, song birds, and raptors, as well as muskrat andbeaver. However, native fishes are not likely to occur in the aquaticcommunity at and downstream <strong>of</strong> Tres Rios, because introduced speciessuch as tilapia (Tilapia sp.), mosquit<strong>of</strong>ish (Gambusia affinis), sailfinmolly (Poecilia latipinna), common carp (Cyprinus carpio), largemouthbass (Micropterus salmoides), and bullfrogs (Rana catesbiana) are soabundant that they presumably prey on or outcompete native species(Minckely 1991).Upland Vegetation TypesSonoran Desertscrub, Lower Colorado River Valley Subdivision.Honey mesquite (Prosopis glandulosa), creosote bush (Larreatridentata), and foothill palo verde (Cercidium microphyllum) arecharacteristic species <strong>of</strong> the Sonoran Desertscrub biome existing in theDurango drainage area. Other common plants include burrobush(Hymenoclea salsola), snakeweed (Gutierrezia sarothrae), burro weed(Isocoma acradenia), various saltbush species (Atriplex spp.), brittlebush(Encelia farinosa), desert broom (Baccharis sarothroides), buckhorncholla (Opuntia acanthocarpa), white bursage (Ambrosia dumosa),mallows (Sphaeralcea spp.), and desert milkweed (Asclepias subulata).The Lower Colorado River subdivision is drier and hotter than theArizona Upland subdivision that lies chiefly to the south. Consequently,plant growth is relatively less complex and dense in the Lower ColoradoRiver subdivision. However, the composition <strong>of</strong> animal species differslittle - reptile species are relatively more abundant while bird species areless so.Aquatic and Riparian Vegetation TypesAquatic Communities and Wetlands. Both permanent andintermittent aquatic communities exist within the project area along theSalt, Gila, and Agua Fria rivers. Such communities include natural andconstructed wetlands. Apparently natural wetland communities exist at,DIBBLE & ASSOCIATES 37 DURANGO ADMPDATA COLLECTION REPORT
upstream, and downstream <strong>of</strong> the confluence <strong>of</strong> the Gila and Salt riversat 115 th Avenue, and along the Agua Fria River near Highway 85 southto its confluence with the Gila River. The Tres Rios constructedwetlands is located adjacent to the Salt River floodplain at 91 st Avenuewastewater treatment plant. Wetland vegetation in and downstream <strong>of</strong>Tres Rios is patchily distributed and fairly diverse, containing submerged,emergent, and floating vegetation such as cattail (Typha latifola),bulrush (Scirpus sp.), rushes (Juncus spp.), sedges (Carex spp.), andreed (Phragmites sp.). The artificial wetland contains native and exoticaquatic and riparian vegetation and animals, and is supported byreclaimed wastewater from effluent.Special interest species that may occur in or use the natural aquaticcommunity within the project area are Yuma clapper rail, great egret,snowy egret, and western least bittern.Sonoran Riparian Woodland. This community occurs near the edge<strong>of</strong> the floodplain <strong>of</strong> the Agua Fria, Salt, and Gila rivers. It ischaracterized by dense, tall trees and shrubs growing along perennial orintermittent water courses. Typical plants include: Fremont cottonwod(Populus fremonti), Goodding willow (Salix gooddingii), tree tobacco(Nicotiana glauca), seep willow (Baccharis salicifolia), and salt cedar(Tamarix sp.).Special interest species that may occur in this vegetation communitywithin the project area are southwestern willow flycatcher, great egret,and western yellow-billed cuckoo.Sonoran Riparian Scrub. Known also as Xeroriparian 1 Mixed Scrub,this community typically occurs as a linear corridor <strong>of</strong> sparse to denseshrubs and trees lining washes and growing in floodplains. It <strong>of</strong>tenoccurs adjacent to Sonoran Interior Strand. Typical plant speciesinclude: mesquite, blue palo verde (Cercidium floridium), catclaw acacia(Acacia greggii), desert willow (Chilopsis linearis), tree tobacco,canyon ragweed (Ambrosia ambrosioides), desert broom, globe mallow,wolfberry (Lycium berlandieri), desert hackberry (Celtis pallida), andsmoke tree (Psorothamnus spinosus). The greater abundance <strong>of</strong>resources provided by the vegetation increases the value <strong>of</strong> this and otherriparian communities over the adjacent upland community for manyspecies.Special interest species that may occur in this vegetation communitywithin the project area are Sonoran desert tortoise.Sonoran Interior Strand. Strand communities are <strong>of</strong>ten adjacent toxeroriparian communities and are narrow, but may occasionally begreater than 100 feet wide. Strand communities are typically lined withsmall trees found in Sonoran Riparian Scrub. Common plants growingin the strand community include burrobrush, desert broom, snakeweed,Russian thistle (Salsola sp.), burroweed, canyon ragweed, cocklebur(Xanthium strumarium), fluff grass, cheat grass (Bromus tectorum), andmany other short-lived perennial and annual species.No special interest species are expected to exclusively occur in thisvegetation community within the project area.Special Status SpeciesEighteen species are evaluated herein. Thirteen <strong>of</strong> these species (tenanimals and three plants) are listed by the FWS as threatened orendangered in <strong>Maricopa</strong> <strong>County</strong>. The remaining five animals are listedby AGFD. While plants protected only by the state <strong>of</strong> Arizona are alsolisted by AGFD, the Arizona Department <strong>of</strong> Agriculture is responsiblefor administering the Arizona Native Plant Law. A description <strong>of</strong>regulatory status and protection for each applicable agency follows.- Federal Threatened and Endangered Species. Species listed orproposed to be listed for protection under the EndangeredSpecies Act (ESA) as endangered, threatened, or candidate. TheESA specifically prohibits the “take” <strong>of</strong> a listed species. Take isdefined as “to harass, harm, pursue, hunt, shoot, wound, kill,trap, capture, or collect, or to engage in any such conduct.” 2The FWS maintains a designation <strong>of</strong> proposed and listed speciesknown to occur in each Arizona county.- Wildlife <strong>of</strong> Special Concern in Arizona. The AGFD formerlylisted 116 species as extinct, endangered, threatened, andcandidate in Arizona (AGFD 1988). While the terminology usedwas identical to that used by FWS, the AGFD categories wereadvisory and provided no legal protection for take <strong>of</strong> suchspecies or modification <strong>of</strong> their habitat. The latter pointscontrasts the FWS list. To avoid confusion, AGFD is currentlyrevising and reissuing their list as “Wildlife <strong>of</strong> Special Concern inArizona” without using the terms endangered or threatened. The1Associated with an ephemoral water supply and typically contain plant species also found in uplandhabitat, although riparian plants are commonly larger and occur at higher densities than those in adjacentuplands.2 Endangered Species Act, Section 3, paragraph 19. Further, 50 CFR § 17.3 defines “harm” as “anact which actually kills or injures wildlife. Such act may include significant habitat modification or degradationwhere it actually kills or injures wildlife by significantly impairing essential behavior patterns, includingbreeding, feeding, or sheltering.”DIBBLE & ASSOCIATES 38 DURANGO ADMPDATA COLLECTION REPORT
evised list has not yet been <strong>of</strong>ficially adopted, but has beenpublished in draft form (AGFD 1996).- Arizona Native Plant Law species. The Arizona Department <strong>of</strong>Agriculture (ADA) administers the Arizona Native Plant Law,and AGFD lists the native plants protected under legislation. Itis unlawful to collect, transport, or kill native plants without apermit or without following specific regulatory procedures.Projects that disturb native plants on state land must coordinatewith ADA and Arizona State Land Department, while projectsthat disturb native plants on private land must submit a notice <strong>of</strong>intent to ADA. Exceptions exist for maintenance <strong>of</strong> existingdeveloped properties less than ten acres, maintenance <strong>of</strong> existingutilities and their associated rights-<strong>of</strong>-way, 3 and emergencies.The following list <strong>of</strong> special interest species includes a brief life historyaccount, identification <strong>of</strong> requisite habitat components, and an evaluation<strong>of</strong> potential for occurrence in the project area. The potential for eachspecial interest species to occur in the project area was based onavailable literature, direct field observations, and the experience <strong>of</strong>biologists conducting this assessment. Evaluations <strong>of</strong> habitat suitabilitywere based on qualitative comparison between the habitat requirements<strong>of</strong> each species and vegetation communities and other habitat attributesfound in the project area, and on available information on the distribution<strong>of</strong> each species. Biotic communities are described according to Brown(1994).Federal Threatened and Endangered Species3Telephone conversation with Fred Logan, Arizona Department <strong>of</strong> Agriculture Native Plant Law<strong>of</strong>ficer on 09 December 1998.Lesser Long-nosed Bat (Leptonycteris curasoae yurbabuenae)Status: Listed endangered without designated critical habitat.Habitat: Plant communities include palo verde-saguaroassociations within desert scrub, semidesert grassland,and oak woodland with nearby caves and abandonedmines, and occasionally buildings for roost sites atelevations below 3,500 feet from April to July, and up to5,500 feet from July to October (FWS 1998, AGFD1998a).Diet: Feeds on pollen and nectar chiefly from agaves andsaguaros (AGFD 1996), organ pipe cactus (FWS 1998),and occasionally insects (AGFD 1998a).Range: Southeastern Arizona, and possibly extreme westernArizona (FWS 1998), chiefly from the PicachoMountains to the Agua Dulce Mountains and beyond tothe southwest, and southeast to the Galiuro andChiricahua mountains and beyond south into Mexico(AGFD 1998a). Two late summer records <strong>of</strong> immatureindividuals exist from the Phoenix area (AGFD 1998a).Residence: Migratory, arrives in Arizona as early as mid-April, anddeparts by October. Its temporal association withvegetation communities appears to depend on theflowering periods <strong>of</strong> preferred food plants.Assessment: Lesser long-nosed bat may occur occasionally in theproject area. Visits would most likely be accidental,represented by individual bats straying up riverinefloodplains in the project area during insect foragingbouts.Sonoran Pronghorn (Antilocapra americana sonoriensis)Status: Listed endangered without designated critical habitat.Habitat: Occurs chiefly in expansive alluvial basins within Sonorandesert grassland communities in southwestern Arizona(FWS 1998).Diet: Grasses, cacti, succulents, and bushes (H<strong>of</strong>fmeister1986).Range: Southwestern Arizona, including western Pima <strong>County</strong>,southeastern Yuma <strong>County</strong>, and southwestern <strong>Maricopa</strong><strong>County</strong> (FWS 1998).Residence: Permanent.Assessment: Extremely unlikely to occur in the project area. Therange <strong>of</strong> Sonoran pronghorn is far outside the Durangodrainage area, which does not contain habitat known tobe used by this species.Bald Eagle (Haliaeetus leucocephalus)Status: Listed threatened without designated critical habitat.Habitat: Large trees, snags, or cliffs near water for nesting andnear major rivers or reservoirs during winter (FWS 1998,AGFD 1997d). Bald eagle has been observed in Arizonaat elevations ranging from 460 to 8,000 feet (AGFD1997d).Diet: Primarily fish (usually less than six inches long), butwaterfowl, small mammals, turtles, snakes, and carrionare also eaten (FWS 1998, AGFD 1997d).Range: Wintering populations occur in central and northernArizona at Stoneman Lake, Mormon Lake, and LakeMary, and a small resident population exists in centralArizona. Territories and nest locations have recentlybeen observed along the Bill Williams River drainage, theDIBBLE & ASSOCIATES 39 DURANGO ADMPDATA COLLECTION REPORT
upper and lower Salt and Verde rivers, Roosevelt Lake,the Colorado River, and lakes and reservoirs along theMogollon Rim and in the White Mountains (AGFD1997d).Residence: Occurs in Arizona primarily as a migrant and winterresident, but known nesting sites exist along the Salt,Verde, Gila, Bill Williams, Agua Fria, and San Pedrorivers (FWS 1998).Assessment: Bald eagle is unlikely to occur in the project area, whichdoes not contain suitable habitat.Mexican Spotted Owl (Strix occidentalis lucida)Status: Listed threatened without designated critical habitat.Habitat: Mature and old growth montane forest and woodland,and steep, shady, wooded canyons from 4,500 to 10,000feet elevation. Populations do not occur in the arid,southwestern portion <strong>of</strong> Arizona (FWS 1998, AGFD1998c).Diet: Chiefly wood rats, but birds, rabbits, and insects are alsoeaten (AGFD 1998c).Range: Wide but patchy distribution in montane foreststhroughout Arizona, except the southwestern portion <strong>of</strong>the state (FWS 1998, AGFD 1998c).Residence: Permanent.Assessment: Mexican spotted owl is extremely unlikely to occur in theDurango drainage area, which at approximately 1,000feet elevation, does not contain montane forests and isfar below the altitudinal range <strong>of</strong> this owl.Cactus Ferruginous Pygmy-owl (Glaucidium brasilianum cactorum)Status: Listed endangered with critical habitat designated in<strong>Maricopa</strong> <strong>County</strong> along Saguaro and Canyon lakes.Habitat: Sonoran desertscrub and semidesert grasslandcommunities, sometimes within riparian zones, and nestsin saguaro cavities (FWS 1998). Larger native trees alsoappear to be an important habitat component, especiallymature mesquite bosques that are adjacent to broadleafriparian woodlands or saguaro stands at elevations from1,300 to 4,000 feet (AGFD 1998d).Diet: Lizards, invertebrates, and small birds and mammals(AGFD 1998d).Range: South-central Arizona, chiefly from the TortolitaMountains south and southeast into Mexico, along theSan Pedro River near Dudleyville, and along the Gila andSan Francisco rivers in eastern Arizona in Graham andGreenlee counties (AGFD 1998d).Residence: Permanent.Assessment: Cactus ferruginous pygmy owl may inhabit the projectarea, most likely in riparian woodland and xeroripariancommunities, including mesquite bosques. Surveys arerecommended in areas containing suitable habitat south<strong>of</strong> Broadway Road and west <strong>of</strong> 83 rd Avenue to determinepresence or absence prior to development activitieswithin such communities.Yuma Clapper Rail (Rallus longirostris yumaensis)Status: Listed endangered without critical habitat.Habitat: Appears to prefer habitats with wet substrates and densevegetation greater than 15 inches tall (FWS 1998),including cattail, bulrush, common reed, and tamarisk(AGFD 1997a).Diet: Crustaceans, insects, frogs, small fish, bird eggs, andplant seeds (AGFD 1997a).Range: Occurs along the Colorado River from Topock Marshsouth into Mexico, along the Bill Williams Riverdrainage, the Gila and Salt rivers upstream to the VerdeRiver confluence (FWS 1998), the Gila River to theColorado River confluence, and Picacho Reservoir(AGFD 1997a).Residence: Approximately 70% <strong>of</strong> Arizona’s breeding population ispermanent, and the remainder migrates to winteringgrounds along the lower Colorado River (AGFD 1997a).Assessment: Yuma clapper rail may occur regularly in wetland andmarsh communities within the project area. Surveys arerecommended to determine presence or absence prior todevelopment activities within such communities.Southwestern Willow Flycatcher (Empidonax traillii extimus)Status: Listed endangered with critical habitat designated in<strong>Maricopa</strong> <strong>County</strong> at Horseshoe Lake.Habitat: Riparian vegetation along streams, rivers, or otherwetlands (Johnson, Haight and Simpson 1987). Pure andmixed stands native and exotic riparian shrubs or treesincluding willow, cottonwood, box elder, ash, tamarisk(Arizona Partners in Flight 1996), and Russian olive atelevations from 90 to 8,240 feet (AGFD 1997e).Diet: Chiefly insects, and occasionally berries and seeds(AGFD 1997e).DIBBLE & ASSOCIATES 40 DURANGO ADMPDATA COLLECTION REPORT
Range: Breeds locally along the Colorado River’s confluencewith the Little Colorado River, the headwaters <strong>of</strong> theLittle Colorado River near Greer and Eager, south <strong>of</strong>Yuma, the middle Gila, Salt, and Verde rivers, the middleto lower San Pedro River, and the upper San FranciscoRiver near Alpine (AGFD 1997e).Residence: Arrive in late April and begins to nest in late May(Phillips, Marshall and Monson 1964, Unitt 1987).Migrates south in August and September (AGFD 1997e).Assessment: Southwestern willow flycatcher may occur regularly insuitable habitat (dense riparian woodland) within theproject area along the Salt and Agua Fria rivers. Surveysare recommended to determine presence or absence priorto development activities within such communities.Razorback Sucker (Xyrauchen texanus)Status: Listed endangered with critical habitat designated in<strong>Maricopa</strong> <strong>County</strong> at Horseshoe Lake.Habitat: Slow backwaters <strong>of</strong> medium and large streams andrivers, and impoundments at least 1 m deep over sand,mud, or gravel substrates at low to intermediateelevations (AGFD 1995a).Diet: Insect larvae, plankton, algae, and detritus (AGFD1995a).Range: Small, isolated populations exist in the lower ColoradoRiver south <strong>of</strong> Lake Havasu (FWS 1998), and inHorseshoe Reservoir in <strong>Maricopa</strong> <strong>County</strong> (SeeAppendix).Residence: Permanent.Assessment: Razorback sucker is extremely unlikely to occur in theproject area, chiefly because the species is rare, and theadverse impacts known to exist by exotic fishes on nativefishes. Reintroductions into the Gila and Salt rivers haveapparently failed and are currently ongoing only in theVerde River. Populations are known to occur only in theVerde and Colorado rivers.Gila Topminnow (Poeciliopsis occidentalis occidentalis)Status: Listed endangered without designated critical habitat.Habitat: Springs, cienegas, and streams below 4,500 to 5,000 feetin elevation (FWS 1998, AGFD 1995b).Diet: Crustaceans, insect larvae, and detritus (AGFD 1995b).Range: Historically found throughout the Gila River drainage,but now restricted to the Santa Cruz River and itstributaries (FWS 1998). Within the Gila River basin,Gila topminnow occurred in the Gila, Salt, Santa Cruz,San Pedro, and San Carlos rivers, and their tributaries.They were never documented to occur in the Verde,Hassayampa, or Agua Fria rivers. Ten locations withinthe Gila River drainage are currently known to supportGila topminnow. However, this species has not beenrecently observed in the Gila, Hassayampa, or Coloradorivers (Weedman and Young 1997, AGFD 1995b). Nonatural populations exist in <strong>Maricopa</strong> <strong>County</strong> (FWS1998).Residence: Permanent.Assessment: Gila topminnow is extremely unlikely to occur in theproject area, which is outside the existing known range.However, a possible reintroduction site has beenidentified at the Tres Rios project (personalcommunication, Roland Wass, City <strong>of</strong> Phoenix WaterServices Department, 12-20-99). This potentialreintroduction should be monitored prior to commencingany construction activities at or downstream <strong>of</strong> this site.Desert Pupfish (Cyprinodon macularius)Status: Listed endangered with critical habitat designated atQuitobaquito Spring in Pima <strong>County</strong>.Habitat: Historically occurred in springs, marshes, backwaters,and tributaries from sea level to approximately 5,000 feetelevation (FWS 1998, AGFD 1994).Diet: Insects, crustaceans, and plants (AGFD 1994).Range: Historically occurred in the San Pedro, Santa Cruz, andlower Gila rivers, and lower Colorado River drainages inArizona (FWS 1998). Currently, one natural population<strong>of</strong> C. m. eremus exists at Quitobaquito Spring in OrganPipe National Monument, and no natural populations <strong>of</strong>C. m. macularius exist in Arizona (Weedman and Young1997, AGFD 1994). Recent and current reintroductions<strong>of</strong> the latter subspecies occurred in Pima, Pinal,<strong>Maricopa</strong>, La Paz, Graham, Cochise, and Yavapaicounties (FWS 1998), but only one population at ColdSprings remains extant (Weedman and Young 1997).The reintroductions may have contained a mixture <strong>of</strong>various subspecies, which potentially invalidates thegenetic integrity <strong>of</strong> either natural subspecies, andobscures the reintroduction history <strong>of</strong> this species inArizona (Weedman and Young 1997). No natural orDIBBLE & ASSOCIATES 41 DURANGO ADMPDATA COLLECTION REPORT
introduced populations exist in <strong>Maricopa</strong> <strong>County</strong> (FWS1998).Residence: Permanent.Assessment: Desert pupfish is extremely unlikely to occur in theproject area, from which this species is consideredextirpated.Arizona Agave (Agave arizonica)Status: Listed endangered without designated critical habitat.Habitat: Occurs at the oak-juniper woodland and mountainmahogany-scrub oak transition zone at 3,000 to 6,000feet elevation, usually on steep rocky slopes butoccasionally on gentle slopes and drainage bottoms(FWS 1998).Range: New River Mountains in <strong>Maricopa</strong> and Yavapai counties,and in the Sierra Ancha in Gila <strong>County</strong>. Potential habitatexists in the Mazatal Mountains in Gila and <strong>Maricopa</strong>counties (FWS 1992), and where the ranges <strong>of</strong> Agavetoumeyana var. bella and Agave chrystantha overlap(See Appendix), in eastern <strong>Maricopa</strong> <strong>County</strong> and Pinal<strong>County</strong> (Kearney and Peebles 1960).Assessment: Arizona agave is extremely unlikely to occur in theproject area, which is outside the altitudinal range <strong>of</strong> thisspecies and does not support the vegetation communitieswith which this plant is associated.Arizona Cliffrose (Purshia [Cowania] subintegra)Status: Listed endangered without designated critical habitat.Habitat: Grows only on white limestone deposits at approximately2,500 to 3,500 feet elevation (FWS 1998, Kearney andPeebles 1960).Substrate: Limestone deposits and associated white soils (FWS1998).Range: Mohave, Yavapai, and Graham counties, and theHorseshoe Lake area in northern <strong>Maricopa</strong> <strong>County</strong>(FWS 1998, 1992).Assessment: Arizona cliffrose is extremely unlikely to occur in theproject area, which is outside the altitudinal range <strong>of</strong> thisspecies and does not support the vegetation communitieswith which this plant is associated.Arizona Hedgehog Cactus (Echinocereus triglochidiatus var.arizonicus)Status: Listed endangered without designated critical habitat.Habitat: Madrean Evergreen Woodland and Interior Chaparralecotone, and grassland at 3,400 to 5,300 feet elevation(FWS 1998, AGFD 1997c). Usually rugged terrain insteep canyons, growing from cracks in boulders andunder shrubs on rocky substrates (AGFD 1997c).Substrate: Granite rich in Orthoclase, volcanic tuft, dacite, andpossibly rhyolite (AGFD 1997c).Range: <strong>Maricopa</strong>, Gila, and Pinal counties (FWS 1998, 1992).Assessment: Arizona hedgehog cactus is extremely unlikely to occurin the project area, which is outside the altitudinal range<strong>of</strong> this species and does not support the vegetationcommunities with which this plant is associated.Wildlife <strong>of</strong> Special Concern in ArizonaWestern Least Bittern (Ixobrachus exilis hesperis)Status: Wildlife species <strong>of</strong> special concern.Habitat: Breed in dense, tall cattail marshes (AGFD 1996,DeGraaf and Rappole 1995).Diet: Food habits unavailable for this subspecies. However, inNew Mexico, Ixobrachus exilis exilis feeds on a variety<strong>of</strong> invertebrates (worms, molluscs, crustaceans, andinsects) , and vertebrates (small birds and eggs, fishes,amphibians, and small rodents) (BISON-M 1998).Range: Along the lower Colorado River, a few locations alongthe Gila River below the Salt River confluence, PicachoReservoir, and Dankworth Ponds south <strong>of</strong> Safford(BISON-M 1998, AGFD 1996).Residence: Permanent.Assessment: Western least bittern has been observed in the projectarea. <strong>Flood</strong> control activities such as clearing, dredging,and channelization are thought to adversely affectwestern least bittern (BISON-M 1998, AGFD 1988).Project planners should compare the potential impacts <strong>of</strong>construction activities in habitat for this species to thebenefits gained from project goals and objectives.Yellow-billed Cuckoo (Coccyzus americanus occidentalis)Status: Wildlife species <strong>of</strong> special concern.Habitat: Mature cottonwood and willow stands, and mesquitebosques (AGFD 1998b, 1996), where moisture issufficient to sustain emergent aquatic vegetation ordeciduous interior strands (BISON-M 1998).Diet: Chiefly insects, and also bird eggs and fruit (AGFD1998b, 1996).DIBBLE & ASSOCIATES 42 DURANGO ADMPDATA COLLECTION REPORT
Range: Southern, central, and extreme northeast Arizona (AGFD1998b, 1996).Residence: Migratory. Breeds in much <strong>of</strong> North America andwinters in South America (AGFD 1998b).Assessment: Western yellow-billed cuckoo has been observed in theproject area. Project planners should considermanagement <strong>of</strong> riparian areas known to support yellowbilledcuckoo (AGFD 1998b).Great Egret (Ardea alba)Status: Wildlife species <strong>of</strong> special concern.Habitat: Desert riparian deciduous woodland and marshes wheredesert streams provide sufficient moisture to sustainriparian scrub and/or interior strand communities(BISON M 1998). Requires concealment provided bytall vegetation and is usually found away from humandisturbance (DeGraaf and Rappole 1995).Diet: Food habits unavailable for this subspecies, but areassumed to be similar to that <strong>of</strong> snowy egret, whichinclude plant tissue, invertebrates (worms, molluscs,crustaceans, and insects), and vertebrates (small birdsand eggs, fishes, amphibians, and small rodents).Range: Breeding colonies are very local, chiefly restricted to theColorado River in Mohave <strong>County</strong>, below Bullhead City(AGFD 1988), although individuals occur in CoronadoNational Forest and at Picacho Reservoir (BISON M1998).Residence: Permanent.Assessment: Great egret has been observed in the project area.Project planners should compare the potential impacts <strong>of</strong>construction activities in habitat for this species to thebenefits gained from project goals and objectives.Snowy Egret (Egretta thula)Status: Wildlife species <strong>of</strong> special concern.Habitat: Marsh habitats (AGFD 1999).Diet: Feeds on a variety <strong>of</strong> plant material, invertebrates(worms, molluscs, crustaceans, and insects), andvertebrates (small birds and eggs, fishes, amphibians, andsmall rodents) (BISON-M 1998).Range: Along the Gila River from Phoenix to the ColoradoRiver, including near Yuma. Winter breeding coloniesexist near Yuma and below Painted Rock Dam (AGFD1999).Residence: Year-round resident (AGFD 1999).Assessment: Snowy egret has been observed in the project area.Project planners should compare the potential impacts <strong>of</strong>construction activities in habitat for this species to thebenefits gained from project goals and objectives.Sonoran Desert Tortoise (Gopherus agassizii)Status: Wildlife species <strong>of</strong> special concern.Habitat: Rocky slopes and bajadas in Sonoran Desertscrubcommunities to elevations <strong>of</strong> approximately 5,300 feet(AGFD 1997b).Diet: Grasses, cacti, flowers, forbs, succulents, trees, andshrubs (AGFD 1997b).Range: The Sonoran population occurs from south and east <strong>of</strong>the Colorado River to southeast Arizona (AGFD 1997b).Residence: Permanent.Assessment: A desert tortoise carcass was observed in the projectarea. Project planners should consider habitatdestruction and population fragmentation prior toimplementing construction activities. Fragmentation mayresult from urbanization, mining, and <strong>of</strong>f-road vehicleactivity (AGFD 1997b).ConclusionsFour <strong>of</strong> the thirteen federally-listed species, and all five state-listedspecies may occur in the project area. All such species are most likelyto occur in aquatic communities or the adjacent riparian communities.If possible, activities associated with the Durango Area Drainage MasterPlan (e.g. diversion discharge points) within floodplains should avoidareas in and within 300 meters <strong>of</strong> mature riparian woodland, and ratherbe located farther away from such valuable biological resources.DIBBLE & ASSOCIATES 43 DURANGO ADMPDATA COLLECTION REPORT
B. Historical and Pre-Historical Themes EvaluationThe archaeological site files were examined at the State HistoricPreservation Office, the Arizona State Museum, Arizona StateUniversity, and Pueblo Grande Museum. The archeological assessmentincluded the documentation <strong>of</strong> known cultural resources for the projectarea. Every known archaeological site, it’s location, and all otherspecific information are available in an electronic format. In this section,an overview <strong>of</strong> the prehistoric cultural resources is presented. Theoverview is followed by a discussion <strong>of</strong> the specific resources in theproject area. Finally, important themes in prehistory as they pertain tothe cultural resources in the Durango ADMP are summarized.Cultural Resources OverviewThe Durango ADMP project area is within an area that was occupied bythe prehistoric Hohokam culture. This prehistoric culture inhabitedsouthern Arizona between about A.D. 500 and 1450. This stone-ageculture maintained an extensive system <strong>of</strong> irrigation canals and largevillages in the Phoenix metropolitan area. The Hohokam successfullygrew crops <strong>of</strong> corn and cotton in the Phoenix area through more than ahundred miles <strong>of</strong> irrigation ditches, the alignments <strong>of</strong> which are followedeven today. Due to the unique hydrologic and topographic setting <strong>of</strong> thePhoenix area, many <strong>of</strong> the irrigation canals begin near Papago Buttes andcontinue as far west as the community <strong>of</strong> Tolleson.The Hohokam occupation is generally divided by researchers into fourdistinct periods, which have been further subdivided into phases. Thebeginnings <strong>of</strong> Hohokam culture are initially seen in the Pioneer Period,whose inception date is currently under debate by archaeologists. Anearly Red Mountain Phase has been suggested as beginning around A.D.1 and continuing until circa A.D. 400, and is followed by the moretraditionally accepted Vahki, Estrella, Sweetwater, and Snaketownphases, that together make up the Pioneer Period. During this period, thetraditions <strong>of</strong> canal irrigation, crop domestication, and the distinctive redon-buffpottery begin to develop. Formal site structure that includestoward the end <strong>of</strong> the period, large plaza, mounds, and ballcourts,becomes established. Burial ceremonialism is pronounced and adistinctive figurine complex occurs. Burial methods are dominated bycremation and the architectural styles include pithouses.During the subsequent Colonial Period, the attributes that weredeveloping toward the end <strong>of</strong> the Pioneer period, flourish. While thefigurine complex disappears, an active religious complex can be seen inthe elaborate carved censers and palettes found with cremation burials.The economic and exchange spheres <strong>of</strong> influence become morepronounced through an extensive ball court network, and theestablishment <strong>of</strong> settlements throughout southern and parts <strong>of</strong> centralArizona. The period dated between 700 A.D. and continued toapproximately 900 A.D., containing the Gila Butte and Santa CruzPhases. The Sedentary Period, consisting <strong>of</strong> the Sacaton phase, lastedfrom circa A.D. 900 to 1150. The patterns seen in the precedingColonial period continued. Climatological data suggest that water forirrigation was abundant, allowing the extensive networks <strong>of</strong> villages andirrigation canals in the core areas along the lower Salt River valley andthe middle Gila River valley. Most <strong>of</strong> the large villages in the DurangoADMP project area were inhabited during this time.Extensive changes mark the transition to the Classic Period, which datesfrom approximately A.D. 1150 to 1450. The Soho and Civano Phasesoccur within the Classic Period. This period is marked by a shift in burialmethods, architectural styles, pottery types, and monumentalarchitecture. Cremation burial gives way to inhumation burial, pithousesare replaced by aboveground adobe rooms surrounded by compoundwalls, red-on-buff pottery is abandoned in favor <strong>of</strong> redware pottery, andballcourts give way to large platform mounds. These many changes hadtheir beginnings toward the end <strong>of</strong> the pre-Classic era. The Classicperiod lasted for three centuries. The large village <strong>of</strong> Las Colinas, at theeastern edge <strong>of</strong> the Durango study area, was occupied at this time. Bythe mid-1400s, the Hohokam culture quickly disintegrated and by the1500s, the culture is completely gone from the archaeological record.The demise <strong>of</strong> the Hohokam is probably related to pan-southwesterndynamics during the 14 th and 15 th centuries. In the Phoenix areaspecifically, researchers have argued that dramatically unpredictablerainfall patterns caused series <strong>of</strong> major floods that proved too destructivefor the extensive irrigation systems in the valley.Following the end <strong>of</strong> the Hohokam culture the Phoenix Basin underwenta period <strong>of</strong> sparse habitation. People living in southern Arizona appearto have adopted a dispersed, farming, hunting and gathering lifestyle,occupying small rancherias along the rivers. In later times, the probabledescendants <strong>of</strong> the Hohokam, the Pima, were reported by Spanishchroniclers to inhabit the area as farmers. Little direct evidence existsfor habitation <strong>of</strong> the Durango ADMP during the period from A.D. 1450until the arrival <strong>of</strong> Spanish, Mexican, and Anglo factions that began inappreciable numbers in the 18th century. The ensuing period <strong>of</strong> historicexploitation was marked by mining, ranching, and homesteadinginterests. These historic pursuits included the construction <strong>of</strong> canals, aswell as re-utilization <strong>of</strong> prehistoric ones (Details <strong>of</strong> this historic periodare outlined in the Historic Themes section <strong>of</strong> this study).DIBBLE & ASSOCIATES 44 DURANGO ADMPDATA COLLECTION REPORT
In addition to the large habitation sites in the vicinity <strong>of</strong> the project area,the Hohokam were also responsible for the construction <strong>of</strong> a largesystem <strong>of</strong> irrigation canals throughout the Salt River Valley. One <strong>of</strong> thelargest networks within this system was first identified by Omar Turneyin the 1920's as a group <strong>of</strong> large canals that he designated as “the secondcanal system” (he recorded the first canal system in the Tempe-Chandlerarea). From their head at the Salt River immediately south <strong>of</strong> PuebloGrande the canals flow in a west to northwesterly direction away fromthe river. Later studies <strong>of</strong> the canals indicate the main channels in thesecond canals system were as long as 16 miles, and may have irrigatedup to 20,000 acres during the Colonial period. Maps <strong>of</strong> the canalsforming the second canal system from both Omar Turney, FrankMidvale, and other researchers show segments running through theDurango ADMP project area. Figure V-2 shows the major sites andcanals recorded in the Durango ADMP project area.Cultural Resources In the Project AreaThirty-five sites have been recorded in the Durango ADMP project area.Five <strong>of</strong> the sites are historic and include the St. Johns canal, an unnamedcanal segment, a farmhouse, and two well sites (see the Historic Sectionfor a discussion <strong>of</strong> the history <strong>of</strong> this area). The remaining thirty sites areprehistoric. These sites include large, primary villages, smaller villages,and artifact scatters. Little is known about most <strong>of</strong> these sites exceptwhat was recorded several decades ago. Based on the sites that havebeen identified in the Durango ADMP, the eastern half <strong>of</strong> the projectarea contains abundant evidence for prehistoric irrigation canals, largevillages, and smaller sites. In the western half <strong>of</strong> the project area,comparatively few archaeological remains have been identified. Twolarge villages have been recorded in the western half <strong>of</strong> the project areanear the confluence <strong>of</strong> the Salt, Gila, and Agua Fria Rivers, the CashionRuin and the La Cienega Ruin. Although this region has been disturbedby modern agricultural activities, there are undoubtedly significantsubsurface remains at the sites.Five large primary villages have been recorded in the project area. Thesevillages represent some <strong>of</strong> the most significant prehistoric resources inthe Phoenix metropolitan area. From east to west, these sites include LasColinas, Pueblo del Rio, Pueblo del Alamo, the Cashion Ruin, and the LaCienega Ruin. These sites were recorded by early researchers, in the1920's through the 1940's. Las Colinas was reported to have at leastfour platform mounds (and possibly as many as ten), a ballcourt, andmany buildings that covered an area <strong>of</strong> 2 to 3 square miles. Excavationsat this site were carried out by the Arizona State Museum between 1982and 1984, in advance <strong>of</strong> freeway construction. The part <strong>of</strong> the site thatwas excavated yielded the remains <strong>of</strong> a platform mound, a ball court,irrigation canals, a reservoir, and hundreds <strong>of</strong> other features that includedhouses, burials, cooking pits, and trash pits. The site was inhabitedduring the Sedentary and Classic period, between about A.D. 900 and1400. The Sedentary period occupations include several house areas andassociated cemeteries. Much <strong>of</strong> the Classic period habitation evidencehad been stripped away by historic development and agriculture and theexcavations concentrated on the platform mound, associated houses, andscattered burials.The Cashion Ruin was investigated in 1978 and 1979 by the Museum <strong>of</strong>Northen Arizona for a pipeline related to the Palo Verde Nuclear plant.This site is on the northern edge <strong>of</strong> the Salt River, at its confluence withthe Gila River. The site was mapped by Omar Turney and later by FrankMidvale, who reported that it contained many trash mounds, houses, andthree ball courts. It was associated with a canal or series <strong>of</strong> canals thatwere several miles in length. The excavations there recovered evidence<strong>of</strong> houses, burials, cooking pits, and many other pit types. Agriculturalplowing had leveled the mounds but many <strong>of</strong> the subsurface featureswere found to be intact. Dozens <strong>of</strong> cremations burials excavated by theMuseum revealed numerous red-on-buff pottery vessels, stone censers,palettes, and other mortuary accompaniments. The occupation appearsto have been primarily during the late Colonial and Sedentary periods,between A.D. 800 and 1100. Frank Midvale mapped two other siteseast <strong>of</strong> the Cashion Ruin. Near the east edge <strong>of</strong> the Cashion Ruin, in thecenter <strong>of</strong> Section 29, he mapped the Hacha Piedra Ruin. In the northernpart <strong>of</strong> Section 28, he mapped a site he referred to as Pueblo Poniente.Little is known about these sites except that Pueblo Poneinte may dateto the Classic period, based on Midvale’s notation that polychromepottery was present.Maps <strong>of</strong> features at other important sites, Pueblo del Rio, Pueblo delAlamo, and the La Cienega Ruin, were drawn by the early investigatorsbut no formal excavations have been done in recent times. These sites allappear to have been most intensively occupied between about A.D. 700and 1200. Development <strong>of</strong> this region in the 1940's for agriculture hasresulted in the leveling <strong>of</strong> most <strong>of</strong> the surface features at these villages.Nonetheless, it is very likely that subsurface features are abundant atthese sites.Prehistoric Themes EvaluationImportant themes for prehistoric sites in the Durango ADMP projectarea are many, but major topics include: 1) Settlement Patterns and SiteDevelopment, 2) Canal Irrigation Systems, and 3) Ceramic Exchangeand Interaction, and 4) Public Education relating to Prehistoric Land Useand Agriculture.DIBBLE & ASSOCIATES 45 DURANGO ADMPDATA COLLECTION REPORT
Settlement Patterns and Site DevelopmentThe Durango ADMP project area includes a significant portion <strong>of</strong> theHohokam culture’s core area. Within the lower Salt River valley, theHohokam developed one <strong>of</strong> the largest continuous settlement systems insouthern Arizona. Due to the unique physical setting and theirtechnological ingenuity, the Hohokam were able to turn the arid desertinto a veritable bread basket through canal irrigation. Some <strong>of</strong> the largestsites in the Phoenix metropolitan area occur in the Durango ADMP. Animportant theme for these cultural resources includes the pattern andhistory <strong>of</strong> their development. While the sites were certainly autonomousvillages, their inhabitants were connected through their use <strong>of</strong> theirrigation canals.The studies <strong>of</strong> Hohokam site structure and social organization have beenimportant topics for nearly two decades. Studies <strong>of</strong> village organizationhave been productively advanced through the careful examination <strong>of</strong>both small and large sites. Such studies are important in helping todescribe the internal structure <strong>of</strong> villages in order to try and understandthe manner in which Hohokam society was organized. The existence <strong>of</strong>different site types within east-central Phoenix also allows archaeologiststo get a more complete view <strong>of</strong> the settlements patterns within theHohokam core area. This is important in trying to understand thehierarchical structure <strong>of</strong> Hohokam settlement and its role in theorganization <strong>of</strong> their society. Also important is the nature <strong>of</strong> villageplacement along the river and associated irrigation canals.Understanding these patterns also can be helpful in understanding aboutHohokam culture.Canal Irrigation Systems and Prehistoric Land UseThe irrigation canals located in the Phoenix area were the life lines forthe Hohokam. Studying these features can inform about the nature <strong>of</strong>economic organization. Study <strong>of</strong> the technical aspects <strong>of</strong> canals hasenhanced our knowledge <strong>of</strong> their overall distribution and amount <strong>of</strong>water that could potentially be moved to prehistoric crops. Thisinformation then, can be used to discuss the overall organization <strong>of</strong> theHohokam villages in this area, for example, how the villages interacted,who controlled the allocation <strong>of</strong> water, and how much organization wasrequired to maintain such an extensive canal system.The Arizona Historic Preservation Plan has identified prehistoricirrigation as one <strong>of</strong> its components. According to the report “PrehistoricIrrigation in Arizona: A Context for Canals and Related CulturalResources,” several specific criteria have been identified for evaluatingthe importance <strong>of</strong> these prehistoric features. These questions include thefollowing: 1) how big were the canal systems? 2) How well did thesecanals work? How old are these canals? 4) How did irrigation systemschange over the years? Based on a conservative estimate for theDurango ADMP project area, there could easily be more than 25 miles<strong>of</strong> prehistoric canals below the modern surface. Identifying these canals,different canal types, and different periods <strong>of</strong> use would be veryimportant. Why are these important? The Prehistoric Irrigation Contextreport goes on to say that prehistoric irrigation works are important fortheir research potential, for education and recreation, and for economicdevelopment.Prehistoric Ceramic Exchange and InteractionOne <strong>of</strong> the most abundant artifact types at Hohokam prehistoric sites arepieces <strong>of</strong> broken pottery. The Hohokam used ceramic containers forcarrying water, cooking food, storing grain, and other activities.Archaeologists study prehistoric ceramics because the way that potswere made and painted changed through time and differed betweengroups. Ceramics provide abundant information about the movement <strong>of</strong>people and pots throughout an area. Studies in the Phoenix Basin haveshown that clay collected from certain parts <strong>of</strong> the valley containsdistinctive minerals. When these clays are used to make pottery,archaeologists can trace the origin <strong>of</strong> the pots and by extension,reconstruct the social networks <strong>of</strong> the villagers and their kin.Studies <strong>of</strong> ceramics can be used to interpret the community organizationfor the prehistoric villagers in the Durango ADMP project area, and theirrelationship with other villagers throughout the Phoenix Basin.Public Education: Prehistoric LandA theme important to the Durango ADMP project area is the manner inwhich this region has been used by people for the last 1000 years, upthrough the present day. The earliest Hohokam settlers in this part <strong>of</strong>the valley were farmers who grew their crops with the aid <strong>of</strong> canalirrigation. This same agricultural tradition can be seen in the area today,although on a much larger scale. Opportunities are abundant in this areato combine elements <strong>of</strong> prehistoric archaeology, history, and education.The Prehistoric Irrigation Context report notes thatThe recreational value <strong>of</strong> prehistoric irrigation sites and featuresis indicated by Arizona’s many recreational facilities and annualevents catering to a vibrant public interest in archaeology . . .The establishment <strong>of</strong> two local parks that focus primarily onprehistoric irrigation themes show that prehistoric irrigationsystems have recreational potential. The Park <strong>of</strong> Four Waters inPhoenix was set aside specifically to protect some <strong>of</strong> the bestremaining examples <strong>of</strong> prehistoric Hohokam canals along thelower Salt River . . . [F]ormal education campaigns can make thegeneral public more aware <strong>of</strong> Arizona’s unique heritage <strong>of</strong> morethan a millennium <strong>of</strong> ancient irrigation works.DIBBLE & ASSOCIATES 47 DURANGO ADMPDATA COLLECTION REPORT
C. Archaeological AssessmentAt first glance, the study area appears to be a quiet, mostly rural section<strong>of</strong> Phoenix, located west <strong>of</strong> the hustle-bustle <strong>of</strong> downtown and theintensity <strong>of</strong> suburban areas to the north and east. Its seeming quietness,however, belies the many facets <strong>of</strong> Arizona history that have passedthrough the area. The roughly 68-square mile area witnessed the earliestAmerican surveyors to visit the area, delivered water for irrigated farmsboth large and small, sheltered homesteaders, provided flat terrain topromote the construction <strong>of</strong> railways and highways, and hosted bothWorld War I-era cotton production and World War II-era defense plants(Figure V-3). Today, the agricultural fields are dotted with developers’signs announcing new housing construction.Surveying the LandThe study area stretches across three townships in the western half <strong>of</strong> theSalt River Valley, Township 1 North, Range 1 East, Range 1 West, andTownship 1 North, Range 2 East. Those names and numbers bythemselves indicate the first Anglo history <strong>of</strong> the area.After the end <strong>of</strong> the Civil War in the spring <strong>of</strong> 1865, John Clark,surveyor general for the territories <strong>of</strong> Arizona and New Mexico,suggested to the General Land Office that it conduct surveys <strong>of</strong> suitableagricultural lands in the river valleys <strong>of</strong> Arizona. That year, however, theArmy sent soldiers rather than surveyors and established military poststo confront Apache hostilities against settlers.By January 1867, Clark had been successful in his requests and hiredsurveyor William Pierce to do a preliminary survey <strong>of</strong> the Salt RiverValley beginning at the initial monument located on a hillside just south<strong>of</strong> the confluence <strong>of</strong> the Salt and Gila Rivers (today, 115 th Avenue). Inhis notes, Pierce remarked on the appropriateness <strong>of</strong> the land foragriculture noting its rich soil, generally level surface, lack <strong>of</strong> heavyvegetation, and availability <strong>of</strong> water for irrigation. He went so far as tosuggest that the land was “some <strong>of</strong> the best agricultural land I have yetseen in the Territory and would recommend that it be subdivided at anearly day” (as quoted in Zarbin 1997:6).The subdividing <strong>of</strong> the townships laid out by Pierce was completed byDeputy Surveyor Wilfred Ingalls in the spring <strong>of</strong> 1868. The mapaccompanying the 1869 Annual report for the General Land Officeindicates that the territory surveyed from the initial monument at theconfluence <strong>of</strong> the Salt and Gila Rivers was the first land to be formallysurveyed in the Arizona Territory (General Land Office 1869).The work <strong>of</strong> Clark, Pierce, and Ingalls determined much <strong>of</strong> the look <strong>of</strong>the landscape <strong>of</strong> the study area today. The segmented, straight-lineboundaries <strong>of</strong> individual properties and fields set the pattern for thestraight roads aligned to the cardinal points <strong>of</strong> the compass. The designlaid out by the surveyors’ chains can still be seen in the grid systemvisible on the ground today (Hecht and Reeves 1981)The First DitchesAgriculture was the first, and for many decades the most important,economic activity in the Phoenix area. Soon after the Civil War, the firstAmerican settlers noticed the possibilities for irrigated agriculture in theexpansive, flat valley created by the Salt River flood plain. The notoriousJack Swilling and his cohorts first dug canals (or rather, re-dugprehistoric canals first constructed by Hohokam farmers) in the easternportions <strong>of</strong> the Salt River Valley in 1867 (Township 1 North, Range 3East). They were soon joined by other canal entrepreneurs all along bothbanks <strong>of</strong> the Salt River. From the late 1860s through the 1870s, manygroups <strong>of</strong> farmers diverted water from the Salt River for irrigated crops,from the Mormon farmers in Lehi and Mesa to the agriculturalentrepreneurs in the western stretches <strong>of</strong> the valley, in the study area.The several agricultural entrepreneurs in the Salt River Valley organizedto establish the desert settlement <strong>of</strong> Phoenix in 1870. The next year, thenew town was named the county seat <strong>of</strong> the newly created <strong>Maricopa</strong><strong>County</strong>, and by 1872, the valley hosted more than 1,000 residents abouthalf Mexicans (Sargent 1988:26).A handful <strong>of</strong> enterprising farmers oversaw the digging <strong>of</strong> the first canalin the study area as early as 1869, just two years after Swilling’s firstventures in the Salt River Valley. In 1870, a group <strong>of</strong> four investorscompleted a ditch that had been begun the previous year. The new ditchheaded <strong>of</strong>f from the river near present-day Fourth Street (extended) andBuckeye Road and extended northwest (into the project area) to waterthe investors’ homesteads, located to the southwest <strong>of</strong> the futuresettlement <strong>of</strong> Phoenix. Identified as the Griffin Ditch on the 189- map,the canal was also referred to as the Juan Chiviri Ditch, perhapsreflecting the employment <strong>of</strong> <strong>Maricopa</strong> Indians in the ditch digging ortheir settlement at head <strong>of</strong> the Griffin Ditch in 1880 (Zarbin 1997:23). Atan estimated cost <strong>of</strong> $10,000, the Griffin Ditch carried about 2,000inches <strong>of</strong> water (Zarbin 1997:35).In 1871 two companies announced plans to divert water from the northbank <strong>of</strong> the Salt River between present-day 27 th and 35 th avenues. TheSalt River Farming Ditch Company and the Monterey Ditch Companyincluded experienced irrigators from earlier ventures in the valley, andclaimed a total <strong>of</strong> 25,000 miner’s inches <strong>of</strong> water(just over 600 cubic feetDIBBLE & ASSOCIATES 48 DURANGO ADMPDATA COLLECTION REPORT
R1WR1ER1ER2E0403020106050403 0201060504030201TOLLESONSee DETAIL A091011120708# Cashion StationCowden StationFowler Station101112070809101109# # # # Fowler DepotJean Station# Campo Station1216211522Agua Fria River14231324181917201621152214231324181917201615141321 222324unmapped28 27262725 3026 2530292829282726253334353631323334Salt River3536 313233343536r Initial MonumentKEYPROJECT LOCATIONT1N-R1WT1N-R1ET1N-R2EGila and Salt River MeridianArizona<strong>Maricopa</strong><strong>County</strong>Project BoundarySalt River Project BoundarySteam Power Plant(Central Arizona Light and Power)<strong>County</strong> Poor FarmArizona Eastern Railroad(Southern Pacific Railroad)U.S. Highway 80PROJECT TITLE:DURANGO AREA DRAINAGE MASTER PLANPROJECT NO. FCD 99-41CONSULTANT:St. John's CanalSalt River Valley CanalMeridian Canal(unmapped in R2E)Farmers' CanalGriffin Ditch0 2000 4000 6000 8000 FeetAZ State Plane Central NAD83NDETAIL AFIGURE V-3EXHIBIT TITLE:HISTORICAL FEATURES
per second) 4 . The Salt River Farming Ditch Company built a canaldownstream from the Griffin Ditch in 1872, and with a bottom width <strong>of</strong>25 feet, it was much larger than the earlier canal. At a cost <strong>of</strong>approximately $22,000, the ditch was planned to extend all the way westto the Agua Fria River (Zarbin 1997:35)By the spring <strong>of</strong> 1872, six ditches diverted water from the north bank <strong>of</strong>the Salt River within the project area. From east to west, the list includedthe Swilling Canal, the Wilson Canal, the Juan Chiviri/Griffin Ditch, theSalt River Valley Canal, the Monterey Canal, and the Mexican Canal. Inone observer’s opinion, farmers cultivated about 8,000 acres in thespring <strong>of</strong> 1872, about half in barley, one-third in wheat, and the rest invegetables, alfalfa, vineyards, and orchards (Zarbin 1997:35).The Arizona desert climate cycles between wet spells and dry years. Inthe first years <strong>of</strong> the 1870s, abundant floods washed out both canals andbrush diversion dams across the valley. By 1879, however, a dry yearbrought new concerns and accusations. The worried Salt River Valleyfarmers talked about building a unified irrigation system with a singlewatertight dam on bedrock to divert the Salt River water into theircanals. In 1881, Territorial Governor John C. Fremont urged theTerritorial Assembly to “seek federal aid to develop water-storageprojects that would enable vast wastelands to be occupied by settlers”(Waggoner 1970:174). The discussions eventually led to the formation<strong>of</strong> the Salt River Valley Water Users’ Association and the construction<strong>of</strong> Roosevelt dam in the first decade <strong>of</strong> the new century.4 The term “miner’s inch” is a measurement <strong>of</strong> small amounts <strong>of</strong> flowing water, and the exactamount <strong>of</strong> water included in a miner’s inch is determined by individual state statute. In Arizona, a miner’s inch<strong>of</strong> is equal to 1 /40 cubic foot <strong>of</strong> water per second, or 11.22 gallons per minute.“Full <strong>of</strong> Push and Enterprise”Worries about insufficient river flows did not prevent new groups fromforming irrigation companies. In the early months <strong>of</strong> 1887, W. H. St.John and three other men dug a new ditch on the north bank <strong>of</strong> the SaltRiver. Intending to irrigate forty sections <strong>of</strong> land, they appropriated5,000 miner’s inches <strong>of</strong> water into the St. John Canal from a canal headat 83 rd Avenue. In 1892, the small canal company sold the seven-milelong St. John Canal to the Orange Belt Land and Canal Company(Zarbin 1997:109). The St. John Canal extended northwest from theSalt River almost to the Agua Fria River and persisted on maps into the1930s (Heard 1915;<strong>Maricopa</strong> <strong>County</strong> 189-; U.S. Reclamation Service1914; Salt River Project 1934).Also completed prior to 1891 was the Farmers Canal between the St.John Canal and the Griffin Ditch (<strong>Maricopa</strong> <strong>County</strong> 189-; Schultz &Franklin 1891). Although one source suggests that the Farmers Canalmay have been constructed as early as 1868, it is likely that this canalthrough the study area flowed only intermittently in the 1870s and1880s. As was typical <strong>of</strong> simple diversion dams, the brush dam in theSalt River in the general area <strong>of</strong> today’s 27 th Avenue and Lower BuckeyeRoad washed out frequently. When investors in the newly formedFarmers Irrigation Company inspected the Farmers Canal in the summer<strong>of</strong> 1890, they described it as in poor repair, with less than 5,000 acres <strong>of</strong>farmland contracted to receive water [out <strong>of</strong> a possible 24,000 acres thatmight have been served by the length <strong>of</strong> the canal]. In October 1890,crews worked to re-dig a 12-mile segment <strong>of</strong> the canal, but therevitalization <strong>of</strong> the Farmers Canal system was short-lived. Perhaps dueto damage caused by wide-spread flooding in 1891, the FarmersIrrigation Company dissolved within the decade amid a flurry <strong>of</strong> legaldocuments as the board members <strong>of</strong> the company sued each other(Rogge and others 1991:170-172).By the early 1890s, more than one hundred miles <strong>of</strong> canals had beenconstructed across the valley to irrigate more than 100,000 acres <strong>of</strong>farmland. Optimism for the future <strong>of</strong> the desert settlement ran high.Promoters such as Theodore Schultz and William Franklin, self-styled“immigration solicitors,” touted the agricultural potential <strong>of</strong> the Valleywith promotional literature including maps, brochures, and even poetry.The following verses were inscribed on Schultz and Franklin’s 1891 map<strong>of</strong> the Salt River Valley,The branch here bends beneath the weight pear,And verdant olives flourish round the year;The balmy spirit <strong>of</strong> the western galeEternal breathes on fruits untaught to fail.The same mild season gives the blooms to blow,The buds to harden, and the fruits to grow(Schultz & Franklin 1891).In the same spirit <strong>of</strong> optimism, the publishers <strong>of</strong> the first city directorydescribed Phoenix as the most important commercial town in theTerritory, “thoroughly American, and its citizens are live and go-aheadpeople full <strong>of</strong> push and enterprise” (Bensel Directory Company 1892).Fields, Towns, and HomesDrought followed flood, and the drought years <strong>of</strong> the late 1890s againspurred discussions <strong>of</strong> a major storage dam on the Salt River. Tied withnational sentiment for reclamation, these discussions culminated in theformation <strong>of</strong> the Salt River Valley Waters Users Association in 1903, agroup that worked with the federal government under the 1902Newlands Act to begin construction <strong>of</strong> the Theodore Roosevelt Dam in1905. Completed in 1911, the masonry dam assured a water supply toDIBBLE & ASSOCIATES 50 DURANGO ADMPDATA COLLECTION REPORT
the Salt River valley and filled the several irrigation canal systems. Most<strong>of</strong> the farmers in the study area, and thus most <strong>of</strong> the land, joined the SaltRiver Valley Waters Users Association which in later years becameknown as the Salt River Project (Rogge and others 1995; Smith 1986;Zarbin 1986). In the first years <strong>of</strong> the new decade, alfalfa was thedominant crop in the area, used primarily to feed thousands <strong>of</strong> dairycattle.The hostilities <strong>of</strong> World War I cut <strong>of</strong>f Egyptian supplies <strong>of</strong> long-staplecotton from the American market, and defense contractors looked todomestic farms to provide cotton for tires and airplane fabric. The wartimedemand made long-staple cotton into a boom crop in the Salt RiverValley, and in 1916, cotton fields outnumbered the previously dominantalfalfa fields. By 1920, cotton plants filled three-fourths <strong>of</strong> the irrigatedfarm fields across the valley, a total <strong>of</strong> 190,000 acres (Luckingham1993:86).Predictably, the dependence on a single crop back-fired when cottonprices collapsed in 1920, and in 1921 local banks <strong>of</strong>fered low-interestloans to valley farmers planning to return their acreage to crops otherthan cotton. All over the valley, farmers returned almost 50,000 acres toalfalfa, used primarily as feed for dairy cattle. In addition, farmersplanted wheat, barley, sorghum and corn to supply local cattle feedlotsand poultry ranches, expanded citrus groves, and experimented witholive and date crops. Farmers also took advantage <strong>of</strong> new railroadconnections to ship more fragile crops such as melons, grapes, lettuce,and winter vegetables to national markets. Adjacent to the railroadsidings, industrial and warehouse facilities flourished (Kotlanger1993:92-96).By 1940, long and short staple cotton remained an important cash crop,occupying over 117,000 acres in <strong>Maricopa</strong> <strong>County</strong>, about one-third theacres under cultivation (Horton 1941:79). Alfalfa remained the secondmost important crop, occupying more than 100,000 acres. Otherimportant crops included lettuce, cantaloupe, and citrus, as well as dairyand beef cattle (Horton 1941:87-88).The combination <strong>of</strong> fertile, alluvial fields and the availability <strong>of</strong> riverwater delivered by canal systems encouraged homesteaders to settle thestudy area (General Land Office 1914a,1914b). A map <strong>of</strong> <strong>Maricopa</strong><strong>County</strong> compiled in the 1930s illustrates rural houses as hundreds <strong>of</strong> tinysquares scattered all across the study area. For the most part, thesehouses, presumably farmhouses and homestead houses, wereconcentrated along the major east-west roadways, and distributedequally along these roads throughout the project area. A rough estimate<strong>of</strong> the number <strong>of</strong> squares on the map indicates that a total <strong>of</strong>approximately 60 houses were built along Van Buren, and a similarnumber were built along Buckeye and Lower Buckeye roads. Theshorter, unpaved north-south roads along section lines, such as 115 th and91 st avenues, contained approximately 20 houses (<strong>Maricopa</strong> <strong>County</strong> 193-). In some locations across the study area, these houses built in the earlyyears <strong>of</strong> the century still stand. In other locations, only stands <strong>of</strong> Arizonacedars and piles <strong>of</strong> rubble indicate the location <strong>of</strong> a vanished farm home.Schools were located on the southwest corner <strong>of</strong> Van Buren and 67 thAvenue, on the southeast corner <strong>of</strong> Buckeye Road and 27 th Avenue, onthe west side <strong>of</strong> 51 st Avenue south <strong>of</strong> Buckeye Road, on the west side <strong>of</strong>75 th Avenue south <strong>of</strong> Lower Buckeye Road, on the west side <strong>of</strong> 91 stAvenue south <strong>of</strong> Lower Buckeye Road, and on the southwest corner <strong>of</strong>Buckeye and 115 th Avenue (Becker 1941; General Land Office 1914aand 1914b; Heard 1915; Salt River Project 1934).Several locales in the study area acquired name designations over theyears, most <strong>of</strong> them along the railroad line. Cashion, near 111 th Avenueand Buckeye Road, took the name <strong>of</strong> the Cashion family thathomesteaded four sections <strong>of</strong> land (General Land Office 1914a). TheCashion Post Office was established in 1911 and named after AngusCashion, “prominent farmer and stockman” (Barnes 1988:30). In 1941,Cashion was home to what was reputed to be one <strong>of</strong> the largest beetseed storage sheds in the world (Horton 1941:202).To the northwest <strong>of</strong> Cashion, the settlement <strong>of</strong> Tolleson grew up around91 st Avenue and Van Buren Road. The station on the Buckeye branch <strong>of</strong>the Arizona-Eastern Railroad was named for W. G. Tolleson (Barnes1988:446). Mr. Tolleson, founder <strong>of</strong> Tolleson Farms, bought 160 acres<strong>of</strong> land at the southwest intersection <strong>of</strong> Lateral 22 and the Yuma Roadin 1910.By 1941, Tolleson claimed to be the “largest cantaloupe producingcenter in the United States” with between 15-20 sheds to house thecantaloupe and lettuce harvests (Horton 1941:202). In addition, a largeice plant outside town produced the ice to cool the produce as it wasshipped to market. The influence <strong>of</strong> automobile travel through the areais evidenced in the eight cottage courts, four service stations, and twogarages. Tolleson also included seven grocery stores, a dry goods store,five restaurants, a theater, a lumberyard, a barber and beauty shop, twodrug stores, and a clinic. The varied ethnic make-up <strong>of</strong> the town is hintedat by one observer’s comments about the Japanese and Hindu farmers,and the “prevalence <strong>of</strong> the Mexican and Spanish population” causingDIBBLE & ASSOCIATES 51 DURANGO ADMPDATA COLLECTION REPORT
Catholicism to be the “dominant religion” (Horton 1941:202). (Horton1941:202-203). Just to the south <strong>of</strong> Tolleson were the railroad sidingsdesignated Cowden and Jean (<strong>Maricopa</strong> <strong>County</strong> 193-; <strong>Maricopa</strong> <strong>County</strong>Highway Commssion 1919).Further east along the rail line, the Fowler station and depot werepresumably named for Lincoln Fowler, a land owner in the area anddirector <strong>of</strong> a canal company. Mr. Fowler ran unsuccessfully for theTerritorial House <strong>of</strong> Representatives in 1883, including in his campaignthe suggestion that “the legislature petition Congress to financehydrographic surveys <strong>of</strong> all streams in Arizona to improve the system <strong>of</strong>irrigation and to identify suitable sites for building water storagereservoirs” (Zarbin 1997:101, 124). The Fowler community included aBaptist church on the southeast corner <strong>of</strong> Van Buren and 67 th Avenue,as well as two creameries on the north side <strong>of</strong> the Salt River Valley canalbetween 59 th and 67 th avenues (Heard 1915).To the east <strong>of</strong> Fowler, the small settlement <strong>of</strong> Campo appeared only ona 1916 map describing ranching activities in central Arizona (Holmquist1916). Curiously, Campo does not appear on a contemporary mapdetailing landowners and settlements (General Land Office 1914b).Unmentioned in any other sources, the site <strong>of</strong> Campo became the site <strong>of</strong>the World War II Alcoa plant.A quarter section <strong>of</strong> land listed on the 1914 General Land Office mapsas belonging to <strong>Maricopa</strong> <strong>County</strong> became the site <strong>of</strong> the <strong>County</strong> PoorFarm in the 1930s. A portion <strong>of</strong> the southwest quarter section <strong>of</strong> Section14, Township 1 North, Range 2 East is labeled “Poor Farm” on a 1934map and “<strong>County</strong> Farm” on a 1941 map (Becker Engineering Company1941; <strong>Maricopa</strong> <strong>County</strong> 1934). The map dates may indicate that thisenterprise was a product <strong>of</strong> the make-work legislation in the Depressionyears.Railways and HighwaysThe major east-west travel corridor from Phoenix to Yuma has passedthrough the study area since Territorial days. The same flat terrain thatencouraged farmers to settle here has also encouraged railroad engineersand highway engineers to use the area for transportation. Early trails andstagecoach lines across Arizona followed the Gila River east to the greatbend, and then took a chance on the forty miles <strong>of</strong> desert betweentoday’s towns <strong>of</strong> Gila Bend and Casa Grande before following the SantaCruz River south to Tucson . After people began settling in the valley inthe 1860s, east-west transportation routes swerved north to follow theGila River’s great bend into the Salt River Valley and the desertsettlements around PhoenixThe railroad line that extends from west to east across the study area hasbeen owned by a succession <strong>of</strong> companies since its construction about1910 (Walker and Bufkin 1989:46-47). Built as the Phoenix andBuckeye line, the small railroad known as the <strong>Maricopa</strong> and PhoenixRailroad Company joined the Arizona Eastern Railroad in 1911 (Irvin1987:256-257; U.S. Reclamation Service 1914). The Arizona EasternRailroad was envisioned by its investors to extend from Phoenix to themining towns in east-central Arizona and then south along the San Pedroto connect with the Southern Pacific line at Benson. By 1911, rails hadbeen laid only as far as Winkelman and Christmas, about half the distanceto Benson. In 1926, the Southern Pacific Railroad built a new main linefrom Yuma directly to Phoenix, incorporating the tracks <strong>of</strong> the oldPhoenix and Buckeye line (Salt River Project 1934; Walker and Bufkin1989:47).In 1919, the Arizona Eastern railroad siding in Tolleson had a capacity<strong>of</strong> 8 railroad cars. Just to the east, the siding at Jean could hold 13 cars,while the Fowler siding had a capacity <strong>of</strong> 30 cars. Larger than all <strong>of</strong> thesetaken together were the facilities at Cashion which could accommodate68 rail cars 5 (<strong>Maricopa</strong> <strong>County</strong> Highway Commission 1919).The very first book <strong>of</strong> Arizona road maps, published just as the ModelT was beginning to appear on American roads, illustrates the Phoenix toYuma route and indicated it as a “good road [with] some stretches <strong>of</strong>sand.” Although not labeled as such on the small-scale map in the 1913tour book, the dirt road from Phoenix to Yuma utilized Van Buren Roadwest 1.6 miles west from downtown Phoenix to approximately 107 thAvenue [the map illustrates an ostrich farm at the southeast corner <strong>of</strong>Van Buren and 107 th Avenue]. At that point, the route turned south forone mile, and at today’s Buckeye Road, the route turned west again. Onthe east side <strong>of</strong> the Agua Fria River, the tour book map notes a “slough”before the “ford” <strong>of</strong> the river (Arizona Good Roads Association1913:50).The first highway paving programs began across the United States in the1920s as federal highway money became available, and the importance<strong>of</strong> the Phoenix-Yuma road is underscored by the fact that it was amongthe first roads to be paved in Arizona. The Phoenix Chamber <strong>of</strong>Commerce touted the new <strong>Maricopa</strong> <strong>County</strong> highway program on a1922 map illustrating the few miles <strong>of</strong> paved roads in the valley. On thisearly road map, the “Yuma Road”(Van Buren) is shown as being pavedfrom Phoenix west to today’s 107 th Avenue, which is also shown aspaved between the Yuma Road south to Buckeye Road. Also on the5 The largest railroad sidings in the valley in 1919 were located to the west in Avondale where atotal <strong>of</strong> 106 rail cars could be parked (<strong>Maricopa</strong> <strong>County</strong> Highway Commission 1919).DIBBLE & ASSOCIATES 52 DURANGO ADMPDATA COLLECTION REPORT
1922 map, Buckeye Road is shown as paved west from Phoenix to thebanks <strong>of</strong> Agua Fria River. After crossing the river, the road is againshown as being paved all the way west to Buckeye (Phoenix Chamber<strong>of</strong> Commerce 1922).By 1926, more than $1 million <strong>of</strong> federal aid had been spent to constructthe Phoenix to Yuma highway (State Engineer 1926:29-30). TheArizona Highway Department contracted with an El Paso firm to buildthe highway bridge over the Agua Fria River in 1924. The concretegirder bridge measured 32 feet long (FraserDesign 1987:44).A few years later, highway engineers instituted the use <strong>of</strong> highwaynumbers to replace the myriad <strong>of</strong> highway names that had designated<strong>of</strong>ten over-lapping routes. In Arizona, the east-west route that had beencalled the Bankhead Highway, the Atlantic-Pacific Highway, the LeeHighway, the Old Spanish Trail, and the Borderland Route became “U.S.Highway 80” by 1926 (State Engineer 1926:22). The federally fundedhighway followed Buckeye Road, rather than Van Buren, on its Phoenixto Yuma route, and was paved from just west <strong>of</strong> Palo Verde intodowntown Phoenix and east to Mesa; the remainder <strong>of</strong> the highwayremained ungravelled, ungraded dirt (The CMC Company 1923).Defense Plants and New HousingIn addition to the several air fields built in the Phoenix area in the earlyyears <strong>of</strong> World War II, the businessmen <strong>of</strong> Phoenix worked with federal<strong>of</strong>ficials to secure defense plants for their area. Goodyear Aircraftannounced its plans to construct a plant at Litchfield Park west <strong>of</strong>Phoenix in July 1941, and opened the $500,000 airplane parts plant inNovember that same year. At its peak, the plant employed 7,500workers. The next year, the Aluminum Company <strong>of</strong> America (ALCOA)built a plant on a 300-acre site at 35 th Avenue and Van Buren Streetwhich employed 3,500 workers.The influx <strong>of</strong> new workers into the Phoenix area caused a housingshortage and strained the already inadequate public transportationsystem. To increase the number <strong>of</strong> homes available and to decrease thedependency on city buses, federal agencies built public housing projectsadjacent to the plants to house the defense workers, such as “AlzonaPark,” built across from the Alcoa plant (Luckingham 1989:141).A map <strong>of</strong> 1946 Phoenix subdivisions illustrates just two subdivisionswest <strong>of</strong> 35 th Avenue and south <strong>of</strong> Van Buren in that year, adjacent toeach other just south <strong>of</strong> the Alcoa Plant (Valley National Bank 1946).Alco Acres, platted in 1942, extended from the railroad tracks south toSherman Street, and from 37 th Avenue west to 39 th Avenue. The platmap does not indicate whether public or private monies financed thehousing in Alco Acres. Interestingly, the Alco Acres subdivision wasmade up <strong>of</strong> large lots measuring 150 feet across and more than 300 feetdeep, perhaps in an attempt to maintain the rural feel <strong>of</strong> the area or toencourage residents to plant Victory Gardens. The second subdivisionillustrated on the 1946 map, Homedale, extended from the railroadtracks on the north to Buckeye Road on the south (U.S. Highway 80),and from 39 th Avenue on the east to 41 st Avenue on the west. Platted in1945, the Homedale subdivision lots were much smaller than lots in theneighboring Alco Acres. 66 Although one source notes the creation <strong>of</strong> Alzona Park “across from Alcoa,” the name does notappear on the 1946 Phoenix subdivisions map. Two possibilities exist. Either the Alzona Park subdivision wasbuilt after 1946, after the influx <strong>of</strong> wartime defense workers, or the “Alco Acres” indicated on the 1946 mapis another name for Alzona Park (Luckingham 1989:141; Valley National Bank <strong>of</strong> Arizona 1946).Recommendations on Treatment <strong>of</strong> Historical Resources Within theStudy AreaRemnants <strong>of</strong> the area’s history continue to dot the landscape today.Roads follow the section lines laid out more than 130 years ago. In therural sections, tree-lined lateral canals trace the boundaries <strong>of</strong>agricultural fields just as they have for more than a hundred years, andremnants <strong>of</strong> the earliest Anglo-constructed canals may still be extant.Modest, sometimes dilapidated, farm houses hint at the hundreds <strong>of</strong>families who made their homes here in the first half <strong>of</strong> the twentiethcentury, while larger-scale agricultural facilities tell <strong>of</strong> the importance <strong>of</strong>agricultural production. Roadside businesses follow the route <strong>of</strong> U.S.Highway 80. The subdivisions platted in the 1940s demonstrate theattempts to house a huge influx <strong>of</strong> World War II defense plant workers.Two surveys to determine the presence <strong>of</strong> historical properties within thearea have been completed. The first survey, conducted in the mid-1970'sprior to the compilation <strong>of</strong> the Environmental Impact Statement for thesection <strong>of</strong> Interstate 10 known as the Papago Freeway, identified elevenhistoric properties within the ADMP project area. Of the eleven, theresearchers noted three (two homes and one barn) as having the potentialto be listed on the National register <strong>of</strong> Historic Places. Built in 1897, theIvy House at 75 th Avenue and McDowell served as home to the firstwoman in the Arizona Territorial Legislature; it has since beendemolished. The Evans Barn on 67 th Avenue between McDowell andVan Buren was determined to be eligible under criterion C as an earlymodel <strong>of</strong> barn construction in Phoenix, <strong>of</strong> which few examples remain.In 1977, the Brooks House, at 334B North 75 th Avenue, a Bungalowfarmhouse,was also determined to be eligible for the National Register<strong>of</strong> Historic Places.DIBBLE & ASSOCIATES 53 DURANGO ADMPDATA COLLECTION REPORT
The Historic Preservation Office <strong>of</strong> the City <strong>of</strong> Phoenix PlanningDepartment conducted a valley-wide survey <strong>of</strong> historic rural and estatearchitecture in 1991. The Woodward Architectural Group identified atotal <strong>of</strong> eight historic rural agricultural properties within the boundaries<strong>of</strong> the ADMP. Six <strong>of</strong> the eight were recommended as eligible (includingthe Brooks House but not the Evans Barn nor the Ivy House). Three <strong>of</strong>the siz were built prior to 1911 and three were built between 1911-1942,as listed below:Inventory No. Address Date703 2500 N. 83 rd Ave. Before 1911721 334 N. 75 th Ave. 1911-1942722 335 N. 75 th Ave. Before 1911723 7301 W. Van Buren St. 1911-1942724 6701 W. Van Buren St. 1911-1942726 6529 W. Van Buren St. Before 1911Due to the possibility <strong>of</strong> encountering historical properties throughoutthe study area, a survey is recommended to ascertain thepresence/absence <strong>of</strong> such properties on a site-specific basis. As a part <strong>of</strong>determining alternatives, specific historical properties should beidentified, and then evaluated as to their eligibility for the NationalRegister <strong>of</strong> Historic Places.DIBBLE & ASSOCIATES 54 DURANGO ADMPDATA COLLECTION REPORT
D. Social and Economic AssessmentThis section <strong>of</strong> the data collection report briefly describes minoritygroups and low-income populations within the project area. This reportwas completed with guidance provided by Executive Order 12898regarding Environmental Justice. The Environmental ProtectionAgency’s Office <strong>of</strong> Environmental Justice <strong>of</strong>fers the following definition:Methodology“The fair treatment and meaningful involvement <strong>of</strong> all peopleregardless <strong>of</strong> race, color, national origin, or income with respectto the development, implementation, and enforcement <strong>of</strong>environmental laws, regulations and policies. Fair treatmentmeans that no group <strong>of</strong> people, including racial, ethnic, orsocioeconomic group should bear a disproportionate share <strong>of</strong> thenegative environmental consequences resulting from industrial,municipal, and commercial operations or the execution <strong>of</strong>federal, state, local and tribal programs and policies.”The effort described in this section outlines available “Census BlockGroup” data so that these Environmental Justice goals can be met byidentifying the areas within the project area, where low income andethnic minority groups are present in significantly higher proportionsthan exhibited by the United States as a whole. Also, areas (blockgroups) that have a significant proportion <strong>of</strong> minors (17 years and under)and elderly (65 years or older) are identified. By identifying blockgroups (hereafter referred to as “significant block groups”) within theproject area which have low median household incomes and highpercentages <strong>of</strong> ethnic minorities, minors and elderly people, this studyserves as a planning tool for avoiding adverse impacts to these groups.In order to identify the sensitive block groups within the project area, aGeographic Information System (GIS) was used. Electronic spatial anddatabase files were obtained from the U.S. Census Bureau and theArizona Department <strong>of</strong> Economic Security, pertaining to the projectarea. “Tiger File” maps were obtained from the U.S. Census Bureau, inan electronic, CD ROM format. These map coverages wereincorporated into a GIS, and show the boundaries <strong>of</strong> the Census blockgroups as well as roads, streams and other geographic features. Also,U.S. Census Bureau - STF3A database files were obtained from theArizona Department <strong>of</strong> Economic Security. The STF3A files includethat data collected during the 1990 Census and provide a variety <strong>of</strong>socioeconomic data on each block group within the project area. TheTiger Maps were tied to the STF3A files within the GIS, to serve as atool for socioeconomic analysis.Significance CriteriaIn order to determine the significant block groups within the projectarea, or those meeting Environmental Justice criteria, a set <strong>of</strong>significance criteria were developed specifically for use during theADMP evaluation. The ADMP review committee may choose to changethese criteria to meet the needs <strong>of</strong> this project as the EnvironmentalJustice executive order does not outline specific criteria to be used forthis type <strong>of</strong> project. Therefore, in this study, for a block group to beconsidered a low income block group (or “significant” by definition inthis document), it must have a 1990 median household income <strong>of</strong>$15,000 (the <strong>of</strong>ficial 1990 poverty rate) or less. In order for a blockgroup to be considered a “significant” ethnic minority block group, itmust have proportions <strong>of</strong> ethnic minority groups that are at least 10%greater than that tabulated for the United States in the 1990 decennialcensus. Using this formula, the following are the specific ethnicminority thresholds used during this evaluation; 1) African American -22.1% or greater, 2) American Indian, Eskimo, Aleut - 10.8% or greater,3) Asian, Pacific Islander - 12.9% or greater, 4) Persons <strong>of</strong> HispanicOrigin - 19.0% or greater, and 5) Other race - 13.9% or greater. Finally,in determining block groups that are significant in terms <strong>of</strong> age,“significance” criteria for age cohorts <strong>of</strong> 17 years or younger and 65years or older were developed. A block group is considered to besignificant for age if the percentage <strong>of</strong> these age cohorts is at least 10%greater than that tabulated for the United States in the 1990 decennialcensus. The following are the specific age cohort thresholds; Ages 0 -5 = 18.9% or greater, Ages 5 - 17 = 26.7% or greater and Ages 65 + =22.6% or greater.In the first section <strong>of</strong> this analysis, entitled “Community Pr<strong>of</strong>iles”, thecommunities which make up the project area are described in terms <strong>of</strong>population growth, land area, median household income and ethnicdiversity. These socioeconomic attributes for these communities arecompared to those <strong>of</strong> the State <strong>of</strong> Arizona and for the United States.This section is intended as background material, and to establish a betterunderstanding <strong>of</strong> the socioeconomic context within which the projectarea. In the second section <strong>of</strong> this analysis, entitled “Low Income andEthnic Minority Populations”, significant Census block groups areidentified and discussed.Community Pr<strong>of</strong>ilesThe project area consists <strong>of</strong> portions <strong>of</strong> south-western Phoenix and thecities <strong>of</strong> Tolleson, Avondale and Goodyear, a small portion <strong>of</strong> thenorthern section <strong>of</strong> the Gila River Indian Community and someunincorporated areas <strong>of</strong> <strong>Maricopa</strong> county. Table V-1 summarizes thepopulation growth and land areas for these communities.DIBBLE & ASSOCIATES 55 DURANGO ADMPDATA COLLECTION REPORT
Table V-1. Project Area Population And Land Area<strong>Maricopa</strong> <strong>County</strong> Phoenix Tolleson Avondale Goodyear1999 population 2,913,475 1,240,775 4,685 32,270 17,0851990 population 2,122,101 983,403 4,434 16,169 6,258Population Growth37.3% 26.17% 5.7% 99.6% 173.0%Rate 1990 - 19991996 Land Area9,226.0 419.9 5.0 22.1 117.57(Sq. Mi.)Sources: 1999 population estimates and 1996 Land Area - <strong>Maricopa</strong> Association <strong>of</strong> Governments. 1990 population - U.S. Census Bureau.Table V-2. Median Household Income And Ethnic DiversityUnitedArizona <strong>Maricopa</strong> <strong>County</strong> Phoenix Tolleson Avondale GoodyearStatesMedian Household$30,056 $27,540 $30,797 $29,291 $25,496 $24,292 $32,708Income# and % White 199,686,07080.3%2,967,68281.0%1,801,57084.9%803,69181.7%1,72839.0%9,46858.6%4,47771.5%# and %Black29,986,06012.1%110,0623.0%74,2953.5%51,2375.2%40.1%7774.8%4527.2%# and %American Indian,Eskimo or Aleut1,959,2340.8%204,5895.6%38,3091.8%18,3371.9%220.5%2281.4%1632.6%# and %Asian or PacificIslander7,273,6622.9%54,1271.5%35,2081.7%# and % Persons <strong>of</strong>Hispanic Origin*22,354,0599.0%680,62818.6%340,11716.0%194,11819.7%3,39376.5%8,28751.3%4,70875.2%# and %Other Race9,804,8473.9%328,7688.9%172,7198.1%94,1489.6%2,68060.4%5,46033.8%1,08117.3%Source: US Census Bureau - STF3A files, 1990*Persons <strong>of</strong> Hispanic Origin accounts for Hispanic people <strong>of</strong> all races (e.g. White, Black, Asian, etc.). Therefore, this category represents a double count and is the reason that a summation <strong>of</strong> all the races is greater than 100% <strong>of</strong>the population.15,9901.6%00.0%2361.5%851.4%DIBBLE & ASSOCIATES 56 DURANGO ADMPDATA COLLECTION REPORT
According to the U.S. Census Bureau, <strong>Maricopa</strong> county had a medianhousehold income in 1990 that was greater than that <strong>of</strong> the United Statesand the State <strong>of</strong> Arizona (See Table V-2). Considering the communitiesincluded in this analysis, Tolleson and Avondale had median householdincome levels in 1990, that were significantly less than the United States,Arizona and <strong>Maricopa</strong> county. The city <strong>of</strong> Goodyear had a medianhousehold income in 1990 that was greater than that <strong>of</strong> the UnitedStates, Arizona and <strong>Maricopa</strong> county. Finally, the city <strong>of</strong> Phoenix hada median household income in 1990 that was very close to the averagefor the United States, Arizona and <strong>Maricopa</strong> county.In terms <strong>of</strong> ethnic diversity, <strong>Maricopa</strong> county was less diverse in 1990than both the United States and Arizona (see Table V-2). In 1990,<strong>Maricopa</strong> county had a greater percentage <strong>of</strong> Native Americans than theUnited States, but a smaller percentage than Arizona. Also, <strong>Maricopa</strong>county had a much greater percentage <strong>of</strong> people <strong>of</strong> Hispanic origin thanthe United States, but a slightly smaller percentage than that for Arizona.Similarly, <strong>Maricopa</strong> county had a greater percentage <strong>of</strong> people in the“other race” category than the United States, but a slightly smallerpercentage than for Arizona. In 1990, Phoenix was about average inethnic diversity relative to the United States, Arizona and <strong>Maricopa</strong>county. There was a greater percentage <strong>of</strong> African Americans than in<strong>Maricopa</strong> county, but a lesser percentage than in the United States as awhole. There was a greater percentage <strong>of</strong> American Indian, Eskimo,Aleut than for the United States, but a smaller percentage <strong>of</strong> this groupthan the state <strong>of</strong> Arizona as a whole. The cities <strong>of</strong> Tolleson, Avondaleand Goodyear are significantly more ethnically diverse (to varyingdegrees) than the United States, Arizona, <strong>Maricopa</strong> county or Phoenix.Tolleson is by far the most ethnically diverse, with white peoplerepresenting only 39.0%. <strong>of</strong> the population. The most significant ethnicgroup in Tolleson is persons <strong>of</strong> Hispanic origin and “other” race.Avondale is between Tolleson and Goodyear in terms <strong>of</strong> ethnic diversity,with white people representing 58.6% <strong>of</strong> the population. The mostsignificant ethnic minority groups are persons <strong>of</strong> Hispanic origin and“other” race. Goodyear, has a relatively high degree <strong>of</strong> ethnic diversity,but is less diverse than both Tolleson and Avondale. White peoplerepresent 71.5% <strong>of</strong> the population. Persons <strong>of</strong> Hispanic Origin are avery significant group in Goodyear.Low Income and Ethnic Minority PopulationsBlock groups within the project area are shown in Figure 18. Thisfigure provides the location and block group ID numbers for all <strong>of</strong> theblock groups. The first six digits <strong>of</strong> each ID number refers to the CensusTract number and the last digit <strong>of</strong> the ID refers to the block groupnumber.Significant Block Groups - Low Median Household IncomeThere were twelve (17.6% <strong>of</strong> all block groups) Census Block Groupswithin the project area that were found to be significant for low medianhousehold income (see Table V-3). Figure V-4 shows the geographicaldistribution <strong>of</strong> these block groups within the project area. Twelve <strong>of</strong> thesixty-eight block groups within the project area met the significancecriteria; having a 1990 median household income <strong>of</strong> $15,000 or less.These significant block groups are mostly located in the north-easterncorner <strong>of</strong> the project area, or south-western Phoenix, south <strong>of</strong> Interstate10 and adjacent to Interstate 17. The exceptions are Census Tract/BlockGroup ID number 0614001, which is located in Avondale and CensusTract/Block Group ID number 6232001, which is located along thesouth-central edge <strong>of</strong> the project area, within the Gila River IndianCommunity.Table V-3. Block Groups Significant For Low Median HouseholdIncomeBlock GroupID Number1990PopulationMedian HouseholdIncome0614001 1818 $8,5616232001 2806 $8,5721146002 429 $14,8611145002 1573 $14,0911145003 965 $10,0001128002 104 $6,5811128001 631 $11,7051144004 488 $12,3121144001 1189 $12,4281147003 2957 $13,3331147001 860 $12,3681147002 998 $4,999Source: U.S. Census Bureau - STF3A files, 1990Significant Block Groups - High Proportions <strong>of</strong> Ethnic MinoritiesThere were sixty-one (89.7% <strong>of</strong> all block groups) Census Block Groupswithin the project area that were found to be significant for highproportions <strong>of</strong> ethnic minorities (see Table V-4). These block groupshad ethnic minority populations that were at least 10% greater than thepercentages tabulated for the Nation in 1990 in the decennial Census (see“significance criteria” section). Figure V-4 shows the geographicaldistribution <strong>of</strong> these block groups within the project area. About half <strong>of</strong>the block groups that do not have high proportions <strong>of</strong> ethnic minoritiesare found along the western edge <strong>of</strong> the project area, or north-centralGoodyear. The significant block groups are scattered throughout theproject area. The most significant ethnic minority groups are “other”(with 80.8% <strong>of</strong> all block groups) and Persons <strong>of</strong> Hispanic Origin (with85.3% <strong>of</strong> all block groups). High proportions <strong>of</strong> American Indian,Eskimo, Aleut are found only within the Gila River Indian Community(or Census Tract/Block Group ID number 6232001) on the south-centraledge <strong>of</strong> the project area. There were no block groups within the projectarea with significant populations <strong>of</strong> African Americans or Asian, PacificIslanders.DIBBLE & ASSOCIATES 57 DURANGO ADMPDATA COLLECTION REPORT
R1W R1E R2ET1N061003306100321125062112505111250631126004112600511270051129001061004106100421125052112600706100341126001 1127001082100111270041125064112900311250651125053112600611280021126002 112700611280011125054112600311270021127003112900408200621144004114300106120011145002114600111450010613001 0612003114400108210021144003114300406120041146002 1145004 1145003114400206140031147002R1W R1E R2E061004306140020614001 0822022 0822021112506611470031148001114800311250671147001082201108220120610054115500111570021155003115600111550021157003T1N1125067116601311660217233001 116601662320011166015 1166014116601111660221166021R1W R1E R2EProject BoundaryNBlock Group Numbers0 3 6T1NMilesUTM Zone 12 NAD27MinorityPopulationHispanic Origin: 19.0% or greaterProject BoundaryPROJECT LOCATIONIncomeMedian Household Income < $15,000NArizonaAgeAges 0-5: 18.9% or greater; orAges 5-17: 26.7% or greater; orAges 65+: 22.6% or greaterSource: U.S. Dept. <strong>of</strong> Commerce, 1990 CensusSignificant Block Groups0 3 6MilesUTM Zone 12 NAD27T1N-R1WT1N-R1ET1N-R2EGila and Salt River Meridian<strong>Maricopa</strong><strong>County</strong>FIGURE V-4PROJECT TITLE:DURANGO AREA DRAINAGE MASTER PLANPROJECT NO. FCD 99-41CONSULTANT:EXHIBIT TITLE:BLOCK GROUP NUMBERS/SIGNIFICANT BLOCK GROUPS
Table V-4. Block Groups With Significant* Percentage <strong>of</strong> Ethnic MinoritiesBlock Group ID # White % White # Black % Black # N.A.** % N.A. # Asian % Asian # Other % Other # Hisp*** % Hisp.0610043 295 72% 0 0% 0 0% 42 10% 75 18% 89 22%0610034 725 79% 34 4% 23 3% 30 3% 102 11% 183 20%0613001 1511 71% 51 2% 56 3% 13 1% 492 23% 669 32%0612004 684 75% 26 3% 0 0% 29 3% 174 19% 279 31%0612003 1606 54% 288 10% 85 3% 60 2% 949 32% 1354 45%0614003 571 62% 0 0% 39 4% 0 0% 309 34% 726 79%0614002 1580 65% 231 9% 55 2% 5 0% 569 23% 941 39%0614001 661 36% 139 8% 31 2% 0% 987 54% 1382 76%0612001 1103 63% 14 1% 0 0% 0 0% 622 36% 931 54%0820062 1710 77% 195 9% 25 1% 85 4% 216 10% 457 20%0822022 576 41% 11 1% 0 0% 0 0% 822 58% 1030 73%0822021 610 41% 0 0% 0 0% 7 0% 878 59% 1369 92%0822011 1627 60% 97 4% 0 0% 0 0% 1001 37% 1500 55%0821001 1171 39% 4 0% 22 1% 0 0% 1828 60% 2292 76%0821002 503 37% 0 0% 0 0% 0 0% 852 63% 1044 77%0822012 627 83% 0 0% 11 1% 0 0% 116 15% 125 17%6232001 89 3% 13 0% 2594 92% 13 0% 97 3% 327 12%1125062 641 74% 72 8% 26 3% 0 0% 132 15% 187 21%1125066 1134 72% 40 3% 26 2% 37 2% 347 22% 525 33%1125065 1180 74% 127 8% 8 0% 0 0% 289 18% 293 18%1125051 940 68% 134 10% 7 1% 43 3% 261 19% 317 23%1125052 970 80% 70 6% 0 0% 9 1% 170 14% 358 29%1125053 546 59% 89 10% 8 1% 0% 349 38% 464 50%1125054 711 77% 4 0% 47 5% 0 0% 158 17% 300 33%1125063 1012 55% 290 16% 60 3% 10 1% 477 26% 580 31%1125067 315 50% 0 0% 22 4% 48 8% 241 38% 241 38%1166015 774 82% 0 0% 17 2% 0 0% 153 16% 210 22%1126004 1045 70% 134 9% 28 2% 38 3% 252 17% 707 47%1126006 562 72% 15 2% 66 8% 0 0% 138 18% 176 23%1126003 488 47% 141 14% 0 0% 0 0% 407 39% 678 65%1146001 569 77% 0 0% 0 0% 19 3% 153 21% 495 67%1146002 366 85% 0 0% 0 0% 0 0% 63 15% 329 77%1126005 691 75% 44 5% 0 0% 24 3% 164 18% 512 55%1126001 273 24% 0 0% 51 5% 0 0% 801 71% 991 88%1126002 1239 90% 0 0% 11 1% 0 0% 131 9% 1117 81%1127005 569 81% 0 0% 10 1% 0 0% 126 18% 556 79%1127004 719 75% 0 0% 70 7% 9 1% 165 17% 696 72%1127003 721 64% 89 8% 26 2% 0 0% 289 26% 886 79%1145002 918 58% 0 0% 40 3% 0 0% 615 39% 1259 80%1145004 494 51% 34 4% 41 4% 0 0% 402 41% 661 68%1127001 634 61% 27 3% 0 0% 11 1% 359 35% 787 76%1127006 797 65% 67 5% 3 0% 0 0% 366 30% 875 71%1127002 855 75% 11 1% 13 1% 0 0% 267 23% 933 81%1145001 412 30% 153 11% 6 0% 0 0% 822 59% 1019 73%Source: U.S. Census Bureau - 1990 Census - STF3A files*The following is the criteria for a block group to be considered significant for ethnic minorities: 1) African American - 22.1% or greater, 2) American Indian, Eskimo, Aleut - 10.8% or greater, 3) Asian, Pacific Islander - 12.9% or greater,4) Persons <strong>of</strong> Hispanic Origin - 19.0% or greater, and 5) Other race - 13.9% or greater.**N.A. = Native American - Includes American Indian, Eskimo or Aleut***Hisp. = Persons <strong>of</strong> Hispanic Origin - This accounts for Hispanic people <strong>of</strong> all races (e.g. White, Black, Asian, etc.). Therefore, this category represents a double count and is the reason that a summation <strong>of</strong> all the races is greater than 100% <strong>of</strong> the population.DIBBLE & ASSOCIATES 59 DURANGO ADMPDATA COLLECTION REPORT
Significant Block Groups - High Proportions <strong>of</strong> Minors and ElderlyThere were twenty-seven (39.7% <strong>of</strong> all block groups) Census BlockGroups within the project area that were found to be significant for highproportions <strong>of</strong> minors (ages 17 and under) and elderly (ages 65 andover) people (see Table V-5). These block groups had minor and elderlypopulations that were at least 10% greater than the percentagestabulated for the Nation in 1990 in the decennial Census (see significancecriteria above). Figure V-4 shows the geographical distribution <strong>of</strong> theseblock groups within the project area. Of the block groups that werefound to be significant for age, only two <strong>of</strong> the block groups weresignificant for the ages 0-5 cohort; Census Tract/Block Group IDnumbers 1127005 and 1147002. Of the significant block groups (forage), all but one <strong>of</strong> the block groups was significant for the age 5 - 17cohort. Only one block group was found to be significant for elderlypopulation, which is Census Tract/Block Group ID number 1126007.Table V-5. Significant Block Groups, Significant Proportion <strong>of</strong> Minors And Elderly*Block Population # Age % Age # Age % Age # Age % AgeGroup ID 1990 0-5 0-5 5-17 5-17 65+ 65+0612004 913 76 8% 282 31% 117 13%0614003 919 76 8% 295 32% 29 3%0822022 1409 113 8% 512 36% 92 7%0822011 2725 234 9% 771 28% 139 5%0821001 3025 298 10% 819 27% 175 6%6232001 2806 317 11% 827 29% 251 9%1125053 922 98 11% 364 39% 137 15%1125054 920 128 14% 267 29% 33 4%1126007 910 65 7% 119 13% 214 24%1146002 1036 137 13% 337 33% 53 5%1146001 741 105 14% 219 30% 65 9%1126003 429 24 6% 162 38% 25 6%1126001 1125 128 11% 373 33% 79 7%1127005 705 136 19% 178 25% 13 2%1127003 1125 156 14% 390 35% 51 5%1145002 1573 221 14% 443 28% 83 5%1145004 971 129 13% 299 31% 31 3%1127001 1031 75 7% 277 27% 143 14%1145003 965 163 17% 290 30% 43 4%1128001 631 91 14% 235 37% 32 5%1144003 1214 123 10% 329 27% 97 8%1144002 954 122 13% 258 27% 73 8%1147002 998 222 22% 366 37% 33 3%1155001 1015 98 10% 306 30% 46 5%1155002 2152 280 13% 647 30% 125 6%1166014 1180 143 12% 374 32% 30 3%1156001 2182 264 12% 640 29% 71 3%Source: U.S. Census Bureau, 1990 Census, STF3A files.*The following are the specific age cohort thresholds; Ages 0 - 5 = 18.9% or greater, Ages 5 - 17 = 26.7% or greater and Ages 65 + =22.6% or greater.DIBBLE & ASSOCIATES 60 DURANGO ADMPDATA COLLECTION REPORT
E. Hazardous Waste InventoryThe effort described in this section <strong>of</strong> the data collection report brieflydescribes currently available environmental records, with regards toenvironmental and toxic waste categories, within the project area. Thissection <strong>of</strong> the report was completed by Environmental <strong>Data</strong> Resources,Inc. (EDR), a vendor specializing in the maintenance <strong>of</strong> a variety <strong>of</strong>databases designed specifically for inventorying hazardous and toxicwaste sites. The sole purpose <strong>of</strong> this summary <strong>of</strong> data is to provide aplanning tool for use during the Durango ADMP alternative analysisprocess.MethodologyA search <strong>of</strong> available environmental records was conducted by EDR on12-28-99. The area <strong>of</strong> the subject property for which the search wascompleted was described to EDR as the Durango Area Drainage MasterPlan (ADMP) study area, Phoenix, Arizona. The environmental recordsearch conducted by EDR consisted <strong>of</strong> searching 24 electronicenvironmental databases, which they regularly update. All <strong>of</strong> thesedatabases and the search results for the project area are discussed below.Summaries <strong>of</strong> the results <strong>of</strong> the database search are also presented inTable V-6.This database search documented 405 different hazardous waste siteswithin the Durango ADMP area. Many <strong>of</strong> these hazardous waste sitesappeared in several databases and the same address <strong>of</strong>ten had more thanone hazardous waste “microsite” present. This was particularly true forthose businesses and facilities that have multiple underground and/orabove ground storage tanks.Every hazardous waste source, its address, and all other specificinformation provided by EDR are available in an electronic format. Acondensed version <strong>of</strong> this database is available both in the Appendixand in the electronic format. An index to the codes used in thesehazardous materials inventory tables is available both in the Appendixand in the electronic format. Since there were over 1,000 differenthazardous waste sources identified within the Durango ADMP area, theyare not listed individually in this summary. However, maps <strong>of</strong> theDurango ADMP area that do identify every hazardous waste site in theproject area are presented in this report (Figures V-5 and V-6).The maps <strong>of</strong> the Durango ADMP area were reviewed in an attempt tocreate more “user friendly” maps with less clutter <strong>of</strong> hazardous wastesites. However, even after removing 13 <strong>of</strong> the less serious types <strong>of</strong> sites,the number <strong>of</strong> sites on the modified maps was only 25 fewer than on theoriginal maps. Therefore, the attempt to create less cluttered maps wassubsequently abandoned. The site listings that were eliminated duringthe attempt to create these from the modified maps included AST, AIRS,HMIRS, CERCLIS-NFRAP, RCRIS-SQG, MINES, FINDS,AZ_SPILL, RCRIS-LQG, UST, WWFAC, TSCA, and DRY WELL.The following are brief descriptions <strong>of</strong> each <strong>of</strong> the database listingsidentified in the EDR review:WQARF: Water Quality Assurance Revolving Fund Sites. Source:Arizona Department <strong>of</strong> Environmental Quality. These are sites whichmay have an actual or potential impact on the waters <strong>of</strong> the state, causedby hazardous substances. The state <strong>of</strong> Arizona has established aprogram under A.R.S. 49-22 to remedy these sites . In the WQARFprogram, the state takes actions to identify the extent and impact <strong>of</strong> thecontamination and to identify the parties responsible for remediation <strong>of</strong>the site. The WQARF program provides matching funds to politicalsubdivisions and other state agencies for clean-up activities. A review<strong>of</strong> the AZ WQARF list, as provided by EDR, and dated 12-28-99 hasrevealed that there is 1 AZ WQARF site within the Durango ADMParea. This site is referred to as the West Van Buren WQARF site.AIRS: Arizona Airs <strong>Data</strong>base. Source: Arizona Department <strong>of</strong>Environmental Quality. This database contains air pollution pointsources in Arizona that are monitored by the U. S. EnvironmentalProtection Agency and/or state and local air regulatory agencies. Areview <strong>of</strong> the AZ AIRS list, as provided by EDR, and dated 12-28-99has revealed that there are 4 AZ AIRS sites within the Durango ADMParea.AZ AQUIFER: Arizona Aquifers <strong>Data</strong>base. Source: ArizonaDepartment <strong>of</strong> Environmental Quality. This database contains wastewater treatment facilities in Arizona that have Aquifer ProtectionPermits. A review <strong>of</strong> the AZ AQUIFER list, as provided by EDR, anddated 12-28-99 has revealed that there are 4 AZ AQUIFER sites withinthe Durango ADMP area.CORRACTS: Corrective Action <strong>Report</strong> <strong>Data</strong>base. Source: U.S.Environmental Protection Agency. This database identifies hazardouswaste handlers with RCRA corrective action activity. A review <strong>of</strong> theCORRACTS list, as provided by EDR, and dated 12-28-99 has revealedthat there are 3 CORRACTS sites within the Durango ADMP area.PADS: PCB Activity <strong>Data</strong>base System. Source: U.S. EnvironmentalProtection Agency. PADS identifies generators, transporters,DIBBLE & ASSOCIATES 61 DURANGO ADMPDATA COLLECTION REPORT
commercial storers and/or brokers and disposers <strong>of</strong> PCB’s who arerequired to notify the EPA <strong>of</strong> such activities. A review <strong>of</strong> the PADS list,as provided by EDR, and dated 12-28-99 has revealed that there are 3PADS sites within the Durango ADMP area.AST: List <strong>of</strong> Aboveground Storage Tanks. This database contains all<strong>of</strong> the aboveground storage tanks in Arizona. A review <strong>of</strong> the AST list,as provided by EDR, and dated 12-28-99 has revealed that there are 10sites within the Durango ADMP area.CERCLIS: Comprehensive Environmental Response, Compensation,& Liability Information System. Source: U.S. Environmental ProtectionAgency. CERCLIS contains data on potentially hazardous waste sitesthat have been reported to the U.S. EPA by states, municipalities, privatecompanies, and private persons, pursuant to Section 103 <strong>of</strong> theComprehensive Environmental Response, Compensation, and LiabilityAct (CERCLA). CERCLIS contains sites which are either proposed tooccur or actually do occur on the National Priorities List (NPL) and siteswhich are in the screening and assessment phase for possible inclusionon the NPL. A review <strong>of</strong> the CERCLIS list, as provided by EDR, anddated 12-28-99 has revealed that there is 1 CERCLIS site within theDurango ADMP area. This is Reynolds Metal Company, located at3501 W. Van Buren.CERCLIS - NFRAP: No Further Remedial Action Planned -Comprehensive Environmental Response, Compensation, and LiabilitySystem. Source: U.S. Environmental Protection Agency. These areformer CERCLIS sites. As <strong>of</strong> February 1995, CERCLIS sitesdesignated “No Further Remedial Action Planned” (NFRAP) have beenremoved from CERCLIS. NFRAP sites may be sites where, followingan initial investigation, no contamination was found, contamination wasremoved quickly without need for the site to be placed on the NPL, orthe contamination was not serious enough to require Federal Superfundaction or NPL consideration. The EPA has removed approximately25,000 NFRAP sites to lift the unintended barriers to the redevelopment<strong>of</strong> these properties and has archived them as historical records so theEPA does not needlessly repeat the investigations in the future. Areview <strong>of</strong> the CERCLIS - NFRAP list, as provided by EDR, and dated12-28-99 has revealed that there are 24 CERCLIS - NFRAP sites withinthe Durango ADMP area.HMIRS: Hazardous Materials Information <strong>Report</strong>ing System. Source:U.S. Department <strong>of</strong> Transportation. HMIRS contains hazardousmaterial spill incidents reported to the DOT. A review <strong>of</strong> the HMIRSlist, as provided by EDR, and dated 12-28-99 has revealed that there are198 HMIRS sites within the Durango ADMP area.ERNS: Emergency Response Notification System. Source: U.S.Environmental Protection Agency/NTIS. ERNS records and storesinformation on reported releases <strong>of</strong> oil and hazardous substances. Areview <strong>of</strong> the ERNS list, as provided by EDR, and dated 12-28-99 hasrevealed that there are 56 ERNS sites within the Durango ADMP area.RCRIS-SQG: Resource Conservation and Recovery InformationSystem. Source: U.S. Environmental Protection Agency/NTIS. RCRIScontains information on hazardous waste handlers regulated by theEnvironmental Protection Agency (EPA) under the ResourceConservation and Recovery Act. It tracks events and activities relatedto facilities which generate, transport, and treat, store, or dispose <strong>of</strong>hazardous waste. All hazardous waste handlers are required to notifyEPA <strong>of</strong> their existence by submitting the Federal Notification <strong>of</strong>Regulated Activity Form (EPA Form 8700-12) or a State equivalentform. Treatment, storage, and disposal facilities are further required tosubmit Part A (EPA Form 8700-23) and Part B <strong>of</strong> their HazardousWaste Permit Application. A review <strong>of</strong> the RCRIS-SQG list, asprovided by EDR, and dated 12-28-99 has revealed that there are 156RCRIS-SQG sites within the Durango ADMP area.HWS: ZipAcids List. Source: Arizona Department <strong>of</strong> EnvironmentalQuality. This database contains locations subject to investigationsconcerning possible contamination <strong>of</strong> soil, surface water, orgroundwater. Inclusion <strong>of</strong> any facility or site on this list does not meanthat the location is contaminated, is causing contamination, or is inviolation <strong>of</strong> State or Federal statutes or regulations. A review <strong>of</strong> theHWS list, as provided by EDR, and dated 12-28-99 has revealed thatthere are 85 HWS sites within the Durango ADMP area.MINES: Mines Master Index File. This database contains locations <strong>of</strong>mines, gravel pits, etc.A review <strong>of</strong> the MINES list, as provided by EDR, and dated 12-28-99has revealed that there are 3 MINES sites within the Durango ADMParea.FINDS: Facility Index System/Facility Indentification InitiativeProgram Summary <strong>Report</strong>. Source: U.S. Environmental ProtectionAgency/NTIS. FINDS contains both facility information and “pointers”to other sources that contain more detail. These include RCRIS, PCS,AIRS, FATES/SSTS, FATES/FTTS, CERCLIS, DOCKET, FURS(Federal Underground Injection <strong>Control</strong>), FRDS, SIA (SurfaceImpoundments), CICIS (TSCA Chemicals in Commerce InformationDIBBLE & ASSOCIATES 62 DURANGO ADMPDATA COLLECTION REPORT
System), PADS, RCRA-J (medical waste transporters/disposers), TRIS,& TSCA. A review <strong>of</strong> the FINDS list, as provided by EDR, and dated12-28-99 has revealed that there are 190 FINDS sites within theDurango ADMP area.LUST: Leaking Tank Listing. Source: Arizona Department <strong>of</strong>Environmental Quality. Leaking Underground Storage Tank Incident<strong>Report</strong>s. LUST records contain an inventory <strong>of</strong> reported leakingunderground storage tank incidents. Not all states maintain theserecords, and the information stored varies by state. A review <strong>of</strong> theLUST list, as provided by EDR, and dated 12-28-99 has revealed thatthere are 136 LUST sites within the Durango ADMP area.DRYCLEANERS: Drycleaning Facilities. This database containslocations for drycleaning facilities. A review <strong>of</strong> the DRYCLEANERSlist, as provided by EDR, and dated 12-28-99 has revealed that there are15 DRYCLEANERS sites within the Durango ADMP area.LF: Directory <strong>of</strong> Solid Waste Facilities. Source: Arizona Department<strong>of</strong> Environmental Quality. Solid Waste Facilities/Landfill Sites.SWF/LF type records typically contain an inventory <strong>of</strong> solid wastedisposal facilities or landfills in a particular state. Depending on thestate, these may be active or facilities or open dumps that failed to meetRCRA Subtitle D Section 4004 criteria for solid waste landfills ordisposal sites. A review <strong>of</strong> the LF list, as provided by EDR, and dated12-28-99 has revealed that there are 2 LF sites within the DurangoADMP area. These are the Riverside Elementary <strong>District</strong> landfill locatedat 1414 S. 51 st Avenue and the Glenn Weinberger Rainbow Valleylandfill located 3 blocks south <strong>of</strong> Lower Buckeye Road on 39 th Avenue.AZ_SPILL: Hazardous Material Logbook. Source: ArizonaDepartment <strong>of</strong> Environmental Quality (ADEQ). ADEQ EmergencyResponse Unit. The ADEQ Emergency Response Unit documentschemical spills and incidents which are referred to the Unit. The logbookfor 1984-1986 consists <strong>of</strong> handwritten entries <strong>of</strong> the date, incidentnumber, and name <strong>of</strong> facility if known. Current logbooks arecomputerized and can be sorted by date, incident number, name, city,county, chemical, and quantity. A review <strong>of</strong> the AZ_SPILL list, asprovided by EDR, and dated 12-28-99 has revealed that there are 125AZ_SPILL sites within the Durango ADMP area.RCRIS-LQG: Resource Conservation and Recovery InformationSystem. Source: U.S. Environmental Protection Agency/NTIS. RCRIScontains information on hazardous waste handlers regulated by theEnvironmental Protection Agency (EPA) under the ResourceConservation and Recovery Act (RCRA). It tracks events and activitiesrelated to facilities which generate, transport, and treat, store or dispose<strong>of</strong> hazardous waste. All hazardous waste handlers are required to notifyEPA <strong>of</strong> their existence by submitting the Federal Notification <strong>of</strong>Regulated Activity Form (EPA Form 8700-12) or a State equivalentform. Treatment, storage, and disposal facilities are further required tosubmit Part A (EPA Form 8700-23) and Part B <strong>of</strong> their HazardousWaste Permit Application. A review <strong>of</strong> the RCRIS-LQG list, asprovided by EDR, and dated 12-28-99 has revealed that there are 28RCRIS-LQG sites within the Durango ADMP area.TRIS: Toxic Chemical Release Inventory System. Source: U.S.Environmental Protection Agency/NTIS. TRIS identifies facilities whichrelease toxic chemicals to the air, water, and land in reportable quantitiesunder SARA title III section 303. A review <strong>of</strong> the TRIS list, as providedby EDR, and dated 12-28-99 has revealed that there are 23 TRIS siteswithin the Durango ADMP area.UST: Underground Storage Tank Listing. Source: ArizonaDepartment <strong>of</strong> Environmental Quality. A review <strong>of</strong> the UST list, asprovided by EDR, and dated 12-28-99 has revealed that there are 226UST sites within the Durango ADMP area.WWFAC: Waste Water Treatment Facilities. Source: ArizonaDepartment <strong>of</strong> Environmental Quality. A review <strong>of</strong> the WWFAC list, asprovided by EDR, and dated 12-28-99 has revealed that there are 31WWFAC sites within the Durango ADMP area.TSCA: Toxic Substances <strong>Control</strong> Act. Source: U.S. EnvironmentalProtection Agency. TSCA identifies manufacturers and importers <strong>of</strong>chemical substances included on the TSCA Chemical SubstanceInventory List. It includes data on the production volume <strong>of</strong> thesesubstances by plant site. A review <strong>of</strong> the TSCA list, as provided byEDR, and dated 12-28-99 has revealed that there are 4 TSCA siteswithin the Durango ADMP area.DRY WELL: Arizona Dry Wells List. Source: Arizona Department <strong>of</strong>Environmental Quality. Constructed solely for the disposal <strong>of</strong> stormwater, more than 3,400 dry wells have been registered with the stateunder A.R.S 49-331 through 336. A review <strong>of</strong> the DRY WELL list, asprovided by EDR, and dated 12-28-99 has revealed that there are 146DRY WELL sites within the Durango ADMP area.DIBBLE & ASSOCIATES 63 DURANGO ADMPDATA COLLECTION REPORT
Table V-6. Summary Results Of Hazardous Materials <strong>Data</strong>base Search<strong>Data</strong>base Full Name TotalNumberWQARF Water Quality Assurance Revolving Fund Sites 1AIRS Arizona Airs <strong>Data</strong>base 4AZ AQUIFER Waste Water Treatment Facilities 4CORRACTS Corrective Action <strong>Report</strong> 3PADS PCB Activity <strong>Data</strong>base System 3AST List <strong>of</strong> Aboveground Storage Tanks 10CERCLIS Comprehensive Environmental Response, Compensation, and Liability Info. System 1CERCLIS-NFRAP CERCLIS - No Further Remedial Action Planned 24HMIRS Hazardous Materials Info. <strong>Report</strong>ing System 198ERNS Emergency Response Notification System 56RCRIS-SQG Resource Conservation and Recovery Information System 156HWS Zipacids 85MINES Mines Master Index File 3FINDSFacility Index System/FacilityIdentification Initiative Program Summary <strong>Report</strong>190LUST Leaking Tank Listing 136DRYCLEANERS Drycleaning Facilities 15LF Directory <strong>of</strong> Solid Waste Facilities 2AZ_SPILL Hazardous Material Logbook 125RCRIS-LQG Resource Conservation and Recovery Info. System 28TRIS Toxic Chemical Release Inventory System 23UST Underground Storage Tank Listing 226WWFAC Waste Water Treatment Facilities 31TSCA Toxic Substances <strong>Control</strong> Act 4DRY WELL Drywell Registration 146DIBBLE & ASSOCIATES 64 DURANGO ADMPDATA COLLECTION REPORT
#####R1W R1E R1E R2E0302010605##04#### # # # ## # ## ### #03 020106#05# # 04#03# # # #02###### # ### ##01101522Agua Fria RiverVan Buren##136137#104 #127#125#11120708308Buckeye304 # #306#311 305# ###310307322#141318 349#17356#381#380#Lower Buckeye378#391#23241920El Mirage149115th108th99th####### ## # ### ## # # # # # # # # # ## # # ### # # ###### # # # ## # ### ###### # # ### ## ### # ### ## ### ### # #### ## ### ## # ######## ## #### ### ### # # ## ### ### ### ## ### ## ### # ## # ## # # ######## # ## ## ## ## # # # ## # # # # ## # #### # ### #####11##### # ## # # ## 0910120708091011# # #### #12##### # # # ### # ## # ## ## #### # ### # ### #### ### # # # ##### # ### # # ### ## # ## ## # # ## # # # # # ### ## # # ## ######## ## # ### #### # # ## ##### ## ## #####162191st##152283rd14#2375th13#### #### #####2467th#181959th17# # ##2051st####1643rd#####15## # # # ### # ##35th##### # ##21 2223241427th13#393Broadway392#396###27Dysart26 25302928397#272625 3029282726253435405#36400##403#31398 #399#402#401#404323334#Salt River3536 31323334Southern3536For Detail <strong>of</strong> Unlabeled Sites See Sheet 2PROJECT LOCATIONArizona#369KEYHazardous Material Site21Section NumberNT1N-R1WT1N-R1ET1N-R2EGila and Salt River Meridian<strong>Maricopa</strong><strong>County</strong>Project BoundaryArea <strong>of</strong> Detail inSheet 20 1000 2000 3000 4000 5000 FeetArizona State Plane Central NAD83FIGURE V-5PROJECT TITLE:DURANGO AREA DRAINAGE MASTER PLANPROJECT NO. FCD 99-41CONSULTANT:EXHIBIT TITLE:HAZARDOUS MATERIAL SITES(Sheet 1 <strong>of</strong> 2)
R1ER2E99th## 2### 74#5 3#610 ## 11 8### # # ##917 #1614 15 13 12#18### # ### # # ##0106#0403 0228 19 20 272622 25 2305 04030224212930#333431### #3532#37 #36#38# ###49#46 45# # # 484742## 43# 44###535250 51#100 96 56#59####62## 77 55#81# # 68 88 ##89 9497 90 99 93 92 98## # # # ## # # #87# #86# 95 85 66# ####84#75 # # 83 ###82 80#79 57# ##7867# #76#74#737172 69#### ##65 64 63## # ###61 60 58## # 70#123 122 120 119 117## ## # # ### # ####113106##101 108 91 102# ## 107112####121 111 103######### 105109 114 115110118 116135126## ### # #### ## #124130 131 132 129 133 128134#### 139 140143 141### # # # # 138144147 146#145154148##153142152150# ##167160# # # ###166 165# # #163 158 157155 151# 156### #####161 159162##172 # ## 176 171164## ###### 177 168# #175169 173##### ###174186 184 ## ## 181 182 170178 179### #194185180 183# 188 # # ## # #189 190 187193#192 191### ## # #########11### 12 # 07# #### #08## ###09 10## ## 0910211 205 200198 199204196 197210215195 206 207 209221217 216212 214213 1112#220219 218224###222208### 223228229# # # 227 #232 241## #230 # # # ## # ###231# #233 234 235 236 237 238242239 240243244##251246 ## ###245250249##248 247 # #253 254##255#252#225 226300##376###1415162191st25838939022#83rd201 202 203256# 259257#270#268## ##266 265 261# # #262260# ##273 ## 274# # 276# 282# ## 288 297271 267## # # # ## # # # # 269 272## # # # #264290 286 280 279283 287 281### #263# #284##289275# # 294 295# # ##293#298 285 292299#277278 291 296309#302301# ##303312## 314313#317315 316319318359#2375th131867th2419### ##323# 324321# #320#331 328 ## #329# 330##333# ##334325 327##332#337#336#326 335#17338# # # # ##345343## # 339340341342347344# 348 346### 350352 351## 353# 355## 354# 357358#360361 #369 ##371# 372##370 362 363 364 365 ## 366 367 # # # ## # # 368#59th2051st394137738316#####382#384 # 38543rd1373375#38738815#37935th21#222324374##386#14#27th40011354395#394##36921KEYHazardous Material SiteSection Number0 1000 2000 3000 4000 5000 FeetArizona State Plane Central NAD83NPROJECT TITLE:DURANGO AREA DRAINAGE MASTER PLANPROJECT NO. FCD 99-41CONSULTANT:Project BoundaryFIGURE V-6EXHIBIT TITLE:HAZARDOUS MATERIAL SITES(Sheet 2 <strong>of</strong> 2)
VI. PLAN SET BIBLIOGRAPHYArizona Department <strong>of</strong> Transportation, Plan and Pr<strong>of</strong>ile <strong>of</strong> ProposedState Highway System, Ehrenberg - Phoenix, <strong>Maricopa</strong> <strong>County</strong>,I-10-2 (110), July 14, 1983.Arizona Public Service, State <strong>of</strong> Arizona Interconnected TransmissionSystem and Substations 69KV and Above, Revised March 15,1999.Dibble & Associates Consulting Engineers, <strong>Flood</strong>plain Delineation <strong>of</strong>the Tolleson Area, <strong>Flood</strong>plain Delineation Map, Sheets 1 <strong>of</strong> 16thru 16 <strong>of</strong> 16, 1 inch = 200feet, (Project FCD 95-26) March 24,1999.Federal Emergency Management Agency, <strong>Flood</strong> Insurance Rate Map,<strong>Maricopa</strong> <strong>County</strong>, Arizona And Incorporated Areas, Panel2080. Revised September 30, 1995.Federal Emergency Management Agency, <strong>Flood</strong> Insurance Rate Map,<strong>Maricopa</strong> <strong>County</strong>, Arizona And Incorporated Areas, Panel2085. Revised September 4, 1991.Federal Emergency Management Agency, <strong>Flood</strong> Insurance Rate Map,<strong>Maricopa</strong> <strong>County</strong>, Arizona And Incorporated Areas, Panel2090. Revised September 30, 1995.Federal Emergency Management Agency, <strong>Flood</strong> Insurance Rate Map,<strong>Maricopa</strong> <strong>County</strong>, Arizona And Incorporated Areas, Panel2095. Revised April 15, 1988.Federal Emergency Management Agency, <strong>Flood</strong> Insurance Rate Map,<strong>Maricopa</strong> <strong>County</strong>, Arizona And Incorporated Areas, Panel2105. Revised April 15, 1988.Federal Emergency Management Agency, <strong>Flood</strong> Insurance Rate Map,<strong>Maricopa</strong> <strong>County</strong>, Arizona And Incorporated Areas, Panel2110. Revised April 15, 1988.Federal Emergency Management Agency, <strong>Flood</strong> Insurance Rate Map,<strong>Maricopa</strong> <strong>County</strong>, Arizona And Incorporated Areas, Panel2115. Revised September 4, 1991.Federal Emergency Management Agency, <strong>Flood</strong> Insurance Rate Map,<strong>Maricopa</strong> <strong>County</strong>, Arizona And Incorporated Areas, Panel2120. Revised September 4, 1991.HDR Engineering Inc., Plate 3: General Drainage Plan, PapagoFreeway to Sta 800.Kenney Aerial Mapping, Durango Area Digital Aerial Photography,1:400 Scale, Flight date January 2, 1999.Kenney Aerial Mapping, Maryvale Area Drainage Master Study,1"=200' Mapping, 2 foot contour interval, flight date April 21,1994.<strong>Maricopa</strong> <strong>County</strong> Department <strong>of</strong> Transportation, Plans for theConstruction <strong>of</strong> Roeser and Chamber Bridges Across theBuckeye Feeder Ditch, (Project No. 69017), Revised December10, 1999.<strong>Maricopa</strong> <strong>County</strong> Planning and Development Department, Zoning Map -AA, A1, A2, A4, C1, C2, No Revision Date.City <strong>of</strong> Phoenix - Water Services Department, Sewer <strong>Collection</strong> System,10" and Larger, Revised July 14, 1999.City <strong>of</strong> Phoenix - Water Services Department, Water DistributionSystem, 8" and Larger, Revised April 15, 1999.City <strong>of</strong> Phoenix - Engineering and Architectural Services Department,Storm Drain Map, No Revision Date.City <strong>of</strong> Phoenix - Engineering and Architectural Services Department,Quarter Section Index Map, Revised November 9, 1998.Roosevelt Irrigation <strong>District</strong>, <strong>Collection</strong> Area Map, Revised May, 1984.United States Department <strong>of</strong> the Interior Geological Survey, TollesonQuadrangle, Arizona - <strong>Maricopa</strong> Co., 7.5 Minute Series(Topographic), 1957, Photorevised 1982.United States Department <strong>of</strong> the Interior Geological Survey, FowlerQuadrangle, Arizona - <strong>Maricopa</strong> Co., 7.5 Minute Series(Topographic), 1952, Photorevised 1982.W.C. Scoutten, Inc. for the City <strong>of</strong> Tolleson, Proposed DevelopmentsMap, No Revision Date.DIBBLE & ASSOCIATES 67 DURANGO ADMPDATA COLLECTION REPORT
Environmental Assessment Plan Set BibliographyBecker Engineering Company1941 Map <strong>of</strong> the Salt River Valley and Adjacent Portion <strong>of</strong> <strong>Maricopa</strong><strong>County</strong>, Arizona. Wm. H. Becker Engineering Company,Phoenix, Arizona. Copy on file at the Arizona Department <strong>of</strong>Library and Archives, Map Library, Phoenix.Heard, Dwight B.1915 Map <strong>of</strong> Salt River Valley, Arizona. Copy on file at the ArizonaDepartment <strong>of</strong> Library and Archives, Map Library, Phoenix.modern canals, ancient canals and ruins, land to be reclaimedby a water storage system. Copy on file at the ArizonaDepartment <strong>of</strong> Library and Archives, Map Library, Phoenix.193 <strong>Maricopa</strong> <strong>County</strong>, Arizona. Copy on file at the ArizonaDepartment <strong>of</strong> Library and Archives, Map Library, Phoenix.<strong>Maricopa</strong> <strong>County</strong> Highway Commission1919 Project Map. <strong>Maricopa</strong> <strong>County</strong> Highway CommissionEngineering Department. Phoenix, Arizona. Copy on file at theArizona Department <strong>of</strong> Library and Archives, Map Library,Phoenix.The CMC Company1923 Mileage Map <strong>of</strong> the Best Roads <strong>of</strong> Arizona Showing PavedRoads [and] Road Distances. Copy on file at the ArizonaHistorical Society Museum Library, Tucson.U.S. Reclamation Service1914 Project Map Prepared by the Board <strong>of</strong> Survey in Limiting theArea <strong>of</strong> the Project. Salt River Project, U. S. ReclamationService, Department <strong>of</strong> the Interior, Phoenix, Arizona. Copy onfile at the Arizona Department <strong>of</strong> Library and Archives, MapLibrary, Phoenix.General Land Office1869 Map <strong>of</strong> the Territory <strong>of</strong> Arizona Accompanying the Annual<strong>Report</strong> <strong>of</strong> the Commission <strong>of</strong> the General Land Office for 1869.Copy on file at the Arizona Department <strong>of</strong> Library and Archives,Map Library, Phoenix.1914a Township 1 North, Range 1 East. Copy on file at the ArizonaDepartment <strong>of</strong> Library and Archives, Map Library, Phoenix.1914b Township 1 North, Range 2 East. Copy on file at the ArizonaDepartment <strong>of</strong> Library and Archives, Map Library, Phoenix.Holmquist, F. M.1916 Map <strong>of</strong> Central Arizona. F. M. Holmquist. Copy on file at theArizona Department <strong>of</strong> Library and Archives, Map Library,Phoenix.<strong>Maricopa</strong> <strong>County</strong>, Arizona189 Map <strong>of</strong> <strong>Maricopa</strong> <strong>County</strong>, Arizona Showing Salt River Valley,also the proposed reservoir sites for water storage, dam sites,Phoenix Chamber <strong>of</strong> Commerce1922 Highway Program <strong>of</strong> <strong>Maricopa</strong> <strong>County</strong>: Already Built and ToBe Constructed January 1, 1922. Phoenix Chamber <strong>of</strong>Commerce. Copy on file at the Arizona Department <strong>of</strong> Libraryand Archives, Map Library, Phoenix.Salt River Project1934 Base Map, Salt River Project and Other Irrigation Projects East<strong>of</strong> Agua Fria River, <strong>Maricopa</strong> <strong>County</strong>, Arizona. Copy on file atthe Arizona Department <strong>of</strong> Library and Archives, Map Library,Phoenix.Schultz & Franklin1891 Map <strong>of</strong> Salt River Valley, Arizona, Compiled and Corrected bySchultz & Franklin, Immigration Solicitors, Tempe, Arizona.Copy on file at the Arizona Department <strong>of</strong> Library and Archives,Map Library, Phoenix.Valley National Bank <strong>of</strong> Arizona1946 Subdivision Map <strong>of</strong> Phoenix and Vicinity in Townships 1 & 2 N.,Ranges 2 & 3 E. Valley National Bank <strong>of</strong> Arizona, Phoenix.Copy on file at the Arizona Department <strong>of</strong> Library and Archives,Map Library, Phoenix.DIBBLE & ASSOCIATES 68 DURANGO ADMPDATA COLLECTION REPORT
VII. REPORT BIBLIOGRAPHY & REFERENCESAmerican Engineering Company, Final Drainage <strong>Report</strong> for Fieldcrest,Revised January 2000.American Engineering Company, Final Drainage <strong>Report</strong> for SundanceRanch, August 1998, Revised November 1998.American Engineering Company, Master Grading and Drainage Planfor Cambridge Estates, July 1999, Revised October 1999.ASL Consulting Engineers, Final Drainage <strong>Report</strong>, Cowden Property<strong>Flood</strong>plain Reduction for Lots 6 & 16, Revised February 18,1999.Dibble & Associates Consulting Engineers, Initial Hydraulic <strong>Report</strong>,Project No. I-10-2 (89) PE, Highway: I-10 Ehrenberg-Phoenix,Section: 39 th Ave - 27th Ave, January, 1983.Dibble & Associates Consulting Engineers, Addendum to Hydraulic<strong>Report</strong>, Project No. I-10-2 (89) PE, Highway: I-10 Ehrenberg-Phoenix, Section: 39 th Ave - 27th Ave, January, 1985.Dibble & Associates Consulting Engineers, Drainage Concept <strong>Report</strong>,115 th Avenue - Gila River Bridge to MC 85 (WO #80518),March 24, 1998.Dibble & Associates Consulting Engineers, Drainage <strong>Report</strong>,Willamette Industries Box Plant, December 13, 1999.<strong>Flood</strong> <strong>Control</strong> <strong>District</strong> <strong>of</strong> <strong>Maricopa</strong> <strong>County</strong>, Drainage Design MenuSystem, Version 1.1, August 1995.HDR Engineering Inc., Southwest Loop Highway (S.R. 218) DrainageDesign Concept <strong>Report</strong> , September, 1988.Howard Needles Tammen & Bergend<strong>of</strong>f, Interstate 10 Freeway West,Offsite Storm Run<strong>of</strong>f and Interceptor Analysis, April, 1983.Keith W. Hubbard Pr<strong>of</strong>essional Engineers, Drainage Study and <strong>Report</strong>for Freightliner Arizona Ltd., December, 1998.Landmark Engineering, Inc., Final Drainage <strong>Report</strong> For Marbella, May21, 1999.AZTEC Engineering, Preliminary Drainage <strong>Report</strong> - 115 th Ave, MC85to McDowell Road, December, 1999.Clouse Engineering, Inc., Master Drainage <strong>Report</strong> for The Sanctuary atAvondale, March 14, 2000.Coe & Van Loo Consultants, Inc., AGUA FRIA RIVER <strong>Flood</strong>plainDelineation Restudy (Project FCD 95-05), October 31, 1996.Coe & Van Loo Consultants, Inc., Master Drainage <strong>Report</strong> for CountryPlace - Phoenix, Arizona, Revised September 28, 1999.Dibble & Associates Consulting Engineers, <strong>Flood</strong>plain Delineation <strong>of</strong>the Tolleson Area Hydrology <strong>Report</strong> (Project FCD 95-26), May14, 1999.Dibble & Associates Consulting Engineers, <strong>Flood</strong>plain Delineation <strong>of</strong>the Tolleson Area, Final <strong>Report</strong> and Technical <strong>Data</strong> Notebook,(Project FCD 95-26) May, 1999.Federal Emergency Management Agency, <strong>Flood</strong> Insurance Study,<strong>Maricopa</strong> <strong>County</strong>, Arizona And Incorporated Areas, Volume 1<strong>of</strong> 12. Revised September 30, 1995.<strong>Maricopa</strong> <strong>County</strong>, Estrella - Land Use Plan, January 31, 1992.<strong>Maricopa</strong> <strong>County</strong>, <strong>Maricopa</strong> <strong>County</strong> 2020, Eye To The Future(Comprehensive Plan), October 20, 1997.<strong>Maricopa</strong> <strong>County</strong> Department <strong>of</strong> Transportation, MCDOTAccomplishments & Five-year Capital Improvements Programfor Fiscal Years 2000-2004.Michael Baker Jr, Inc., SALT-GILA RIVER <strong>Flood</strong>plain DelineationRestudy (Project FCD 92-01), May, 1999.Coe & Van Loo Consultants, Inc., Drainage <strong>Report</strong> for 91 st Avenue andLower Buckeye Road, August 12, 1999, Revised October 25,1999.<strong>Flood</strong> <strong>Control</strong> <strong>District</strong> <strong>of</strong> <strong>Maricopa</strong> <strong>County</strong>, Drainage Design Manualfor <strong>Maricopa</strong> <strong>County</strong>, Arizona, Volume I, Hydrology, January 1,1995.City <strong>of</strong> Phoenix Planning Department, Estrella Village Plan, March1999.DIBBLE & ASSOCIATES 69 DURANGO ADMPDATA COLLECTION REPORT
City <strong>of</strong> Phoenix Planning Department, South Mountain ParkwaySpecific Plan, June, 1999.RBF / American Engineering Company, Preliminary Drainage <strong>Report</strong>for Ryland at Heritage Point, January 27, 2000.RUST Environment & Infrastructure, Sewer System Master Plan - City<strong>of</strong> Avondale, May, 1994.RUST Environment & Infrastructure, Water System Master Plan - City<strong>of</strong> Avondale, March, 1996.Sage Engineering Corporation, Drainage <strong>Report</strong> for “Rio del Rey”,February 4, 2000.Stantec Consulting, Preliminary Drainage <strong>Report</strong> for Coldwater Ranch,January 18, 2000.Stantec Consulting, Project Narrative for General Plan AmendmentRezoning Application, and Request for PADD, for ColdwaterRanch, January 25, 1999, Revised January 26, 2000.City <strong>of</strong> Tolleson, City <strong>of</strong> Tolleson General Plan, November, 1996.Tres Rios River Management Plan Steering Committee, Tres Rios RiverManagement Plan, Steering Committe Summary <strong>Report</strong> andConsensus Plan, September, 1998.U.S. Army Corps <strong>of</strong> Engineers, Hydrologic Engineering Center, HEC-1<strong>Flood</strong> Hydrograph Package, User’s Manual, September 1990.U.S. Army Corps <strong>of</strong> Engineers, Los Angeles <strong>District</strong> South PacificDivision, Tres Rios, Arizona - Feasibility Study, December1999.U.S. Department <strong>of</strong> Commerce, National Oceanic and AtmosphericAdministration, Precipitation-Frequency Atlas <strong>of</strong> the WesternUnited States, Volume VIII, Arizona, 1973.Willdan Associates, Initial Design Concept <strong>Report</strong> - 91 st Avenue,Interstate 10 to Van Buren Avenue - City <strong>of</strong> Tolleson, May,1994.Environmental Assessment Bibliography & ReferencesArizona Good Roads Association1913 Illustrated Road Maps and Tour Book. Arizona Good RoadsAssociation, Prescott, Arizona.Ayres, James E. A.E. Rogge, Everett J. Bassett, Melissa Keane, andDiane L. Douglas1992 Humbug! The Historical Archaeology <strong>of</strong> Placer Mining onHumbug Creek in Central Arizona. Dames & Moore, Phoenix.Barnes, Will C.1988 Arizona Place Names. The University <strong>of</strong> Arizona Press, Tucson.Bensel Directory Company1892 Phoenix Directory for the Year 1892. McNeil Company Printers,Phoenix. Reprinted 1971, Paul Johnson jewelers.FraserDesign1987 Arizona Bridge Inventory: A Historical Inventory for theArizona Department <strong>of</strong> Transportation. Arizona Department <strong>of</strong>Transportation, Phoenix.Hecht, Melvin E., and Richard W. Reeves1981 The Arizona Atlas. Office <strong>of</strong> Arid Lands Studies, The University<strong>of</strong> Arizona, Tucson.Horton, Arthur G.1941 An Economic, Political, and Social Survey <strong>of</strong> Phoenix and theValley <strong>of</strong> the Sun.Southside Progress, Tempe Arizona.Irvin, G. W. (Jerry)1987 Chapter Eleven: A Sequential History <strong>of</strong> Arizona Railroad andMining Development, 1864-1920. In History <strong>of</strong> Mining inArizona, J. Michael Canty and Michael N. Greeley, editors.Mining Club <strong>of</strong> the Southwest Foundation, Tucson, Arizona.Kotlanger, Michael S.J.1993 An Overview <strong>of</strong> Economic Development in Phoenix in the1920s. In Phoenix in the Twentieth Century: Essays inCommunity History, G. Wesley Johnson, Jr., editor. University<strong>of</strong> Oklahoma Press, Norman.Luckingham, Bradford1989 Phoenix: The History <strong>of</strong> a Southwestern Metropolis. TheUniversity <strong>of</strong> Arizona Press, Tucson.DIBBLE & ASSOCIATES 70 DURANGO ADMPDATA COLLECTION REPORT
1993 The Promotion <strong>of</strong> Phoenix. In Phoenix in the Twentieth Century:Essays in Community History, G. Wesley Johnson, Jr., editor.University <strong>of</strong> Oklahoma Press, Norman.Rogge, A.E., D. Lorne McWatters, Melissa Keane, and Richard P.Emanuel1995 Raising Arizona’s Dams: Daily Life, Danger, andDiscrimination in the Dam Construction Camps <strong>of</strong> CentralArizona, 1890-1940s. The University <strong>of</strong> Arizona Press, Tucson.Sargent, Charles, editor1988 Metro Arizona. Biffington Books, Phoenix, Arizona.Sheridan, Thomas E.1995 Arizona: A History. The University <strong>of</strong> Arizona Press, Tucson.Smith, Karen L.1986 The Magnificent Experiment: Building the Salt RiverReclamation Project, 1890-1917. The University <strong>of</strong> ArizonaPress, Tucson.State Engineer1926 Seventh Biennial <strong>Report</strong> <strong>of</strong> the State Engineer to the Governor<strong>of</strong> the State <strong>of</strong> Arizona for the Period July 1, 1924 to June 30,1926. On file at Hayden Libraries, Arizona State University,Tempe.Wagoner, Jay J.1970 Arizona Territory 1863-1912: A Political History. TheUniversity <strong>of</strong> Arizona Press, Tucson.Walker, Henry P., and Don Bufkin1986 Historical Atlas <strong>of</strong> Arizona. University <strong>of</strong> Oklahoma Press,Norman.Zarbin, Earl1986 Salt River Project: Four Steps Forward 1902-1910. Salt RiverProject, Phoenix, Arizona.1997 Two Sides <strong>of</strong> the River: Salt River Valley Canals, 1867-1902.Salt River Project, Phoenix, Arizona.AGFD (Arizona Game and Fish Department)1999 Snowy egret (Egretta thula). Arizona Game and FishDepartment Nongame Field Notes from website,Arizona Game and Fish Department, Phoenix, Arizona.2 pp.1998a Leptonycteris curasorae yerbabuena. Unpublishedabstract compiled and edited by the Heritage <strong>Data</strong>Management System, Arizona Game and FishDepartment, Phoenix, Arizona. 6 pp.1998b Coccyzus americanus occidentalis. Unpublished abstractcompiled and edited by the Heritage <strong>Data</strong> ManagementSystem, Arizona Game and Fish Department, Phoenix,Arizona. 3 pp.1998c Strix occidentalis lucida. Unpublished abstract compiledand edited by the Heritage <strong>Data</strong> Management System,Arizona Game and Fish Department, Phoenix, Arizona.4 pp.1998d Glaucidium brasilianum cactorum. Unpublishedabstract compiled and edited by the Heritage <strong>Data</strong>Management System, Arizona Game and FishDepartment, Phoenix, Arizona. 4 pp.1997a Rallus longirostris yumaensis. Unpublished abstractcompiled and edited by the Heritage <strong>Data</strong> ManagementSystem, Arizona Game and Fish Department, Phoenix,Arizona. 7 pp.1997b Gopherus agassizii. Unpublished abstract compiled andedited by the Heritage <strong>Data</strong> Management System,Arizona Game and Fish Department, Phoenix, Arizona.4 pp.1997c Echinocereus triglochidiatus var. arizonicus.Unpublished abstract compiled and edited by theHeritage <strong>Data</strong> Management System, Arizona Game andFish Department, Phoenix, Arizona. 4 pp.1997d Haliaeetus leucocephalus. Unpublished abstractcompiled and edited by the Heritage <strong>Data</strong> ManagementSystem, Arizona Game and Fish Department, Phoenix,Arizona. 7 pp.1997e Empidonax trailii extimus. Unpublished abstractcompiled and edited by the Heritage <strong>Data</strong> ManagementDIBBLE & ASSOCIATES 71 DURANGO ADMPDATA COLLECTION REPORT
System, Arizona Game and Fish Department, Phoenix,Arizona. 4 pp.1996 Wildlife <strong>of</strong> special concern in Arizona (public reviewdraft). Arizona Game and Fish Department Publication.Phoenix, Arizona.1995a Xyrauchen texanus. Unpublished abstract compiled andedited by the Heritage <strong>Data</strong> Management System,Arizona Game and Fish Department, Phoenix, Arizona.4 pp.1995b Poeciliopsis occidentalis occidentalis. Unpublishedabstract compiled and edited by the Heritage <strong>Data</strong>Management System, Arizona Game and FishDepartment, Phoenix, Arizona. 5 pp.1994 Cyprinodon macularis. Unpublished abstract compiledand edited by the Heritage <strong>Data</strong> Management System,Arizona Game and Fish Department, Phoenix, Arizona.3 pp.1988 Threatened native wildlife in Arizona. Arizona Gameand Fish Department Publication. Phoenix, Arizona.Arizona Partners in Flight1996 Protocol changes and criteria for assessing suitablesurvey habitat for the southwestern willow flycatcher.Unpublished memo.BISON-M (Biota Information System <strong>of</strong> New Mexico).1998 New Mexico species list. New Mexico Department <strong>of</strong>Game and Fish, Albuquerque.Brown, D.E. (Ed.)1994 Biotic Communities: Southwestern United States andNorthwestern Mexico. University <strong>of</strong> Utah Press.DeGraaf, R.M. and J.H. Rappole1995 Neotropical migratory birds: natural history, distribution,and population change. Cornell University Press, Ithaca,New York.FWS (U. S. Fish and Wildlife Service)1998a Threatened and Endangered Species <strong>of</strong> Arizona.Arizona Ecological Services Field Office, Phoenix.1992 Handbook <strong>of</strong> Arizona’s Endangered, Threatened, andCandidate Plants. Arizona Ecological Services FieldOffice, Phoenix.H<strong>of</strong>fmeister, D.A.1986 Mammals <strong>of</strong> Arizona. University <strong>of</strong> Arizona Press,Tucson, Arizona.Johnson, R.R., L.T. Haight, and J.M. Simpson1987 Endangered habitats vs. Endangered species: amanagement perspective. Western Birds 18:89-96.Kearney, T.H. and R.H. Peebles1960 Arizona Flora. University <strong>of</strong> California Press, Berkely,California.Minckley, W.L.1991 Native fishes <strong>of</strong> arid lands: a dwindling resource <strong>of</strong> thedesert southwest. USDA Forest Service GeneralTechnical <strong>Report</strong> RM-206.Philips, A., J. Marshall, and G. Monson1964 The birds <strong>of</strong> Arizona. University <strong>of</strong> Arizona Press,Tucson.Rogge, A.E., M. Keane, and D.L. McWatters1994 The historical archaeology <strong>of</strong> dam construction camps incentral Arizona, Volume 1: Synthesis. Dames & MooreIntermountain Cultural Resource Services ResearchPaper No. 10. Prepared for U.S. Bureau <strong>of</strong> Reclamation,Phoenix, Arizona.Unitt, P.1987 Empidonax traillii extimus: an endangered subspecies.Western Birds 18 (3):137-162.Weedman, D.A. and K.L. Young1997 Status <strong>of</strong> the Gila topminnow and desert pupfish inArizona. Nongame and Endangered Wildlife ProgramTechnical <strong>Report</strong> 118. Arizona Game and FishDepartment, Phoenix.Arizona State Museum (various editors)DIBBLE & ASSOCIATES 72 DURANGO ADMPDATA COLLECTION REPORT
1985-88 The 1982-1984 Excavations at Las Colinas, 7 volumes.Arizona State Museum Archaeological Series no. 162. Tucson.1983 Hohokam Ballcourts and Their Interpretation. Arizona StateMuseum Archaeological Series No. 160, TucsonAntieau, John M.1981 The Palo Verde Archaeological Investigations. HohokamSettlement at the Confluence: Excavations Along the Palo VerdePipeline. Museum <strong>of</strong> Northen Arizona Research Paper 20,Flagstaff.Dart, Alan1989 Prehistoric Irrigation in Arizona: A Context for Canals andRelated Cultural Resources. Arizona State Historic PreservationOffice, Phoenix.David E. Doyel (editor)1987 The Hohokam Village: Site Structure and Organization.Southwestern and Rocky Mountain Division <strong>of</strong> the AmericanAssociation for the Advancement <strong>of</strong> Science. GlenwoodSprings, Colorado.Gumerman, George (editor)1991 Exploring the Hohokam: Prehistoric Desert Peoples <strong>of</strong> theAmerican Southwest. University <strong>of</strong> New Mexico Press,Albuquerque.Haury, Emil W.1976 The Hohokam: Desert Farmers and Craftsman; Snaketown,1964-1965. University <strong>of</strong> Arizona Press, Tucson.Wilcox, D. R., and C. SternbergDIBBLE & ASSOCIATES 73 DURANGO ADMPDATA COLLECTION REPORT
Appendices
CURRENT AND PROPOSED DEVELOPMENTSDevelopment Engineering Principle Phone Developer Drainage <strong>Report</strong>Name Consultant Contact Number Received?Sundance Ranch RBF Bruce Larson, P.E. (623)582-0260 Stardust Development YesEstrella Manor Infinity Engineering Bob Mitchell, P.E. (480)902-0571 Recop Investment Inc.Meadow Infinity Engineering Bob Mitchell, P.E. (480)902-0571 Carson/Tyler CommunitiesSuncrest Dan Tobar Dan Tobar, P.E. (623)972-0467 The Dehaven Co.Estrella Village Manor Terra Consulting Dave Gue, P.E. (602)426-1600 DPP DevelopmentMountain View West RBF Bruce Larson, P.E. (623)582-0260 Centex Homes, Inc.Marbella Landmark Engineering, Inc. Thomas Granillo, P.E. (602)861-2005 Richmond American Homes YesRio Del Rey Sage Engineering Corp. Gary Hoodzow, P.E. (602)966-9971 Newport Development Yes67th & Lower Buckeye Rd. Doug Oberg, P.E. (602)306-1000 Kaufman & Broad83rd & Buckeye Coe & Van Loo Timothy Kelly, P.E. (602)264-6831 Lennar Community DevelopmentSienna Vista Todd Weber (480)970-6000 Maracay HomesCountry Place Coe & Van Loo Timothy Kelly, P.E. (602)264-6831 Communities Southwest Yes83rd & Lower Buckeye Rd. RBF Ken Tarr, P.E. (623)582-0260 Hacienda BuildersHeritage Point RBF Joseph E. Cable, P.E. (623)582-0260 Ryland Homes Yes91st Ave. & Lower Buckeye Rd. Coe & Van Loo Timothy Kelly, P.E. (602)264-6831 YesColdwater Springs CMX Group Inc. Curtis Krausman, P.E. (602)279-8436 Elliot PollackColdwater Ranch Stantec Consulting Inc. Jack Reeves, P.E. (602)438-2200 Beazer Homes YesDiamond Ridge David Evans and Assoc. Burke Lokey, P.E. (602)678-5151 CHPV Holdings, LLCCambridge Estates RBF Bruce Larson, P.E. (623)582-0260 Trend Homes YesColdwater Springs Phase II Stantec Consulting Inc. Mike Samer, P.E. (602)438-2200 Elliot PollackDurango Park RBF Bruce Larson, P.E. (623)582-0260 Aread, Inc.Fieldcrest RBF Bruce Larson, P.E. (623)582-0260 Aread, Inc. YesShadow Ridge David Evans and Assoc. Burke Lokey, P.E. (602)678-5151 CHPV Holdings, LLCAvondale Crossing-Auto Mall RBF Marc Allen, P.E. (623)582-0260 AZVT, LLCFiesta Travel Plaza Fleet-Fisher Engineering, Inc. Fred Fleet, P.E. (602)264-3335 Interstate Commerse Center, LLCThe Sanctuary at Avondale Clouse Engineering Inc. Jayme Chapin, P.E. (602)395-9300 The Empire Group, LLC YesArnon Distribution Center Evans Kuhn & Assoc. Inc. John Gray, P.E. (602)241-0782 Fourdy, LLCHighland Ranch Infinity Engineering Bob Mitchell, P.E. (480)902-0571 Capital Pacific HomesWaterford Square Martin Peltyn & Gorden Inc. Jim Murpy (602)224-3790 Cavalier CompaniesAnderson 300 acres David Evans and Assoc. Burke Lokey, P.E. (602)678-5151CW Ranch Rich Merit (480)423-5900 Phoenix Southwest Associates73 El Mirage Properties CMX Group Inc. John Svechovsky, P.E., R.L.S. (602)279-8436 Jeff ProperKnight Transportation Morea Hall Engineering Claudia Morea, P.E. (602)258-4428 Knight TransportationQuaker Oats Warehouse Scott Cupp (623)907-2447 Quaker OatsStates LogisticsElm Manufacturing Ed Forst Sun State BuildersUtility Trailer Sales ASL Paul Gilmore (602)244-2624 Utility Trailer SalesRoads West Depot Lemme Engineering Mark Sidler (602)841-6904 Roads WestFreightliner <strong>of</strong> Arizona Keith W. Hubbard Pro. Engr. Keith Hubbard, P.E. (480)892-3313 Robert Cunningham YesMBCI/DBCI RBF (623)582-0260 MBCI/DBCIMesa Cold Storage Haskell Company Mike Wheel (904)791-4500Nabisco ASL Matt Jaramilla (602)244-2624Building B Warehouse Evans Kuhn & Assoc. Inc. Eric Sorensen (602)241-0782 Ryan WestCardinal Health Distribution Evans Kuhn & Assoc. Inc. Eric Sorensen (602)241-0782 Ryan WestBarlow Distribution Evans Kuhn & Assoc. Inc. Eric Sorensen (602)241-0782Landis Plastics BRW Bernie Duetsch (architect) (602)840-2929Opus West Phase I & II DEI Pr<strong>of</strong>essional Services Jeff Erickson (602)954-0038 BoseWillamette Industries Dibble & Associates Ken Snyder, P.E. (602)957-1155 Willamette IndustriesTranspacific Distribution Center, Site 4 Wood/Patel Jim Campbell (602)234-1344 Vincent CurciShopping Center Brady Auerlich Don Andrews (architect) (480)894-3344 Rick BlackCostco Distribution Center DEI Pr<strong>of</strong>essional Services Jeff Erickson (602)954-0038 Costco
HYDROLOGY EXHIBITS 1 AND 2
STORM COMPARISON TABLES
100-24100-610-2410-6i=3.99"i=3.23"i=2.47"i=2.06"TIME OFPEAKTIME OFPEAKTIME OFPEAKTIME OFPEAKPEAKFLOWPEAKFLOWPEAKFLOWPEAKFLOWSTATION12.503294.5045512.421634.50239SUBWD12.753104.7543112.831454.75220RTWDXA12.173954.1753812.172354.17331SUBXA12.504524.4264212.252474.25340CPXA112.584454.5063112.332274.42319RSXA0.0000.0000.0000.000DIZZ112.584454.5063112.332274.42319CPZZ113.174245.0059613.331995.25291RTXAWC12.427914.42104612.424604.42629SUBWB12.587644.50101812.584424.58606RTWBWC12.336094.3383612.333594.33509SUBWC12.5013254.58160612.507514.50920CPWC12.8311264.92144212.925345.00707RSWC0.0000.0000.0000.000DIQE12.8311264.92144212.925345.00707CPWC213.3310915.42139413.585105.58670RTWCWA12.338264.33108712.334804.42653SUBVD12.677304.6798012.754064.75568RTVDWA12.178684.17118612.175154.17726SUBWA13.1715405.25183813.506725.50849CPWA13.2515205.33181813.586625.58835RSWA0.0000.0000.0000.000DIQD13.2515205.33181813.586625.58835CPWA213.5814945.67178814.006456.00810RTWAVC12.586944.5891412.584024.58548SUBVB13.086045.0080313.173335.08465RTVBVC12.178084.17110712.174734.17673SUBVC13.5019715.50227313.088375.001066CPVCStorm ComparisonDibble & Associates 1 Durango ADMP
100-24100-610-2410-6i=3.99"i=3.23"i=2.47"i=2.06"TIME OFPEAKTIME OFPEAKTIME OFPEAKTIME OFPEAKPEAKFLOWPEAKFLOWPEAKFLOWPEAKFLOWSTATION13.6719125.67220914.087826.08962RSVC13.675275.6760114.082466.08291DIVA13.6713855.67160914.085366.08672CPVC213.9213565.92157514.425236.33654RTVCQA12.505174.5069912.502994.50411SUBQA13.8314235.92162114.425356.33659CPQA213.9214225.92162014.505306.50654RSQA13.925105.9254314.502236.50272DIPF13.929125.92107714.503076.50382DIPF16.086957.9283417.252339.00294RTQAJF12.4210654.42136212.426344.42832SUBQE0.0000.0000.0000.000CPQE0.0000.0000.0000.000RTDIQE12.4210654.42136212.426344.42832CPQE212.589694.50127912.585284.58711RSQE12.759484.75123912.835154.83688RTQEQC12.175214.1771312.173204.17451SUBQD0.0000.0000.0000.000CPQD0.0000.0000.0000.000RTDIQD12.175214.1771312.173204.17451CPQD112.174824.1768612.252824.25398RSQD12.171124.1720112.25504.2575DIQB12.173704.1748512.252324.25322CPQD212.582804.5836412.671514.67215RTQDQC12.426474.4286012.423754.42508SUBQC12.6717414.67210212.759334.751156CPQC12.6713934.67168212.757474.75924DISRStorm ComparisonDibble & Associates 2 Durango ADMP
100-24100-610-2410-6i=3.99"i=3.23"i=2.47"i=2.06"TIME OFPEAKTIME OFPEAKTIME OFPEAKTIME OFPEAKPEAKFLOWPEAKFLOWPEAKFLOWPEAKFLOWSTATION12.673484.6742012.751874.75231CPQC216.751498.6717418.00609.5877RTQCJF13.4210755.58127813.425785.42701SUBJF13.4210695.58123113.425745.58670CPJF112.425994.4281312.423554.42489SUBQB12.171124.1720112.25504.2575CPQB13.08415.007413.33175.2526RTDIQB12.426004.4281312.423554.42489CPQB112.674954.6765512.831994.83292RSQB16.172238.0027917.58729.00100RTQBJF12.336624.3391412.333904.33560SUBPF13.925105.9254314.502236.50272CPPF14.175056.2553814.922176.83266RTDIPF12.336794.4291412.333944.33560CPPF114.255376.2556615.332197.17251RSPF0.0000.0000.0000.000DIPE14.255376.2556615.332197.17251CPPF214.925326.8356116.082167.92247RTPFJF12.178174.17112712.174774.17687SUBPE12.506574.4293112.503634.50546CPPE12.506404.5061512.503514.50352CPPE215.085626.9258416.252288.08246RSPE0.0000.0000.0000.000DIPD15.085626.9258416.252288.08246CPPE316.425428.1756618.002159.75232RTPEJF16.2517008.25179417.755779.42660CPJF212.174634.1762712.172664.17373SUBPC14.3375.00430.0050.005RSPCStorm ComparisonDibble & Associates 3 Durango ADMP
100-24100-610-2410-6i=3.99"i=3.23"i=2.47"i=2.06"TIME OFPEAKTIME OFPEAKTIME OFPEAKTIME OFPEAKPEAKFLOWPEAKFLOWPEAKFLOWPEAKFLOWSTATION17.2567.33270.0050.005RTPCNB12.673454.6746912.671744.67249SUBNB12.673484.6745512.671784.67241CPNB112.672254.6729312.671164.67157DINA12.671234.6716212.67624.6785CPNB214.00835.8311514.33376.1753RTNBJD12.833584.7547412.831934.75259SUBJD12.833594.8344612.831934.83241CPJD12.831314.8316212.83724.8389DIJC12.832284.8328312.831224.83152CPJD113.422075.4226313.581015.58131RTJDFC12.584104.5855812.582244.58318SUBPD0.0000.0000.0000.000CPPD12.584104.5855812.582244.58318CPPD214.17375.757724.9217.582RSPD15.00346.427426.5819.502RTPDNC12.502694.5038012.421364.50197SUBNC12.502664.5035812.501344.50183CPNC13.332005.2528713.58855.50123RTNCJE12.753914.7552112.752194.75288SUBJE13.174915.0865612.752175.25281CPJE13.334825.2564913.002135.42278RTJEFC12.672874.6738612.671604.67213SUBFC13.258225.25105413.003715.25458CPFC13.3318315.42196213.429035.42970CPFC112.508034.50104312.504624.50615SUBUD12.501954.5025212.501134.50150DIUA12.506084.5079112.503494.50466CPUDStorm ComparisonDibble & Associates 4 Durango ADMP
100-24100-610-2410-6i=3.99"i=3.23"i=2.47"i=2.06"TIME OFPEAKTIME OFPEAKTIME OFPEAKTIME OFPEAKPEAKFLOWPEAKFLOWPEAKFLOWPEAKFLOWSTATION13.085035.0066813.172665.08369RTUDVA12.178094.17111212.174834.17688SUBVA13.675275.6760114.082466.08291CPVA14.175156.1758814.832396.67282RTDIVA12.178404.17109112.174954.17688CPVA213.837755.6793412.334094.42470RSVA14.427616.2591213.173265.33404RTVAUC12.426484.4287112.423684.42511SUBUA12.501954.5025212.501134.50150CPUA14.50946.2512815.08456.8362RTDIUA12.426484.4287012.423684.42511CPUA112.421294.4215412.42734.4290DITB12.425174.4261812.422924.42359CPUA212.924044.9250713.082005.00268RTUAUC12.256364.2586512.253634.33510SUBUC12.9211984.92131413.085655.25594CPUC13.0011625.08128513.255345.42570RSUC13.0811565.17127913.335295.50566RTUCUB12.251824.2524512.251044.33145SUBUB13.0811905.17131813.335365.50573CPUB13.3311095.42123513.924236.00491RSUB13.33515.42620.0005.923DIUE13.3310585.42117313.924236.00488CPUB113.6710265.75114314.424166.50476RTUBSF12.836344.8380612.833394.83446SUBTB12.421294.4215412.42734.4290CPTB13.171035.0813013.33535.3369RTDITBStorm ComparisonDibble & Associates 5 Durango ADMP
100-24100-610-2410-6i=3.99"i=3.23"i=2.47"i=2.06"TIME OFPEAKTIME OFPEAKTIME OFPEAKTIME OFPEAKPEAKFLOWPEAKFLOWPEAKFLOWPEAKFLOWSTATION12.926964.9285212.923514.92446CPTB112.921694.9220612.92864.92108DITA12.925274.9264612.922654.92333CPTB213.334985.3361013.422475.42313RTTBSF12.752974.7538712.751704.75215SUBSF13.5816165.67175014.175766.25641CPSF113.7515565.83168714.425586.50623RSSF13.754675.8350614.421686.50187DIRJ113.7510905.83118114.423916.50436CPSF214.089796.17106614.833586.83401RTSFSH12.421264.4217212.42754.42105SUBSH14.089896.17107314.833616.83402CPSH14.259756.25106015.333267.42368RSSH14.258136.2588715.332497.42284DIRJ214.251626.2517315.33787.4284CPSH114.581586.5816815.83757.7582RTSHSG12.672114.6728612.671094.67150SUBTA12.921694.9220612.92864.92108CPTA13.501545.4218813.67755.5895RTDITA13.082615.0833212.671165.08150CPTA113.252585.1733113.081145.25146RTTASG12.421864.4225312.421034.50144SUBSG12.753634.8338412.671814.75181CPSG12.833594.9238413.421275.50144RSSG12.832674.9228713.42805.5094DIRJ412.83924.929713.42475.5050CPSG113.08885.179613.67455.7548RTSGSE12.832294.8332112.831034.83151SUBSCStorm ComparisonDibble & Associates 6 Durango ADMP
100-24100-610-2410-6i=3.99"i=3.23"i=2.47"i=2.06"TIME OFPEAKTIME OFPEAKTIME OFPEAKTIME OFPEAKPEAKFLOWPEAKFLOWPEAKFLOWPEAKFLOWSTATION12.831244.8317312.83564.8381DISD12.831054.8314812.83474.8369CPSC13.50845.4212413.75345.6751RTSCSE12.081794.0824712.081004.08147SUBSE12.081705.4217512.08955.7576CPSE13.751575.6716816.00458.5041RSSE13.751575.6716816.00458.5041DIRJ50.0000.0000.0000.000CPSE20.0000.0000.0000.000RTSERI12.251864.2525212.251034.33145SUBRJ13.754675.8350614.421686.50187CPRJ113.924655.9250414.581676.67186RTSFRJ14.258136.2588715.332497.42284CPRJ214.338136.3388615.502497.50283RTSHRJ14.1712366.25134815.423807.42433CPRJ314.5012146.58132715.923677.92420RTRJ312.832674.9228713.42805.5094CPRJ4A14.5014116.58153715.924257.92483CPRJ4B14.7513946.75152016.254208.17475RTSGRJ13.751575.6716816.00458.5041CPRJ514.671246.5813517.33369.8334RTSERJ14.7515186.75163316.334398.25485CPRJ615.0814187.08153216.834148.58454RSRJ15.083927.0844516.8358.3312DIPA215.0810267.08108716.834098.67444CPRJ715.1710257.17108616.924098.83444RTRJRI15.172537.1727316.92588.8369DIOE315.177727.1781316.923518.83375CPRI1Storm ComparisonDibble & Associates 7 Durango ADMP
100-24100-610-2410-6i=3.99"i=3.23"i=2.47"i=2.06"TIME OFPEAKTIME OFPEAKTIME OFPEAKTIME OFPEAKPEAKFLOWPEAKFLOWPEAKFLOWPEAKFLOWSTATION15.257717.3381117.083519.00375RTRI12.081324.1717712.08794.17108SUBUE13.33515.42620.0005.923CPUE12.081324.1717712.08794.17108CPUE216.4238.25323.1706.420RSUE18.83310.67324.2509.250RTUEPB12.424424.4259812.422464.42342SUBPB12.424414.4259812.422454.42342CPPB112.42814.4211012.42464.4264DIPA12.423604.4248812.421994.42279CPPB213.582435.4234114.001075.75159RTPBNA13.005945.0074812.923155.08401SUBNA12.672254.6729312.671164.67157CPNA114.581186.3316615.25507.0871RTDINA13.427555.4296213.083255.50432CPNA214.176906.0888614.333046.33404RTNAJC13.005915.0075912.923035.00401SUBJC12.831314.8316212.83724.8389CPJC114.83926.6711615.25417.1754RTDIJC14.089396.00120314.083996.17514CPJC214.084326.0055314.081846.17236DIJB14.085076.0065014.082166.17277CPJC314.674926.5862915.082037.00265RTJCFB12.674494.6759712.672164.75299SUBFB14.585156.5065412.672156.92265CPFB14.585156.5065412.672156.92264DISRX0.0000.0000.0000.000CPFB1Storm ComparisonDibble & Associates 8 Durango ADMP
100-24100-610-2410-6i=3.99"i=3.23"i=2.47"i=2.06"TIME OFPEAKTIME OFPEAKTIME OFPEAKTIME OFPEAKPEAKFLOWPEAKFLOWPEAKFLOWPEAKFLOWSTATION12.504614.5063012.502504.50354SUBPA12.50834.5011312.50454.5064DIOE12.503784.5051712.502054.50290CPPA13.582705.5038314.001185.75183RTDIPA15.083927.0844516.8358.3312CPPA215.503697.5841918.8349.506RTRJPA15.504407.3357314.001185.83194CPPA317.003568.7547416.92658.7578RTPAMD13.004865.0062613.002625.00350SUBMD13.004775.0855013.002575.08299CPMD13.00975.0811213.00535.0862DIJB113.003805.0843813.002035.08237CPMD113.003805.0843813.002035.08237DIMFX0.0000.0000.0000.000CPMD215.257717.3381117.083519.00375CPMD312.671734.6723512.67964.67137SUBMG15.00976.8313415.67457.3363RTMGJB12.925314.9274312.922885.00399SUBJB12.925335.0073212.922895.00391CPJB14.084326.0055314.081846.17236CPJB115.254037.1751415.831647.67216RTDIJB13.00975.0811213.00535.0862CPJB214.92716.838615.33357.2543RDIJB115.006206.8382812.922945.00394CPJB315.002236.8329812.921065.00142DIEE15.003976.8353012.921885.00252CPJB416.923548.5847917.921429.50200RTJBFA13.253415.2546013.251655.33222SUBFAStorm ComparisonDibble & Associates 9 Durango ADMP
100-24100-610-2410-6i=3.99"i=3.23"i=2.47"i=2.06"TIME OFPEAKTIME OFPEAKTIME OFPEAKTIME OFPEAKPEAKFLOWPEAKFLOWPEAKFLOWPEAKFLOWSTATION16.673668.5049313.251655.33199CPFA16.673668.5049313.251655.33197DISRX20.0000.0000.0000.000CPFA115.257717.3381117.083519.00375CPRI312.253284.2544612.251874.25260SUBRI12.332294.3330612.331324.33174SUBSB12.581954.5826212.75804.67118RSSB12.501374.5018712.50744.50102SUBSD12.831244.8317312.83564.8381CPSD112.584294.5856312.671934.67268CPSD212.584294.5856412.671934.67268RSSD12.834174.8355013.001824.92254RTSDRI16.1724438.08259213.1711055.331182CPRI516.1724428.08259213.1711045.331180RSRI16.4224328.33258313.5810865.671160RTRIRH12.256204.2584412.253564.25501SUBSA12.253104.2542212.251784.25250DIRF12.253104.2542212.251784.25250CPSA13.001694.9224413.25735.08113RTSARH12.502254.5030712.501344.50177SUBRH16.4224328.33257613.5011725.581253CPRH16.5024288.42257613.5811725.671253RSRH0.0000.0000.0000.000DIOE216.5024288.42257613.5811725.671253CPRH216.5824288.50257513.6711725.751253RTRHOG0.0000.0000.0000.000DIOD116.5824288.50257513.6711725.751253CPOG116.8324248.75257214.0011656.081245RTOG1Storm ComparisonDibble & Associates 10 Durango ADMP
100-24100-610-2410-6i=3.99"i=3.23"i=2.47"i=2.06"TIME OFPEAKTIME OFPEAKTIME OFPEAKTIME OFPEAKPEAKFLOWPEAKFLOWPEAKFLOWPEAKFLOWSTATION12.421414.4218912.42814.42109SUBRG13.42935.2512513.67455.5862RTRGRF12.675424.6771412.673044.67412SUBRF12.253104.2542212.251784.25250CPRF14.331026.1714115.17426.8362RTDIRF12.675554.6771212.673054.67412CPRF112.671114.6713812.67614.6778DIRE12.674444.6755312.672444.67311CPRF213.334065.2551413.422055.42273RTRFOG12.504754.5064312.502694.50376SUBOG13.7527335.75295113.8313395.921433CPOG13.8327185.92293714.0013306.081424RSOG13.839355.92101814.004056.08441DIOD213.8317845.92191814.009246.08983CPOG214.0017806.00191514.179216.17980RTOGOF12.502614.4235412.501494.50207SUBOF12.922424.9233012.921374.92184SUBRE12.671114.6713812.67614.6778CPRE14.25716.089414.67326.5043RTDIRE13.002505.0033013.001385.00184CPRE113.672345.6730213.671235.67158RTREOF13.9220186.00217214.0810316.171105CPOF114.0020155.92219214.589456.581025RSOF14.3319876.33215115.009137.00990RTOFOB12.832594.8336212.831294.83190SUBOB12.832454.8335112.831344.83195SUBRD12.83984.8314112.83544.8378DIOBStorm ComparisonDibble & Associates 11 Durango ADMP
100-24100-610-2410-6i=3.99"i=3.23"i=2.47"i=2.06"TIME OFPEAKTIME OFPEAKTIME OFPEAKTIME OFPEAKPEAKFLOWPEAKFLOWPEAKFLOWPEAKFLOWSTATION12.831474.8321112.83804.83117CPRD14.83906.4214015.25427.0066RTRDRC12.923944.9253212.922084.92281SUBRC12.923925.0051412.922075.00268CPRC13.923505.8347014.251616.08227RTRCRB12.673504.7547812.671604.75228SUBRB13.754185.6757714.171766.08244CPRB13.752095.6728914.17886.08122DIKA313.752095.6728914.17886.08122CPRB115.831327.6718916.75518.5871RTRBRA12.671584.6723812.67844.67128SUBRA12.671544.6720212.67824.67105CPRA12.671304.6717612.67604.6781DIKA412.67254.672613.172510.3325CPRA112.67254.672613.172510.3325DIAFX0.0000.0000.0000.000CPRA212.83984.8314112.83544.8378CPOB216.92338.425218.00159.3324RTDIOB14.3320276.33219215.009227.00994CPOB317.6716757.17179220.0066211.75700RSOB17.9216727.50177720.3366112.08698RTOBLE12.422124.5029912.501054.50152SUBLE17.9216717.50177520.3366012.08697CPLE18.0016707.58176820.4265812.17695RSLE18.007277.5877920.4220112.17218DILD18.009437.5898920.4245812.17477CPLE118.259417.9297920.8345712.58475RTLEKD13.003305.0046213.001665.00231SUBKDStorm ComparisonDibble & Associates 12 Durango ADMP
100-24100-610-2410-6i=3.99"i=3.23"i=2.47"i=2.06"TIME OFPEAKTIME OFPEAKTIME OFPEAKTIME OFPEAKPEAKFLOWPEAKFLOWPEAKFLOWPEAKFLOWSTATION18.179417.8398820.8345612.58475CPKD18.339398.0897621.0045412.75472RSKD18.429398.2597521.1745412.92472RTKDKA19.1790711.0094323.7536215.50366RSKA119.1758411.0061323.7513915.50142DILA19.1732311.0033023.8322215.50223CPKA219.9232211.6732924.6722216.33223RTKAKA13.085475.1768913.082505.17314SUBKA13.752095.6728914.17886.08122CPKA314.501976.3327515.17806.83113RTDIKA12.671304.6717612.67604.6781CPKA413.257075.3368913.332755.42311CPKA513.253195.332860.0000.000DIKB13.083885.0838813.3327516.17227CPKA612.83544.837412.92254.8338SUBEC12.832454.9234812.831214.92174SUBAD12.922354.9233212.921134.92164SUBAC12.832504.8334912.831154.83169SUBAB12.9211175.00107512.926044.92476CPSR712.673564.6748912.671764.67253SUBOE12.50834.5011312.50454.5064CPOE113.42585.428113.58285.5841RTDIOE0.0000.0000.0000.000CPOE215.172537.1727316.92588.8369CPOE312.673654.6750712.671794.67256CPOE412.67604.678312.67314.6743DIOD12.673054.6742412.671484.67213CP0E514.172226.0032914.75886.42134RTOEMFStorm ComparisonDibble & Associates 13 Durango ADMP
100-24100-610-2410-6i=3.99"i=3.23"i=2.47"i=2.06"TIME OFPEAKTIME OFPEAKTIME OFPEAKTIME OFPEAKPEAKFLOWPEAKFLOWPEAKFLOWPEAKFLOWSTATION13.085785.0871913.083165.08388SUBMF13.003805.0843813.002035.08237CPMF14.423166.4237414.831476.75182RTMDMF14.178076.00105713.083216.42434CPMF114.173736.0048813.081506.42202DIEB14.174346.0056913.081716.42233CPMF215.333937.1750815.921527.67207RTMFMC12.674474.6760012.672534.67352SUBOD12.67604.678312.67314.6743CPOD118.25399.255017.081011.9216RTDIOD0.0000.0000.0000.000CPOD213.839355.92101814.004056.08441CPOD313.6710125.67101913.924225.92411CPOD413.671825.6718313.92765.9274DIOC13.678305.6783613.923465.92337CPOD514.587906.6780015.083127.08312RTODMC13.006435.0080613.003605.08446SUBMC14.5812216.58124315.084667.08457CPMC114.584666.5847415.081797.08176DIMB14.587556.5876815.082877.08281CPMC214.927477.0076015.502807.50275RTMCIE12.421374.4219512.42784.50111SUBEB14.173736.0048813.081506.42202CPEB113.002505.0036313.001355.00199SUBED12.835904.8379212.833214.83430CPEB214.424956.3368314.422186.33309RTEBIE12.832284.8330212.831344.83172SUBIEStorm ComparisonDibble & Associates 14 Durango ADMP
100-24100-610-2410-6i=3.99"i=3.23"i=2.47"i=2.06"TIME OFPEAKTIME OFPEAKTIME OFPEAKTIME OFPEAKPEAKFLOWPEAKFLOWPEAKFLOWPEAKFLOWSTATION12.833404.8346012.831644.83230SUBID13.506795.5091212.923055.75384CPIE14.426546.4287414.672796.67376RTIEIB12.254304.2558812.252534.25356SUBOC13.671825.6718313.92765.9274CPOC115.251577.2515916.17568.2556RTDIOC12.254324.2558812.252544.25356CPOC213.332805.1739813.671325.42202RTOCMB12.926315.0078913.083485.08426SUBMB14.584666.5847415.081797.08176CPMB15.674507.6745716.421678.50164RTDIMB13.178755.17112213.424175.42554CPMB113.758055.67101213.923825.92500RTMBIB12.923264.8343612.921894.92246SUBIB13.002445.0033813.001145.08162SUBIC13.8316485.83199914.087216.08870CPIB13.9216455.83199614.087216.08869RTIBIA12.672184.6731112.671054.67154SUBME13.501655.3325113.83685.67106RTMEIA12.502814.5038612.501404.50201SUBIA13.8317955.75214614.087836.08921CPIA13.9217945.92214414.257796.25917RTIAHB12.253144.3343912.331574.33237SUBLD13.9217945.92214314.257796.25913CPLD14.0817426.17188914.507466.58775RTDILD14.2517376.25188414.677436.75771RTLDMA12.501854.5027812.50974.58149SUBMA14.2517406.25188714.677436.75771CPMAStorm ComparisonDibble & Associates 15 Durango ADMP
100-24100-610-2410-6i=3.99"i=3.23"i=2.47"i=2.06"TIME OFPEAKTIME OFPEAKTIME OFPEAKTIME OFPEAKPEAKFLOWPEAKFLOWPEAKFLOWPEAKFLOWSTATION14.5817166.67186615.087317.17759RTMAHB12.502714.5038412.501304.50190SUBHB14.7522586.83218915.258897.42802CPHB14.8322546.92218515.338877.50800RTHBDA12.582674.5836112.581314.58185SUBDA14.7525856.83237115.259737.50805CPDA15.9224458.08225716.679219.00757RTDACC12.927245.0090212.923365.00415SUBEE15.002236.8329812.921065.00142CPEE115.922157.5829314.25926.08129RTDIEE12.927265.0090512.923375.00416CPEC13.427055.5089213.503215.50400RTEEEA13.006165.0881113.003095.08395SUBEA13.2512605.33153313.335765.33669CPEA14.5011076.50139514.754836.75571RTEADC12.755454.7571812.752724.75360SUBDC14.4211556.42142114.754966.67570CPDC15.5010587.42132116.004368.00501RTDCCC12.331184.3316412.42544.4279SUBDD13.33845.1712513.58325.4251RTDDCC12.677014.6789312.673334.67434SUBCC15.8332998.00292416.4212519.00929CPCC16.5832378.83287317.42123110.08908RTCCCB12.671714.6725812.67914.67139SUBLB13.581305.4221013.83605.6799RTLBHA12.421894.4226812.42944.50136SUBHA12.421884.4226712.42934.50136CPHA14.581296.4222015.42536.9291RTHAGDStorm ComparisonDibble & Associates 16 Durango ADMP
100-24100-610-2410-6i=3.99"i=3.23"i=2.47"i=2.06"TIME OFPEAKTIME OFPEAKTIME OFPEAKTIME OFPEAKPEAKFLOWPEAKFLOWPEAKFLOWPEAKFLOWSTATION12.581954.5828412.58994.58146SUBKC14.171115.8317814.58486.4275RTKCGD12.675924.6775812.673074.67394SUBGD12.252474.2534412.251154.25175SUBGC13.001264.9219613.33455.1774RTGCGD12.756644.8382112.673164.75393CPGD14.005086.0065114.252046.25266RTGDCB12.925404.9268312.923064.92379SUBCB16.5834088.75299317.42130210.08940CPCB17.5833139.83291218.67127011.42908RTCBCA12.252374.3333212.331084.33165SUBGB14.42816.0812215.08286.8347RTGBCA13.085875.1774313.083415.17417SUBCA17.5833319.83291918.58127611.42905CPCA17.92331410.17290319.00126811.83898RTCABC13.172355.1732213.171045.25147SUBBC17.92331510.17290019.00126911.83895CPBC12.331094.3315512.33584.3383SUBLC13.42555.258613.58245.5037RTLCLA12.832664.8338512.831334.83194SUBLA17.92331510.17289719.00126911.92893CPLA18.08331110.33289019.17126712.08891RTDILA18.25330410.58288419.42126512.33888RTLAKB12.503224.5044812.501454.50213SUBKB13.253195.332860.0000.000CPKB14.082666.172420.0000.000RTDIKB18.25330510.58288119.42126512.33887CPKB1Storm ComparisonDibble & Associates 17 Durango ADMP
Storm ComparisonSTATIONSUBGAPEAKFLOW18810-6i=2.06"TIME OFPEAK4.08PEAKFLOW12210-24i=2.47"TIME OFPEAK12.08PEAKFLOW356100-6i=3.23"TIME OFPEAK4.08100-24PEAKFLOW254i=3.99"TIME OFPEAK12.08SUBBB1224.759112.752344.7517912.75RTBBBA646.924515.171506.3310814.58SUBBA1085.007413.002245.0016112.92CPBA1055.007313.002205.0016012.92RTBAAA736.674816.081976.9213215.33SUBAA905.506013.501985.5813913.58CPAA1306.429514.423256.4223914.42Dibble & Associates 18 Durango ADMP
RESPONSE LETTERS FROM ARIZONA GAME AND FISH DEPARTMENT (AGFD) AND U.S. FISH AND WILDLIFE SERVICE (FWS)
WILDLIFE OBSERVED IN THE DURANGO DRAINAGE AREABIRDS BIRDS BIRDSpied-billed grebe (Podilymbus podiceps) red-winged blackbird (Agelaius phoeniceus) ladder-backed woodpecker (Picoides scalaris)greater white-fronted goose (Anser albifrons) great-tailed grackle (Quiscalus mexicanus) Gila woodpecker (Melanerpes uropygialis)mallard (Anas platyrhynchos) house wren (Troglodytes aedon) black phoebe (Sayornis nigricans)American coot (Fulica americana) Bewick’s wren (Thryomanes bewickii) meadowlark (Sturnella sp.)great blue heron (Ardea herodias) cactus wren (Campyloryhnchus brunneicapillus) European starling (Sturnus vulgaris)black-crowned night-heron (Nycticorax nicticorax) Bewick’s wren (Thryomanes bewickii) phainopepla (Phainopepla nitens)green-backed heron (Butorides striatus) marsh wren (Cistothorus palustris) loggerhead shrike (Lanius ludovicianus)snowy egret (Egretta thula) rock wren (Salpinctes obsoletus) curve-billed thrasher (Toxostoma curvirostre)great egret (Casmerodius albus) song sparrow (Melospiza melodia) northern mockingbird (Mimus polyglottos)cattle egret (Bulbulcus ibis) vesper sparrow (Pooecetes gramineus) common raven (Corvus corax)black-necked stilt (Himantopus mexicanus) white-crowned sparrow (Zonotrichia leucophrys) house finch (Carpodacus mexicanus)American avocet (Recurvirostra americana)black-throated sparrow (Amphispiza bilineata)lesser yellowlegs (Tinga flavipes) Brewer’s sparrow (Spizella breweri) REPTILESkilldeer (Charadrius vociferus) loggerhead shrike (Lanius ludovicianus) desert tortoise (Gopherus agassizii) (carcass)willet (Catoptrophorous semipalmatus)verdin (Auriparus flaviceps)greater roadrunner (Geococcyx californianus) yellow-rumped warbler (Dendroica coronata) MAMMALSmourning dove (Zenaida macroura) yellow warbler (Dendroica petechia) racoon (Procyon lotor) (tracks)Inca dove (Columbia inca) Abert’s towhee (Pipilo aberti) coyote (Canis latrans) (tracks, scat)Gambel’s quail (Callipepla gambelii) Bell’s vireo (Vireo belli) black-tailed jackrabbit (Lepus californicus)osprey (Pandion haliaetus)Say’s phoebe (Sayornis saya)sharp-shinned hawk (Accipiter striatus) black phoebe (Sayornis nigricans) FISHESCooper’s hawk (Accipiter cooperi) red-winged blackbird (Agelaius phoeniceus) tilapia (species unknown)red-tailed hawk (Buteo jamaicensis) ruby-crowned kinglet (Regulus calendula) green sunfish (Lepomis cyanellus)great-horned owl (Bubo virginianus) lesser goldfinch (Carduelis psaltria) largemouth bass (Micropterus salmoides)American kestrel (Falco sparverius) northern cardinal (Carduelis cardinalis) common carp (Cyprinus carpio)northern harrier (Circus cyaneus) belted kingfisher (Ceryle alcyon) mosquit<strong>of</strong>ish (Gambusia affinis)