

Download Complete Issue (3090kb) - Academic Journals
Download Complete Issue (3090kb) - Academic Journals
Download Complete Issue (3090kb) - Academic Journals

Create successful ePaper yourself
Turn your PDF publications into a flip-book with our unique Google optimized e-Paper software.
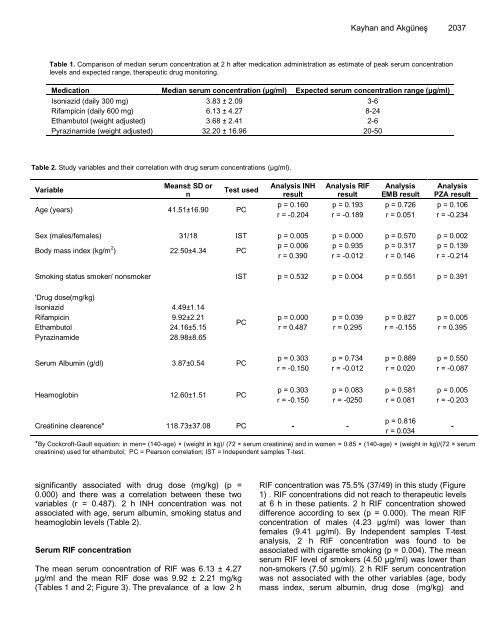
Kayhan and Akgüneş 2037<br />
Table 1. Comparison of median serum concentration at 2 h after medication administration as estimate of peak serum concentration<br />
levels and expected range, therapeutic drug monitoring.<br />
Medication Median serum concentration (µg/ml) Expected serum concentration range (µg/ml)<br />
Isoniazid (daily 300 mg) 3.83 ± 2.09 3-6<br />
Rifampicin (daily 600 mg) 6.13 ± 4.27 8-24<br />
Ethambutol (weight adjusted) 3.68 ± 2.41 2-6<br />
Pyrazinamide (weight adjusted) 32.20 ± 16.96 20-50<br />
Table 2. Study variables and their correlation with drug serum concentrations (µg/ml).<br />
Variable<br />
Means± SD or<br />
n<br />
Test used<br />
Age (years) 41.51±16.90 PC<br />
Analysis INH<br />
result<br />
p = 0.160<br />
r = -0.204<br />
Analysis RIF<br />
result<br />
p = 0.193<br />
r = -0.189<br />
Analysis<br />
EMB result<br />
p = 0.726<br />
r = 0.051<br />
Analysis<br />
PZA result<br />
p = 0.106<br />
r = -0.234<br />
Sex (males/females) 31/18 IST p = 0.005 p = 0.000 p = 0.570 p = 0.002<br />
Body mass index (kg/m 2 ) 22.50±4.34 PC<br />
p = 0.006<br />
r = 0.390<br />
p = 0.935<br />
r = -0.012<br />
p = 0.317<br />
r = 0.146<br />
p = 0.139<br />
r = -0.214<br />
Smoking status smoker/ nonsmoker IST p = 0.532 p = 0.004 p = 0.551 p = 0.391<br />
'Drug dose(mg/kg)<br />
Isoniazid 4.49±1.14<br />
Rifampicin 9.92±2.21<br />
Ethambutol 24.16±5.15<br />
Pyrazinamide 28.98±8.65<br />
Serum Albumin (g/dl) 3.87±0.54 PC<br />
Heamoglobin 12.60±1.51 PC<br />
PC<br />
p = 0.000<br />
r = 0.487<br />
p = 0.303<br />
r = -0.150<br />
p = 0.303<br />
r = -0.150<br />
p = 0.039<br />
r = 0.295<br />
p = 0.734<br />
r = -0.012<br />
p = 0.083<br />
r = -0250<br />
Creatinine clearence* 118.73±37.08 PC - -<br />
p = 0.827<br />
r = -0.155<br />
p = 0.889<br />
r = 0.020<br />
p = 0.581<br />
r = 0.081<br />
p = 0.816<br />
r = 0.034<br />
p = 0.005<br />
r = 0.395<br />
p = 0.550<br />
r = -0.087<br />
p = 0.005<br />
r = -0.203<br />
*By Cockcroft-Gault equation: in men= (140-age) × (weight in kg)/ (72 × serum creatinine) and in women = 0.85 × (140-age) × (weight in kg)/(72 × serum<br />
creatinine) used for ethambutol; PC = Pearson correlation; IST = Independent samples T-test.<br />
significantly associated with drug dose (mg/kg) (p =<br />
0.000) and there was a correlation between these two<br />
variables (r = 0.487). 2 h INH concentration was not<br />
associated with age, serum albumin, smoking status and<br />
heamoglobin levels (Table 2).<br />
Serum RIF concentration<br />
The mean serum concentration of RIF was 6.13 ± 4.27<br />
µg/ml and the mean RIF dose was 9.92 ± 2.21 mg/kg<br />
(Tables 1 and 2; Figure 3). The prevalance of a low 2 h<br />
RIF concentration was 75.5% (37/49) in this study (Figure<br />
1) . RIF concentrations did not reach to therapeutic levels<br />
at 6 h in these patients. 2 h RIF concentration showed<br />
difference according to sex (p = 0.000). The mean RIF<br />
concentration of males (4.23 µg/ml) was lower than<br />
females (9.41 µg/ml). By Independent samples T-test<br />
analysis, 2 h RIF concentration was found to be<br />
associated with cigarette smoking (p = 0.004). The mean<br />
serum RIF level of smokers (4.50 µg/ml) was lower than<br />
non-smokers (7.50 µg/ml). 2 h RIF serum concentration<br />
was not associated with the other variables (age, body<br />
mass index, serum albumin, drug dose (mg/kg) and<br />
-


