

Download Complete Issue (3090kb) - Academic Journals
Download Complete Issue (3090kb) - Academic Journals
Download Complete Issue (3090kb) - Academic Journals

You also want an ePaper? Increase the reach of your titles
YUMPU automatically turns print PDFs into web optimized ePapers that Google loves.
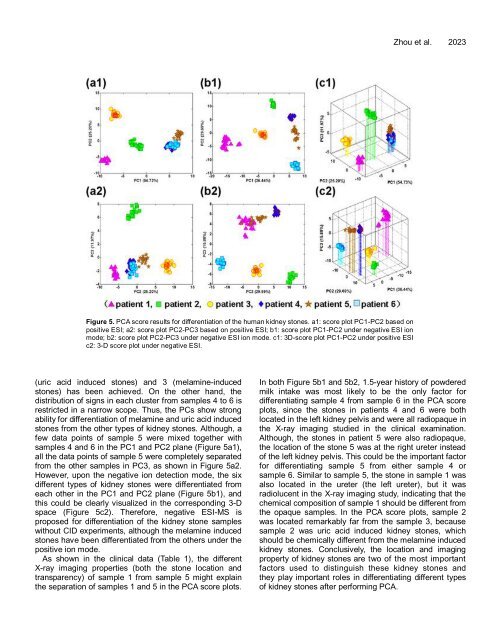
Figure 5. PCA score results for differentiation of the human kidney stones. a1: score plot PC1-PC2 based on<br />
positive ESI; a2: score plot PC2-PC3 based on positive ESI; b1: score plot PC1-PC2 under negative ESI ion<br />
mode; b2: score plot PC2-PC3 under negative ESI ion mode. c1: 3D-score plot PC1-PC2 under positive ESI<br />
c2: 3-D score plot under negative ESI.<br />
(uric acid induced stones) and 3 (melamine-induced<br />
stones) has been achieved. On the other hand, the<br />
distribution of signs in each cluster from samples 4 to 6 is<br />
restricted in a narrow scope. Thus, the PCs show strong<br />
ability for differentiation of melamine and uric acid induced<br />
stones from the other types of kidney stones. Although, a<br />
few data points of sample 5 were mixed together with<br />
samples 4 and 6 in the PC1 and PC2 plane (Figure 5a1),<br />
all the data points of sample 5 were completely separated<br />
from the other samples in PC3, as shown in Figure 5a2.<br />
However, upon the negative ion detection mode, the six<br />
different types of kidney stones were differentiated from<br />
each other in the PC1 and PC2 plane (Figure 5b1), and<br />
this could be clearly visualized in the corresponding 3-D<br />
space (Figure 5c2). Therefore, negative ESI-MS is<br />
proposed for differentiation of the kidney stone samples<br />
without CID experiments, although the melamine induced<br />
stones have been differentiated from the others under the<br />
positive ion mode.<br />
As shown in the clinical data (Table 1), the different<br />
X-ray imaging properties (both the stone location and<br />
transparency) of sample 1 from sample 5 might explain<br />
the separation of samples 1 and 5 in the PCA score plots.<br />
Zhou et al. 2023<br />
In both Figure 5b1 and 5b2, 1.5-year history of powdered<br />
milk intake was most likely to be the only factor for<br />
differentiating sample 4 from sample 6 in the PCA score<br />
plots, since the stones in patients 4 and 6 were both<br />
located in the left kidney pelvis and were all radiopaque in<br />
the X-ray imaging studied in the clinical examination.<br />
Although, the stones in patient 5 were also radiopaque,<br />
the location of the stone 5 was at the right ureter instead<br />
of the left kidney pelvis. This could be the important factor<br />
for differentiating sample 5 from either sample 4 or<br />
sample 6. Similar to sample 5, the stone in sample 1 was<br />
also located in the ureter (the left ureter), but it was<br />
radiolucent in the X-ray imaging study, indicating that the<br />
chemical composition of sample 1 should be different from<br />
the opaque samples. In the PCA score plots, sample 2<br />
was located remarkably far from the sample 3, because<br />
sample 2 was uric acid induced kidney stones, which<br />
should be chemically different from the melamine induced<br />
kidney stones. Conclusively, the location and imaging<br />
property of kidney stones are two of the most important<br />
factors used to distinguish these kidney stones and<br />
they play important roles in differentiating different types<br />
of kidney stones after performing PCA.


